
Abstract
Autonomous Rendezvous and Docking maneuvers, performed by two spacecraft joining together in space, are becoming increasingly automated. However, human supervision of the docking spacecraft remains necessary for system failure mitigation, which manifests in manual takeover of the docking spacecraft’s motion control. Previous analysis found that intrinsic characteristics of the motion plans taken by the spacecraft significantly influenced human supervisor manual-takeover performance. This work analyzes how the human supervisor’s observation of the spacecraft’s path traversal compared to the participant’s expectation of path traversal. In this study, participants (N = 33) monitored a simulation of an autonomous spacecraft attempting to dock at one of two docking stations. Participants were asked about their interpretation of the appropriateness of the path taken by the spacecraft in each trial. Statistically significant relationships were identified between intrinsic characteristics of the motion plan, the human supervisor’s takeover performance, and the human’s interpretation of the path taken.
Keywords
Introduction
As space operations extend past lunar orbit and on to Mars, crews will depend more on automated technology to perform tasks as time delays limit the real-time support mission control can provide. The consequences of improper human-systems integration in space applications have been identified as high-risk for adverse outcomes if not mitigated (Buckland et al., 2022). Automated systems excel in performing low-level operational tasks such as actuator control, freeing up cognitive resources for the human to perform complex task analysis and decision-making. However, autonomous technology is not perfect, and the human is often responsible for failure mitigation, or intervening in autonomous system tasks when system failure is observed (Sarter et al., 1997). Autonomous Rendezvous and Docking (ARD) maneuvers are integral to successful missions in space since they are required for any crew and/or resource exchanges for sustaining operations. In ARD tasks, a chaser spacecraft (referred to as an agent in this work) and a target spacecraft join together in space utilizing varied navigation and control strategies. Modern spacecraft systems, such as the SpaceX Dragon spacecraft, have become more automated, but still require continuous real-time monitoring by the human supervisor and intervention in failure scenarios. The role of the human supervisor as a fail-safe must be carefully considered since it can create unintended consequences for the human’s cognitive workload (Sarter et al., 1997).
A supervisor’s situation awareness is influenced by their perception of the elements in their environment (Endsley, 1995). In tasks that require the human to supervise an automated agent, situation awareness can be influenced by the real-time observations of the agent’s motion through space, which influences the human’s decision-making. An autonomous agent’s motion plan, which includes the coordinates making up a path generated by the agent to track through space, conveys information about the agent’s current and future status to a monitoring supervisor. The concept of motion plan legibility characterizes the intent-expression of an autonomous agent’s motion plan, or how well an observer correctly infers the path’s goal state from real-time observations (Dragan et al., 2013). In ARD applications, legibility can be operationalized as the distance from the dock when the user initiates manual takeover. The effectiveness of a docking path’s goal expression was observed to be influenced by the path’s initial condition, shape characteristics, and the agent’s orientation while tracking the path (Larson & Stirling, 2024).
In addition to considering how intrinsic path characteristics influence takeover performance, it is also important to consider how path characteristics align with the supervisor’s expectations of the agent’s motion regardless of takeover need. Understanding how the observations of agent motion align with expectations has consequences for the overall mental load of the astronaut. If automation performance does not align with monitor expectations, trust in the system’s effectiveness can become miscalibrated (Lee & See, 2004). Divergence from expectations of the system could lead to system disuse or scenarios where the monitor takes over unnecessarily. Understanding how path characteristics align with user expectations can foster calibrated trust by informing motion plan generators and training strategies for monitors of these systems.
This study investigated a possible relationship between motion plan factors and the supervisor’s expectations of the agent’s motion utilizing a Virtual Reality (VR) based space simulation. Participants monitored a variety of docking maneuvers with different path characteristics that were characterized by Legibility and a measure of path curvature, defined as the Deviation Score. Participants reflected on their impression of the motion plan quality for the dock approached. We hypothesize that (1) an increase in Deviation Score will result in motion that does not align with participant expectations, (2) Legible paths will correlate to paths that align with participant expectations, and (3) Deviation Score and Legibility are correlated path factors. This analysis provides insight into the supervisor’s interpretation of the path as informed by their mental model, which can inform motion plan design and selection in autonomous systems.
Methods
Participants
Participants provided written informed consent approved by the University of Michigan Institutional Review Board (HUM00219137). Participants (N = 33 participants; 20 male, 13 female; mean age of 27.3, SD = 7.2) performed the experiment. Participants were required to have no self-reported audio, neuro-vestibular, or corrected visual limitations. Additional requirements included no self-reported epilepsy, vestibular disease, screen-induced headaches or migraines, dizziness, vertigo, nausea, or complications of the head or neck that could be exacerbated by wearing a VR headset.
Simulation Environment
The simulation immersed participants in a space environment in which the participant monitored the motion of an autonomous agent docking on a space station (Figure 1). Ninety-two total paths (47 to red dock and 47 to green dock) were generated using a state-lattice approach (McNaughton et al., 2011), an optimization-based algorithm that produced continuous polynomial spline functions connecting pre-defined state nodes (Larson & Stirling, 2024). Each path was characterized by its Initial Condition (three initial conditions labeled in Figure 2) and its Path Category, which could be lateral, medial, or central. The path’s category represents the direction of orientation change of the agent when it leaves the initial condition. A central path (illustrated in black in Figure 2) divides lateral from medial paths. Lateral paths (illustrated in cyan in Figure 2) induce a negative change in spatial orientation in the agent (counter-clockwise motion) from the agent’s initial orientation at the beginning of path traversal. While the agent’s orientation change will become positive in later the path, it is negative right off of the initial condition in lateral paths. Conversely, medial paths (illustrated in purple in Figure 2) induce a positive change in orientation in the agent (clockwise motion) from the initial orientation of the agent at the initial condition.
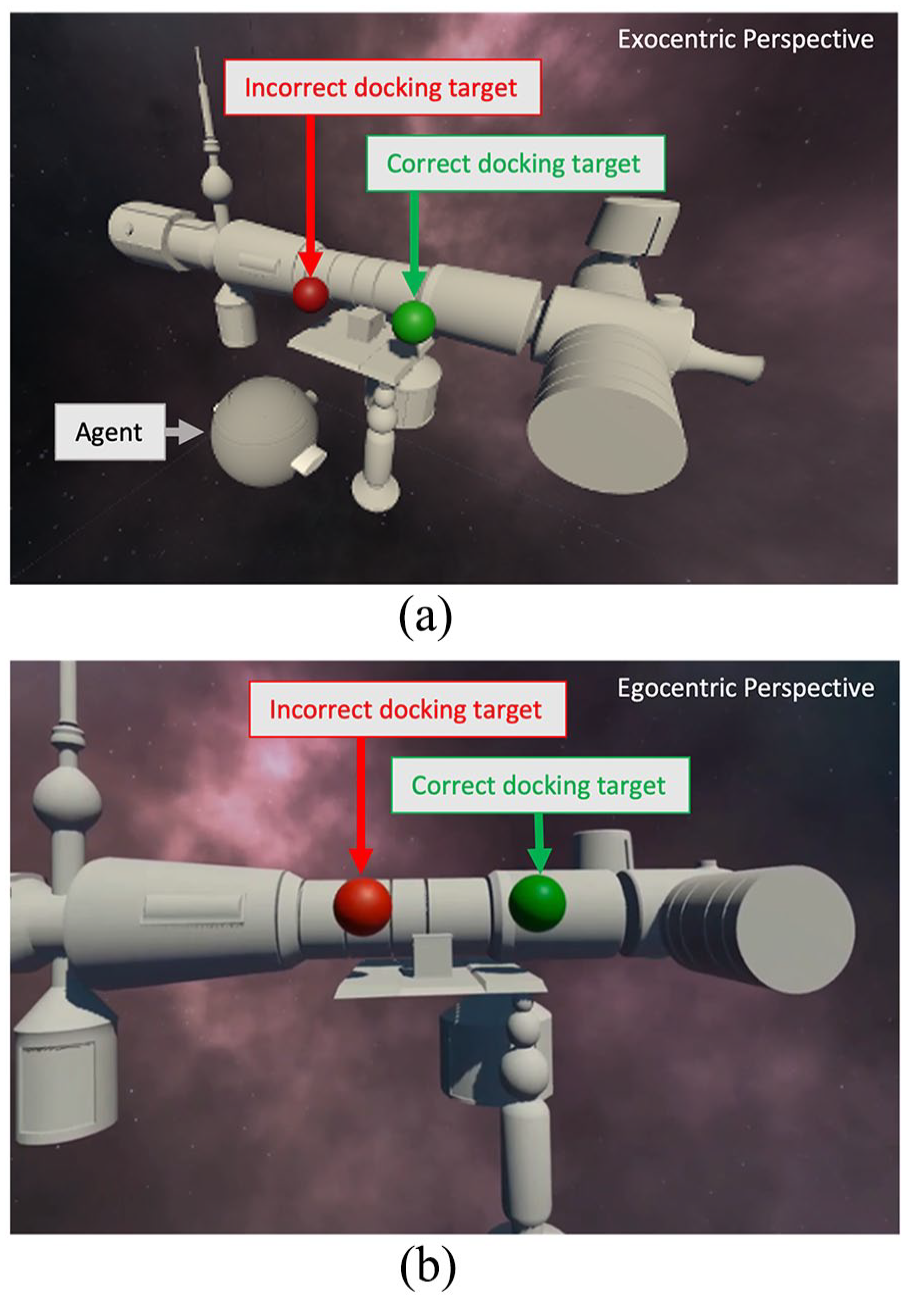
(a) Simulated space environment where participants monitored an autonomous agent docking at one of two targets (exocentric perspective) (b) Egocentric perspective that the participants experienced while observing docking maneuvers in real time.
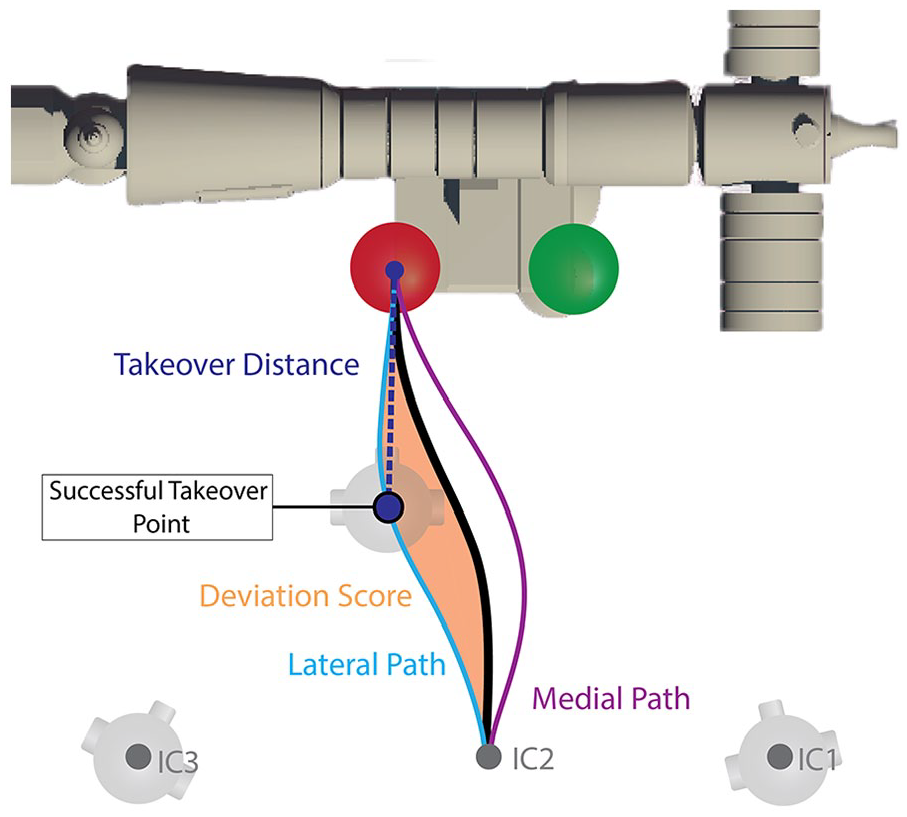
Schematic depicting Lateral (cyan), Medial (purple), and Central (black) path examples as well as Takeover Distance (dashed navy line) and Deviation Score (orange) metrics. Takeover distance is the norm distance between the takeover point and the red dock. The Deviation Score is the area of the polygon shape created between the Central path and the path being analyzed (in this example the Lateral path). All path Deviation Scores are normalized by the corresponding Central Path for analysis. The three initial conditions (IC1, IC2, and IC3) are also illustrated to show their positions relative to other simulation elements.
In each trial, the agent traversed a pre-determined motion plan. The agent would autonomously dock at one of two docking stations while the participant observed the docking maneuvers in real-time from the egocentric perspective (Figure 1b). Participants were not made aware of which dock the agent was targeting in each trial and had to infer the docking target from observing the agent’s docking motion. They were instructed to allow the agent to complete its docking maneuver autonomously (with no intervention from the participant) if the participant inferred the agent’s target was the green dock. If the participant inferred that it was targeting the red dock, they were instructed to engage a manual takeover mode, which stopped the agent from moving and ended the trial. Participants were not required to correct a maneuver in which they asserted manual takeover, only identify the necessity and engage manual takeover mode.
Each trial could result in one of five outcomes—successful dock, incorrect dock, successful takeover, unnecessary takeover, and late takeover. A successful dock was one in which the agent docked at the green target and the participant did not interfere with the maneuver. An incorrect dock was one in which the participant failed to initiate takeover and the agent docked at the red dock. A successful takeover was one in which the participant correctly inferred that the agent was targeting the red dock, and the participant initiated the manual takeover mode an appropriate distance from the dock. An unnecessary takeover was one in which the agent was targeting the green dock, but the participant incorrectly inferred the agent to be targeting the red dock and initiated manual takeover unnecessarily. Late takeovers were trials in which the participant initiated manual takeover correctly, but the agent was too close to the red dock to feasibly correct its trajectory to end at the green dock if corrective maneuvers were performed. Each trial outcome was assigned a score, and participants sought to maximize their overall score. Details on scoring for each trial outcome can be found in (Larson & Stirling, 2024).
At the end of every trial, participants were presented on-screen with the same yes/no prompt: “Was this an appropriate trajectory?.” This prompt was meant to encourage the participant to consider if the motion they observed aligned with their expectations of an appropriate maneuver. In experimental training, participants were instructed to answer the question based on their own impression of the motion regardless of the target dock. In other words, a path that required takeover could still be considered appropriate by the participant, even though it did not target the correct dock, because certain intrinsic properties of the path might have been considered appropriate for a docking maneuver to the location it was headed.
Experimental Procedure
Before the participants put on the headset, they were instructed on their experimental task and given multiple examples of each potential experimental trial outcome to observe in presentation format. After fitting the headset to each participant to minimize discomfort, participants took part in a training module and validation procedure to ensure they had proper knowledge of the headset controls and game rules. All participants passed the validation module on first attempt. Once validation was complete, participants monitored the experimental trial docking maneuvers. The experiment was self-paced and participants were allowed to take breaks at any time outside of planned breaks, if desired. While participants had no prior knowledge of the agent’s target dock in each trial, 50% of the trials targeted the green dock while the other 50% targeted the red dock. While a 50% failure rate is highly unlikely for this system, it was chosen to produce a relevant sample size of manual takeovers to analyze the hypotheses presented.
Experimental Metrics and Data Analysis
For this analysis, we calculate Callout Rate, path Legibility, and Deviation Score. The Callout Rate metric was calculated for each path by dividing the number of times a participant answered “no” to the aforementioned callout prompt normalized by the number of times the path was encountered. Therefore paths with high Callout Rates were paths where more participants answered “no” to the prompt on path appropriateness while lower Callout Rates were paths where more participants answered “yes” to the prompt.
Legibility was defined by a path’s mean Takeover Distance, which is the average of the two-norm distance between each takeover point and the red dock on that path (a single takeover point’s takeover distance is illustrated as the dashed line in Figure 2). A path with high mean Takeover Distance is a path with high Legibility because participants were able to correctly infer the path target earlier in path traversal (farther away from the red dock). A path with low mean Takeover Distance is a path with lower Legibility because the participant had to travel more of the path, getting closer to the red dock, to correctly determine the target. A detailed analysis of how Legibility is calculated from the Takeover Distance data can be found in (Larson & Stirling, 2024).
Deviation Score measured a path’s spatial deviation from its central path. For each lateral and medial path, a polygon shape was constructed using the points of the path with initial and final conditions (illustrated in orange in Figure 2). The Deviation Score of the path is the area of the polygon generated normalized by the arclength magnitude of the corresponding central path.
Spearman and Pearson Correlations were performed between the Deviation Score and Callout Rate for all paths to identify if there was a linear and monotonic relationship. A linear regression model was fit to the Callout Rate data using predictors of Deviation Score, Initial Condition, and Path Category to identify path factors that could be predictors of Callout Rate. For the following analyses regarding Legibility, a subset of paths (47 of the 92) were used, as Legibility was defined only for paths targeting the red dock since Takeover Distance was defined with respect to the red dock. Correlations for Legibility and Callout Rate were performed. A linear regression model was fit to the Callout Rate data using predictors of Legibility, Initial Condition, and Path Category to identify path factors that could be predictors of Callout Rate. Lastly, correlations were performed for Legibility and Deviation Score data.
Results
A total of 5,858 docking trials were performed and analyzed. Of the trials, 49.45% ended in successful takeovers, 48.98% ended in successful docking, 1.13% resulted in unnecessary takeovers, and 0.41% resulted in late takeovers. Only two trials (<0.01%) resulted in incorrect docking maneuvers, where the participant allowed the agent to dock at the red dock
without any intervention. In both trials, the participants commented on a lapse in attention (i.e., “zoning out”) as the reasoning for this error.
There was a statistically significant moderate monotonic and linear correlation between the path’s Deviation Score and Callout Rate, with a Spearman’s rank correlation coefficient of .47 (p < .001) and Pearson correlation coefficient of .55 (p < .001) (Figure 3). As Deviation Score of a path increased, the Callout Rate of the path also increased. When considering the additional factors of Initial Condition and Path Category, the linear mixed effects model (R2 = 0.71) supported that the interaction of Initial Condition 2 with Deviation Score led to an increased Callout Rate (coeff. est. = 0.14, SE = 0.06, DF = 62, p = .03) compared to Initial Condition 1 as the Deviation score increased.
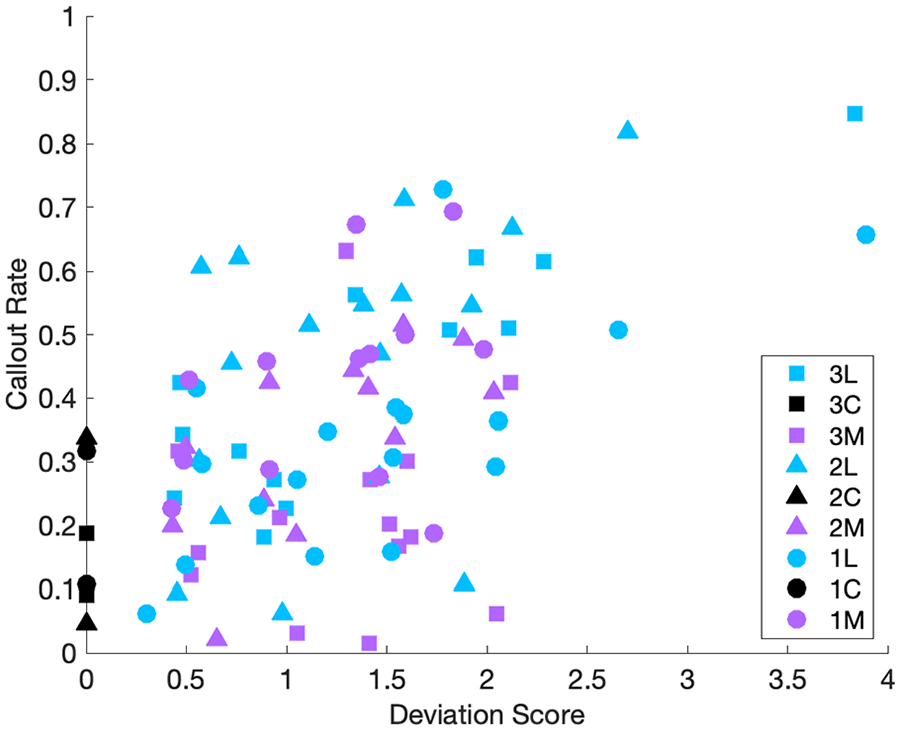
Deviation Score of each path plotted against the Callout Rate of each path. All 92 paths (whether they targeted the red or green dock) were included. IC1 paths are illustrated with circles, IC2 paths with triangles, and IC3 paths with squares. Lateral paths are shown in cyan, central paths in black, and medial paths in purple. Thus “3L” represents IC3 lateral, “2C” represents IC2 central, “1M” represents IC1 medial, etc.
There was a statistically significant moderate monotonic and linear correlation between the path’s Legibility and Callout Rate, with a Spearman’s rank correlation coefficient of −.44 (p = .002) and Pearson correlation coefficient of −.47 (p < .001) (Figure 4). As path Legibility increased, the Callout Rate of the path decreased. When considering additional factors of Initial Condition and Path Category, the linear mixed effects model (R2 = 0.52) supported that the interaction of legibility with IC2 (coeff. est.= −0.37, SE = 0.12, DF = 32, p = .004) and IC3 (coeff. est.= −0.30, SE = 0.13, DF = 32, p = .03) each led to sharper decreases in Callout Rate compared to IC1 as legibility increased. Legibility interaction with medial path category (coeff. est.= −0.55, SE = 0.22, DF = 32, p = .02) also led to a sharper decrease in Callout Rate compared to the lateral path category as legibility increased.
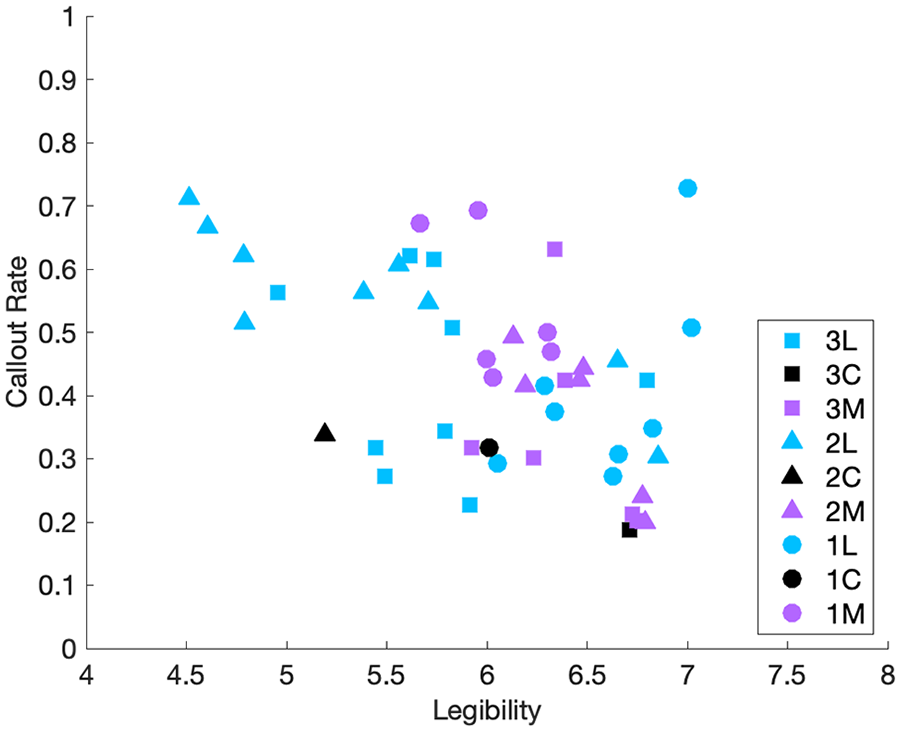
Legibility of paths plotted against Callout Rate of paths. Legibility metric is only calculated for paths where successful takeovers occurred, so only paths targeting the red dock (47 paths) are included in this plot.
There was no statistically significant monotonic nor linear correlation between the path’s Deviation Score and its Legibility, with a Spearman’s rank correlation coefficient of −.07 (p = .65) and Pearson correlation coefficient of −.04 (p = .79) (Figure 5). This finding indicates that there was no observed relationship between deviation score and legibility as defined by this study and task.
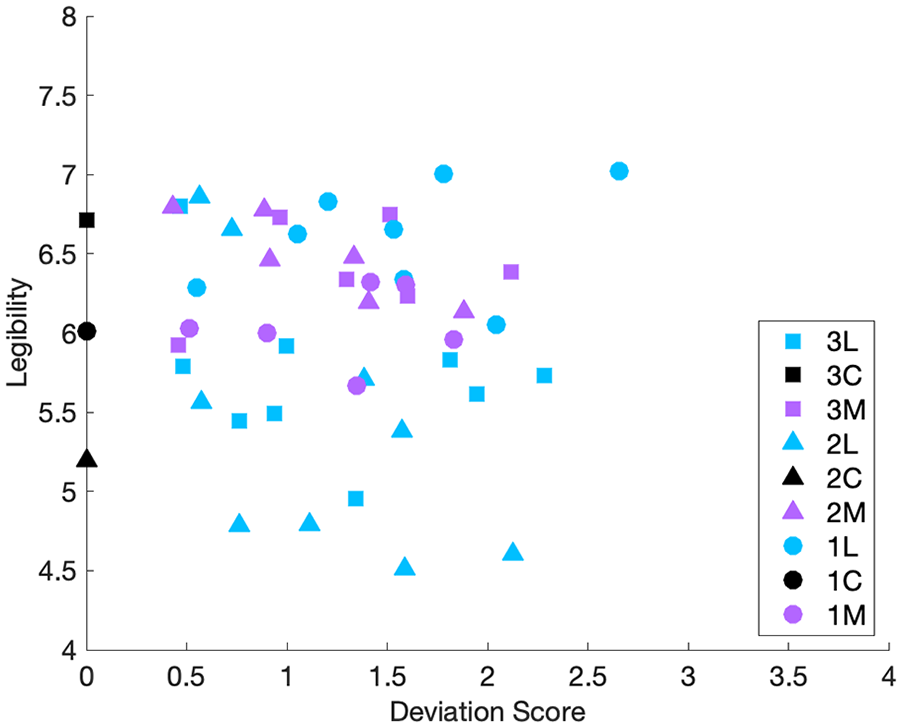
Deviation Score of paths plotted against legibility of paths. Legibility metric is only calculated for paths where successful takeovers occurred, so only paths targeting the red dock are included in this plot.
Discussion
This work sought to understand if autonomous motion plan characteristics influence the monitor’s impression of appropriateness of the maneuver for the dock approached, separate from the correctness of the final dock location. We first hypothesized that a larger path Deviation Score would correlate to increased Callout Rate, meaning paths with larger Deviation Score would not align with participant’s expectations of an appropriate path. Secondly, we hypothesized that an increase in path Legiblity would lead to a lower Callout Rate for the path, indicating that paths with higher Legibility align with participant perceptions of an appropriate maneuver. Lastly, we hypothesized that there may be a correlation between the Deviation Score of the path and the Legibility of the path.
The results support our first hypothesis as there was a statistically significant moderate increase in path Callout Rate with path Deviation Score. The correlation indicates that paths with larger deviations from the Central path were less aligned with participant expectations of appropriate motion for approaching a dock. The relationship was observed across Initial Conditions and was not influenced by Path Category, indicating that the magnitude of deviation from the Central Path was the primary indicator of participant’s impression of appropriateness of the path.
In Dragan et al. (2013), the authors formalized a mathematical definition of path Predictability, which characterizes how similar or dissimilar the traveled path is to the viewer’s expectation of the path. While not a direct measure of Predictability, Callout Rate gives insight into how well the path aligned with the viewer’s expectations. Predictable paths in the aforementioned study would be characterized as paths with lower Deviation Scores in our study. The correlation between Deviation Score and Callout Rate aligns with what we would expect from the construct of predictable paths as there was a greater alignment of agreement in a path trajectory for lower deviation scores when the goal was known (as Callout Rate was determined at the end of each trial). The correlation also suggests that when multiple solutions are available for a potential path, small deviations from a central path tendency should be considered when possible to support the human supervisor.
The second hypothesis was also supported by the data as there was a statistically significant moderate decrease in Callout Rate as Legibility of a path increased. This observation indicates that Legible paths, which allowed participants to take over control in a failure scenario earlier in path traversal, aligned with participant’s impressions of an appropriate path. Thus, a person’s perception of path acceptability was influenced by their underlying performance on the task for those paths that ended at the red dock.
The final hypothesis was not supported by the data as there was no statistically significant relationship between Deviation Score and Legibility. Therefore, these path factors influence monitor path perception independently of each other. This result supports that while Deviation Score influences Callout Rate, it does not affect how well the participant could infer the final point of the path from real-time observation. Deviation from a central tendency will affect the monitor’s impression of the motion, but it did not affect their performance in determining the path’s target in this task.
This study focused on a binary decision making task in an ARD scenario, but realistic docking scenarios are much more complex than a point-to-point motion plan constrained to two dimensions. Realistic docking maneuvers are also more time-intensive, requiring hours, whereas our trials were on the order of seconds. The task was simplified to analyze the decision-making of the monitor without additional tasks related to man-aging spacecraft control in orbit, docking axis alignment, and resources such as fuel. However, future work will explore the constraints on manual-takeover decision making when complexities related to spacecraft control in orbit and fuel resources are introduced to task performance.
Overall this work builds on previous work by giving more context into how intrinsic path design factors influence performance in ARD systems. A new path design variable, Deviation Score, was developed and analyzed against a metric that measured participant interpretation of autonomous agent motion (Callout Rate). A correlation between Deviation Score and Callout Rate was identified and contextualized with a correlation between Legibility and Callout Rate, and there was no relationship between Deviation Score and Legibility as operationalized for this study. Analysis showed that lower deviations of a path from a central trajectory and ability to takeover further from the dock both aligned with improved perceived appropriateness through the lower callout rates.
Footnotes
Declaration of Conflicting Interests
The author(s) declared no potential conflicts of interest with respect to the research, authorship, and/or publication of this article.
Funding
The author(s) disclosed receipt of the following financial support for the research, authorship, and/or publication of this article: This study was supported in part by the National Aeronautics and Space Administration (NASA) Human Research Program Award 80NSSC20K0409.