
Abstract
Humans are limited in their attentional capacity and miss salient cues when multitasking. We built a platform, ICUa (Integrated Cognitive User assistance) that simulates parts of MATBII, a computer-based multitasking testbed, adding gaze-based attention guidance in an attempt to improve multitasking performance. ICUa uses software agents for monitoring the interface, human behavior and eye gaze in order to guide attention (displaying highlights and arrows). We varied the difficulty of our testbed and found effects on human performance (based on error times) and characterized the types of errors that occurred with higher difficulty and how agent response changed. There was no clear effect of ICUa guidance on gaze patterns or human performance. The visual guidance we deployed may not be sufficient to measurably influence behavior. Future work will develop the detection eye gaze patterns and effective cues to redirect attention using this human-agent interface for experiments on attention guidance.
Introduction
Humans are limited in their attentional capacity and thus sample parts of their environment sequentially over time (Carrasco, 2011). When humans “fail to notice” it is because of suboptimal sampling. High information flow due to the number of displays, the rapid information change in displays and the dependence of information between displays challenges human attention limits (Matthews, 2006). In divided attention conditions within complex tasks, the phenomenon of cognitive tunneling, whereby attention is allocated solely to one task for a long period of time at the cost of performance on other tasks, and “misplaced salience”, where one task becomes more salient to the user than the task that requires attention, are observed (Bolstad et al., 2006).
The location and duration of eye fixations are informative of the locus and timing of user attention (Rayner, 1995). By monitoring the movements of the eye, we may uncover patterns in how attention is allocated. Eye tracking can be deployed with increasing flexibility in many environments (Tatler et al., 2019). Gaze patterns have been measured, for example, extensively in aviation c.f. (Ziv, 2016) to gain insight into user attention during multi-tasking and have potential for use in so called attention aware interfaces (Majaranta & Bulling, 2014). The aim of these interfaces is typically to estimate the overall demands on human attention, with a few examples of gaze-contingent implementations that aim to guide user attention (Ohneiser et al., 2019; Poitschke et al., 2009). A system harnessing the ability of software agents to monitor several tasks at once as well as user attention, obeying logical rules, is yet to be tested with human users and holds huge potential for human-in-the-loop automation.
We have built a platform, called ICUa (Integrated Cognitive User assistance), that tracks a user’s attention via eye tracking as they attempt to complete multiple tasks simultaneously. The ICUa decision framework uses fixation location as a proxy for spatial attention and attempts to nudge users to reallocate their limited cognitive resources when critical events occur that demand user intervention (Durant et al., 2022). ICUa simulates parts of the Multiple Attribute Task Battery (MATB; Comstock & Arnegard, 1992), a computer- based task designed to facilitate cognitive research in human multi-tasking (specifically, MATBII; Santiago-Espada et al., 2011), producing our own simple cockpit-based task space.
Each MATB task requires human intervention to remain in an acceptable state; that is, button presses and joystick movements to fix malfunctions, turn on/off resource flow, and track a target. The ICUa interface supports graphical annotation which provides visual guidance. In this work, guidance consists of a highlight around one of the tasks in the interface coupled with an arrow placed where the user is looking and pointing to the task that requires attention.
We conducted user experiments based on a novel framework for cognitive interfaces that treats interfaces as objects within a multi-agent environment; such objects are observed and manipulated by agents. The framework implementation, brings the following potential benefits: (a) agents monitor the state of the tasks and react to observations in real-time taking action that alters the interface to provide guidance, (b) user input and fixation locations are also monitored as a proxy for user attention to inform guidance, and (c) agent guidance is separate from the interface and task design, which eases experimentation and allows continuous adjustments to guidance behavior. Below we set out how we will evaluate this implementation.
(1) We first propose that by changing the frequency of events we can manipulate the difficulty of our interface and use this to measure the effect on human performance (a hypothesized increase in task failures) and also characterize within our setting the types of errors that occur at a higher difficulty level in performance and in terms of change in eye movement patterns.
(2) We then ask if the agents in our system change their behavior according to difficulty, based on the patterns of performance observed, demonstrating the functioning of our system, hypothesizing an increase in guidance displayed in a way that matches the change in failures.
(3) We ask if the guidance presented by the ICUa interface has any effect on overall eye tracking patterns or human performance measures. We test this with consideration of the possible effect guidance can have on human behavior based on results from part 1. We hypothesize a reduction in failure time and change in attention allocation patterns.
Methods
The ICUa System
The tasks we use are (Figure 1) – System monitoring: a single mouse click response to color changes in the top boxes or to center the scales (which displace randomly), Tracking (requiring arrow keyboard input to keep the heading centered whilst it drifts randomly), and Resource management (requiring the two top tanks to be kept at the level indicated, by the use of refill tanks and switching pumps on/off connecting them – these pumps turn red when they stop working). Failure for system monitoring and resource management tasks constitutes when these requirements are not met, for the tracking task going off center by 50 pixels. In our setup each of the tasks is monitored by a separate agent responsible for guiding the user if its task fails.
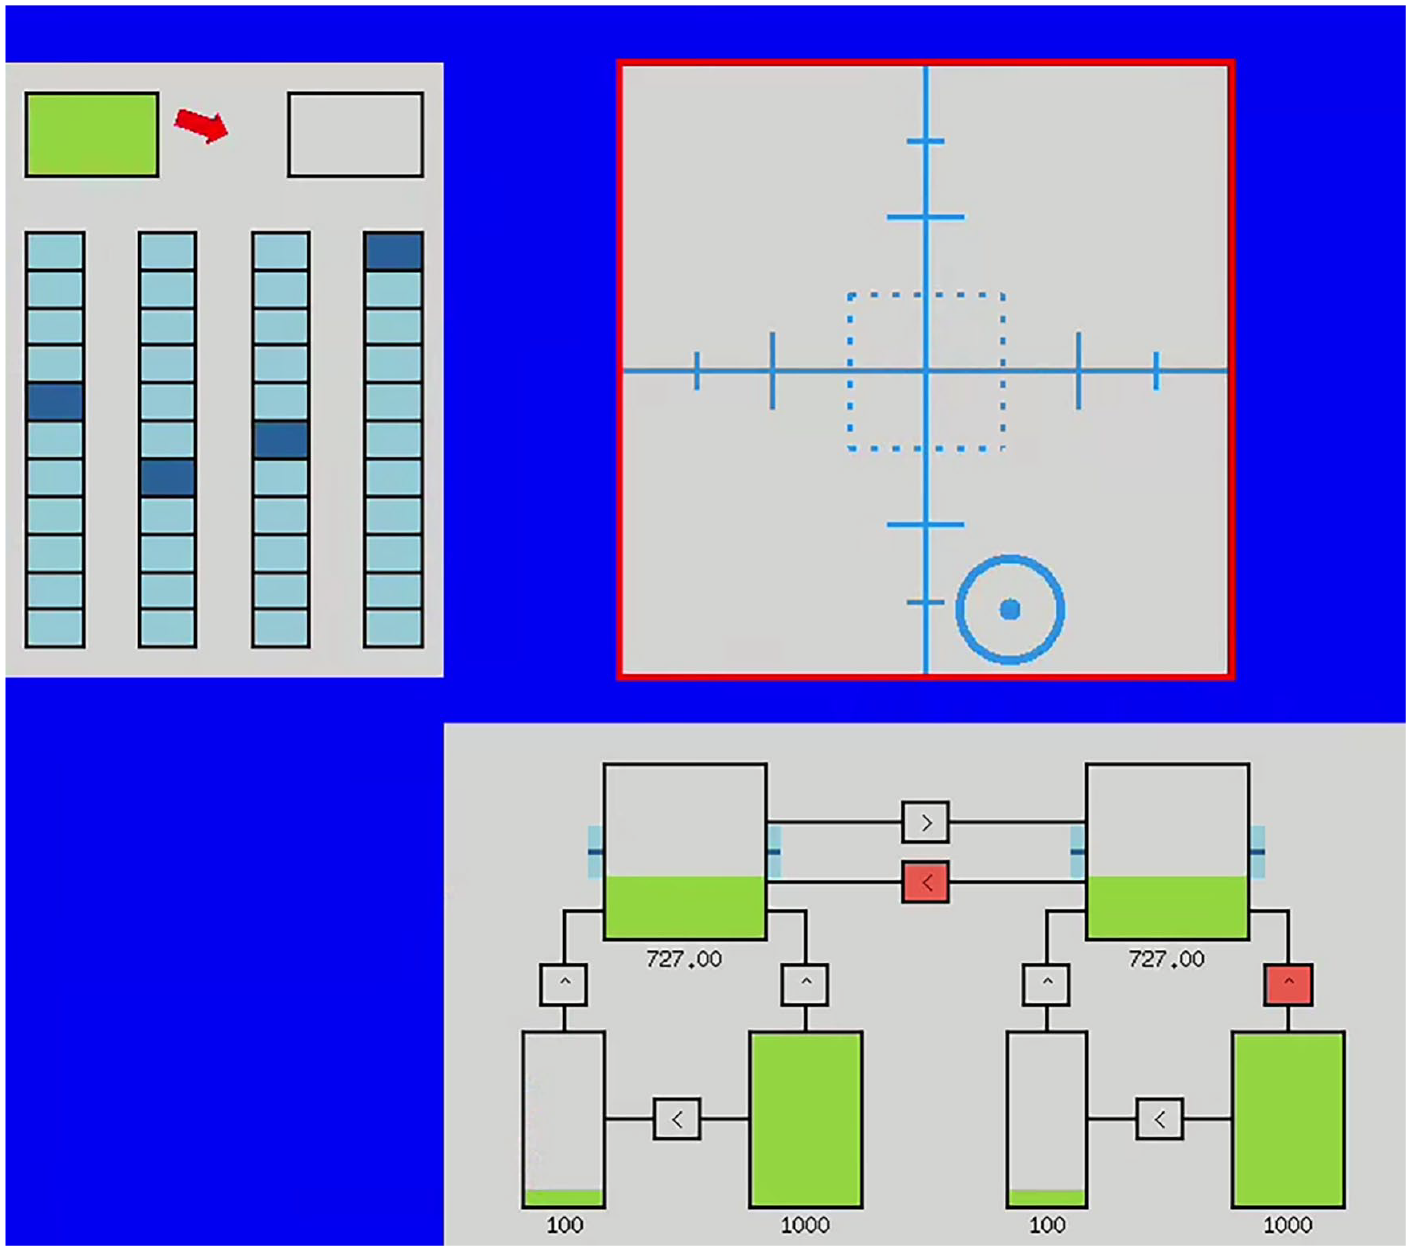
The ICUa interface with guidance displayed (the task in failure is highlighted when criteria are met, and a small red arrow appears at the gaze location pointing toward the task in failure). The tasks are from top left clockwise: system monitoring, tracking, resource management.
Guidance behavior is specified as a simple teleo-reactive (TR) program (Nilsson, 2001). A TR program is a set of condition-action rules repeatedly evaluated by an agent to produce goal-oriented decisions at each step of the simulation. The decision rules were designed to be as minimal as possible while considering how users may operate in a multi-task application. Guidance is only provided (1) after a 2 s grace period of failure (2) on one task at a time and (3) is removed if the person is looking (currently fixating) at the task in failure.
Eye tracking was sampled at 60 hz, smoothed using a moving average (±5 steps) and filtered online using an IV-T filter (velocity threshold = 200 pixels/s) to classify fixations. A more detailed description of the system can be found in (Durant et al., 2022). The experiment data, ICUa configuration files and analysis code can be found here https://github.com/dicelab-rhul/measuring-user-response-in-ICUa.
Participants, Experiment Design, and Analysis
We obtained a complete behavioral and eye tracking dataset from 12 consented participants and partial data (due to eye tracker failure after calibration) from the remaining 12 consented participants (total N = 24), a 2 (difficulty; easy, difficult) × 2 (guidance; with, without) within-subjects design. Participants (ages 19–50 mode = 21), 4 male, 20 female, with normal or corrected to normal eyesight, completed four, 3-min trials at a UK university. After a practice period (medium difficulty, no guidance; <10 min) and verbal understanding check, they were instructed that red highlights will appear if a task requires attention. After initial eye tracker calibration, the 2 × 2 factorial trials were completed in a randomized order, and participants provided their perceived difficulty rating after each trial (1–5, where 1 was very easy and 5 was very hard). The experimental protocol was approved by the Royal Holloway, University of London Research Ethics Committee. Participants were recruited via flyers and convenience sampling and received £5 reimbursement for the half hour of the experiment.
The difficulty configurations were set up as follows. Easy: system monitoring: lights switch every (30–60s), scales move every (60–120 s), tracking: move 1 pixel/0.1 s, resource management: level drops 5 units/s pumps fail every (30–60s), pumps reset after 3 s. Difficult: system monitoring: lights switch every (15 to 30s), scales move every (15–30s), tracking: move 3 pixel/0.1 s, resource management: level drops 15 units/s pumps fail every (30–60s), pumps reset after 3 s.
Results
Performance and Gaze Changes with Difficulty
We found, as expected, that the total time each task was in failure (Figure 2) was increased with difficulty, meaning a longer time to respond and more changes in states being missed (mean failure time easy: 66 s, difficult 171 s, paired t-test, t23 = 10.4, p < .0001, d = 2.13), note this was summing the time each task is in failure, including when several were in failure at once). On the easy setting 31% of the time at least one of the tasks was in error and in the difficult setting 67% of the time.
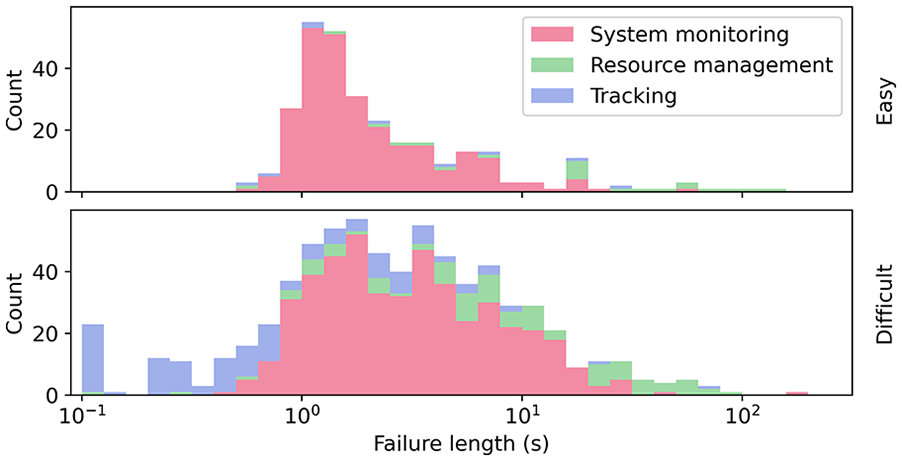
Stacked histogram of failure lengths (x-axis log scale) for each task over all 24 participants without guidance.
Participants also noticed the increase in difficulty (the ratings increased by 1.46 points, s.d. of differences 0.66 points, t23 = 9.91, p < .001, d = 2.02). Forty-nine percent of the failure lengths are longer than the 2 s grace period (Figure 2). It is these failures that attention guidance could potentially influence.
In a 3 (tasks) × 2 (difficulty) repeated measures ANOVA (after checking for normality) we tested mean differences over the total fixation durations (Figure 3). There is a main effect of task (F2,26 = 6.70, p < .05 (Greenhouse-Geisser corrected), ηp = 0.34), the system monitoring draws less fixation time. There is also a significant interaction (F2,26 = 17.6, p < .001, ηp = 0.57) and Bonferroni corrected post-hoc paired t-tests confirm the change in gaze patterns for the resource management and system monitoring tasks (Figure 3) (easy vs. difficult: resource management t13 = −4.17, p < .005, d = 8.89 system monitoring t13 = 7.80, p < .001, d = 5.88, tracking t13 = 0.46, p = .65).
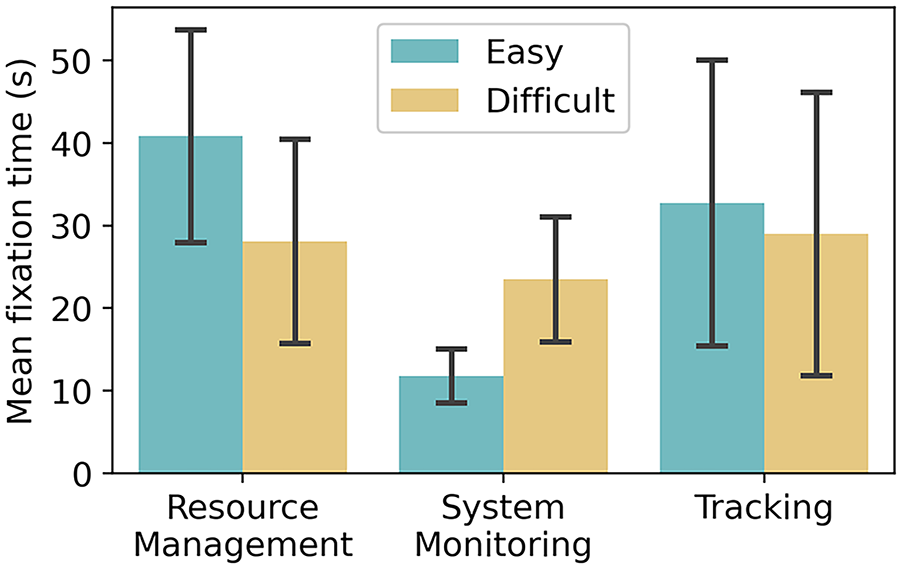
The mean total time spent fixating on each task over participants with eye tracking on these conditions (N = 14) without guidance.
Next, we considered how response and gaze behavior was linked with performance and found significant correlations (reported in Figure 4) with which task was fixated more, number of clicks, and number of gaze switches.
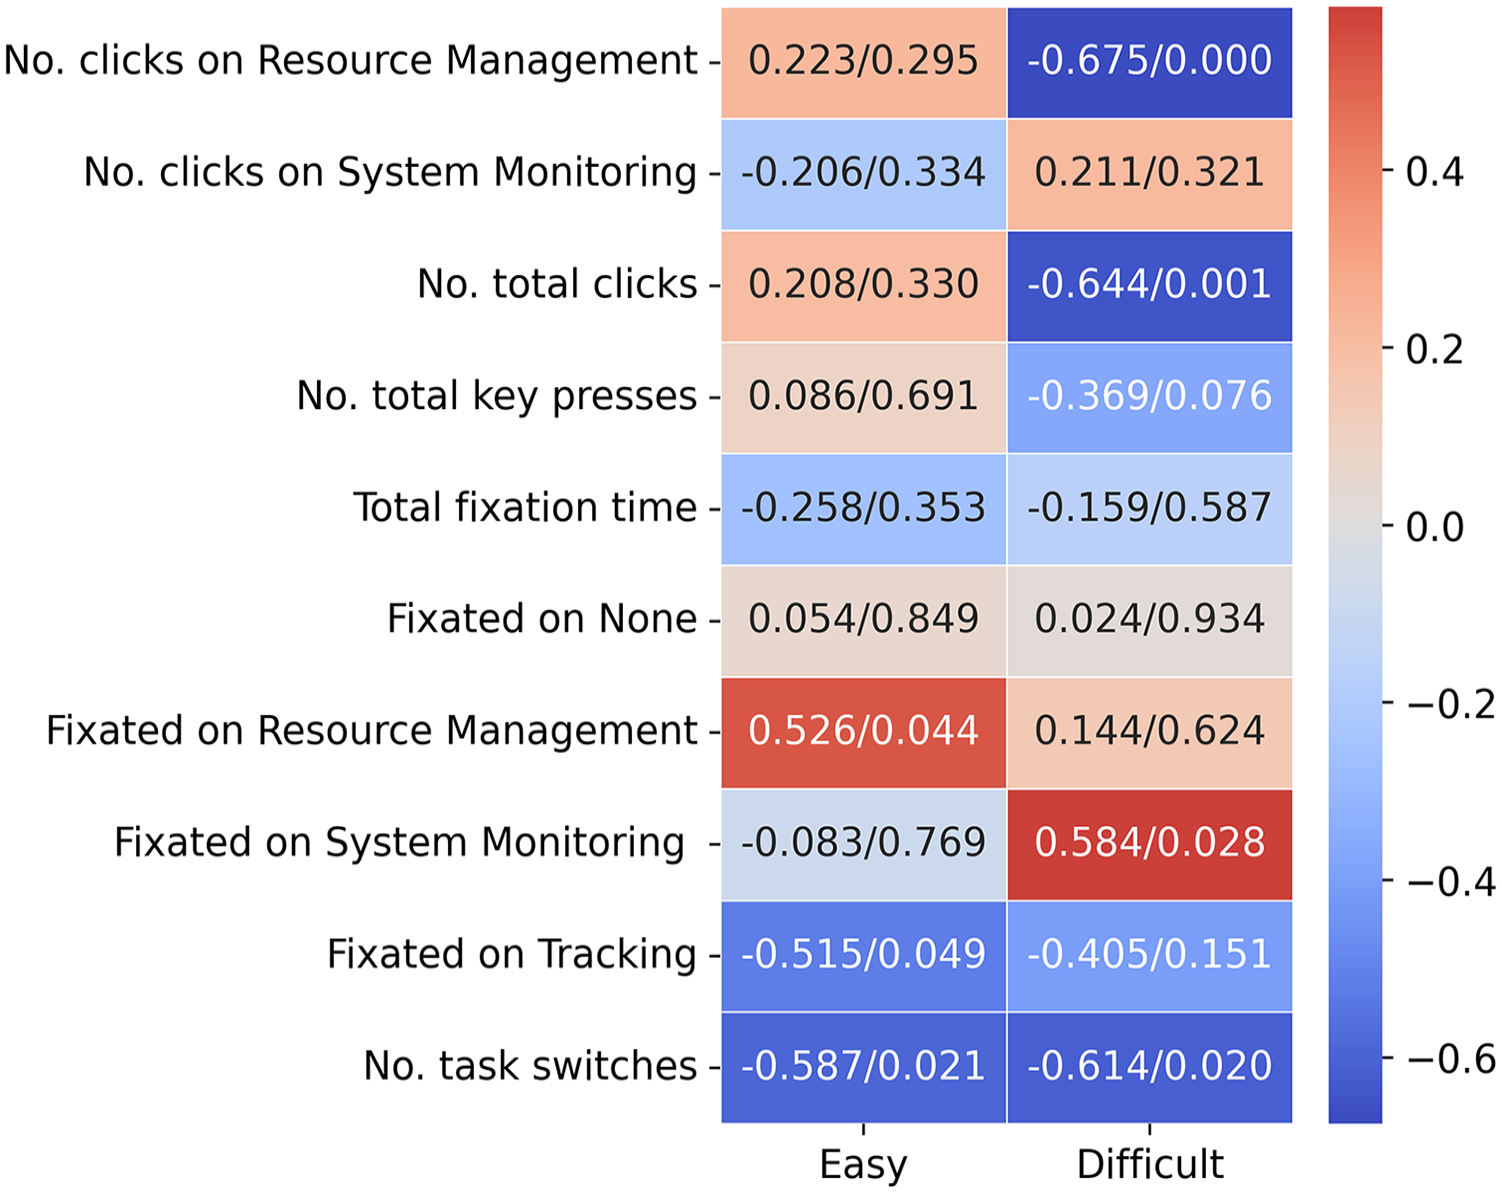
Pearson correlations (correlation/p-value) for total failure time on the trials without guidance, eye-tracking statistics were for N = 15 on easy and N = 14 on difficult (based on available eye tracking data), manual response statistics were computed for all 24 participants.
Agent Behavior
We then compared agent behavior for the subset of participants for whom agent attention guidance was implemented to test if our interface was working as expected based on the changes in performance observed above.
Guidance was displayed much more often in difficult conditions (see Figure 5). In the easy conditions, for some participants there were few instances of guidance. Guidance was shown primarily for system monitoring and resource management but appears less often in tracking.
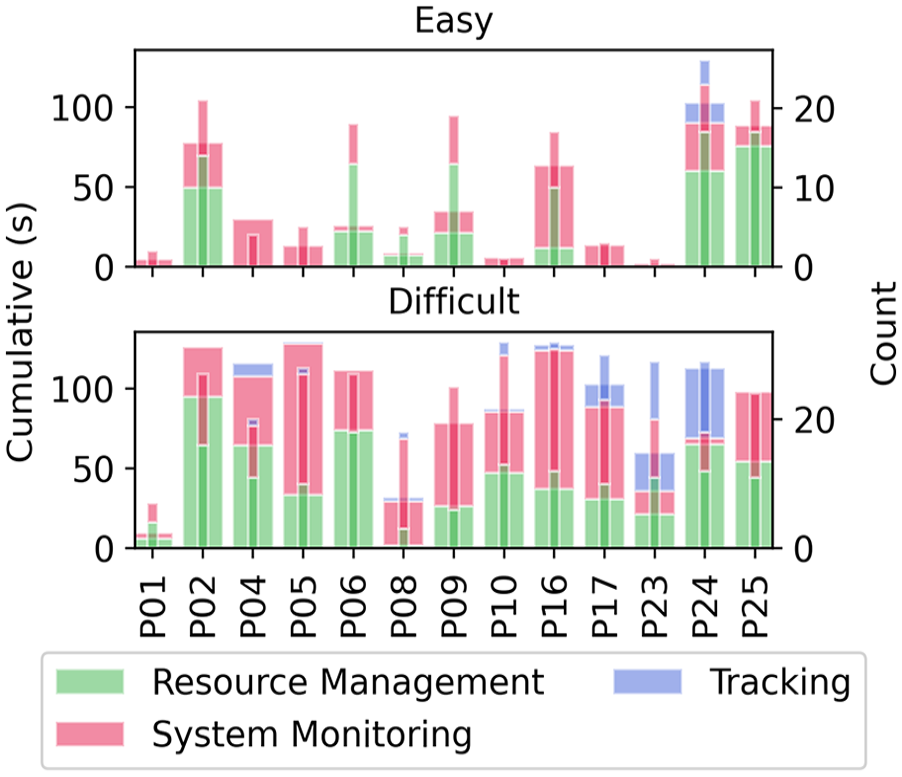
Amount of guidance shown on each task for each participant in easy and difficult conditions. The thick bar shows the cumulative (total) guidance shown and the thin bar shows the number of times guidance was displayed.
In the difficult condition, the average time guidance was displayed on the system monitoring task was 3.38 s, with a range between 0.1 s and 17.49 s. Average guidance on the resource management task was displayed for 4.07 s with a range between 0.11 and 19.14. This suggests that often the guidance was ignored (did not attract the gaze as this would cause the highlight to be switched off).
Effects of Guidance on User Performance and Behavior
We compared performance measures and eye tracking measures on the difficult conditions with and without agent guidance and did not find evidence of an effect due to guidance. There is a slight decrease in the mean length of total failure time when guidance is provided (considering failure lengths shown in Figure 6. <10 s) although this is not significant (N = 13; mean total failure length without agents: 72 s, with agents 67 s, t12 = 0.60, p = .56). Note this includes overlapping failure times across different tasks.
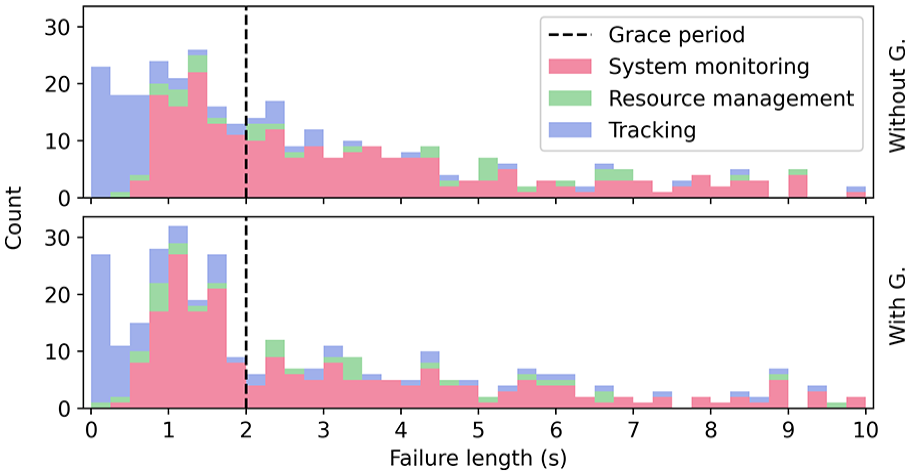
Stacked histogram of failure lengths for each task over (N = 13) who completed the guidance condition, comparing with/without guidance in the difficult condition.
We tested whether the difficult with/without guidance distributions differ using Mann-Whitney U test over failure lengths in the range [0.1, 10]s and this was not significant (U = 53346.5, p = .28).
We then went on to test if guidance had any effect on gaze patterns in the difficult condition. Below is the plot of mean total time fixated on tasks (Figure 7), we see that they remain the same. A repeated measures 3 (tasks) × 2 (with guidance/ without) ANOVA (after checking for normality) finds no main effect of task or an interaction (task F2,24 = 0.97, p = .39, interaction F1,24 = 0.13, p = .88).
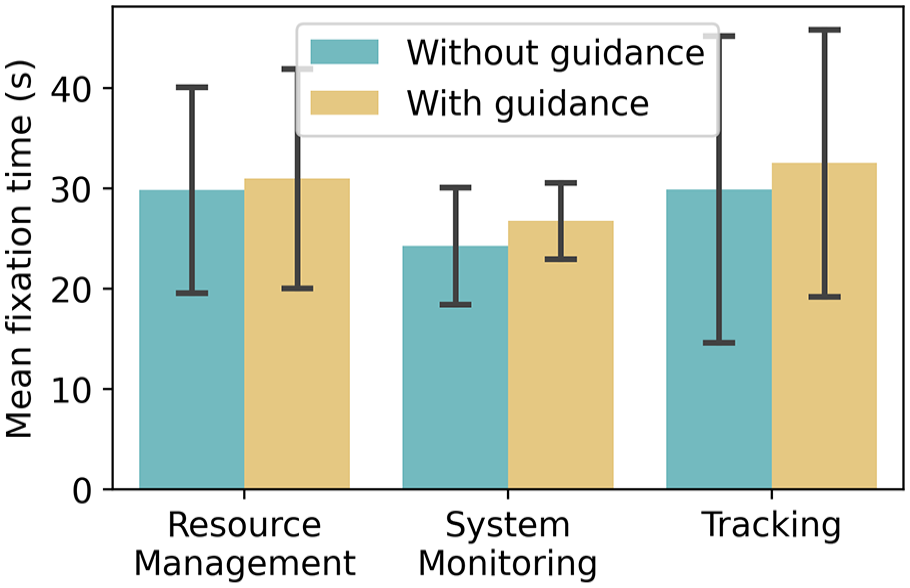
The mean total time spent fixated on each task over participants with eye tracking on these conditions (N = 13), with/without guidance in the difficult condition.
We also compared directly task switching (the gaze location moving from one task to another) during failure times (Figure 8). It is not clear that the guidance had any significant effect on moving attention toward the failing nodes. Testing for mean differences we compared the number of switches to a task in failure/the total number of switches while task was in failure, for system monitoring and resource management (we had data for N = 12), with a repeated measures 2 (tasks) × 2 (agents/without) ANOVA (after checking for normality). There is a main effect of task, but no effect of agents or an interaction (task F1,11 = 6.69, p < .05, agent/without F1,11 = 2.43, p = .15, interaction F1,11 = 1.18, p = .30). We see in Figure 8 that during the subset of failures that have guidance shown, participants tend to switch more often to the task. With agents during all failure time 30% of switches are to the task in failure, 43% during the time that guidance is also displayed.
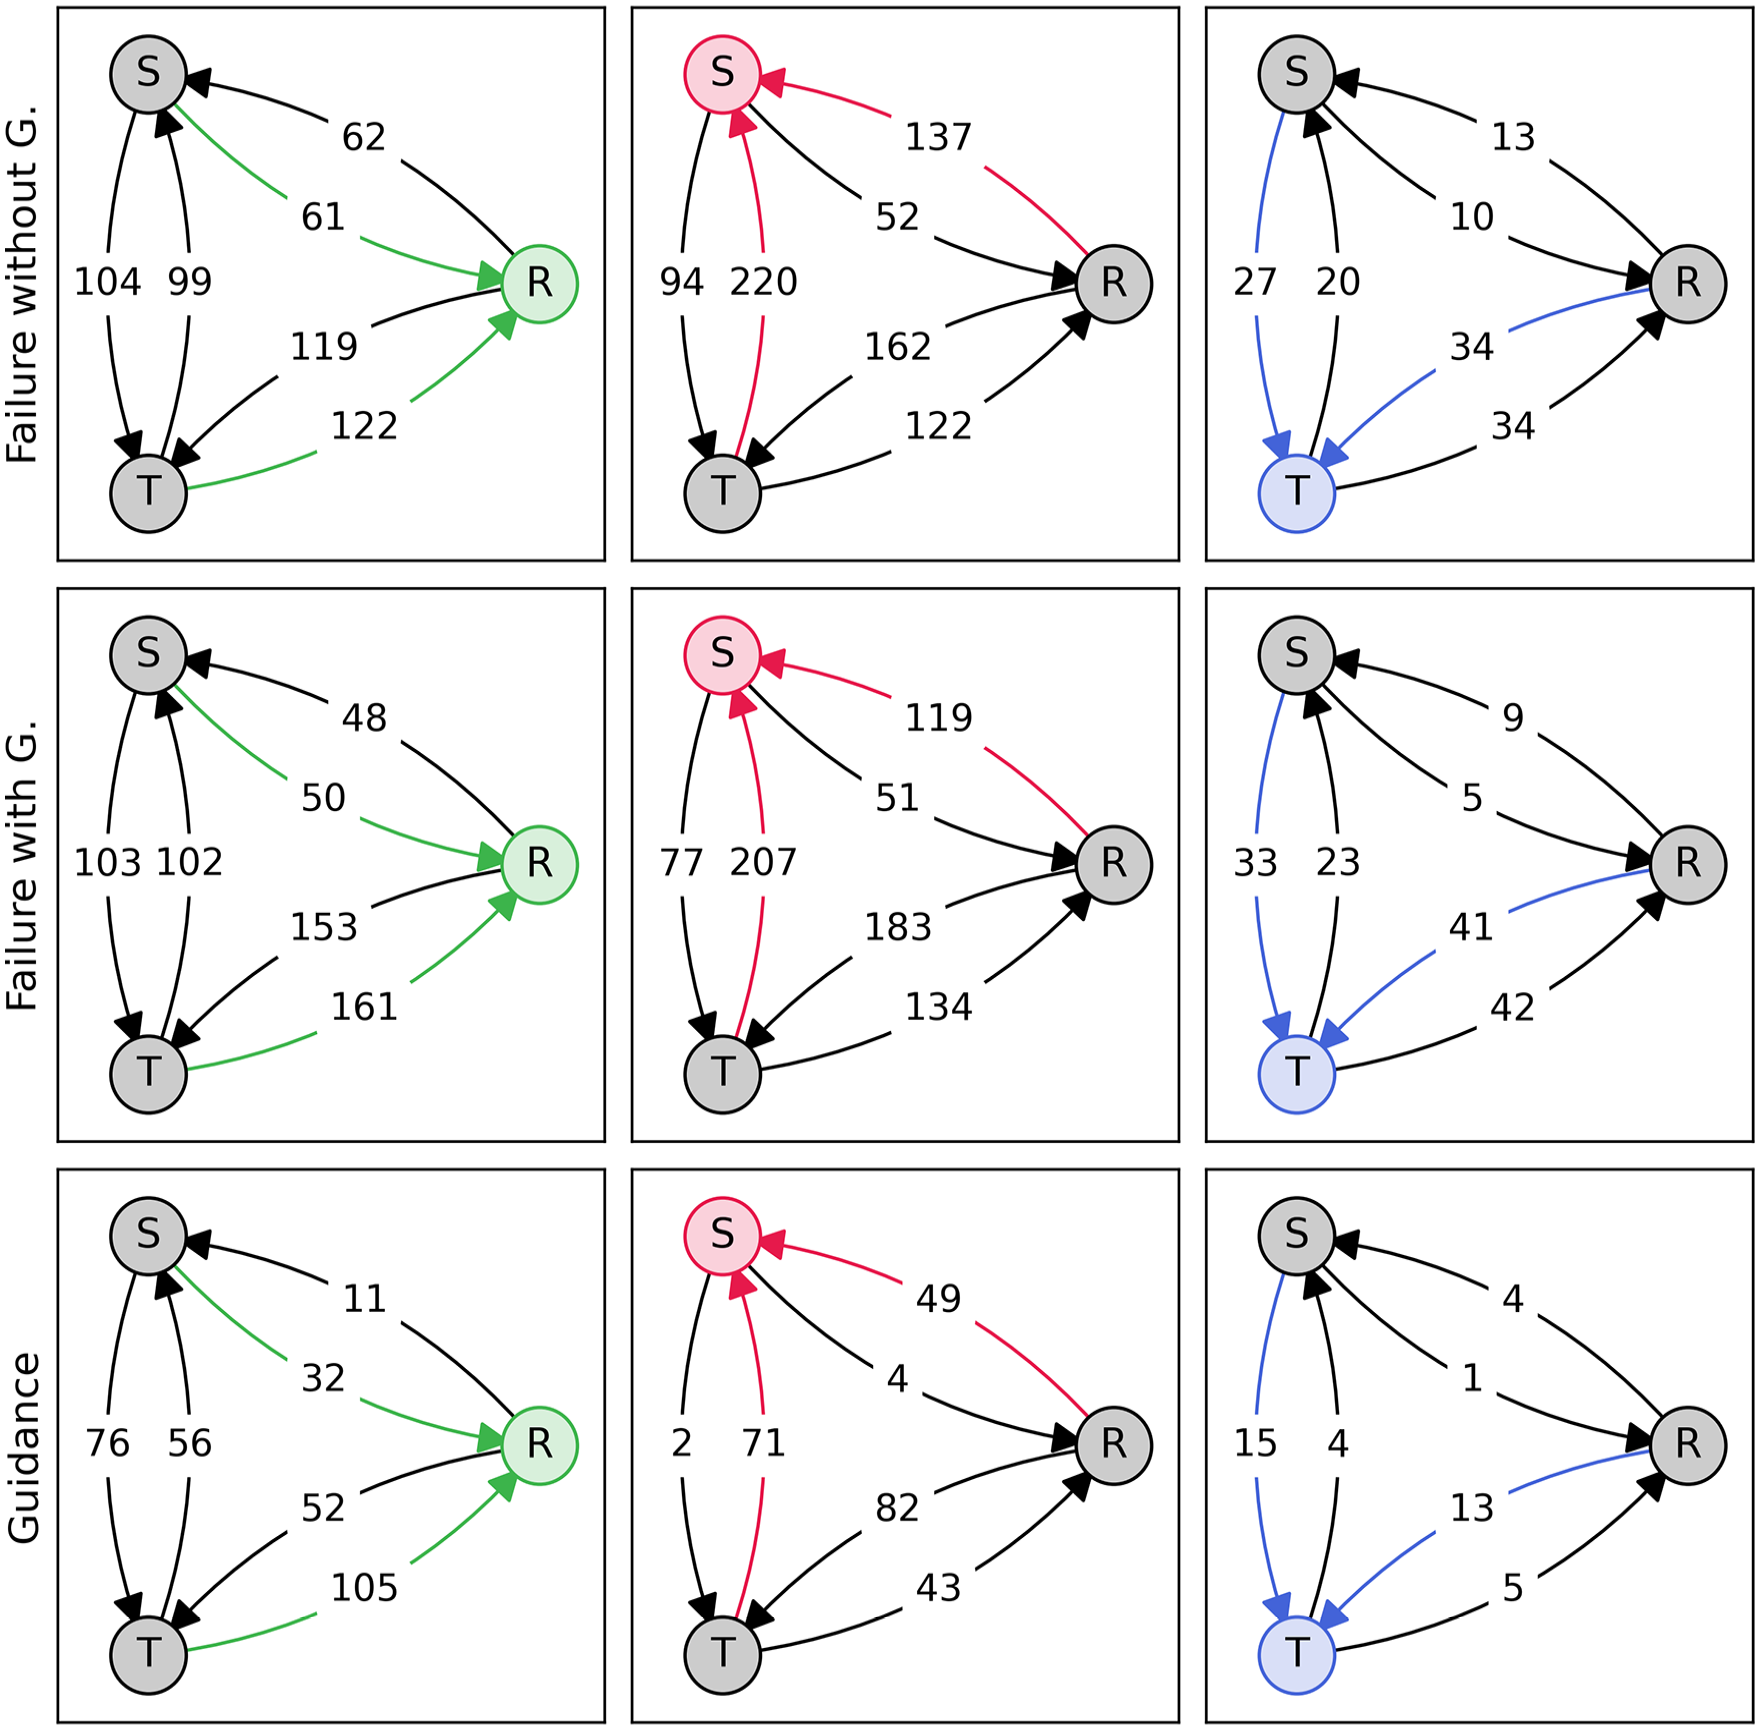
Task switching transition diagrams. The nodes represent the task that participants are looking at (S = System monitoring, T = Tracking, R = Resource management), and edges represent a switch (according to eyes) of task. Colored nodes represent the task that is currently in failure or has guidance shown (bottom row) (N = 13).
Discussion
We developed a human-agent interface to test how eye tracking functions with human users on a visual multi-task cockpit scenario, demonstrating ways to enable user guidance. We observed that increasing event frequency leads to greater difficulty, which in turn affects performance by raising the time that tasks were in failure for. The increase in difficulty was reflected by a change in the weighting of attention allocation to different parts of the task and the frequency with which gaze shifted between tasks. Users who shifted gaze more often also performed better. People that switch from focusing overly on resource management to focusing too much on system monitoring did worst. Previous studies have found that difficulty affects the ability to shift (measured in terms of manual responses) on the MATBII interface (Gutzwiller et al., 2014) and so we confirm that those that could shift their attention performed better.
We noted that the agent behavior mapped onto the change in performance we saw between the easy and difficult conditions with no agents. We found however that it was difficult to disrupt attention, even with very salient cues, we saw no clear signs of attention patterns changing, although there was some indication of an increase in the number of gaze switches to a task for which guidance was displayed, but this was not reflected over all failure times. In times of large cognitive load simple visual guidance even at the point of fixation may not be sufficient. It has been shown before that very salient cues can be ignored. It may be important to consider the nature of the ongoing task demand and make any cues more directly relevant to the current task in order to successfully shift the user’s priorities. Guidance may have also helped users notice events at the cost of disrupting ongoing tasks. In fact, this balance between providing guidance that does not in itself disrupt the ongoing task has been highlighted previously in the literature (Chérif et al., 2018) and is precisely what the ICUa system can be used for, by varying types of guidance in the future to find the optimal trade-off.
Limitations
The way the difficult condition was defined using these tasks, resulted in much longer failure time in the system task than the other two, making comparisons and attention guidance effect more difficult to see. We can use our system to better calibrate difficulties across tasks by for example showing tasks in isolation before together which can also help us estimate the associated cost of multi-tasking (Fox et al., 2021) and any possible reduction in this cost by guidance.
Past studies have attempted to change the balance of how much each task is weighted by the user (Gutzwiller et al., 2019), which could be an additional way of having a more balanced load and priorities across the tasks.
A useful aspect to build into the system would be to have “silent” agents that will allow us to make a counter factual comparison of behavior for when guidance was present versus for when it would have been presented. Following on from this is the possibility of imbuing our agents with more complex cognitions such as the ability to predict when attention will be needed to avoid failure. Prediction could be based on knowledge of the system properties and or perhaps on learning from the system and user’s behavior. Machine learning has been implemented for example in the case of deciding when automation should step in and take over or cede control (Singh & Heard, 2022).
Conclusions
In conclusion, we have tested an open-source modifiable multi-tasking interface based on MATB2, incorporating eye tracking and agents that can provide graphical attention guidance. We used this system to analyze changes in performance and attention patterns across difficulties. With our setup of simple reactive overlay-based guidance, we could not significantly influence participant performance or behavior in our sample. However, we have demonstrated a functioning human-agent interface as a platform for further experimentation to develop more sophisticated attention guidance methods.
Footnotes
Acknowledgements
Thanks to Maia Pessenda-Crichlow and Narmeen Ridha for their help with data collection.
Declaration of Conflicting Interests
The author(s) declared no potential conflicts of interest with respect to the research, authorship, and/or publication of this article.
Funding
The author(s) disclosed receipt of the following financial support for the research, authorship, and/or publication of this article: This work was partly funded by US Air Force Office for Scientific Research award no. FA8655-23-1-7252.