
Abstract
Automated vehicles (AVs) are becoming increasingly intelligent. At the same time, researchers are exploring ways to enable transparent communication between drivers and AVs. One line of work has focused on understanding how displaying an AV’s confidence in detecting roadway obstacles influences drivers’ behavior. In this study, we investigate what actions drivers make when presented with AV’s confidence information regarding its obstacle avoidance ability that does not always match its reliability. Twenty participants drove a semi-autonomous vehicle, while being presented with a confidence information, and needed to decide whether to take over or not. Findings suggest that alignment between the vehicle’s reliability and confidence increased the number of correct decisions. Also, drivers self-calibrated their decision strategy such that more correct decisions were made when provided with accurate information. Insights from this work can be used to inform the design of AV driver models and human-machine interfaces to promote safety within AVs.
Introduction
Automated vehicles (AVs) are becoming more prevalent on public roadways, and their capabilities are becoming more sophisticated. Particularly, many manufacturers aim to develop Level 3 automated driving systems which, as defined by the Society of Automotive Engineers (SAE), means that the vehicle is able to drive autonomously in specific scenarios, but not under all conditions such as road construction or low visibility due to weather (SAE International, 2021). This design implies that drivers should be ready to regain control of the vehicle in such situations, even if they are not actively monitoring the road or controlling any components of the vehicle’s dynamics.
There is a growing body of research focused on predicting driver’s behaviors during takeover situations and designing effective takeover alerts to support safe transitions of control (Blömacher et al., 2020; Liang et al., 2023; Park et al., 2022; Yun & Yang, 2020). To some extent, previous research shows that takeover requests can improve drivers’ vigilance and situational awareness (Merlhiot & Bueno, 2022). However, providing a takeover alert alone may be insufficient for helping drivers to successfully take over control of the vehicle because doing so does not help provide the driver with a good understanding of the road conditions nor how the vehicle might respond to obstacles in the environment.
As AVs and their associated technologies continue to become more intelligent, there is a long-term anticipation that, with the help of advanced sensing techniques, AVs will become capable of (1) self-assessing their ability to handle challenging situations, and (2) displaying this information to drivers to help them determine whether and when to intervene the AVs. For example, if a vehicle encounters an obstacle ¼ miles ahead, it may provide information regarding how confident it is in being able to successfully avoid the obstacle. This confidence information could be displayed to the driver in different ways, for example, using numeric values and/or graphical bars, that leverage knowledge of data visualization and display design.
Thus, one fundamental research question that must be addressed in order to support drivers’ decision-making in this context is how to effectively communicate confidence information to drivers. Recent work in AV settings has used confidence gauges or colored bars to show vehicle’s capabilities in avoiding a roadway obstacle (Doula et al., 2023; Peintner et al., 2022; Tijerina et al., 2016). For example, Doula et al. (2023) examined how visualizations on the windshield, which displayed uncertainty of paths, situations, and waypoints, affected driver’s engagement in driving. They found the absence of uncertainty visualizations led to a lower likelihood of driver’s takeover control of the AVs. In a different study, Peintner et al. (2022) compared the influence of different types of confidence represented using human-machine interfaces (HMIs) (i.e., text, bars, and percentages) on driver’s decision-making in risk situations, such as pedestrians crossing the street. The results revealed that the text HMI was associated with the highest trust, usability, and acceptance of the AV. Furthermore, Tijerina et al. (2016) explored how confidence notifications using green (i.e., certainty) and yellow (i.e., uncertainty) representations impacted drivers’ response to sudden, unscheduled takeover requests. They found this information to be useful and acceptable in terms of helping drivers to make takeover decisions.
Other studies have found that providing information of uncertainty or confidence regarding an automated vehicle’s capability can increase the time to collision and improve situation awareness in cases of automation failure (Beller et al., 2013; Helldin et al., 2013). However, most previous studies (Doula et al., 2023; Peintner et al., 2022; Tijerina et al., 2016) expected participants to make specific actions (e.g., taking over or avoiding a collision) based on controlled variables (e.g., numerical values of a confidence gauge) or presupposed that a vehicle’s reliability directly corresponded to the value displayed on the confidence information.
In contrast, in the current study, we aim to understand how drivers make decisions about what course of action to take when presented with a confidence information wherein the AV’s confidence does not always reflect its reliability. To examine this research question, we designed an experiment wherein an automated vehicle detected obstacles in the road and displayed (graphically) its confidence in its ability to navigate around the obstacles. Our expectation was that providing accurate confidence information to the participants would result in them making more correct decisions compared to when receiving inaccurate information (Elstad et al., 2012; Taylor et al., 2023; Zang & Jeon, 2022).
Method
Participants
A total of 20 participants participated in the study, consisting of 12 males and 8 females, with an average age of 23.4 years (SD: 5.0 years). All possessed a valid U.S. driver’s license with an average driving experience of 5.1 years (SD: 4.6 years) and had normal or corrected-to normal vision. In addition, prior to the study, participants did not have any experience using semi-autonomous driving features (such as adaptive cruise control and lane keeping assistance). The study was approved by the Purdue University’s Institutional Review Board (IRB-2020-755) and participants were paid $20.
Apparatus
This study employed a medium-fidelity driving simulator, miniSim, developed by the Driving Safety Research Institute (DSRI) (Figure 1). This simulator features three 48-inch monitors to display the driving environment and one 18.5-inch monitor for the vehicle’s dashboard. The driver controls vehicle acceleration and braking using dedicated foot pedals as well as vehicle directions using the steering wheel. The sampling rate of the simulator is 60 Hz.
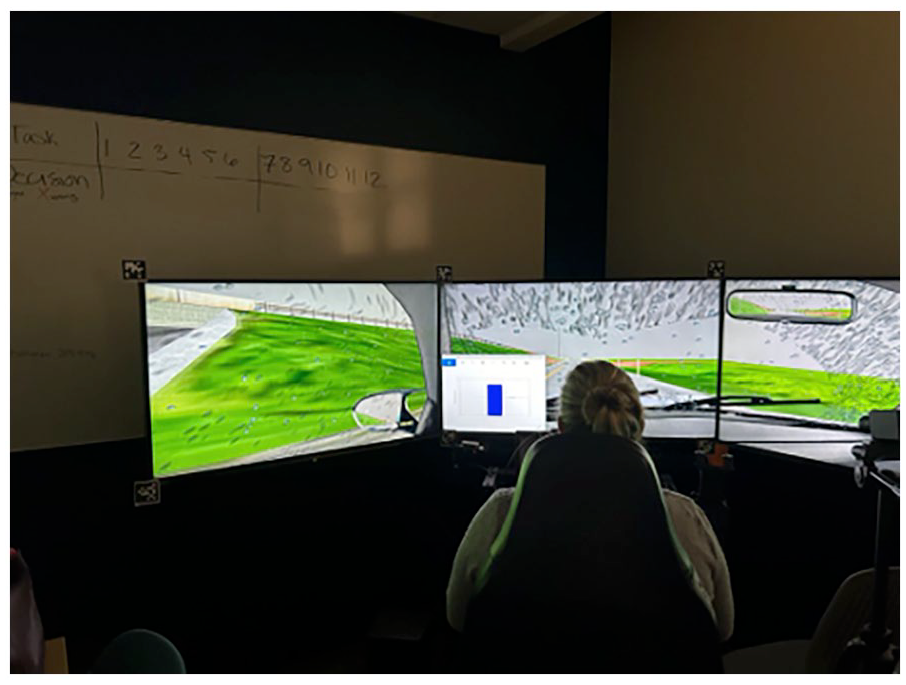
Equipment and driving situation.
Experimental Design and Scenario
To simulate an environment with uncertainty in SAE Level 3 AV, a scenario was created wherein the AV traveled through a rainy environment with limited visibility. The AV drove on a two direction, multi-lane highway in the daytime. Despite several other vehicles on the highway, none of them obstructed the line-of-sight nor impeded traffic flow.
Participants took part in a total of six driving trials, which as part of a between-subject design. Six trials were intentionally repeated to determine whether drivers altered their decisions overtime. Ten participants were assigned to Group 1, and the remaining 10 to Group 2. Participants in Group 1 encountered six situations where the confidence information and reliability directly corresponded to one-another. In other words, when the vehicle could reliably avoid an obstacle without the driver’s intervention, the confidence information dynamically increased, and conversely decreased if the vehicle could not reliably avoid an obstacle. For Group 1, in five of the trials, the vehicle could handle an obstacle by itself with a dynamically increasing confidence information, and in one trial of the six trials, the vehicle could not handle an obstacle by itself with a dynamically decreasing confidence. However, for Group 2, non-corresponding scenarios were presented. Particularly, when the vehicle could handle an obstacle, the confidence information was dynamically decreasing (in five trials); and when the vehicle could not handle an obstacle, the confidence information was dynamically increasing (in one trial). The order of each group was randomized to mitigate order effects.
In this study, the AV’s reliability was set at approximately 80%, meaning the vehicle could successfully avoid an obstacle in five out of the total six cases. This reliability level was chosen to acknowledge previous research findings indicating that people’s performance with automation that is less than 70% reliable could be worse than with no automation at all (Wickens & Dixon, 2007). The confidence gauge, representing the vehicle’s confidence in avoiding an obstacle, was displayed at the left bottom position of the middle monitor (see Figure 1).
A single drive lasted approximately 2 min in total. Drivers were not provided with any non-driving-related tasks. For the initial 60 s, the AV displayed very high confidence, which fluctuated between 85% and 90% (Figure 2), as there were no obstacles ahead. After 60 s, the vehicle encountered a construction zone (the obstacle), where the presence of construction equipment and workers brought about the need to proceed with caution. In this situation, the vehicle issued an obstacle detection alert by displaying visual text (“Obstacle Detected!”) on the windshield through an augmented reality interface. Simultaneously, an auditory alert informed the participant about the obstacle ahead. At this point, participants could have encountered one of two types of confidence information trends (increasing or decreasing) for 15 s. During this period, participants needed to make a decision on whether or not to take over the vehicle, relying only on the confidence information. The first trend showed a linear increase from 60% to 85%, signifying that the vehicle was gaining confidence in its ability to avoid an obstacle. The second trend demonstrated a linear decrease from 85% to 60%, indicating the vehicle was losing confidence in its ability to avoid the obstacle, even as the vehicle moved closer to the obstacle. In this situation, drivers needed to decide whether to take over manual control of the vehicle or allow the vehicle to do so. The selection of this 85% value was made to express a high level of confidence, while 60% (the lowest value), which is above the midpoint, was chosen to indicate a more moderate level of confidence where random choices could be made. This confidence information value was distinct from the actual reliability value, which was approximately 80%.
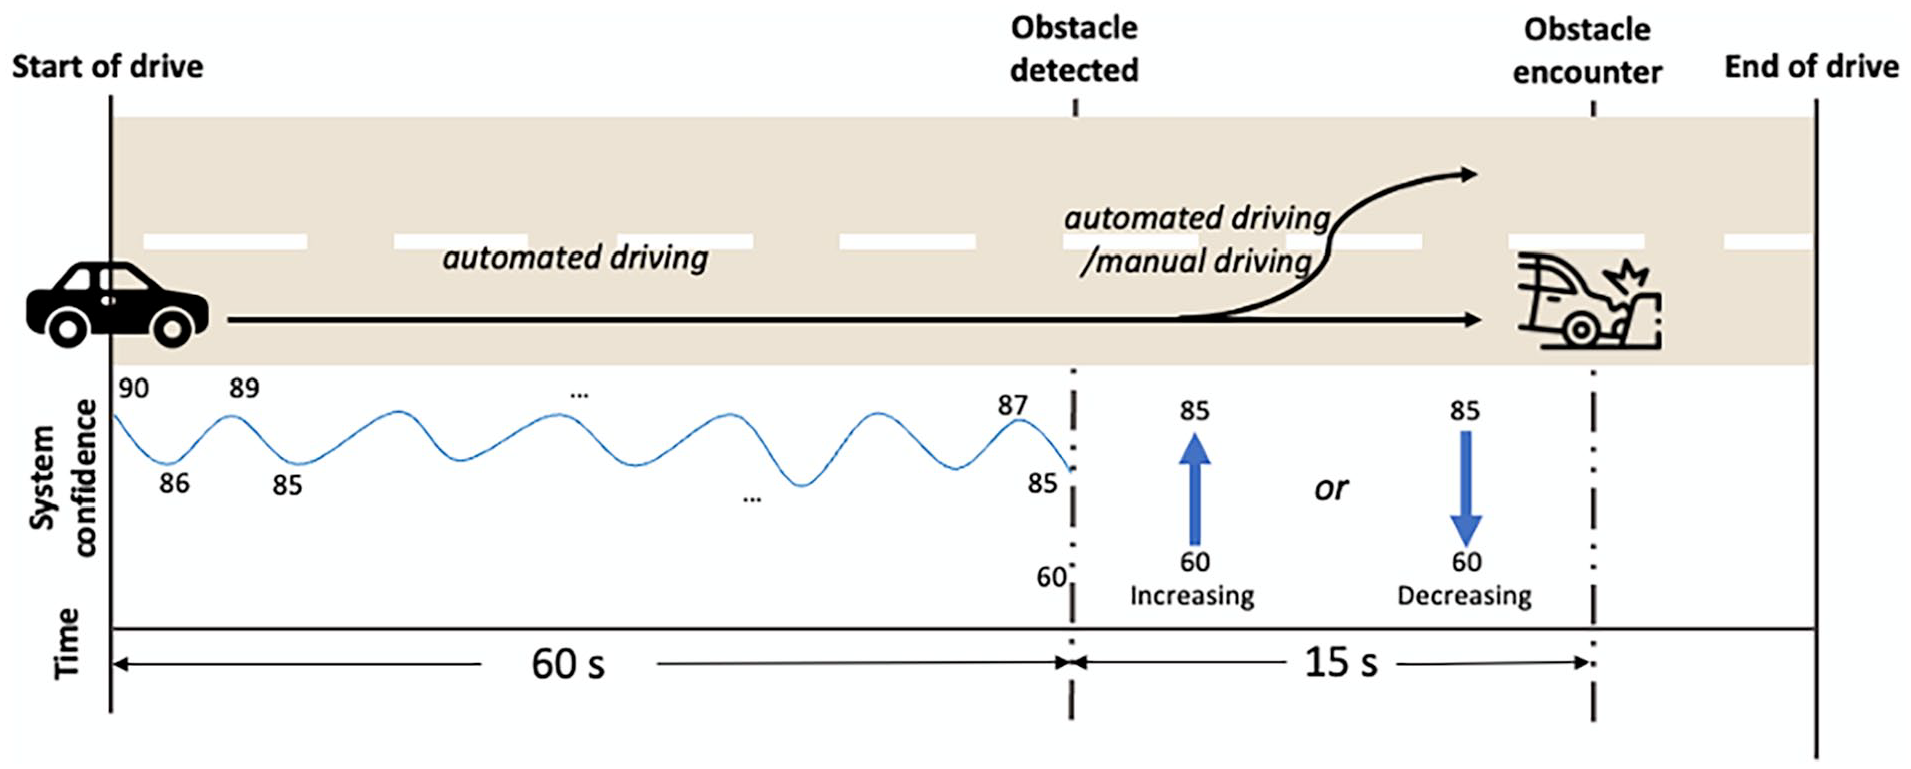
Driving scenario.
Procedures
Upon the participant’s arrival at the laboratory, participants were provided a thorough explanation of the experiment and signed consent forms to acknowledge their voluntary participation in the study. Prior to the experiment, practice trials were conducted to ensure that participants understood the details of the experiment and became familiar with the AV operations. During this time, guidance on how to interpret the concepts of reliability and the confidence gauge were offered. Additionally, we outlined the objectives, which included: “Your objective is to make decisions based on the AV’s confidence information. Possible actions include (1) allowing the vehicle to navigate the obstacle or (2) taking control of the vehicle. When the value is between 85% and 90%. This range indicates that the vehicle is confident enough to navigate and avoid obstacles. If the value temporarily decreases, and then increases, it suggests that the vehicle detected an obstacle and gained enough confidence to avoid it. When the value consistently decreases, it implies that the vehicle is losing confidence even though it is getting close to the obstacle.” Following these instructions, the primary driving sessions commenced, each lasting approximately 2 min. After six drives, we asked participants to complete a questionnaire in which they detailed the strategies they employed to make their decisions.
Dependent Variable
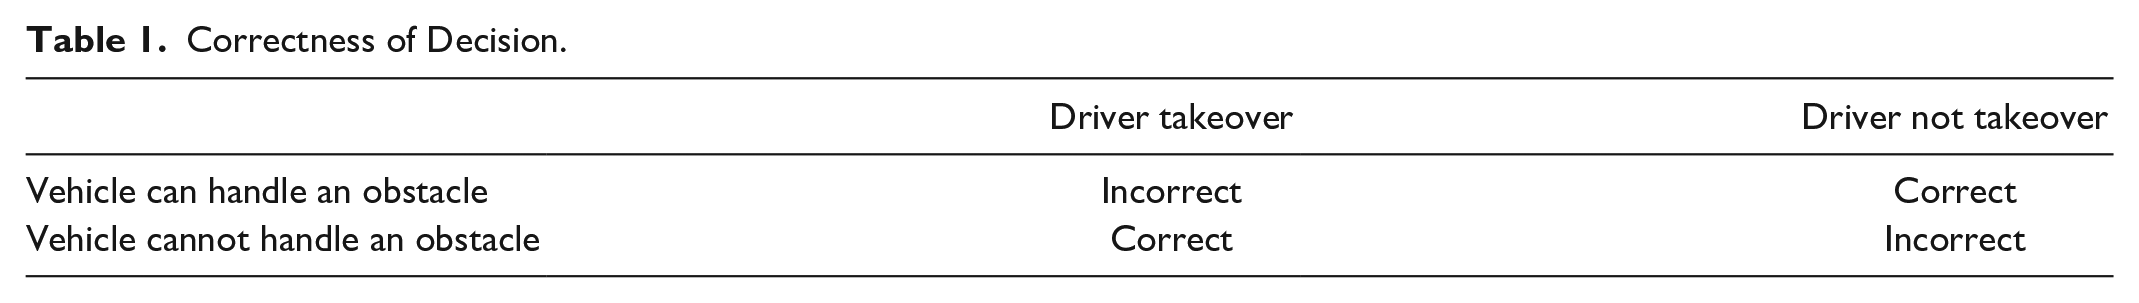
We collected data on drivers’ correctness of decision, which served as the dependent variable. The correctness of participants’ decisions was assessed based on their takeover decision and vehicle’s capability in avoiding an obstacle. A correct decision is defined as follows: when the vehicle could handle an obstacle and the driver did not takeover. Conversely, an incorrect decision occurred when the vehicle could manage the obstacle, but the driver opted to take control over. In cases where the vehicle was unable to handle an obstacle and the driver intervened, it was considered a correct decision. If the vehicle could not manage the obstacle, but the human neglected to take control, this was regarded as an incorrect decision. Any instance of an accident was seen as an incorrect decision (Table 1). Upon the conclusion of each driving session, the correctness of participants’ decisions was communicated to them. A white board affixed to the wall was made visible for participants to review their previous decisions in each trial. We did not consider the information what vehicle’s confidence information presented when assessing the decision correctness because we presumed that the dynamics of confidence information did not necessarily guarantee capabilities and safety.
Correctness of Decision.
Results
Data from all 20 participants were used in data analysis. Statistical analyses were conducted using SPSS (Version 29) and MATLAB (2023b) (IBM Corp, 2023; The MathWorks Inc, 2023). The proportion test was employed for comparing decision correctness concerning confidence and reliability and their combination. To figure out how drivers calibrate their strategy, we employed linear regression. To investigate the relationship between previous and current decision, we utilized the maximum likelihood estimation method. The significance level, alpha, was set at 0.05.
Influence of group on driver’s decisions
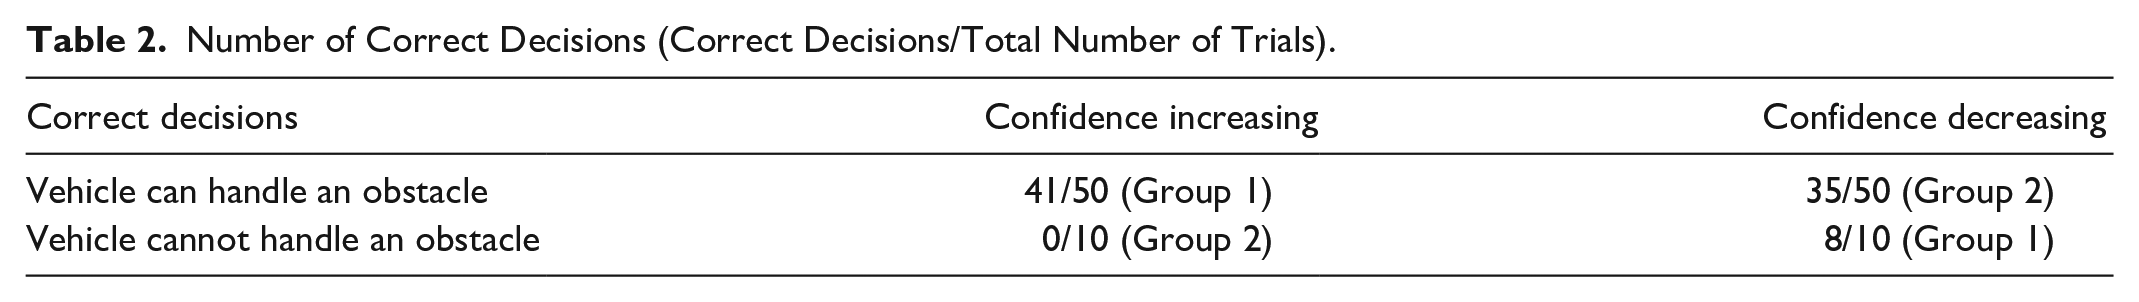
A total of 120 trials were conducted, with each participant undergoing six trials. Out of the 120 trials conducted, 84 trials were determined to be correct decisions. In instances where the AV was reliable (i.e., could handle the obstacle), 76 trials (76/100) resulted in correct decisions, and 8 (8/20) trials were correct decisions when vehicle was not reliable (Table 2).
Number of Correct Decisions (Correct Decisions/Total Number of Trials).
To compare the number of correct decisions, we utilized the proportion test. A significant difference was observed between two groups (Z = 2.79, p = .001). For group 1, there was no significant difference between two confidence information’s trends (Z = 0.15, p = .88). However, for group 2, there was a proportion difference between the two confidence trends (Z = 4.10, p < .001) (Figure 3).
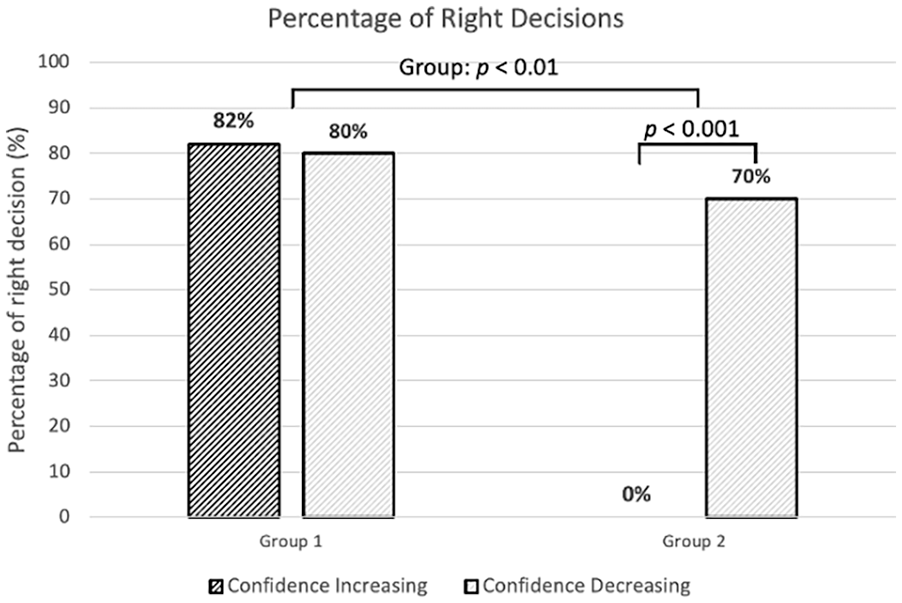
The percentage of correct decisions by confidence and reliability.
Learning Effect of Strategy
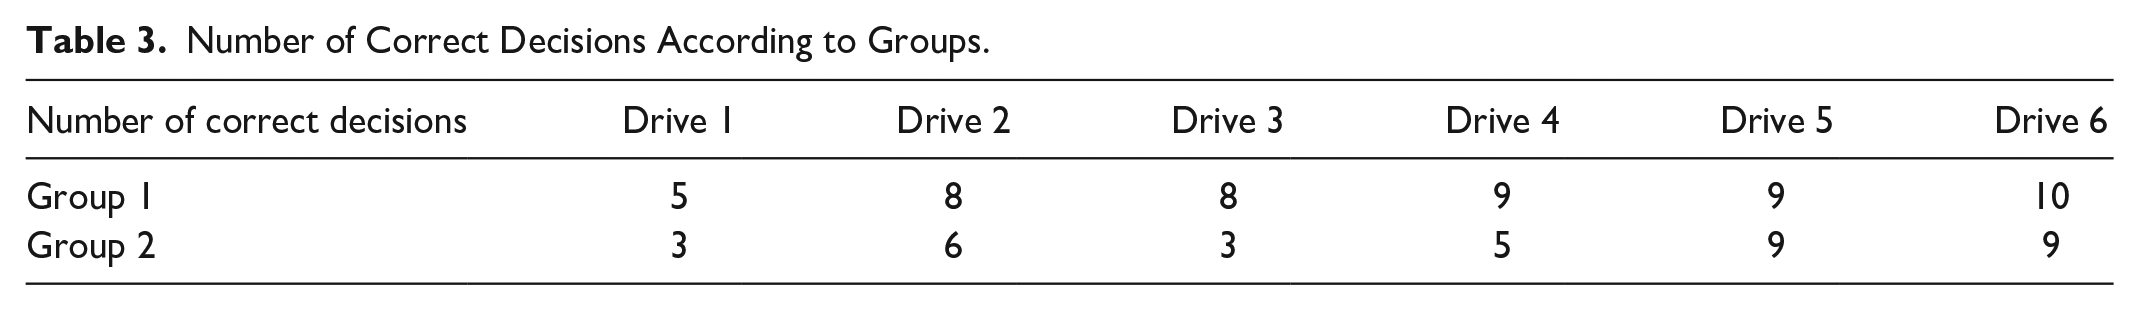
We investigated the variation in the number of correct driving decisions as driving were repeated using linear regression analysis. The number of correct decisions is described in Table 3. Our analysis revealed that the number of correct decisions for group 1 exhibited a linear trend, with a slope of 0.83 (p = .01). In other words, as the driving instances were repeated, there was a statistically significant positive increase in the frequency of participants making correct choices within group 1. In contrast, the slope for group 2 was 1.17, but it did not reach statistical significance (p = .052).
Number of Correct Decisions According to Groups.
Influence of Previous Decision on Subsequent Decision
Out of 120 trials, 84 cases were correct decisions, and 36 were not. We examined whether their previous correctness of the decision affected their current decision. From the maximum likelihood estimation, we concluded that the previous decision significantly affected the current decision (p = .002). Specifically, as the previous decision increases by 1 unit, the log-odds of the current decision occurring increase by 0.9716. For example, the odds ratio for the previous decision would be exp(0.9716) ≈ 2.64. This suggests that the odds of the current decision increase by about 2.64 times for each 1 -unit increase in the previous decision.
Additionally, from a percentage perspective, when the previous decision was incorrect, the percentage of an incorrect decision at the current decision is 62.20%. In contrast, when the previous decision was correct, the percentage of a correct decision at the current decision is 61.63%.
Discussion and Conclusion
The goal of this study was to investigate how drivers respond to confidence information reflecting an automated vehicle’s ability to navigate a road obstacle. During the experiment, participants needed to decide which course of action to take based on the dynamics of the confidence information presented. One group of participants (Group 1) experienced a series of drives where the confidence level was in alignment with the vehicle’s actual reliability, while another group (Group 2) experienced scenarios where the confidence information did not reflect the vehicle’s capability. The correctness of participants’ decisions was recorded and three main findings emerged.
First, exposure to accurate information regarding the vehicle’s capability appeared to have helped drivers make correct decisions, affecting those in Group 1. However, Group 2, who experienced incompatible confidence information, had a lower number of correct decisions compared to Group 1. This result is consistent with the previous research conducted by Taylor et al. (2023) and Zang and Jeon (2022), that found that the provision of reliable and transparent information enhances users’ performance. With respect to our results, Group 2 faced comparatively greater challenges in making accurate decisions due to the conflicting information between the vehicle’s actual capability and what the confidence information displayed (Elstad et al., 2012).
A second finding was that when accurate information was provided to drivers (Group 1), they self-learned how calibrate their strategies. However, when inaccurate information was provided (Group 2), drivers did not make relatively correct decisions compared to Group 1. In other words, Group 1 calibrated their strategies as the drives were repeated, but Group 2 did not. This means that Group 1 made adjustments to their strategies as they repeated the drives, leading to an increase in the number of correct decisions over time (Elstad et al., 2012; Young, 2009). Furthermore, our data suggests that the strategies employed by Group 1 were informed by feedback provided to them regarding the correctness of their decisions. Specifically, Group 1 was successful in forming and modifying a safe strategy based on this information, inferring that they effectively developed accurate mental models (Elstad et al., 2012), whereas Group 2 did not.
Finally, we found that drivers’ current decisions might have been affected by their previous decisions, a result commonly observed in both Groups 1 and 2 (Cioffi, 2001). This finding, along with our second finding discussed above, suggests that repetitive training with accurate information could enhance drivers’ ability to calibrate their strategies, ultimately resulting in improved performance.
Overall, this study explores drivers’ behavior under the assumption that AVs are not perfectly reliable and may provide incorrect information. Study results can be utilized to design models that predict driver behavior as well as to inform the design of intelligent human-machine interfaces within autonomous vehicles to promote safety in next-generation transportation.
Limitations and Future Work
The number of trials, and inclusion of only younger adults, may limit the generalizability. Also, data regarding participants’ subjective strategies (provided during a debriefing session) are currently being analyzed and compared to their objective performance data. Future research should consider recruiting a more diverse sample of participants and increase the number of drives that participants are asked to complete. Also, extending research protocols to real-world, naturalistic scenarios may enhance external validity.
Footnotes
Acknowledgements
We would like to thank graduate student, Maya Luster, for supporting experimental design.
Declaration of Conflicting Interests
The author(s) declared no potential conflicts of interest with respect to the research, authorship, and/or publication of this article.
Funding
The author(s) disclosed receipt of the following financial support for the research, authorship, and/or publication of this article: This study was supported by the US National Science Foundation (NSF). (Awards numbers: 1836900 and 1836952)