
Abstract
Visual signals that integrate situation awareness (SA) information can improve drivers’ performance when assuming control of a partially automated vehicle from a non-driving task. By incorporating information that follows the levels of model of SA, these signals enable drivers to more quickly attain higher levels of SA, potentially bypassing traditional sequential processing stages. We evaluated the effectiveness of such SA-enhanced signals (displayed in the instrument cluster) in a simulated driving study by measuring takeover times and collision occurrences. The results indicate that incorporating SA information about the environment significantly reduces the time needed for drivers to take control of the vehicle and results in fewer collisions. Considering these performance differences suggests insights on optimizing visual cues to quickly restore SA among drivers as they transition from non-driving activities to manual control in partially automated vehicles.
Introduction
Currently, most automakers offer partially automated driving systems that require constant supervision (SAE L2, SAE J31016). However, future automated driving systems (SAE L3) aim to enable unsupervised automated driving, permitting drivers to engage in non-driving tasks such as watching videos. In some cases, the automated driving system may detect a road hazard but be unable to respond to it autonomously, and thus the driver’s cognitive flexibility is needed (Miller & Ju, 2015) to adequately respond to the challenging threat.
In a transfer of control situation, a multimodal audible and visual signal is the most alerting, with the visual signal transmitting more information than merely an alert to take control of the vehicle. While a more complex visual signal occupies visual attention for longer, focusing attention away from the road environment before the driver can attend to the environment, if the automated system can provide helpful information, perhaps this is more valuable than more time focused on the road. Inspired by Endsley’s (1988) three-level model of situation awareness (comprising perception, comprehension, and projection), we aim to design visual signals that aid drivers in quickly rebuilding a mental model of the road environment and thus respond rapidly to hazards. Because it is an open question whether an additional visual focus step aids or hinders SA recovery, transition time, and vehicle control, this study empirically tests the value of various visual signal designs. We hypothesized that the relative value of the more complex visual messages is positive, the greater information density improving the driver’s ability to avoid a possible collision, with higher level SA information allowing the driver to proceed to the decision and action stages more rapidly. As any visual signal will attract visual attention, higher information density will only marginally increase time focused away from the road environment, making visual channel communication valuable. Our research also explores whether visual signals that present different amounts of embedded information and provide information at specific levels of SA help drivers more rapidly establish corresponding levels of SA. By addressing this, our research can determine whether optimally designed visual cues can enhance safety and driver response times in critical situations.
Literature Review
Automated driving allows drivers to disengage from the driving task and thus become passengers able to consume media or rest. Directing attentional focus away from the roadway creates an out of the loop problem. Brandenburg and Skottke (2014) found that drivers exhibited riskier behaviors after long automated driving, suggesting that extended automation might reduce attentiveness. Even with a timely and specific alert, responding to road hazards is a substantial challenge, and engagement in non-driving tasks decreases SA (De Winter et al., 2014), and compromises performance in a transfer of control situation. Regaining SA quickly is essential to ensure safe takeovers (Van den Beukel & Van der Voort, 2013), but that is a substantial challenge.
Research in other fields, like military strategy (Feibush et al., 2000) and human-robot collaboration (Shayesteh et al., 2022), has shown that well-designed visual signals can enhance SA, and the current research project investigates how that can be done in partially automated driving.
Situation Awareness (SA) describes holding a mental model of the ambient environment, understanding that knowledge, and being able to project the future state of the environment, such that choices can be made, and actions executed. Endsley’s (1995) model of SA consists of three levels: perceiving environmental cues (Level 1), comprehending their meaning (Level 2), and projecting the future state of the environment (Level 3). These three stages are followed by decision and action. While the three internal levels in the Endsley model are not necessarily sequential, the perception, comprehension, and projection stages must occur before action can be taken (Endsley, 2015).
With partially automated driving systems at SAE Level 3, drivers may direct their attention away from supervising the automated driving system (SAE J 3016). Focusing away from the environment would leave the driver out of the loop (Merat et al., 2019), and when taking control back from the system, they would have to reestablish SA. In a forced transfer of control situation, there would be significant time pressure on the driver, and likely a challenging hazard to respond to. Endsley (1998) stressed the importance of understanding the “big picture” and tasks necessary for timely decision-making (Adam, 2005). Aiding the driver in SA recovery through the signals the system provides as an alert to take control of the vehicle could ameliorate this problem.
Much research has been done on the design of warning signals, specific to the driving and automated driving contexts. Lee et al. (2021) stresses the importance of timely warnings in aiding driver reactions and advocate for their integration to alert drivers regardless of distractions.
In partially automated driving scenarios (SAE Level 3), the transfer of control from the system to the driver can be challenging. Mok et al. (2015a, b, 2016) investigated the time required to execute complex maneuvers following an audible alert of automated driving system failure, finding that the time required to establish positive control of the vehicle takes between 2 and 5 s, with that increasing with task complexity, up to 8 s with visual-manual tasks such as gaming. Even with current systems that do not allow for attention to be directed away from the roadway, engagement with non-driving tasks increases with automation use (De Winter et al., 2014; Endsley, 2017). Zeeb et al. (2016) found that engaging in texting or internet browsing significantly increased reaction time and crash risk during urgent takeovers.
Method
Participants
Sixty licensed drivers participated in the study, as recommended by G*Power for a repeated-measures analysis of variance in a within-subjects design. Four did not complete the study, leaving 28 males and 28 females. Of these, 12 participants were in their 20s, and 11 were in each of the subsequent age groups up to and including those 60 years old and above.
Research Design
This study employs a within-subjects repeated measures design, allowing for evaluation of the visual signals’ effects on driver SA and driving performance. This model uses each participant as their own control, comparing their responses to the visual signals with embedded SA information with a basic (“standard”) takeover request message (see Figure 2). Each participant encounters seven situations in the road environment, five requiring an evasive maneuver and paired with one of each of the visual signals shown in Figure 2, and two false alarms.
Equipment and Environment
In the study, participants drive on a highway environment, generated using SCANeR version 2021.2 and presented in a fixed-base driving simulator with a 180° curved seamless front screen. During automated driving segments, a video clip is shown on a center console.
Driving Tasks, Scenarios, and Procedure
At the start of the experiment, participants receive a written briefing about the study’s procedure, after which informed consent is obtained in accordance with the approved institutional review board protocol. Participants are then taken to the driving simulator, where an experimenter fits them with a seat and safety belt and provides a verbal introduction to the simulator’s controls, the automated driving system, and the center console features. This briefing is followed by 10 min of highway driving to help participants acclimate to the driving simulator or prevent withdrawal due to dizziness. The simulator is then reset to start the participant at the beginning of the highway segment. During the experiment, participants performed three tasks:
At the start of the simulation or after each takeover event, the driver must manually drive the vehicle to highway speed in the center lane and then enable the automated driving system by pressing a button on the steering wheel.
While automated driving is enabled, the driver is tasked with watching documentary videos unrelated to driving on the center console screen.
When prompted by an audible alert and a visual signal displayed on the instrument panel, the driver must take control of the vehicle from the automated driving system by steering and/or braking to avoid an obstacle in the roadway.
When the driving portion of the experiment begins, participants drive manually for a short period before receiving a synthesized voice instruction from the simulator to “Please enable the automated driving mode.” They then activate automated driving by pressing a button on the steering wheel. To prevent participants from anticipating transfers of control, subsequent voice cues to start automated driving vary randomly, setting the automated driving time before each obstacle encounter or false alarm to approximately 60, 90, or 120 s.
During automated driving, the vehicle travels in the center lane of a three-lane highway at a fixed speed of 100 km/h. A documentary video segment plays on the center console screen, allowing participants to focus their attention away from the automated driving system. Each participant experiences seven automated driving segments: five end with a visual takeover signal indicating an obstacle in the center lane (see Figure 1), and two are false alarms requiring a takeover of control to prevent learning effects. The order of alerts is obstacle, obstacle, false alarm, obstacle, false alarm, obstacle, and obstacle.
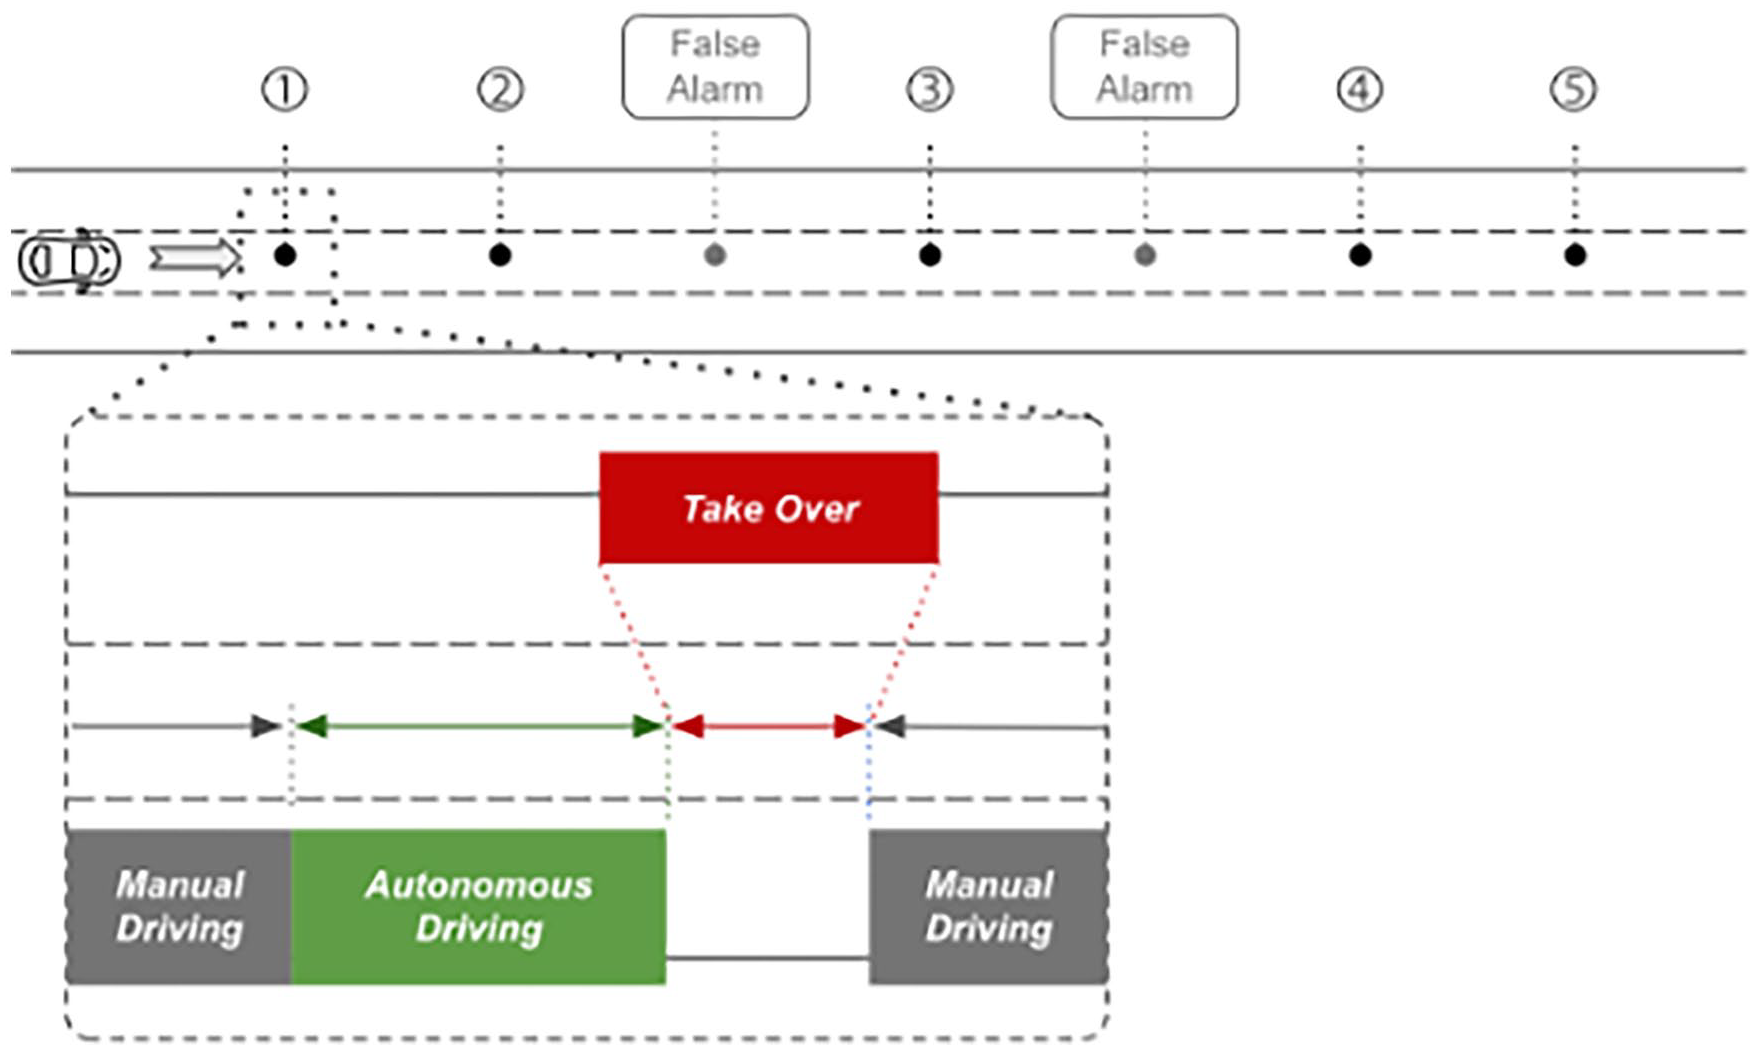
During the experiment, drivers encounter five take-over events and two false alarms. Initially, drivers engage in manual driving before transitioning to autonomous driving.
The alerts, composed of a sound and visual signal displayed on the instrument panel, are activated when the driver reaches a distance of 111 m (4 s at 100 km/h) from the obstacle blocking the center lane of the highway. The visual signals, shown in Figure 2, are presented in random order, with the false alarm signal displayed only when no obstacle is present. After participants complete the takeover request scenario, the vehicle is repositioned in the center lane just past the obstacle, and the researcher reactivates the simulation.
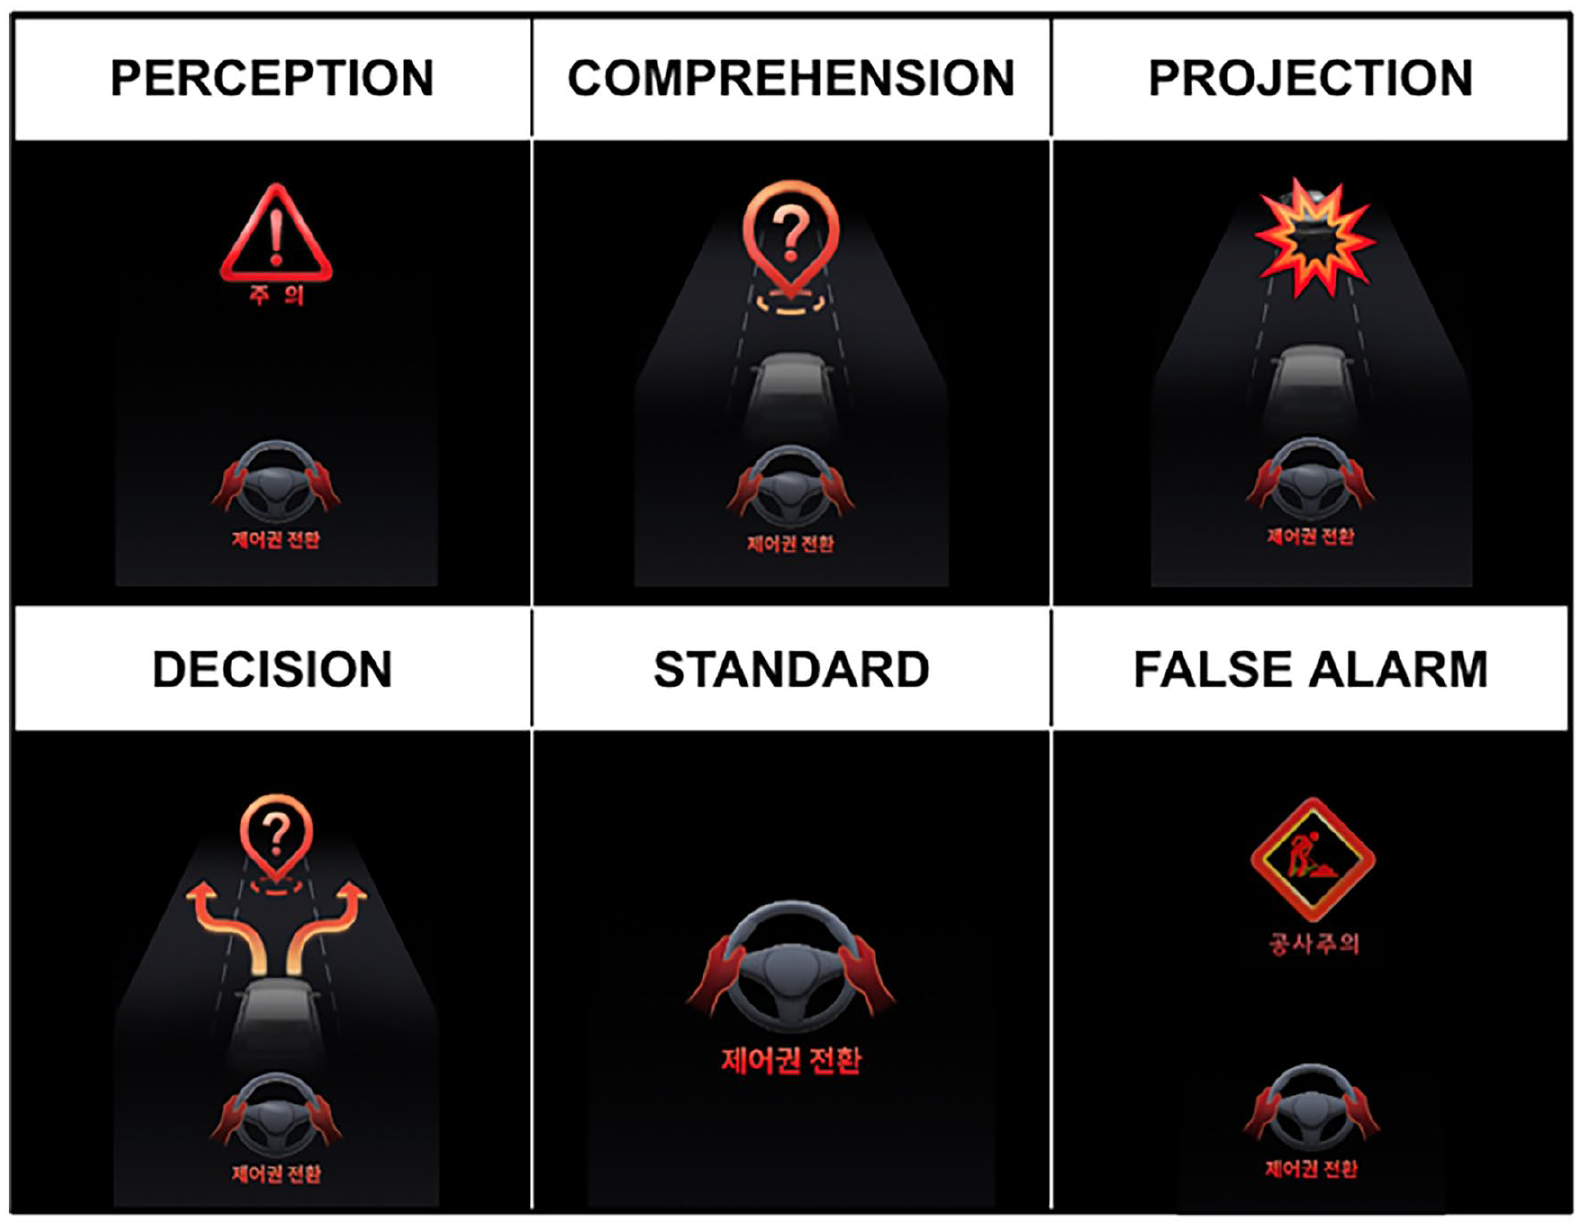
All visual signals include the instruction “take over” beneath an image of a steering wheel and hands. The visual signals in the upper row add information following the internal processes specified in Endsley’s model of SA: (left) caution required, (center) unidentified hazard ahead, and (right) forward collision ahead. The lower left shows suggested evasive action, corresponding to the decision and response stages in Endsley’s model. The fifth (standard) presents only the takeover message. The lower right signal is used as a false alarm (“caution for construction site”).
Visual Signal Design
To provide situation awareness cues that help drivers “jump” to different levels of SA, or directly to decision and action, each of the visual signals shown in Figure 2 is keyed to one of the levels of situation awareness specified by Endsley’s model. These SA-keyed images add information that supplements the “standard” takeover request icon (lower center), and represent caution required (upper left, perception), unidentified hazard ahead (upper center, comprehension), collision hazard ahead (upper right, projection), and suggested response of steering around the obstacle to the left or right (lower left, decision).
Dependent Measures
We record reaction times for all takeovers, measured from the moment of the visual and auditory takeover request until the driver regains control by braking or turning the steering wheel. Braking is signaled by pressing the brake pedal with at least 10% maximum force, while steering is determined as turning the steering wheel more than three degrees, based on similar research by Gold et al. (2013). To support analysis of reaction time and any potential collisions, we record simulator telemetry, including speed, acceleration, jerk, and the minimum distance between the obstacle and the vehicle. In addition, we capture participants’ eye movements to (a) assess whether they look first to the visual signal on the instrument panel or to the ambient environment, and (b) examine the amount of time spent with attention focused on the visual signals and on the elements of the road environment–this will be analyzed in future research.
After completing the simulated driving task, participants complete a post-survey to collect their demographics information, driving experience, and subjective evaluations of the different visual signals used in the experiment.
Results
Take-over Time
Takeover time decreased when the driver received visual signals with embedded SA information, compared with the takeover only “Standard” visual signal which required a mean 1.92 s response time. The other visual signals sped response time, with a mean time of 1.62 s. An omnibus repeated measures ANOVA shows a statistically significant result, F(4, 220) = 5.2341, p < .001.
Tukey-HSD protected post hoc tests show statistically significant differences between the Standard and other visual signal designs: Standard-Perception (p = .0217), Standard-Comprehension (p = .0293), Standard-Projection (p = .0287), and Standard-Decision (p = .0133).
The boxplot (Figure 3) illustrates the relative time required for the participant to respond to the takeover request audible-visual signal pair. The close clustering of mean response times for the signals that include SA information suggests that these signals demand a similar level of cognitive load, and thus, might be equally adept at promoting rapid situation awareness recovery, even though they require visual attention to process.
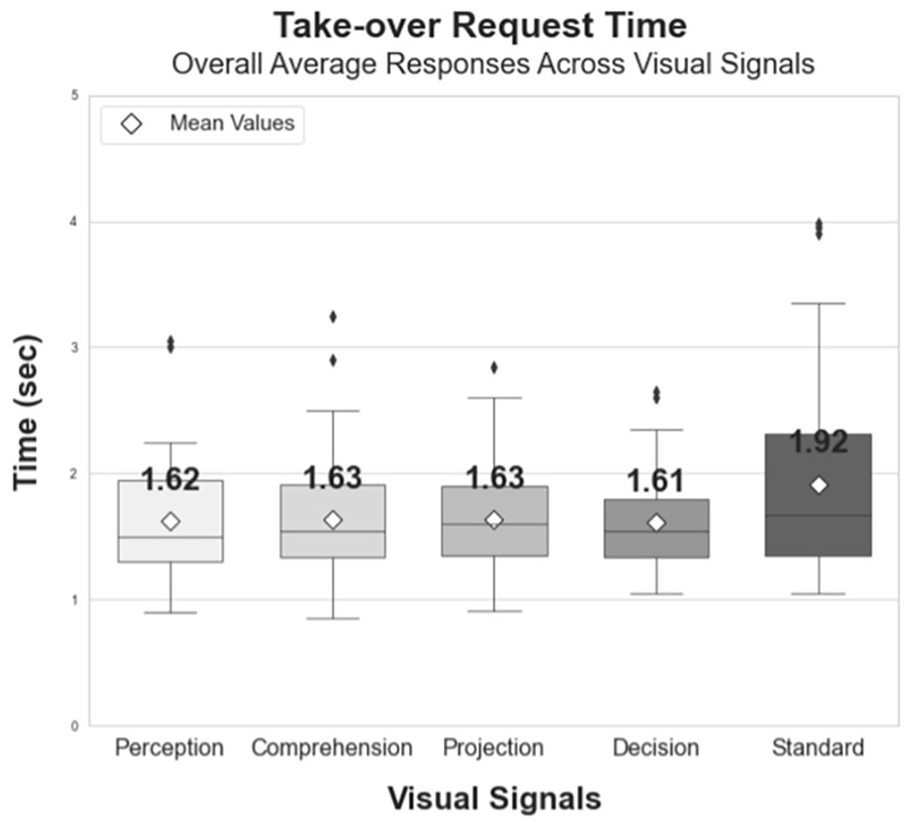
Mean response times between alert and initiating a braking and/or steering response. The Standard (takeover only) signal shows a significantly longer time to response compared to the signals with embedded SA information.
Collision Rates
An analysis of collisions by visual signal showed that ‘Perception’ had the fewest (6) while ‘Standard’ had the most (13), with ‘Comprehension’ and ‘Decision’ each at 8, and ‘Projection’ at 7. In a GLMM analysis with “Standard” as the reference, “Perception” significantly reduced collisions (p = .045) and “Projection” was marginally significant (p = .085). Neither “Comprehension” nor “Decision” showed significant effects (p = .152). This indicates an influence of visual signal design on collisions. Further study with larger populations could reveal more pronounced statistical differences in this trend.
Conclusions
The advent of automated driving systems (ADS) has shifted the paradigm of vehicular control, yet the responsibility still lies with human drivers to intervene when an ADS reaches operational boundaries such as when the system detects an obstacle but cannot determine what to do in response. The efficacy of human intervention in such a situation is contingent upon the driver’s ability to determine the nature of the threat, which demands SA.
Our investigation into the differential impact of visual signals which include SA information on response times shows that such signals can markedly expedite the recovery of SA, which is essential when drivers are disengaged from the driving task due to non-driving related visual-cognitive activities. Signals that convey SA cues can play a vital role in bridging the gap between distraction and attention, enabling drivers to swiftly reestablish SA while redirecting their focus to the driving environment after engaging in non-driving tasks. Aided by the computer system in the vehicle, the driver does not need to do all the work to determine what to do in response to a hazard that the system cannot respond to by itself. The rapid response facilitated by the Perception, Comprehension, Projection, and Decision signals, as opposed to the Standard signal, points to the potential of tailored visual cues in assisting drivers to attain the requisite level of SA after engaging with visual media.
Our findings are particularly relevant for the design of Human-Machine Interfaces (HMI) in vehicles equipped with SAE Level 3 automations. By integrating visual signals that provide information at different levels of SA, we posit that drivers can “leapfrog” to the necessary level of awareness. This leap can significantly reduce the time and cognitive effort required for a driver to become situationally aware and thus respond to road hazards.
Take-Aways
Visual signals that include SA cues may be able to help drivers regain situation awareness after switching back to driving from a non-driving activity that takes visual and cognitive attention away from the road environment.
Visual signals keyed to the levels of SA may allow a driver to “jump” to the corresponding level of SA, reducing the time and cognitive resources required to become situation aware, as revealed take-over request time.
Footnotes
Declaration of Conflicting Interests
The author(s) declared no potential conflicts of interest with respect to the research, authorship, and/or publication of this article.
Funding
The author(s) received no financial support for the research, authorship, and/or publication of this article.