
Abstract
Stochastic resonance (SR) is a phenomenon where addition of noise to a system enhances the system’s signal-to-noise ratio. SR can improve the ability to detect weak signals. Lugo et al. showed that tactile detection threshold decreased when participants received auditory white noise. We aimed to replicate the results of Lugo et al., except that we measured tactile discrimination. We examined whether discrimination between durations of vibrotactile stimuli would be better when auditory noise was presented. Participants performed a 2AFC task for three noise conditions: no noise, 45 dB, 55 dB. A total of 17 out of 24 participants demonstrated increased tactile sensitivity when white noise was present compared to when it was absent, which is not statistically significant. The optimal noise level varied among individuals. Eight participants performed best at 45 dB and 4 at 55 dB. Hence, determining the ideal noise level for each person is crucial for enhancing tactile sensitivity.
Introduction
Stochastic resonance (SR) is a phenomenon in which the addition of noise with a wide range of frequencies to a non-linear system enhances the system’s signal-to-noise ratio (SNR) (Collins et al, 1996; McDonnell & Abbott, 2009; Moss et al., 2004; Wells et al., 2005). When applied to a perceptual system, the addition of noise can improve a user’s ability to detect weak signals (Collins et al., 1996; Moss et al., 2004; Söderlund et al., 2010). If the noise is too soft, it may not affect the SNR enough to increase the detectability of the signal; conversely, if the noise is too strong, it may entirely swamp the signal (Moss et al., 2004; Söderlund et al., 2010; Wells et al., 2005). The magnitude of additional noise must be optimal (Manjarrez et al., 2007). For example, tactile sensitivity improved for some participants when they received certain levels of auditory white noise when compared to their performance in the silent condition (Lugo et al., 2008). In this study participants received tactile vibrations to the middle finger of their right hand. They were asked to report whether they felt the tactile stimulus. The noise level required to observe an improvement in detection differed across participants. Further, as noise level increased, the threshold decreased and then reached a minimum (i.e., maximum tactile sensitivity). The threshold then increased. These results represent a characteristic SR curve, which is an inverted U-function, where performance peaks at a moderate noise level (Söderlund et al., 2010). The implication is that auditory noise can enhance tactile sensitivity under the right conditions. Stochastic resonance has improved detection in other modalities such as vision (see Itzcovich et al., 2017; Manjarrez et al., 2007; Treviño et al., 2016) and audition (Ries, 2007; Tanaka et al., 2008).
The present study aimed to replicate Lugo et al. (2008), except that we measured tactile discrimination rather than tactile detection. We wanted to see whether stochastic resonance would improve performance for suprathreshold tactile stimuli. In addition, we measured effects of SR in a larger sample of participants and assessed group differences; this goes beyond prior demonstrations of improvements in tactile sensitivity due to SR, which typically measured individual learning curves of a small number of participants (Ries, 2007; Richardson et al., 1998). We examined whether discrimination between two durations of vibrotactile stimuli would be better when auditory noise was added to ambient noise compared to a control condition of just ambient noise.
Method
Thirty undergraduates from Rice University participated for partial course credit. They self-reported abstaining from substances such as caffeine and nicotine, which could stimulate or depress the central nervous system for 12 hr. The study adhered to the standards outlined in the American Psychological Association Code of Ethics and was approved by the Rice University Institutional Review Board. The experiment had a within-subjects factor, noise, and a between-subjects factor, order. There were three noise conditions: no noise (35 dB ambient noise), 45 dB, and 5 dB. Table 1 depicts the sequence of noise conditions for each order. We measured the discrimination threshold for the duration of vibrotactile stimuli presented through C-2 tactors (https://www.eai-info.com/) held in the fingertips. White noise was presented through headphones.
Sequence of Conditions for Each Order.
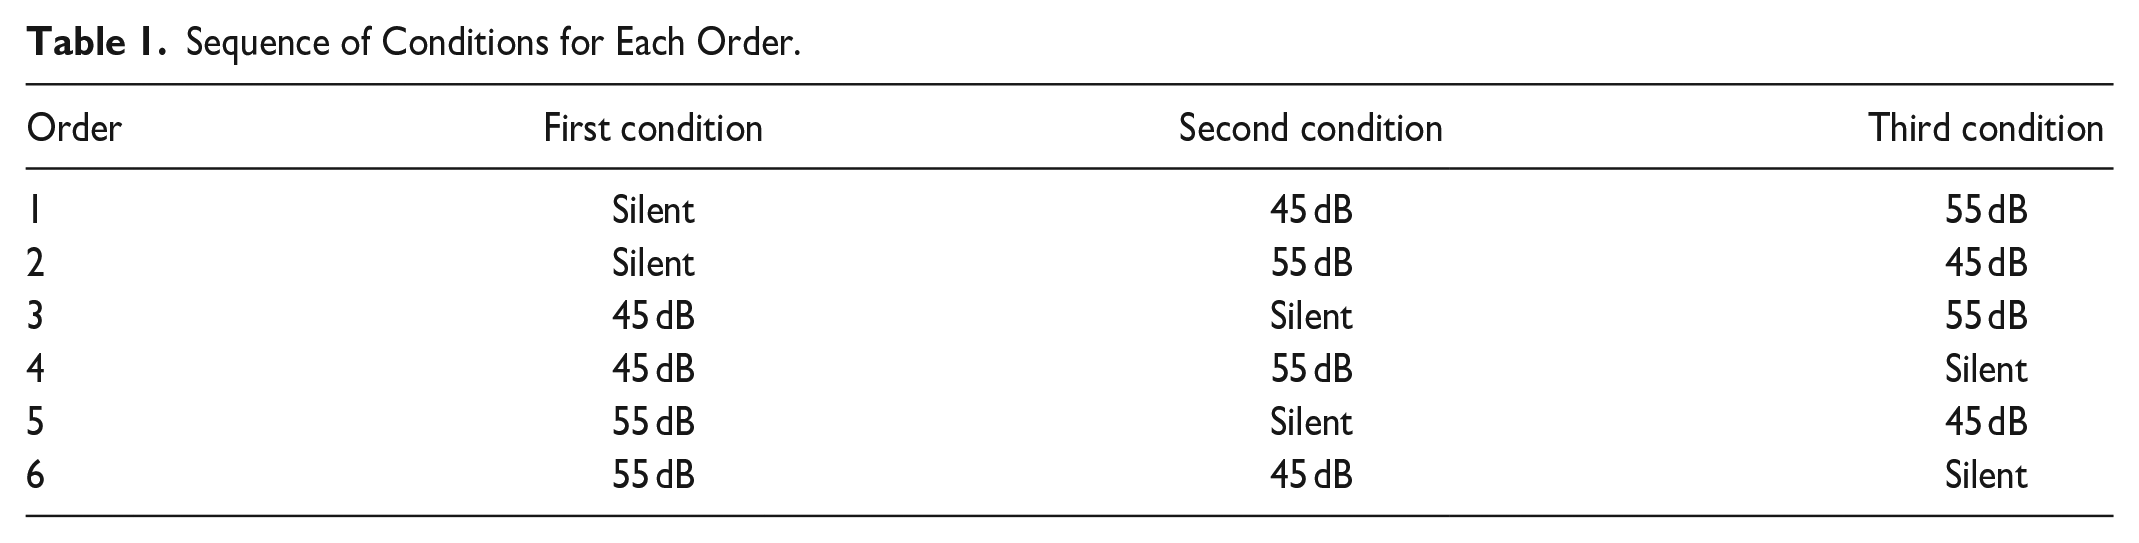
Participants performed a two-alternative forced choice (2AFC) task with an adaptive staircase procedure. The subjects were presented with two vibrations; they reported which of two vibrations was shorter. The staircase converged on the 79% threshold (Levitt, 1971). The standard stimulus was 370 ms long, and the variable stimuli varied from 10 to 360 ms. Each participant performed the staircase thrice, at baseline and at each noise level. The order of noise conditions was counterbalanced across participants. To lessen the chance that participants could hear the vibrations, they put their hands in a sound-dampening box. Each staircase lasted about 5 to 10 min; the entire experiment lasted about 20 to 30 minutes. Five participants were excluded because they reported hearing the vibrations in over 50% of the trials: two participants in order 1, one participant in order 2, and two participants in order 3. We also excluded one participant (in order 1) because their mean was more than three standard deviations away from the sample mean. Final analysis was based on 24 participants.
Result and Discussion
We analyzed mean thresholds with a two-way mixed analysis of variance (ANOVA) with the noise level as the within-subject factor and the order as the between-subject factor. Qualitatively, mean threshold appeared to decrease as noise increased from 35 to 55 dB, but the main effect of noise was not statistically significant; neither was order. The mean of the discrimination threshold measured in milliseconds for the no noise condition was M = 60.83 (SD = 22.83); for 45 dB, it was M = 58.75 (SD = 17.02); and for 55 dB, it was M = 54.17 (SD = 26.03).
Qualitatively, the pattern of means revealed seven participants who had the poorest performance in either the 45 dB or no noise conditions when these were the final conditions in the sequence. However, the interaction between order and noise also was not statistically significant. Seventeen participants showed any kind of improvement in tactile sensitivity when any white noise was present compared to absent. Four participants exhibited an improvement in threshold as noise got louder, see Figure 1. Five other participants showed the characteristic SR curve, see Figure 2. Of these nine who improved, four of them (Subjects 6, 14, 16, and 30) reported imagining the vibration in their head and were confused as to whether they truly heard it with their ears.
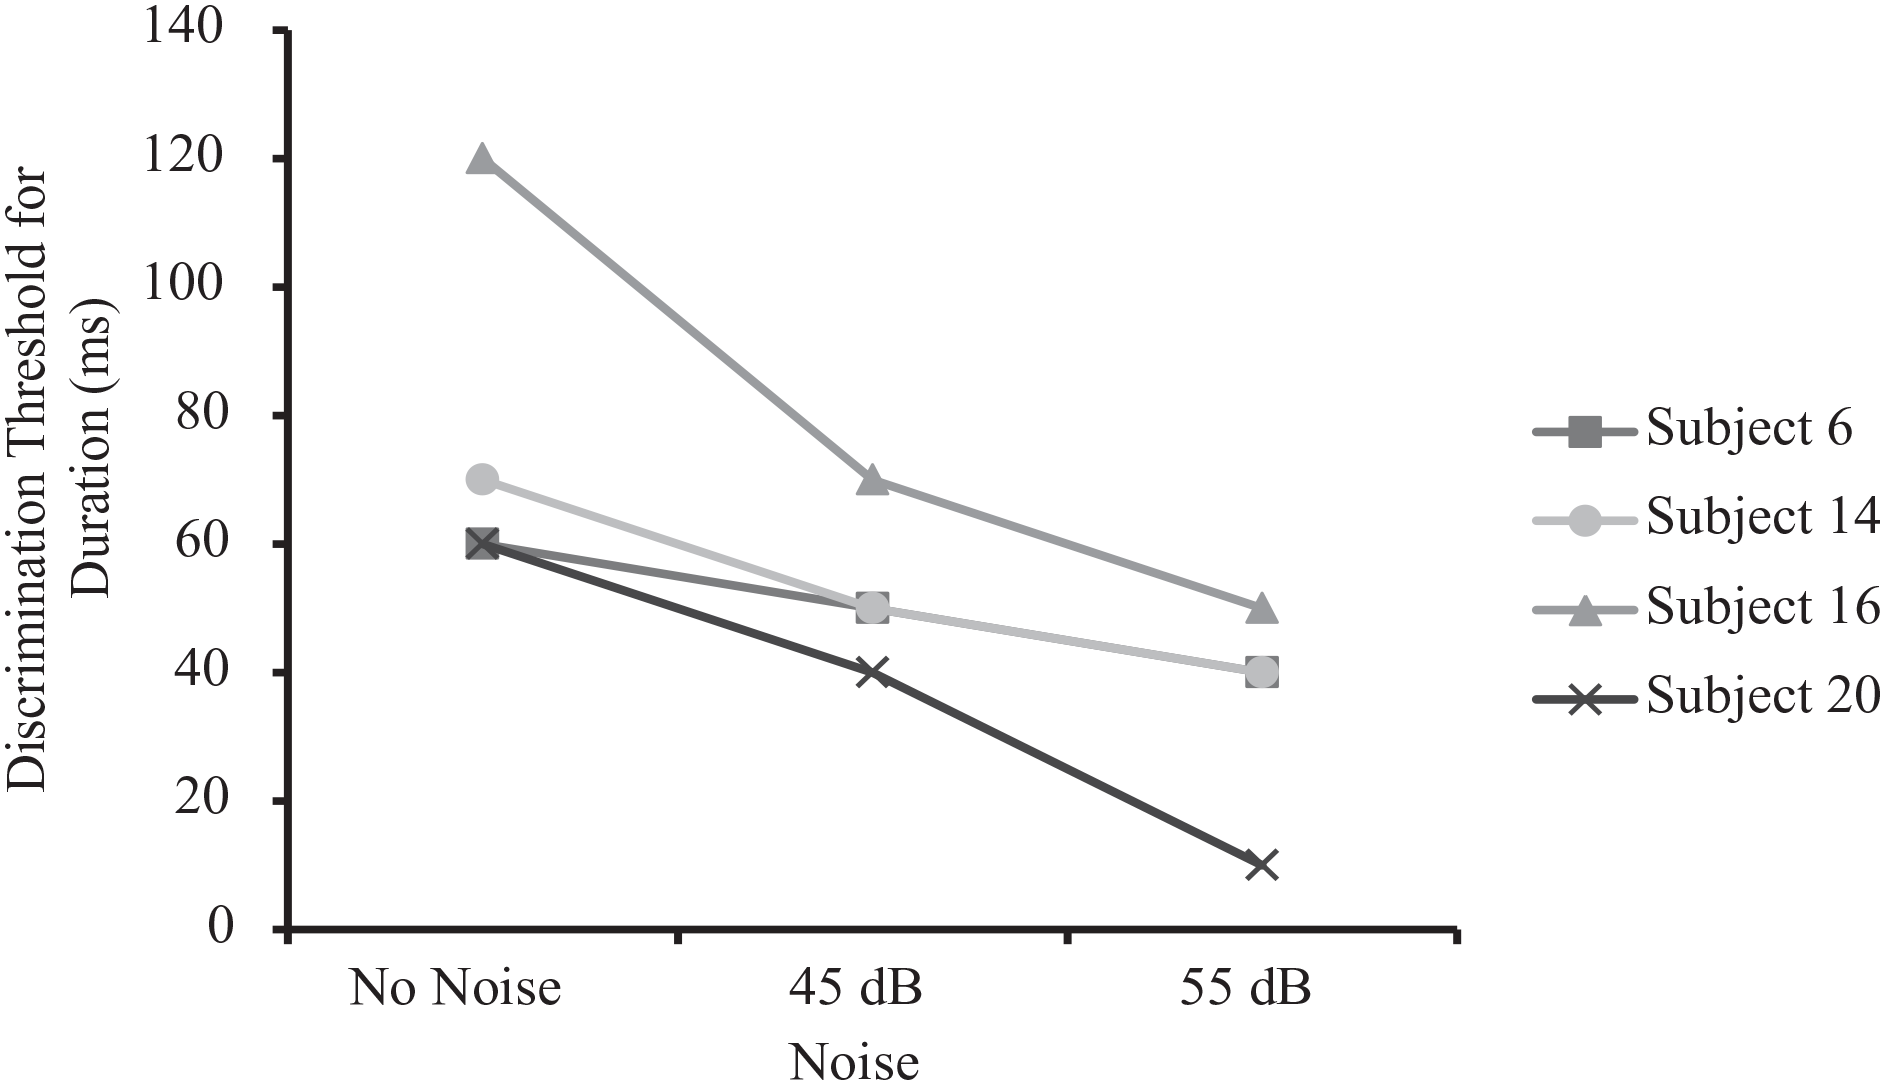
Discrimination threshold for participants whose threshold decreased as noise level increased.
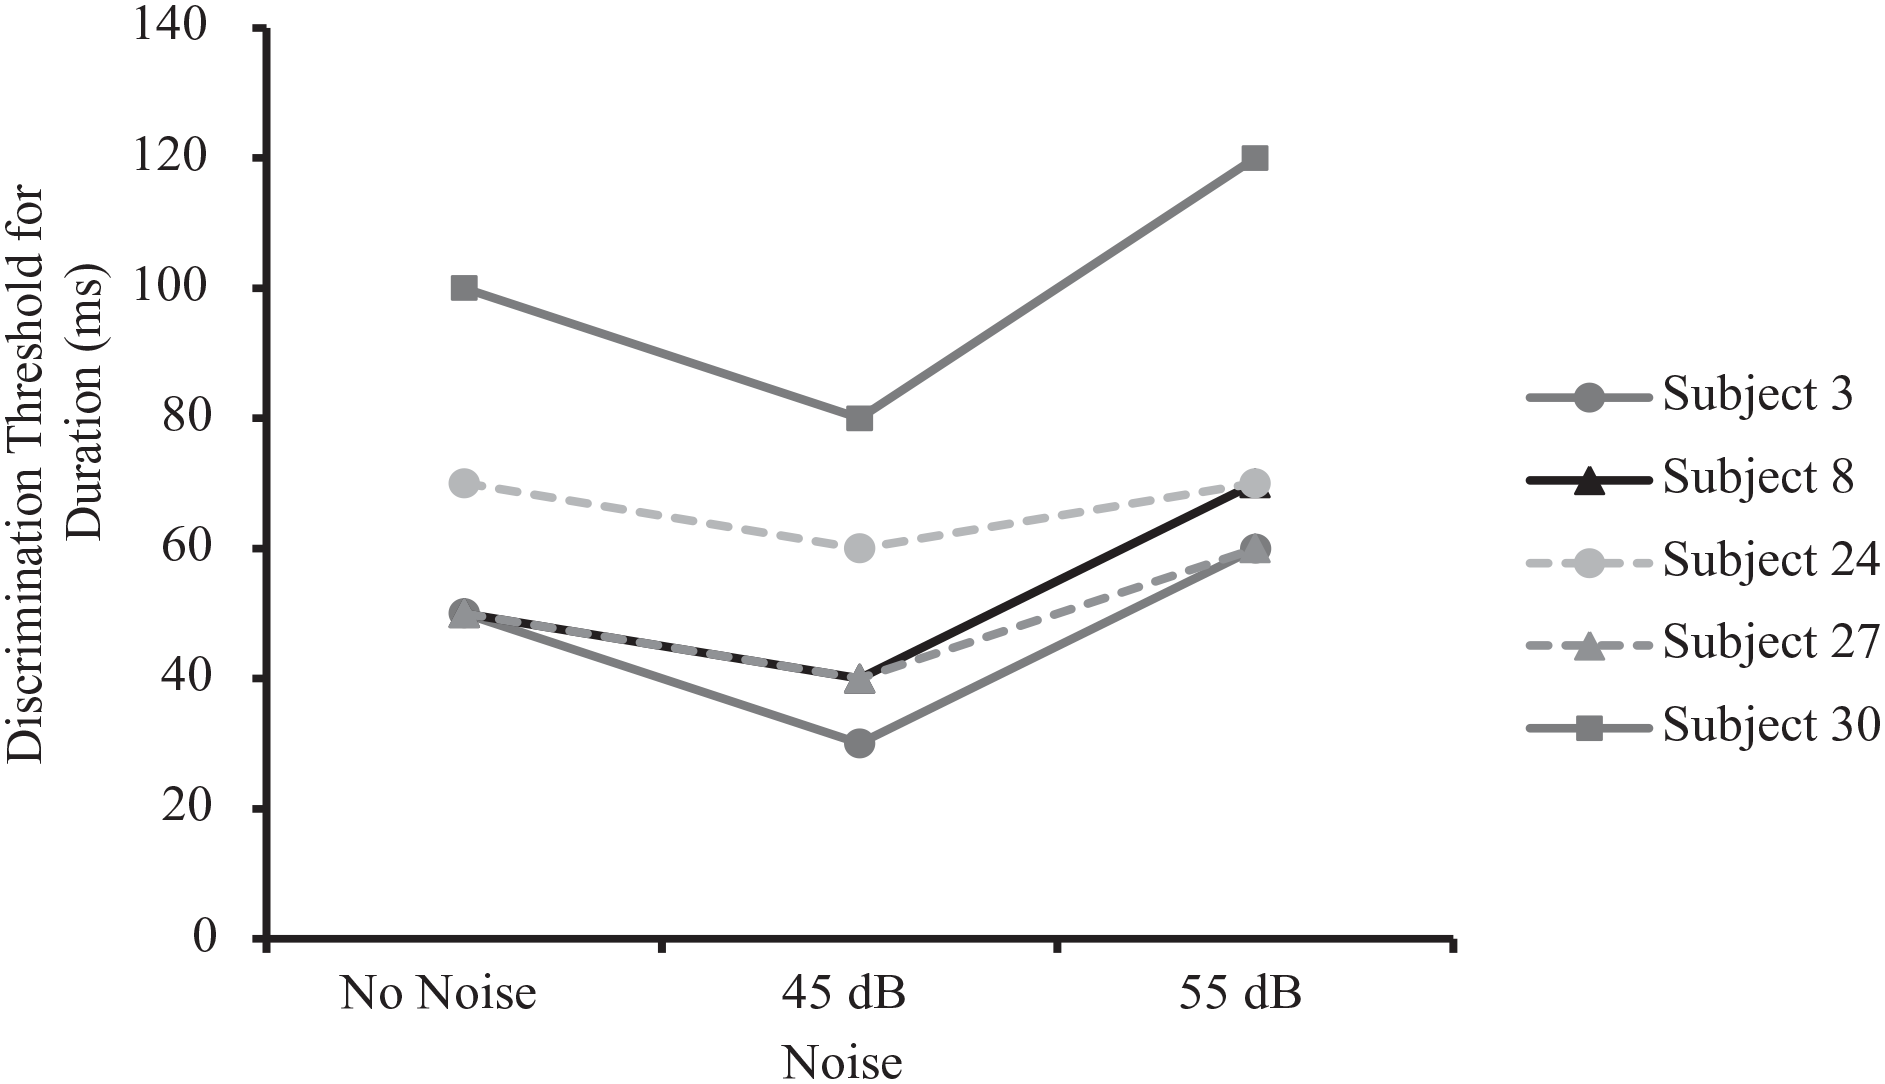
Discrimination threshold for participants who exhibited the characteristic SR-curve.
Conclusion
Results were mixed. A total of 17 of the 24 participants demonstrated an increase in tactile sensitivity when any white noise was present compared to absent, which is not significant from chance probability, p = .523. Further, the optimal noise level required for this improvement differed for each person. Five participants performed best at 45 dB, whereas nine participants performed best at 55 dB. The implication is that, to improve tactile sensitivity, the optimal noise should be measured for each person.
Footnotes
Declaration of Conflicting Interests
The author(s) declared no potential conflicts of interest with respect to the research, authorship, and/or publication of this article.
Funding
The author(s) received no financial support for the research, authorship, and/or publication of this article.