
Abstract
Situational awareness (SA) is vital for coordination and safety in complex domains. However, the lack of focus on shared SA (SSA) between teammates undermines effective teamwork. Gaze sharing allows partners to view each other’s gaze points on their respective displays while completing their tasks. Understanding how performance and SSA are influenced by gaze sharing is critical but understudied in dynamic contexts. In this study, 35 teams completed unmanned aerial vehicle (UAV) command-and-control (C2) tasks using different visualization techniques. SSA scores were the highest with the fixation trail, correlating positively with target detection accuracy. SSA scores were lower in the no gaze sharing condition and the lowest while using the fixation dot. These findings underscore the importance of visualization methods in shaping SSA and task performance. If gaze sharing is used, the results here show that there is a need to select appropriate visualization techniques to support team SSA and performance.
Introduction
Teamwork has become an essential element in dynamic, data-rich domains like aviation, military, and healthcare. Effective collaboration hinges on clear communication among team members to achieve task success and optimal performance. In many cases, these tasks may require continuous attention from team members and a set strategy to prevent any fateful accidents (e.g., medical surgeries, Salas et al., 2008). Therefore, unless teamwork is carefully considered and appropriately managed in real-time, the overall team performance may be compromised (Atweh et al., 2022).
One challenge associated with teamwork is maintaining shared situational awareness (SA)—that is, the perception of the elements in the environment within a volume of time and space, the comprehension of their meaning, and the projection of their status in the near future (Endsley, 1988). It is estimated that 88% of accidents and incidents can be attributed to lapses in SA (Endsley, 2021a). Given that poor SA has been a major contributor to human error, it poses a threat to safety-critical systems. Thus, improving SA can potentially enhance teamwork and performance (Endsley, 1988). To date, however, most research has focused on design recommendations to support team performance, with less emphasis on enhancing shared SA (Berger et al., 2023).
There is a need to have real-time mechanisms which aid team collaboration and facilitate communication. One way to gain insight of team collaboration and individual attention allocation is using eye tracking, an infrared-based technique that provides a trace of people’s eye movements (Gidlöf et al., 2013). Understanding what teammates are looking at and when can provide insight on performance that cannot be obtained through other means such as surveys, questionnaires, or debriefing questionnaires. Several eye tracking metrics have been used to measure team performance such as pupillometry metrics (Daggett et al., 2017), gaze overlap (Pietinen et al., 2010), scanpath similarity (Atweh & Riggs, 2024b; El Iskandarani et al., 2023), and cross-recurrence metrics (Atweh et al., 2023a). However, there has been limited work examining gaze sharing—that is, how to visualize eye tracking measures in real-time between teammates—and its effect on SA.
Related Work
Gaze Sharing
Gaze sharing is a means of communication used to exchange visual information between teammates as it allows partners to view each other’s gaze points on their respective displays while simultaneously completing their tasks. This overlay of teammates’ gaze points onto individual displays employs diverse visualization methods, including dots, spotlights, heatmaps, and fixation trails. Evaluation of these techniques typically considers factors such as ease of implementation, whether it is informative, and accuracy in capturing real-time eye movements (Newn et al., 2017). Although these factors are mainly influenced by the shape, color, and opacity of the visualization technique, the complexity of the display highly affects whether a representation is salient or distracting. This in turn could affect the users’ mental demand, team coordination, and performance.
Gaze sharing has demonstrated efficacy in improving performance, efficiency, task completion time, comprehension, and collaboration within teams in relatively simple, task-specific domains such as assembling puzzles (Gupta et al., 2016; Lee et al., 2017). It has enabled researchers to identify learned behaviors, where users adopt strategies by following their partners’ gaze points during task execution while completing the experiment (Niehorster et al., 2019). On another hand, gaze sharing may induce attentional costs that can potentially outweigh its benefits, resulting in less favorable outcomes (McCarley et al., 2021). As more data and elements are being incorporated into various work domains, it becomes essential to study how gaze sharing impacts individual and team performances.
Team and Shared Situational Awareness
While various tools and techniques exist for evaluating individual SA, there has been limited work extending these measures to teams. The two commonly used measures include (Endsley, 2021b):
Measuring SA has been found to provide valuable insights into the cognitive state of people while they are performing a wide variety of tasks. Researchers have attempted to measure SA in several ways such as process (e.g., communication techniques), performance (e.g., accuracy), subjective (e.g., self-rating SA), and objective (e.g., answer predetermined questions about the scenario) measures (Endsley, 2021a). Amongst the aforementioned measures, the Situation Awareness Global Assessment Technique (SAGAT) can assess team SA to determine whether the team exhibits an aggregate understanding of the critical aspects of the scenario (Endsley, 2021a).
While it is recognized in the literature that gaze sharing can be both helpful and challenging, its effectiveness and application in dynamic and data-rich domains remain uncharted territory, as well as its effect on SSA. To bridge this gap, this study assesses shared SA in a simulated complex, data-rich domain—that is, unmanned aerial vehicle (UAV) command and control (C2) operations—using two promising gaze sharing visualization techniques: fixation dot and fixation trail.
In previous work, we evaluated the effect of these visualization techniques on various aspects, including team performance, TSA, and workload. However, the assessment of SSA was not addressed (Atweh et al., 2023b; Atweh & Riggs, 2024a). Thus, the current paper focuses specifically on examining SSA and its relationship with gaze sharing techniques. We expect that our gaze visualizations will increase SSA which, in turn, will be closely correlated with improved shared task performance (Endsley, 2021b; Jing et al., 2022).
Methodology
Participants
Thirty-five teams (70 participants) of undergraduate and graduate students at the University of Virginia were recruited for this study (M = 24.5 years, SD = 4.36 years). Each pair consisted of one male and one female who did not previously know each other aiming to control the variables and reduce potential confounding factors that could influence the results. The experiment was approved by the University of Virginia’s Institutional Review Board (IRB #3480).
Experimental Setup
The design of the experimental testbed was based on the “Vigilant Spirit Control Station” the U.S. Air Force uses to develop interfaces to control multiple UAVs. The testbed was developed using Unity and ran on two desktop computers (27”, 2560 x 1440 monitor; Figure 1). Teams were collocated but were separated by a divider. Each participant viewed separate monitors and used separate mice to input responses. The testbed was networked so participants could see in real-time inputs made by their teammates (e.g., when Participant 1 clicked on the target button, Participant 2 could see the response in real-time). However, participants could not see the real-time cursor movements of their teammates. Two desktop-mounted FOVIO eye trackers with a sampling rate of 60 Hz were used to collect point of gaze data of each participant. The average degree of error for the FOVIO eye tracker (determined by the manufacturer) is 0.78° (SD = 0.59°).
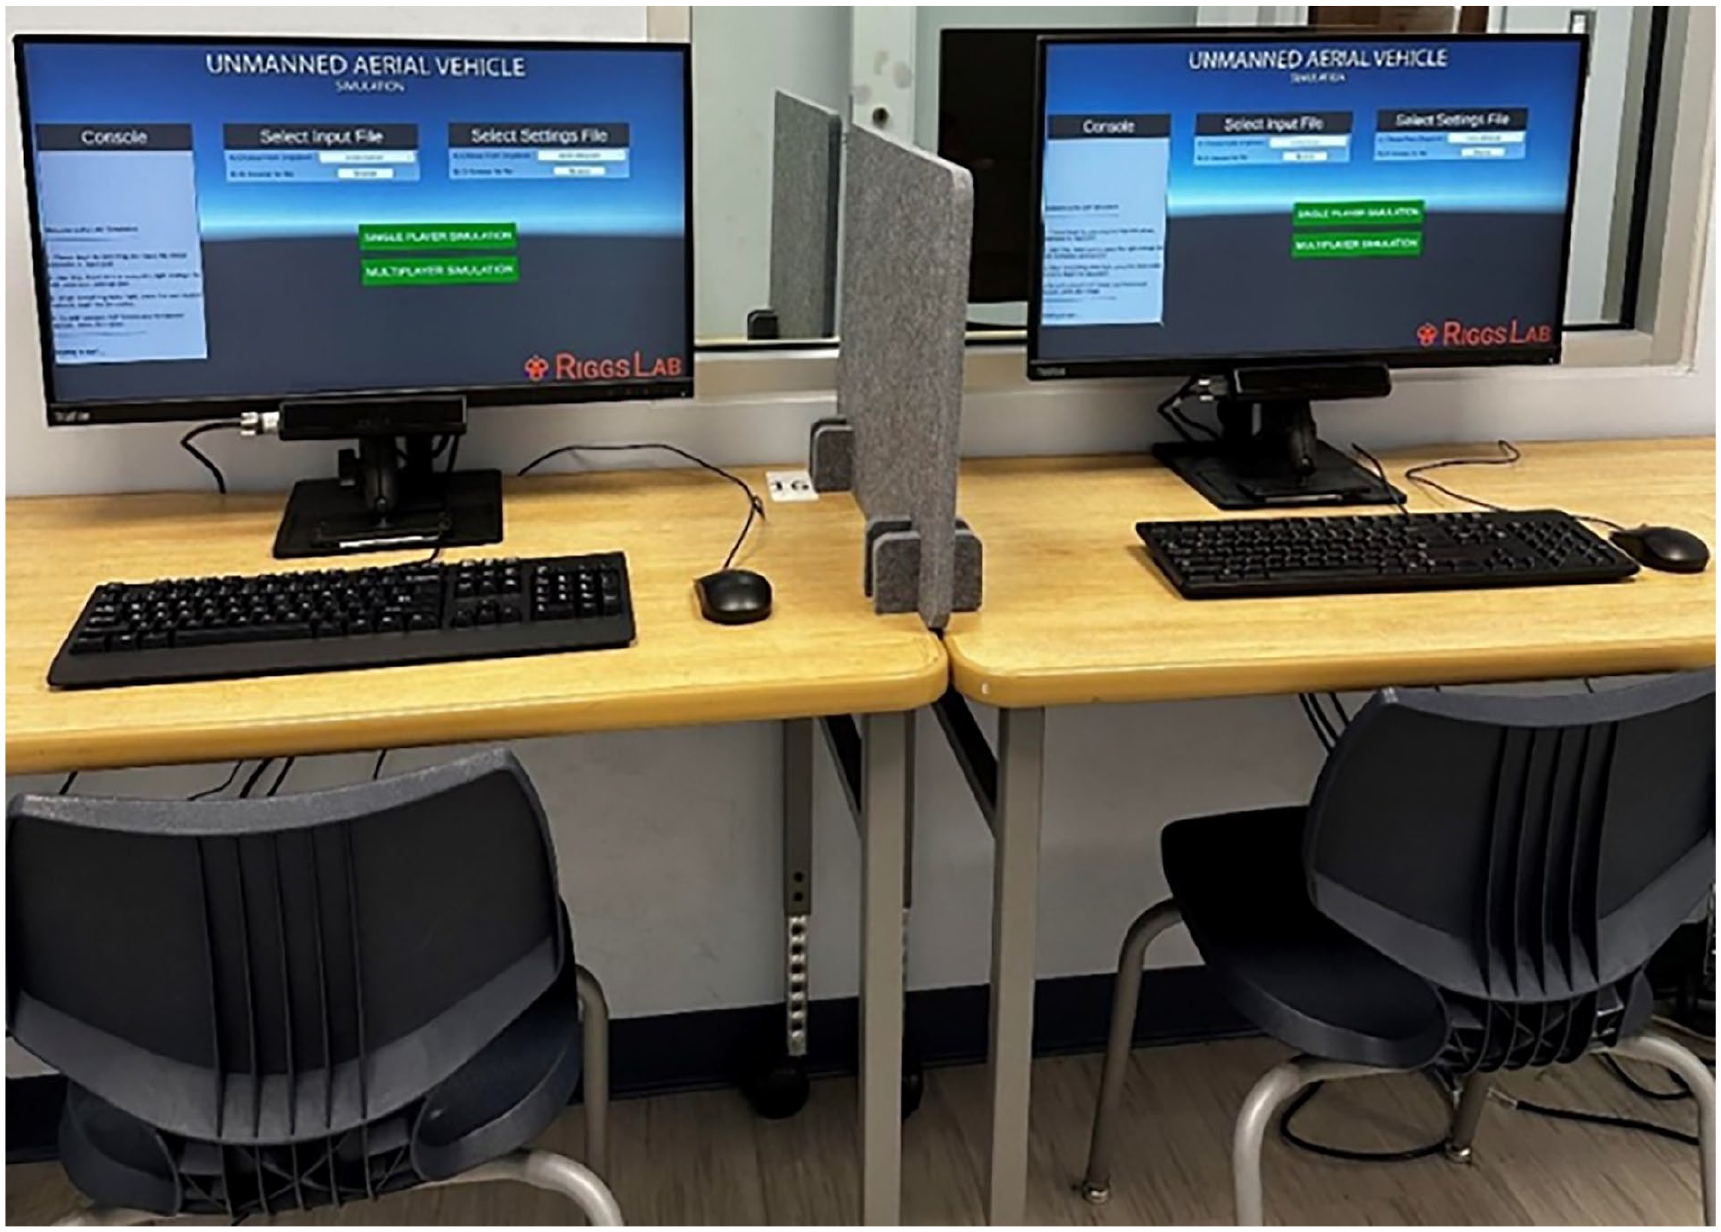
The experimental setup with the two networked desktop computers side-by-side.
UAV Tasks
Each pair was responsible for completing a primary task and three secondary tasks—that is, four tasks total—for up to 16 UAVs (Figure 2). Although all tasks were the pair’s responsibility, only one participant from each pair had to complete each task. The primary task was the target detection task where pairs monitored UAV video feeds and indicated whether a target was present (i.e., a semi-transparent cube). The participants were explicitly instructed to collaborate on the primary task to be able to capture SSA—the task of interest for this study’s analysis. The other secondary tasks included a rerouting task (avoiding UAVs flying through no-fly zones), fuel leak task (maintaining each UAV’s health), and chat message task (responding to chat messages). These tasks and their structure emulate the multitasking, dynamic nature of a UAV C2 environment. Only one participant from each pair would have to complete each instance of a task.
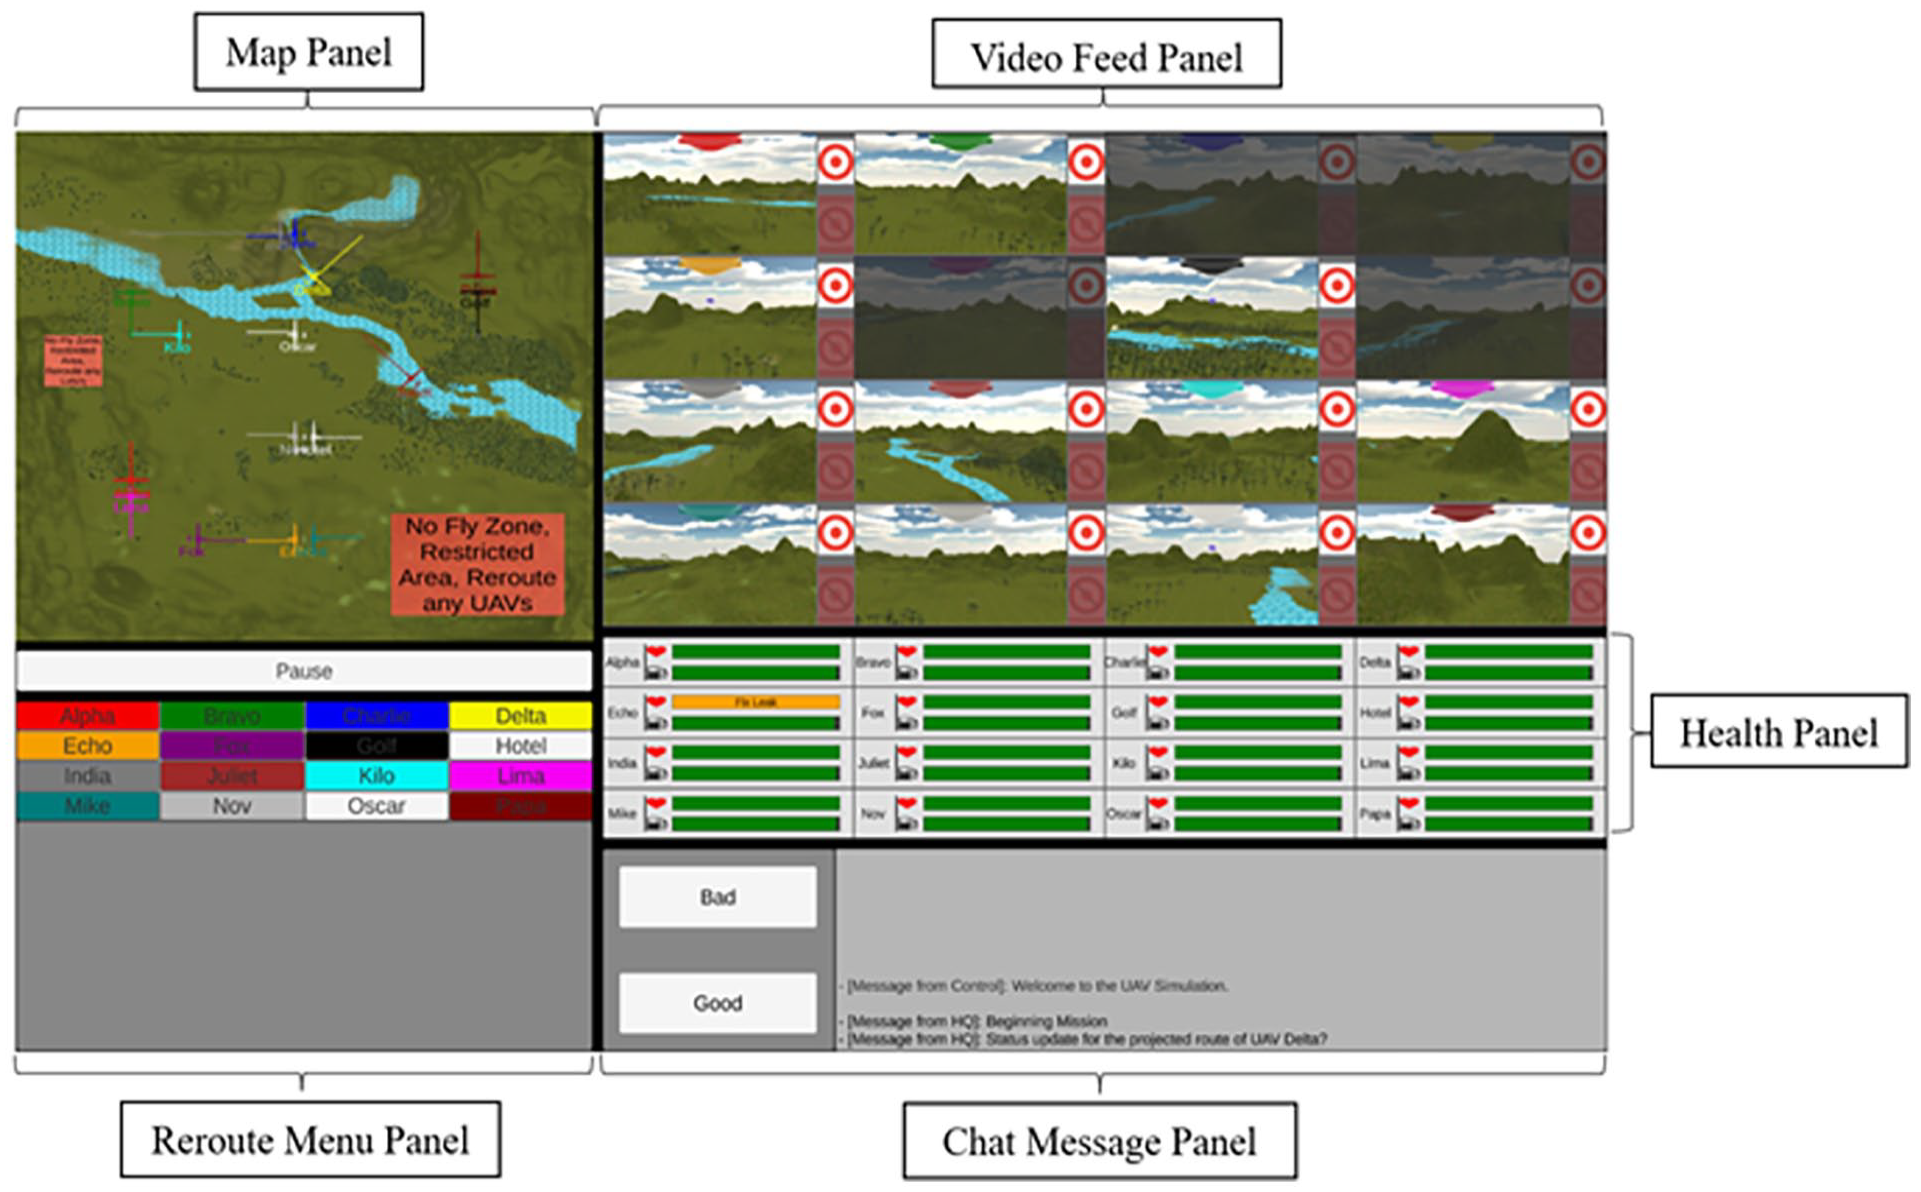
Screenshot of the UAV simulation with the four panels labeled (clockwise): Map, Video Feed, Health, Chat Message, and Reroute Panels.
Experimental Design
A within-subjects study was used. All teams completed three 15-min scenarios, one for each of the following three visualizations: (a) no gaze sharing (control condition), (b) gaze sharing with a real-time fixation dot (Figure 3a), and (c) gaze sharing using a real-time fixation trail offering a visual representation of the preceding two seconds (Newn et al., 2017; Figure 3b). The order of conditions was counterbalanced across teams to account for order effects. We maintained a consistent number of targets, reroutings, fuel leaks, and chat messages tasks across conditions. Each instance of a task was randomized within each condition. Figure 3 shows the real-time gaze sharing visualization techniques used in this study.
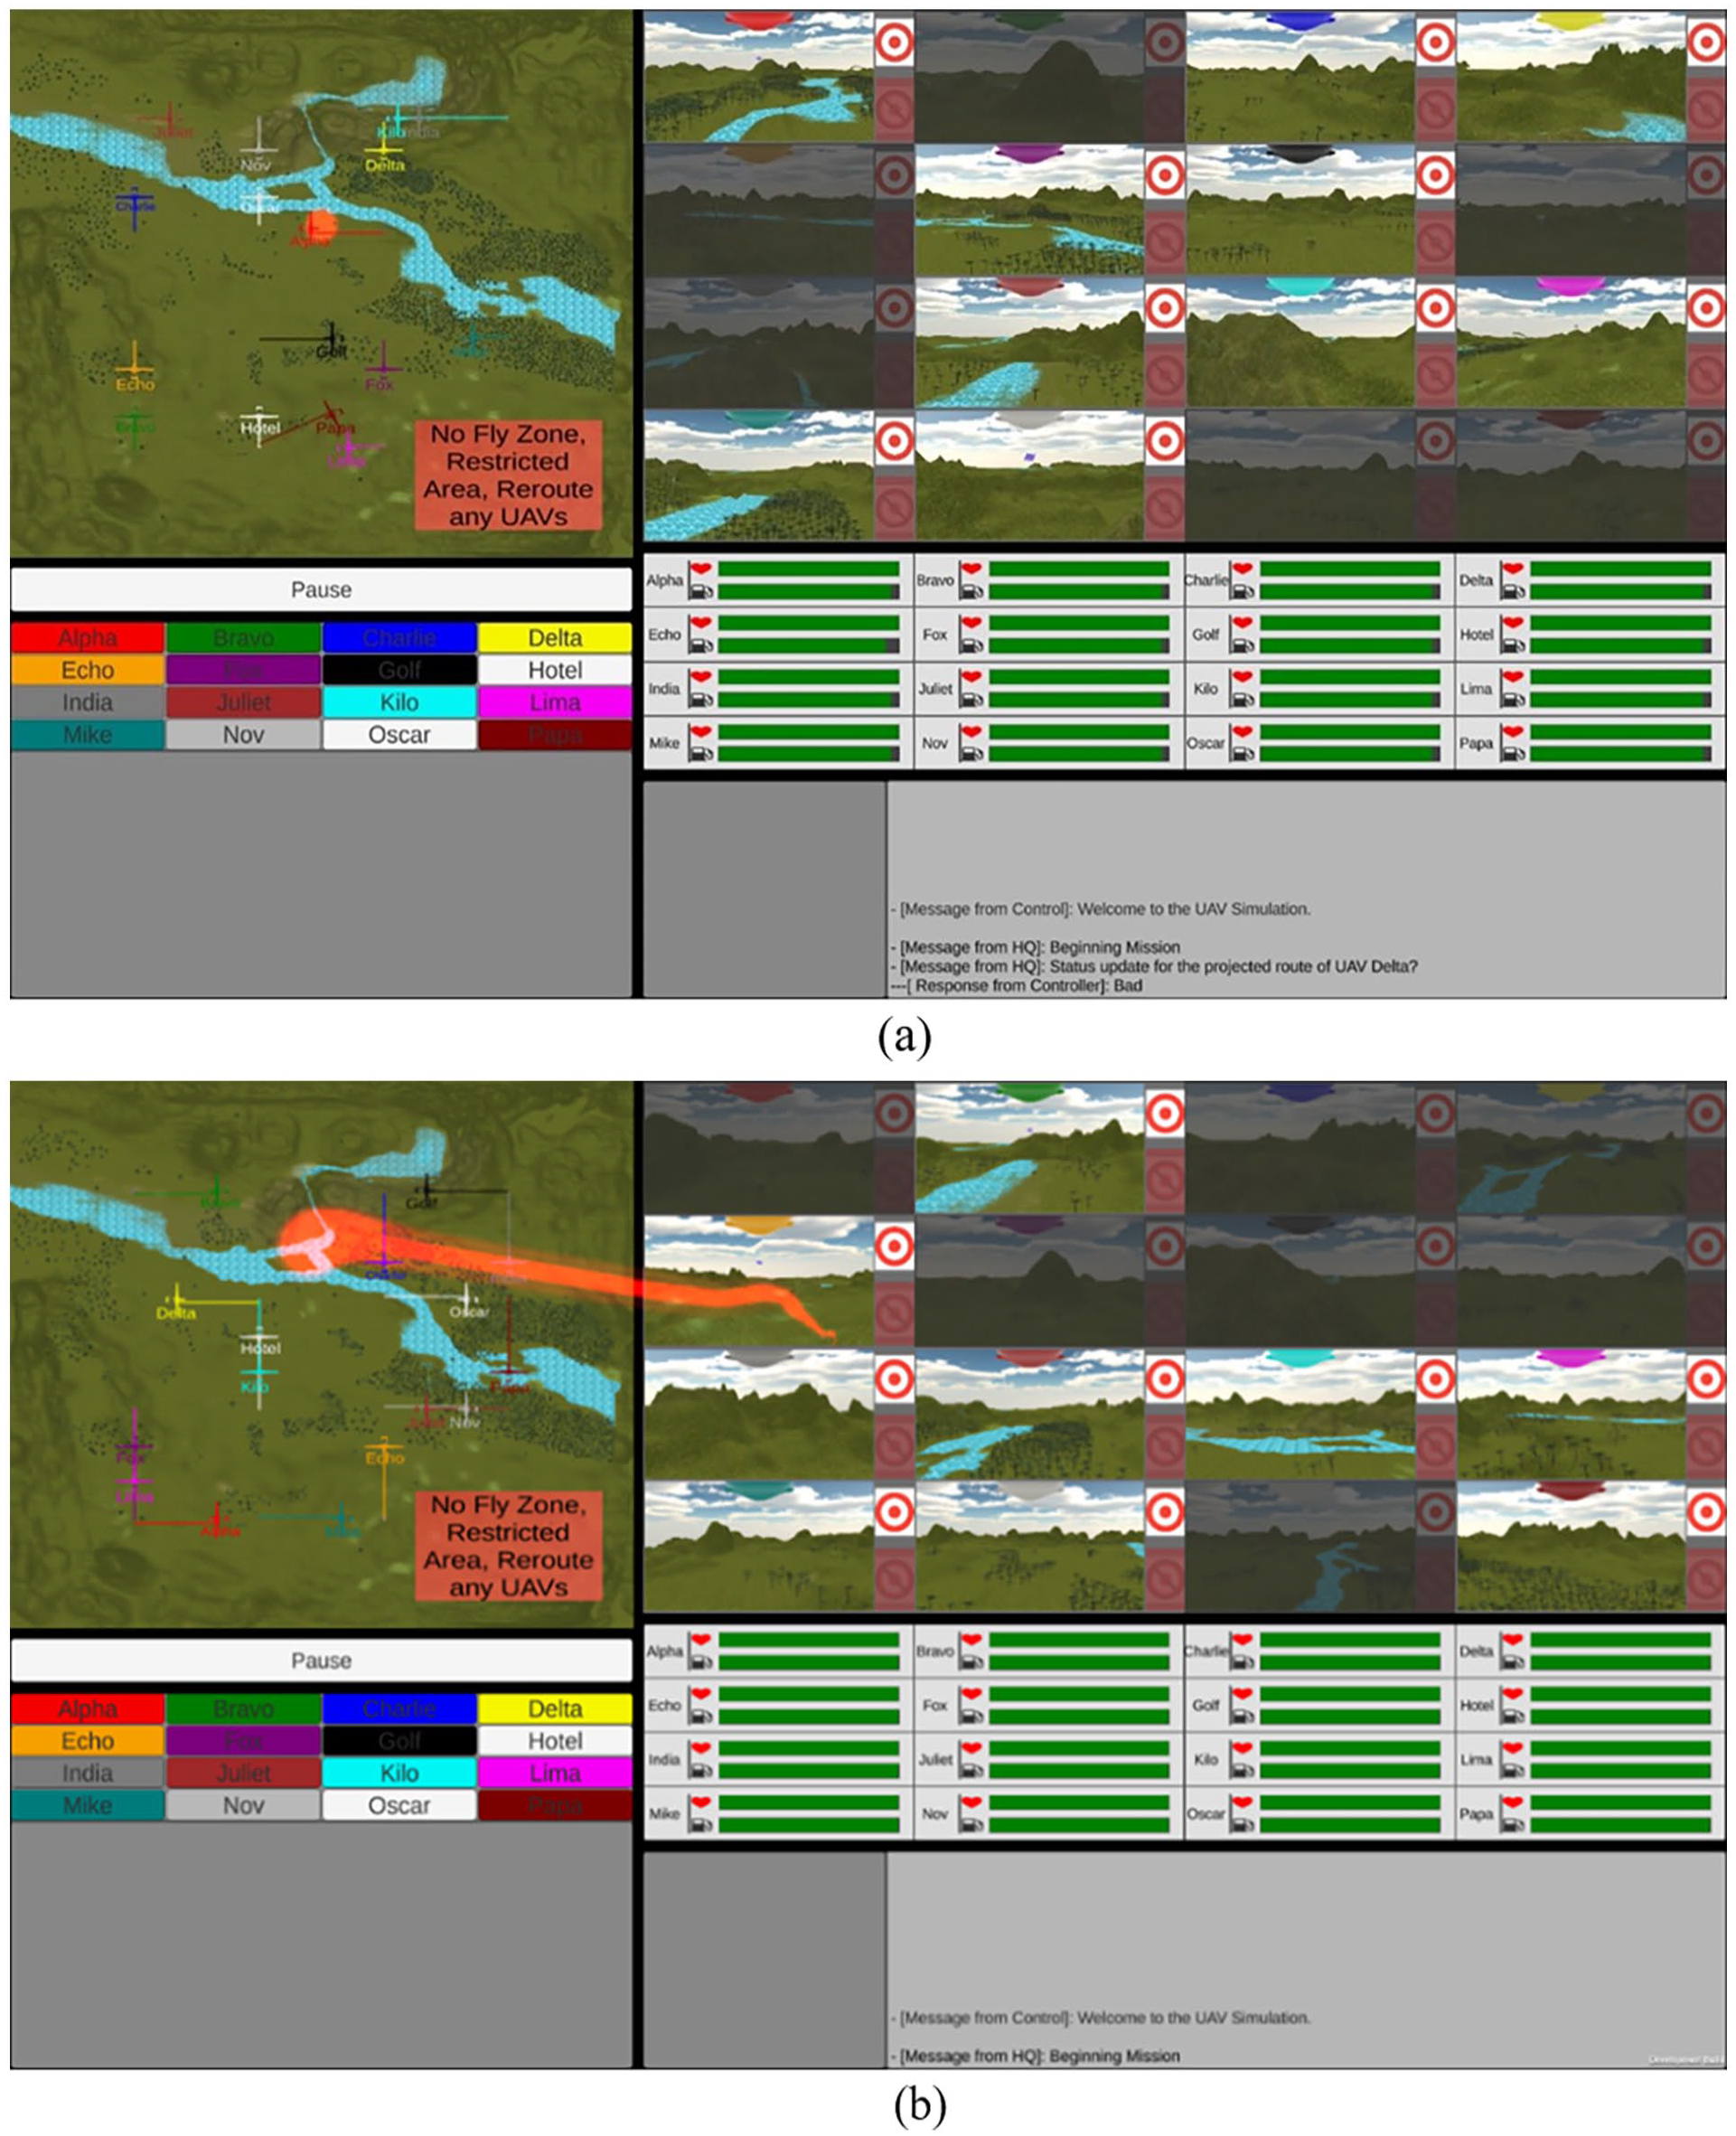
The fixation dot (a) and fixation trail (b) gaze sharing visualization techniques used in this study.
Performance and SA Measures
Performance was assessed based on the accuracy achieved in each task, rather than overall accuracy, to specifically focus on the shared tasks required for SSA. SAGAT was used to measure the SA of the participants in this study. The 13 query SAGAT used as part of this study included relevant SA queries that had been developed (Endsley, 2021b) and others we developed to ensure we assessed all SA levels [Level 1 (perception): 4 queries; Level 2 (comprehension): 4 queries; Level 3 (projection): 5 queries]. All queries were the same in all freezes across conditions; however, the specific UAVs asked about changed every time.
SA measures were derived from participants’ SAGAT query responses. Each participant’s responses were scored as correct (1 point) or incorrect (0 points) based on predefined tolerances. The mean query score for each team member across multiple freezes was determined by summing the correct responses and dividing them by the total number of freezes. In calculating SAGAT-SSA, we focused on the shared tasks identified as the primary task through 13 SAGAT queries. SSA was assessed based on the responses to five specific SAGAT queries related solely to this shared primary task. SSA analysis included instances where both teammates provided identical answers, regardless of whether those answers were correct or incorrect.
Although there are limitations to SAGAT simulation freezes, Endsley (2021a) has found that up to three SAGAT freezes that are less than 2 min during a ~20-min experimental trial is reasonable and has no effect on subsequent performance. For this study, three SAGAT freezes occurred in each 15 min scenario. We used a random-number generator to determine the freeze times to occur between 3 and 13 min into each scenario. Any freeze that was closer than 3 min to the previous freeze time was eliminated and a new random number was generated. This allowed participants to be engaged in their tasks before the SAGAT was administered, and enough time to get reengaged with the task before any subsequent SAGAT battery was presented (Endsley, 2021b).
Experimental Procedure
Participants read and signed the consent form and were briefed about the study goals, tasks that needed to be completed as a team, and how the testbed was networked. Participants were provided with an overview of the SAGAT and how it would be administered. They were instructed to answer SAGAT queries as rapidly as possible and to make their best guess even were unsure of their answer (Endsley, 2021b). Afterwards, the participants completed a 5 min training session together with a SAGAT freeze 3 min and 15 s into the session to provide teams an opportunity to practice answering the SAGAT queries before the experimental portion of the study. Each query was discussed with them, and they were allowed to ask questions if they were unsure of the meaning of any query. By the end of the training session, all participants achieved at least 70% accuracy across all tasks before they could proceed with the study. They were also provided with 3 min to discuss anything they deem necessary (e.g., strategies for secondary tasks).
Participants could not communicate verbally during the experimental session as we were interested in understanding how gaze sharing techniques would affect performance. After the training session, the teams completed three 15 min scenarios. The same tasks appeared at both stations and the actions of each team member were reflected on both workstations, but a participant could not see the cursor movements of their teammate. For each freeze, the experimenter would announce “FREEZE” and the participants would then click the pause button to freeze the scenario (Figure 2). A black screen then popped up captioned, “The Experiment is Paused. Please wait for the Conductor’s Instructions.” The experimenter gave each participant a copy of the SAGAT questionnaire which they had 2 min to complete. Following the SAGAT freeze, the participants clicked the “Resume” button to resume the scenario. The experiment session lasted 120 to 150 min and participants were each compensated $30 in gift cards for their time.
Results
Performance
Figure 4 shows the mean and standard error of the shared task accuracy (target detection task) across the 35 teams for each condition. A one-way repeated measure ANOVA with a Greenhouse-Geisser correction was conducted to test for significant differences between the three conditions. The results showed that the target detection accuracy was statistically significantly different between the three conditions (F[1.62, 55.034] = 80.72, p = .028, ηp2 = 0.11). Post hoc tests using Bonferroni corrections revealed that the target detection accuracy was statistically significantly higher using the fixation trail (mean accuracy = 93.42%) compared to the fixation dot (mean accuracy = 85.21%; p = .02) and the control condition (mean accuracy = 89.12%; p = .038). There was not a statistical difference in terms of target detection accuracy between the control and the fixation dot conditions (p = .23).
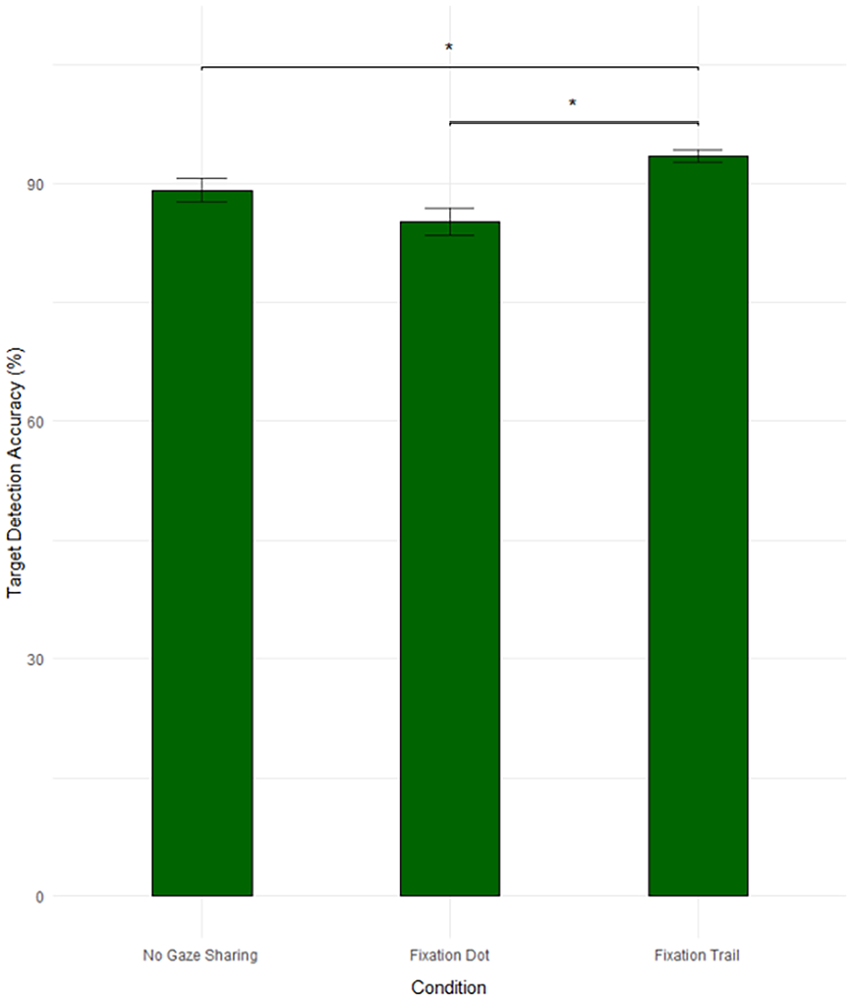
Target detection accuracy (%) for each condition. An asterisk (*) indicates a statistically significant difference between conditions.
Shared Situational Awareness
The mean SAGAT-SSA score across participants in each condition was calculated and the results (mean and SD) are reported in Table 1. The fixation trail resulted in the highest SSA score, followed by no gaze sharing and the fixation dot.
Mean SAGAT-SSA Scores Across Participants Using the Three Different Visualization Techniques (N = 35).
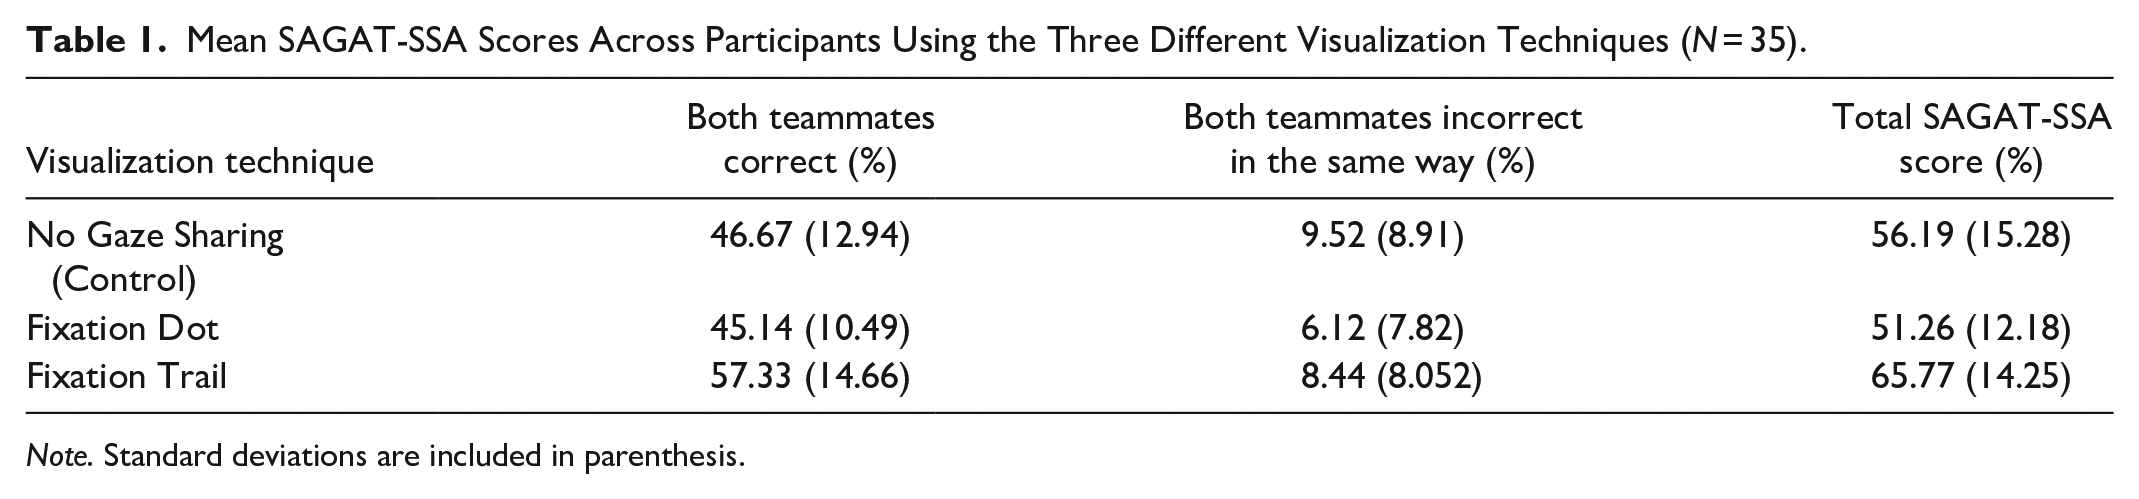
Note. Standard deviations are included in parenthesis.
A one-way repeated measures ANOVA with a Greenhouse-Geisser correction showed that the mean SAGAT-SSA scores were statistically significantly different between the three visualization techniques (F[1.66, 56.27] = 7.78, p = .002, ηp2 = 0.19). Post hoc test using the Bonferroni adjustment showed that pairs exhibited a higher level of SSA using the fixation trail than the fixation dot (p < .001). There was no difference between no gaze sharing and both the fixation dot (p = .36) and the fixation trail (p = .13) techniques.
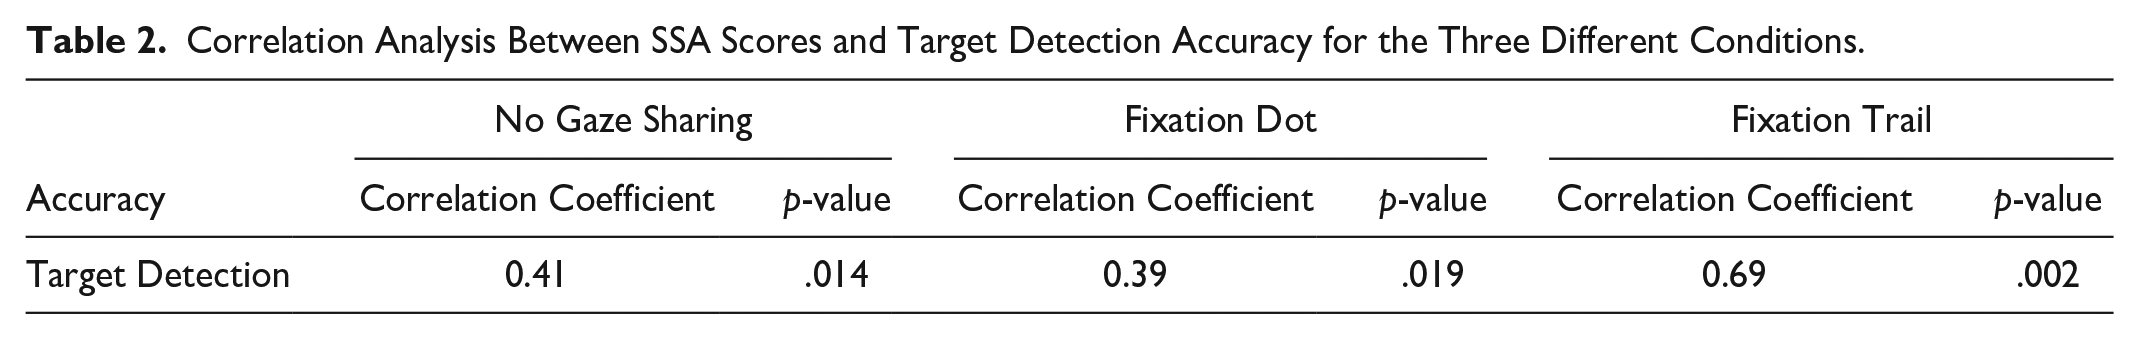
Table 2 shows the correlation coefficients and their significance levels between the SAGAT-SSA scores and target detection accuracy (i.e., the primary task participants worked on together) with the three different visualization techniques. The fixation trail showed the highest correlation coefficient of 0.689 between the SAGAT-SSA scores and target detection accuracy, which was statistically significant at p = .002. The control condition exhibited a moderate correlation coefficient of 0.41, which was significant at p = .014. The fixation dot showed a weaker correlation coefficient of 0.39, significant at p = .019.
Correlation Analysis Between SSA Scores and Target Detection Accuracy for the Three Different Conditions.
Discussion and Conclusion
The goal of this study was to examine whether real-time gaze sharing would improve performance with complex, dynamic tasks and investigate its effects on shared situational awareness (SSA). The present study explored these questions in a simulated UAV C2 task. The results here showed that the fixation trail resulted in the best shared target detection task accuracy, but the same could not be said of the fixation dot as it resulted in the worst performance—surprisingly even worse than having no gaze sharing at all. Moreover, our work here shows that teams who completed the tasks using the real-time fixation trail exhibited the highest total SSA score—which supports our initial expectation. SAGAT-SSA scores were lower in the control condition and the lowest while using the fixation dot, suggesting varying levels of effectiveness in facilitating mutual understanding among team members.
The percentage of times both teammates were incorrect in the same way was lowest in the fixation dot condition, followed by the fixation trail, and the control. Lower percentages here are desirable as they indicate fewer shared misconceptions. Although these differences were not tested statically as the aim was to focus on total SAGAT-SSA scores, the fixation dot’s lower percentage might imply it reduces shared errors more effectively compared to the control and fixation trail conditions. However, this technique did not lead to the highest total SAGAT-SSA score, suggesting that while it might reduce shared misconceptions, it may not sufficiently enhance overall SSA to the same extent as the fixation trail.
These findings underscore the nuanced impact of different gaze sharing techniques on SSA and task performance. While the fixation trail demonstrated superior shared task accuracy, the unexpected underperformance associated with the fixation dot suggests potential limitations or distractions inherent in its design. The fixation trail’s improved SSA levels may be due to its ability to provide continuous and contextualized visual feedback. Unlike the fixation dot method, which offers discrete points of gaze fixation, the fixation trail technique presents a sequential and temporally extended representation of gaze movements. This continuous visualization not only captures individual gaze points but also illustrates the trajectory of attention over time, facilitating a more comprehensive understanding of teammates’ focus and intentions. This continuous feedback fostered better shared mental models among team members. Moreover, the fixation trail technique might have facilitated smoother information processing and integration among team members by providing a visual narrative of attentional patterns, which the dot did not offer. This narrative not only enhances perception but also aids in the prediction of teammates’ behaviors and decision-making processes. Consequently, team members using the fixation trail technique seemed to be better equipped to anticipate each other’s actions and intentions, leading to more effective coordination and task performance. Future investigation into the underlying factors contributing to these disparities could inform the refinement of gaze sharing methodologies for optimized task performance.
The analysis shows that the fixation trail exhibits a robust and statistically significant correlation with target detection accuracy. This finding aligns with expectations, given that pairs collaborated on the primary task collectively, while other tasks were divided. The significance of the strong correlation (i.e., >0.6) exclusively observed in the fixation trail condition underscores its unique efficacy in enhancing shared task performance. This suggests that when the trail is implemented, a stronger association between SSA and the shared task performance is evident. The trail’s ability to provide continuous and contextualized visual feedback likely contributes to a higher correlation. By offering a comprehensive depiction of teammates’ attentional dynamics, the fixation trail fosters a deeper shared understanding of the primary task. This in turn led to more effective collaboration. Consequently, the strong correlation observed in the fixation trail condition highlights its pivotal role in facilitating task-specific performance by promoting heightened SSA levels among team members.
In complex and dynamic domains such as UAV tasks, where rapid decision-making and effective collaboration are paramount, the selection of appropriate visualization techniques can significantly influence team outcomes. The trail was the only technique associated with both high SSA and high performance, whereas the dot was associated with the lowest SSA and performance. This highlights the critical role of SSA in driving superior joint performance outcomes, which is where the fixation trail excelled, while the fixation dot and the control condition fell short. This is consistent with the literature, which suggests that high SA is one of several measures known to improve performance (Bolstad et al., 2010; Reinerman-Jones et al., 2019). The fixation dot visualization alone might have lacked the necessary richness and clarity to support effective coordination and decision-making within teams.
By recognizing the nuanced interplay between visualization methods and their impact on SSA and task performance, interface designers can tailor their choices to suit specific task requirements and team dynamics. These insights hold profound significance across a spectrum of complex domains, from military to air traffic control, where effective collaboration and SA are paramount. The findings presented here offer a robust foundation for advancing the design and implementation of collaborative systems across diverse domains. As we navigate increasingly complex and interconnected environments, the pursuit of effective collaboration remains a cornerstone of success, making the implications of our research invaluable in addressing the challenges of the modern world.
Footnotes
Declaration of Conflicting Interests
The author(s) declared no potential conflicts of interest with respect to the research, authorship, and/or publication of this article.
Funding
The author(s) disclosed receipt of the following financial support for the research, authorship, and/or publication of this article: This study was supported by the National Science Foundation (NSF grant: #2008680; Program Manager: Dr. Dan Cosley).