
Abstract
The identification of a single neuroelectrophysiological measure of differential performance across time in a fatigued state remains elusive, especially where a single marker would need to be reliable and generalizable across a variety of tasks with varying demands (e.g., perceptual, cognitive). Here, we propose assays of occipital multiscale entropy (MSE) as one such putative marker. Toward this end, we aimed to determine if differential patterns of occipital MSE between good and poor performers generalized across fatiguing perceptual (a 10-minute psychomotor vigilance test) and cognitive (“Greebles” task, involving classification and decision-making) tasks, finding significant MSE differences across good and poor performers in these disparate tasks at multiple MSE timescales. Based on this converging evidence, we frame occipital MSE as a potential fatigue marker that is generalizable across task type.
Cognitive fatigue is an insidious factor that leads to performance degradations and safety risks in our daily lives and at the workplace. As a result, researchers and engineers have developed several approaches toward objectively assessing fatigue with the aim of enhancing fatigue risk management (Laverghetta et al., 2023). One of these approaches includes the use of electroencephalogram (EEG) that can be unobtrusively measured with commercial-grade devices and provides enhanced temporal granularity. However, the identification of a single neuroelectrophysiological measure of differential performance or performance change over time in a fatigued state remains elusive, especially where a single marker would need to be reliable and generalizable across a variety of tasks with varying demands. Here, we propose assays of midline occipital multiscale entropy (MSE) as one putative marker. Toward this end, we aimed to determine if differential patterns of occipital MSE between fast and slow performers generalized across fatiguing perceptual and cognitive tasks.
MSE is a measure of signal regularity and complexity at multiple timescales (TS) and frequency bands. The benefit of MSE over single time scale entropic assays is that the multiple TS used in MSE provide linkage to brain rhythms occurring at different frequencies. Lower MSE TS are influenced by all frequencies from > 0 through high gamma (100+ Hz, given a high enough EEG sampling rate), and increasing higher TS are influenced by an increasing lower frequency ceiling, with the longest TS influenced solely by slow wave activity (Busa & van Emmerik, 2016; Kuntzelman et al., 2018; Szostakiwskyj et al., 2017; see also Costa et al., 2002, 2005). We (Rhodes et al., 2024) previously demonstrated that MSE differed significantly between fast and slow responders in later portions of a Psychomotor Vigilance Test (PVT), widely used as a gold-standard measure of sleep deprivation-related fatigue, and commonly used to assay fatigue more broadly, including decreased alertness and time-on-task fatigue (Basner et al., 2021; Dinges & Powell, 1985; see also Gunzelmann et al., 2010 for a broader discussion of time-on-task fatigue), with this difference most pronounced over midline occipital cortex (EEG sensor Oz). Broadly, slow PVT performers exhibited greater MSE at longer timescales (TS), indicating this difference was rooted predominantly in slow wave (≤ ≈8 Hz) theta (θ, 4–8 Hz) and delta (δ, 0–4 Hz) band activity. This provides converging evidence that slower neural oscillations are strong and reliable markers of fatigue as, notably, we and others have previously reported that amplitude in these slower bands increases during fatigue and slow-wave sleep (Betta et al., 2021; Hilditch et al., 2023; Miskovic et al., 2018).
More specifically, alpha (α, 8–13 Hz) rhythms at occipital cortices predominate when individuals are in awake though restful states, and also occur during fatigue but decrease during sleep (Moghadam & Maleki, 2023; Neu et al., 2014; Zhai et al., 2022). In neurotypical individuals, temporal and parietal lobe θ rhythms increase with fatigue onset and δ rhythms increase with deeper fatigue and with sleep onset, continuing during slow-wave sleep (Liu et al., 2021; Moghadam & Maleki, 2023), though these rhythms are also evident in occipital cortices (Bröhl & Kayser, 2021; Jap et al., 2009). Given our aim of selecting a single candidate EEG sensor as a reliable index of fatigue onset, we focus on θ and δ activity assayed at midline occipital cortices (EEG sensor Oz)—setting aside the canonical temporal and parietal locations typically used in assaying slow wave activity—as our previous work indicated the strongest fatigue-related slow wave entropic differences between fast and slow PVT performers occurred at sensor Oz (Rhodes et al., 2024).
In the current work, and separately for fast and slow performers, we assayed occipital MSE differences in eyes-closed EEG data between continuous 2-minute EEG chunks before (pre-) and after (post-) participants completed a relatively more challenging (as compared to the PVT) cognitive task to determine if our previously-observed fast versus slow PVT performer occipital MSE differences generalize across the two tasks. We focus on the longer MSE TS as these are associated with slow wave activity, devoid of influence by higher frequency gamma (γ, 30+ Hz) and beta (β, 13–30 Hz) activity. Here, through a set of exploratory analyses we aimed to determine (1) if there were significant differences in pre- versus post-task occipital MSE between fast and slow performers in this new task, (2) if any significant differences were in the same direction as those observed in the PVT, and, if so, (3) what specific timescales/frequency bands differed significantly between fast and slow performers in both tasks. Significant findings, particularly for our second and third aims, would provide converging evidence and an initial validation of occipital MSE as a robust and reliable generalized marker of time-on-task fatigue-related performance differences across tasks widely disparate in their neural demands.
Method
Participants
PVT
Thirty-four individuals (Mage = 22.60; SDage = 4.08) from the University of Dayton and the local community were recruited in exchange for monetary compensation. This project was approved by the institutional review boards of the Air Force Research Laboratory (AFRL) and University of Dayton. All participants provided written informed consent in accordance with the Declaration of Helsinki.
Greebles
Thirty-seven individuals (Mage = 19.94; SDage = 2.04) from Carnegie Mellon University (CMU) participated in exchange for either college credit or monetary compensation. This project was approved by the institutional review board of CMU as part of the Center of Excellence between CMU and AFRL. All participants completed an abbreviated informed consent document in accordance with the Declaration of Helsinki.
Procedure and Materials
PVT
On each trial, the task presented a millisecond counter on screen (Figure 1), and participants responded via button press (“J”) as quickly as possible after stimulus onset. The interstimulus interval was randomized between 2 and 10 s to avoid prediction of the time of trial onset. For a full task description see Borghetti et al. (2021) and Rhodes et al. (2024).
The PVT millisecond timer.
Greebles
The Greebles task evaluated the effect of mind-type stereotypes on decisions to share or withhold a rare resource. Two colonies of human-like alien beings (“Greebles,” e.g., Duchaine et al., 2004; Gauthier et al., 1998; see Figure 2) possessed either sophisticated- or simplistic-minds, with the former likely to better allocate the rare resource than the latter. Mind-type stereotypes were probabilistically assigned to colony membership rendering these relations somewhat uncertain. For example, stimuli with upward appendages belonged to the Greebles colony and were assigned 66% of the time to the sophisticated mind-type, and otherwise to a simplistic mind-type. Conversely, Animodes, a Greeble variant with downward appendages, were assigned 66% of the time to simplistic mind-types, and otherwise to a sophisticated mind-type. Appendage orientation to Greebles or Animodes was counterbalanced across conditions. Mind-type stereotype knowledge was manipulated in three ways, (1) not provided but assumed to be judged implicitly; (2) not provided but explicitly self-judged by the participant; or (3) provided to the participant. For the present work, we focused on reaction times (RTs) for a Greeble/Animode categorization decision present in all trials.
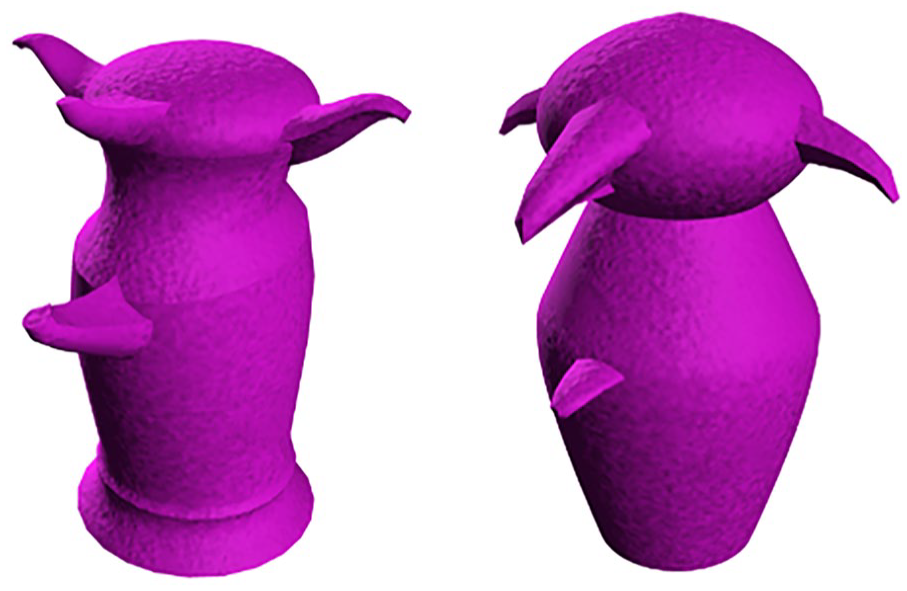
Exemplar stimuli. Left: an “up” Greeble; Right: a “down” Animode.
EEG Recording
For both tasks, EEG was recorded at 512 Hz on a 64-channel BioSemi ActiveTwo system (BioSemi, Amsterdam, Netherlands, Europe) using a 64-bit PC, with electrodes placed according to the international 10 to 20 system. Six additional sensors were placed, one each on the mastoids, one each distal to each eye, and one each above and below the left eye. Voltage offsets were reduced to less than ± 40 mV and Common Mode Sense (CMS) and Driven Right Leg (DRL) electrodes circuits were used as a reference during recording and later re-referenced to the mean of the mastoids. Data were bandpass filtered above 0.1 Hz and cleaned with independent component analysis (ICA) (PVT, fastica, Nolan et al., 2010; Greebles, Picard ICA, Ablin et al., 2018) in EEGLAB (Delorme & Makeig, 2004) and with custom in-house MATLAB scripts.
Performance Grouping Strategy
PVT
As is common with PVT analyses, exceedingly short and long RTs were omitted from analyses (e.g., Borghetti et al., 2021; Jung et al., 2011), with our included RTs being ≥ 200 ms and ≤ 500 ms. Participants were divided into Fast and Slow performance groups (n = 17 per group) based on a median split of RTs for all trials, with the cut point between groups calculated at 326.8 ms.
Greebles
Participants were also divided into Fast and Slow performance groups (Fast n = 19; Slow n = 18) based on a median split of RTs for Greeble/Animode classification, with the cut point between groups calculated at 967.9 ms.
Statistical Analyses
PVT
Separately for Fast and Slow performers, EEG data were divided into five chronological 2-minute bins, and MSE was calculated at sensor Oz (midline occipital cortex) for Bins 1 and 4 (avoiding potential end-spurt effects in Bin 5, e.g., Morris et al., 2020, 2022). For each group, Bin 1 MSE was subtracted from Bin 4 to create a Bin 1 versus 4 difference metric across these time periods.
Greebles
Separately for Fast and Slow performers, MSE at sensor Oz was calculated for 2-minute eyes-closed resting state EEG collected immediately prior to and after the main task. Post-task MSE was subtracted from pre-task MSE to create a difference metric.
For both tasks, MSE was calculated at each time scale between TS 1 and TS 300. At the first timescale, TS 1, consecutive EEG data points affect MSE pattern matching, at TS 2 every second data point is used, and at TS n, every nth data point is used. At the longest time scale, TS 300, the highest frequency evaluated is ≈1.71 Hz, and 2 min of EEG data contains ≈ 70.18 full waveform cycles at that frequency. In these analyses, γ influences MSE TS 1–17, β influences TS 1–39, α influences TS 1–64, θ influences TS 1–128, and δ activity influences TS 1–300. The entropy embedding dimension m was set to 1 and the threshold value r to 0.5. A full description of MSE mathematics is presented in Heisz et al. (2012); see also Rhodes et al. (2024) and Richman and Moorman (2000). Mass univariate statistics (e.g., Groppe et al., 2011a, 2011b) were used to correct p values across the 300 TS assayed in both tasks. All analyses were conducted in R (version 4.2.2, R Core Team, 2022) and MATLAB (version R 2022b).
Results
PVT
Across all five Bins, RTs were significantly slower for Slow (M = 355 ms, SD = 25 ms) relative to Fast (M = 305 ms, SD = 20 ms) performers, t(32) = 40.84, p < .001.
As depicted in Figure 3, at sensor Oz, we observed greater Bin 4 minus Bin 1 MSE differences for Slow relative to Fast performers from ≈ TS 45 to 290, with a combination of significant and trend differences in that range.
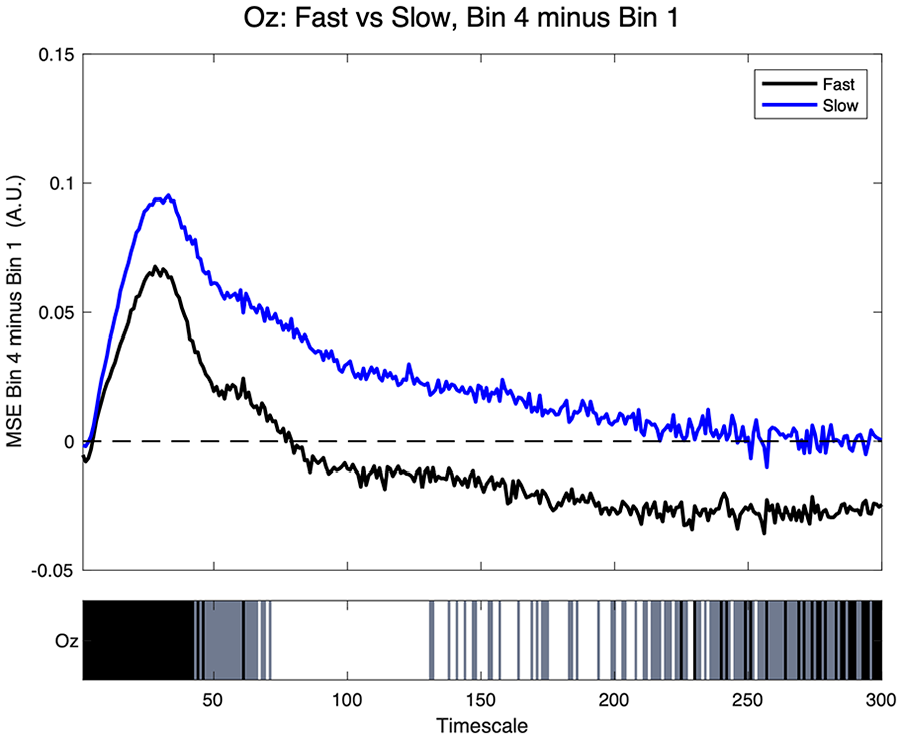
PVT fast versus slow MSE at sensor Oz. Top: positive values indicate greater MSE in Bin 4 compared to Bin 1. Bottom: significance at each timescale—white (p ≤ 05), gray (trend at p > .05 and ≤ 0.10), and black = ns.
Greebles
RTs were significantly slower for Slow (M = 1,196 ms, SD = 247 ms) compared to Fast (M = 730 ms, SD = 135 ms) performers, t(35) = 7.17, p < .001.
As illustrated in Figure 4, occipital pre- minus post-task eyes-closed Oz MSE differed intermittently between fast and slow participants in the current task across three broad TS clusters, between ~TS 25–50, TS 65–80, and TS 175–275, indicting roles of β, α, θ, and δ activity in the first cluster, θ and δ in the second cluster, and δ activity in the third cluster.
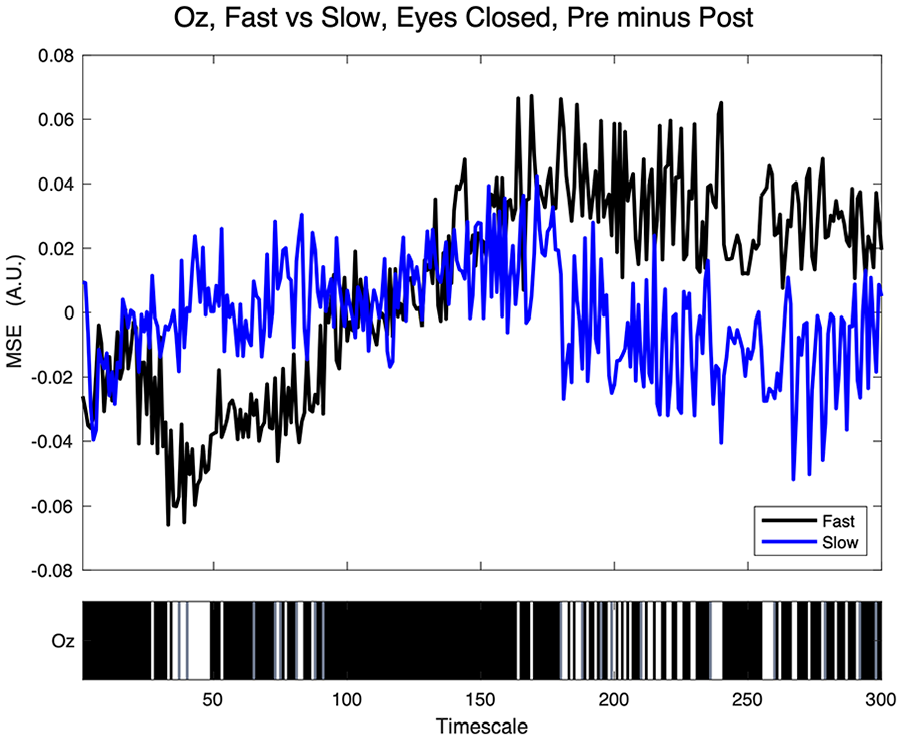
Greebles fast versus slow MSE at sensor Oz. Top: positive values indicate greater pre- relative to post-task eyes-closed MSE. Bottom: significance at each timescale—white (p ≤ .05), gray (trend at p > .05 and ≤ 0.10), and black = ns.
Cross-Task MSE
Having observed significant MSE differences between Fast and Slow performers in both tasks, we next compared, by TS, the PVT and Greebles MSE, observing two broad TS clusters where fast versus slow occipital MSE differences were significant in both tasks. In calculating MSE TS significance across both tasks, we first set any trend differences in each task to zero (nonsignificant) to maintain a conservative cross-task comparison. Illustrated in Figure 5, the first TS cluster significant in both tasks, between TS ≈ 65–80, is influenced by θ and δ activity whereas the second cluster, between ≈TS 175–225, is influenced solely by δ-band activity.
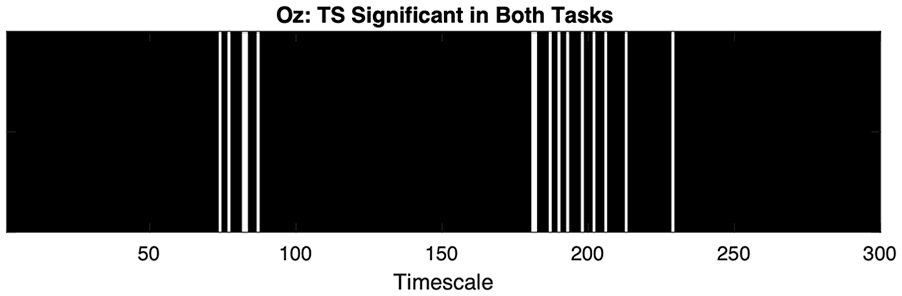
White bars indicate Oz MSE TS significant in both tasks. TS indicated in black indicate trends (p > .05 and ≤ 0.10) or ns in across both tasks.
Discussion
We explored whether a single-sensor MSE assay at midline occipital cortex is sufficient and reliable in detecting neuroelectrophysiological correlates of behavioral differences between fast and slow performers across time in two tasks, one perceptual, the other cognitive. Here, we asked (1) if there were significant occipital MSE differences between Fast and Slow performers in the Greebles task, (2) if any significant MSE differences were in the same direction in the PVT, and (3) what specific TS (and associated frequency bands) differed significantly between Fast and Slow performers across these tasks. Findings affirmed the first of these questions, with fast versus slow differences occurring at TS influenced by β, α, θ, and δ activity. The second research question was partially affirmed, with Slow performers in both tasks exhibiting greater MSE later in the tasks at longer TS (>≈175) influenced by δ activity. On the other hand, the pattern was reversed for shorter TS, with opposite patterns across tasks at the shorter TS influenced by a slightly wider spectrum of frequency bands, namely θ and δ. For our third research question, findings reveal that differential θ and δ activity (at TS ≈ 65–80 and ≈175–225) occur in both tasks, with δ activity at longer TS changing in the same direction across time in both tasks.
In total, these findings, especially for our second and third questions, yield converging evidence and an initial validation that occipital MSE is a robust and reliable generalized marker of time-on-task fatigue-related performance differences across tasks with varied demands (PVT, largely perceptual; Greebles, largely cognitive).
Additionally, these findings, generally fulfilling the expectations of our tripartite research question, provide converging evidence that (1) occipital MSE is a strong and generalizable marker of fatigue onset across tasks, and that (2) the θ and δ frequency bands associated with our MSE findings in both tasks converge on previous work implicating these slower frequencies in fatigue and slow-wave sleep (Betta et al., 2021; Hilditch et al., 2023; Miskovic et al., 2018). In total, the present work suggests occipital MSE, especially at longer TS (influenced by θ and δ band frequencies), is a robust and reliable marker of differential performance in tasks with differing demands (e.g., perceptual vs. cognitive) and that, pending additional validation in future work, MSE assays from one task might have predictive value for performance on additional tasks with further divergent parameters and neural demands.
These significant cross-task findings for TS influenced by θ and δ are unsurprising given the roles of those frequencies in fatigue (e.g., Hilditch et al., 2023; Miskovic et al., 2018). On the other hand, no significant cross-task MSE differences were observed in TS influenced by α rhythms (TS 1–64). This is somewhat surprising given the presence of occipital α rhythms in fatigue (Moghadam & Maleki, 2023; Neu et al., 2014). This said, we did observe significant fast versus slow TS differences in that range for the Greebles study, whereas this difference merely trended toward significance in the PVT. It could be that α activity, and thus TS influenced by it, vary more based on task demands than do θ and δ and their associated TS.
There are several limitations to the present work. First, we focused on a single occipital sensor (Oz) given our previous MSE findings in the PVT (Rhodes et al., 2024). Given that temporal and parietal cortices are traditionally used in assaying fatigue and sleep related θ and δ activity (Liu et al., 2021; Moghadam & Maleki, 2023), it remains possible that stronger or different MSE patterns reflecting θ and δ activity may have occurred across those cortices (even while occipital cortices do routinely demonstrate slow wave activity, e.g., Bröhl & Kayser, 2021; Jap et al., 2009). A related potential limitation is our focus on detecting a reliable single sensor metric of fatigue onset. It is probable that a multisensor approach across more cortical real estate would yield additional electrophysiological nuance about changes across time as an individual transitions from an alert to a fatigued state—even before that individual is subjectively aware of fatigue onset. This said, based on our previous PVT MSE work, the pattern of findings between fast and slow performers at other sensors (e.g., midline frontal, central, and parietal) would be expected to generally follow those observed at Oz. Further, conducting MSE statistics is computationally expensive, time consuming, and cannot be conducted in real time even with a single EEG sensor.
In future work, as computing techniques and processes advance, it may be possible to use near real-time assessments of occipital MSE during a task to identify if operators are likely to be slow versus fast performers and to implement mitigation efforts in real-time, such as having an autonomous aid suggest a short rest break to allay time-on-task fatigue and maintain acceptable task performance. Additional future work could build off of our previous predictive models of fatigue using γ spectral power (Borghetti et al., 2024) through incorporating assays of occipital MSE into the models. Finally, the complementary MSE findings across both of our tasks serve to narrow the investigatory focus of future frequency-domain fatigue work through highlighting the role of slower-band θ and δ activity in fatigue onset and differential performance across time as fatigue sets in.
Footnotes
Acknowledgements
The opinions expressed herein are solely those of the authors and do not represent the official positions of the United States Government, the U.S. Department of Defense, the U.S. Air Force, or any of their subsidiaries or employees. Distribution A. Approved for public release. Case number AFRL-2024-2493.
Declaration of Conflicting Interests
The author(s) declared no potential conflicts of interest with respect to the research, authorship, and/or publication of this article.
Funding
The author(s) received U.S. Departement of Defense support for the research, authorship, and/or publication of this article.