
Abstract
A commonly investigated parameter in driving research is perception-response time (PRT), which refers to the duration required for a driver to respond to a roadway hazard. This study used a driving simulator to reproduce a commonly cited test-track response-time study by Mazzae et al., where responses to a laterally incurring vehicle were investigated. The primary goal of the current study was to evaluate how different factors in the configuration of the Mazzae et al. study, namely presence of parked roadside vehicles and incurring vehicles, affected response times. We enrolled 88 subjects and had them operate a driving simulator that replicated the prior study’s test track with and without the parked and incurring vehicles. A delay in accelerator pedal release was found when the incursion vehicles were present during three prior non-event passes through the critical intersection. The presence of parked vehicles did not affect response times. Accelerator-release times and brake response times from our simulator study align well with the original test-track response-time data.
Introduction
Perception-response time (PRT), or the time it takes to respond to a hazard, is a common parameter studied in driving research. PRT is typically measured from when a hazard becomes visible to when the driver initiates a response, such as releasing the accelerator or applying the brake pedal. An understanding of driver response times and the factors that affect them is important for establishing appropriate sightlines in road design, determining warning times for driver assistance systems, and evaluating a driver’s action leading up to a collision.
A commonly relied upon response-time study by Mazzae, Baldwin, and McGehee (1999), Mazzae et al. (2003) had 245 subjects drive laps in a real car on a figure-eight track as they monitored their distance to a lead vehicle. During each of several initial laps, subjects drove through an intersection where two opposing vehicles were stopped at stop signs on the cross street. There were also two vehicles parked on the right road edge before and after the intersection. On the fourth lap, the stopped vehicle on the right side (from the subject’s perspective) of the cross street was replaced with a foam replica, which was towed rapidly into the subject’s path and then stopped blocking half the subject’s lane. The subject’s pedal and steering response times to the intruding vehicle hazard were recorded. Subjects were not initially told the true purpose of the study, but rather that the study involved collecting driver behavior data in typical driving conditions.
The primary goal of the study was to evaluate how different factors in the configuration of the Mazzae et al. (2003) study affected driver response times. Prior work has shown that urgency of response, expectancy, hazard eccentricity, road type, hazard type, and response complexity affect response times (Green, 2000; Jurecki & Stańczyk, 2018; Muttart, 2001, 2004; Summala, 2000). For our study, we focused on whether the presence of the vehicles at the stop signs during the initial laps and the presence of vehicles parked on the right road edge affected driver response times.
A secondary goal of the current study was to determine whether the unexpected response times observed in the Mazzae et al. (2003) study could be replicated in a driving simulator. This idea has been referred to in the literature as absolute validity, where the absolute numerical values are the same on-road and simulated environments, as opposed to relative validity, where the absolute values are different, but effects of experimental variables are of the same order and direction (Blaauw, 1982). Hoffman et al. (2002) found similar response patterns when responding to a lead vehicle on a test-track and in a simulated environment, with initial speed and lead vehicle deceleration affecting response in a similar way. However, absolute comparisons of perception-response time in each setting were not included. When comparing vehicle speed in a driving simulator, Godley et al. (2002) established relative validity, however absolute validity was not established as subjects generally drove faster on the road than in the simulator.
A previous simulator study reported by McGehee, Mazzae et al. (2000) and Mazzae, Barickman et al. (1999) utilized a crash scenario that was similar to the one in the test-track study by Mazzae, Barickman et al. (1999), Mazzae et al. (2003) study. However, their subjects did not pass the stopped intersection vehicles multiple times before the hazard incursion, and they did not have the additional task of maintaining their headway to a lead vehicle. Due to these protocol differences, it remains unclear whether their simulator and Mazzae’s test-track results are directly comparable (McGehee, Mazzae, Baldwin, 2000).
Methods
Participants
Subjects (n = 88) were undergraduate students from Simon Fraser University (Burnaby, BC) who gave informed consent before participating, and were compensated with either class credit or payment. All subjects self-reported normal or corrected-to-normal vision and a valid British Columbia driver’s license. The Research Ethics Board at Simon Fraser University approved this study.
Apparatus
A DriveSafety high-fidelity driving simulator (DS-600c, Draper, UT, USA) was used (Figure 1). Subjects (n = 88) were seated in a modified 2005 Ford Focus cab equipped with a windshield, driver and passenger seats, dash board, instrument panel, and a central console, as well as all the controls needed to operate a car (e.g., accelerator and brake pedal, turn signal switch, steering wheel, etc.). The simulated environment was generated using HyperDrive Authoring Suite and was displayed using DriveSafety’s Vection™ Simulation software (Version 1.9.35: http://www.drivesafety.com). The simulator was equipped with an automatic gearbox.
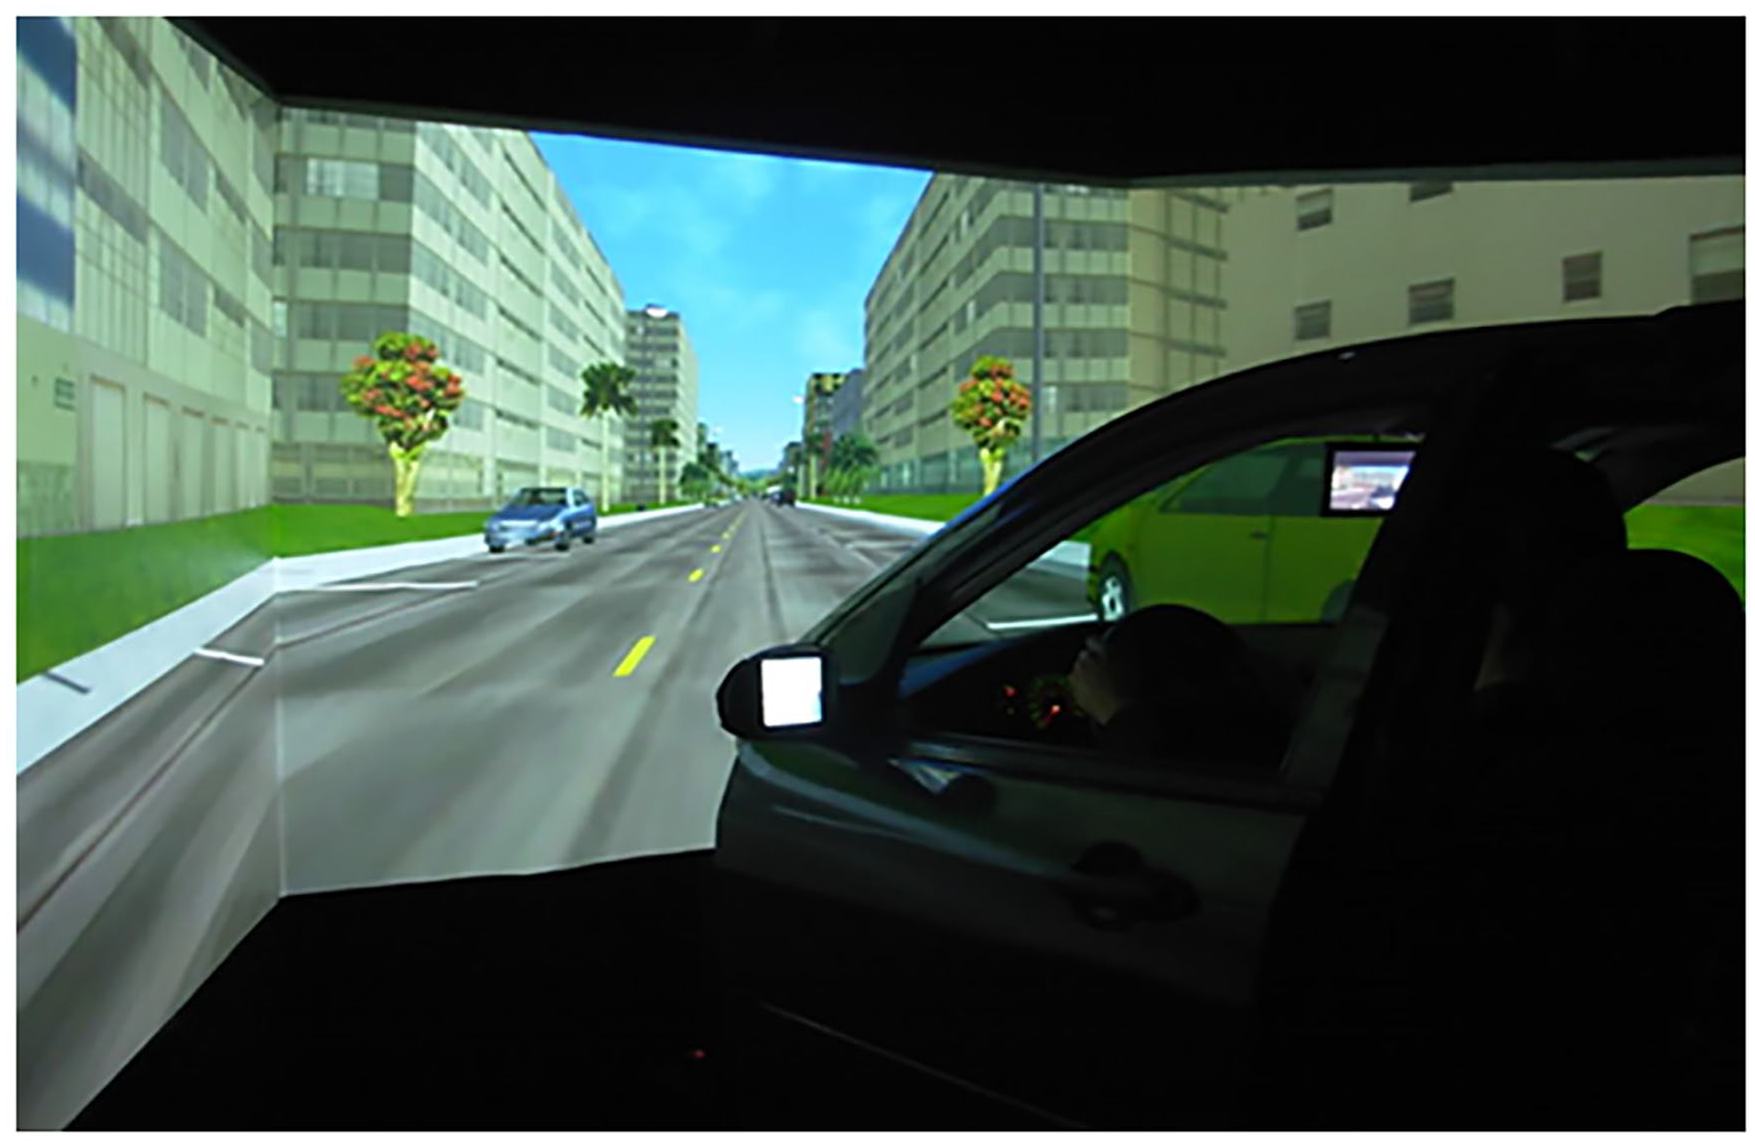
Photograph of the DriveSafety driving simulator used in the experiment taken from outside the vehicle cab.
Driving Route
One continuous figure-eight driving route was designed for this experiment. The route was a virtual duplicate to the one used during the dry-road testing by Mazzae et al. (2003). The route was about 12 km in length, with one lane in either direction, and included two intersections. One intersection was at the center of the figure-eight loop, and the other, the critical intersection, was located on a straight and flat section away from the loop center. The intersecting road crossed the subject’s route at a 90° angle and was controlled by stop signs in either direction. The stop signs and painted stop lines were set back 3.1 m from the main route’s road edge. The route environment was programed to look sparse, similar to the environment used by Mazzae et al. (2003), and consisted mainly of a bare two-lane road and open fields. The route was designed to represent daytime conditions with good visibility.
Following Distance Heads-Up Display
For the entire experiment, a pace car traveling at a constant speed of 45 mph (72 km/h) was present in front of the participant’s vehicle. The participants were instructed to follow 60 m behind the pace car. If the participant sped up or slowed down, the distance between the subject vehicle and the pace car would fluctuate accordingly. The real-time following distance in meters was displayed on a heads-up display (HUD) on the projector screen of the driving simulator (small white rectangle in Figures 2 and 3). The inclusion of the HUD and its position relative to the driver’s line of sight was modeled after the apparatus used in the original Mazzae et al. (2003) study.
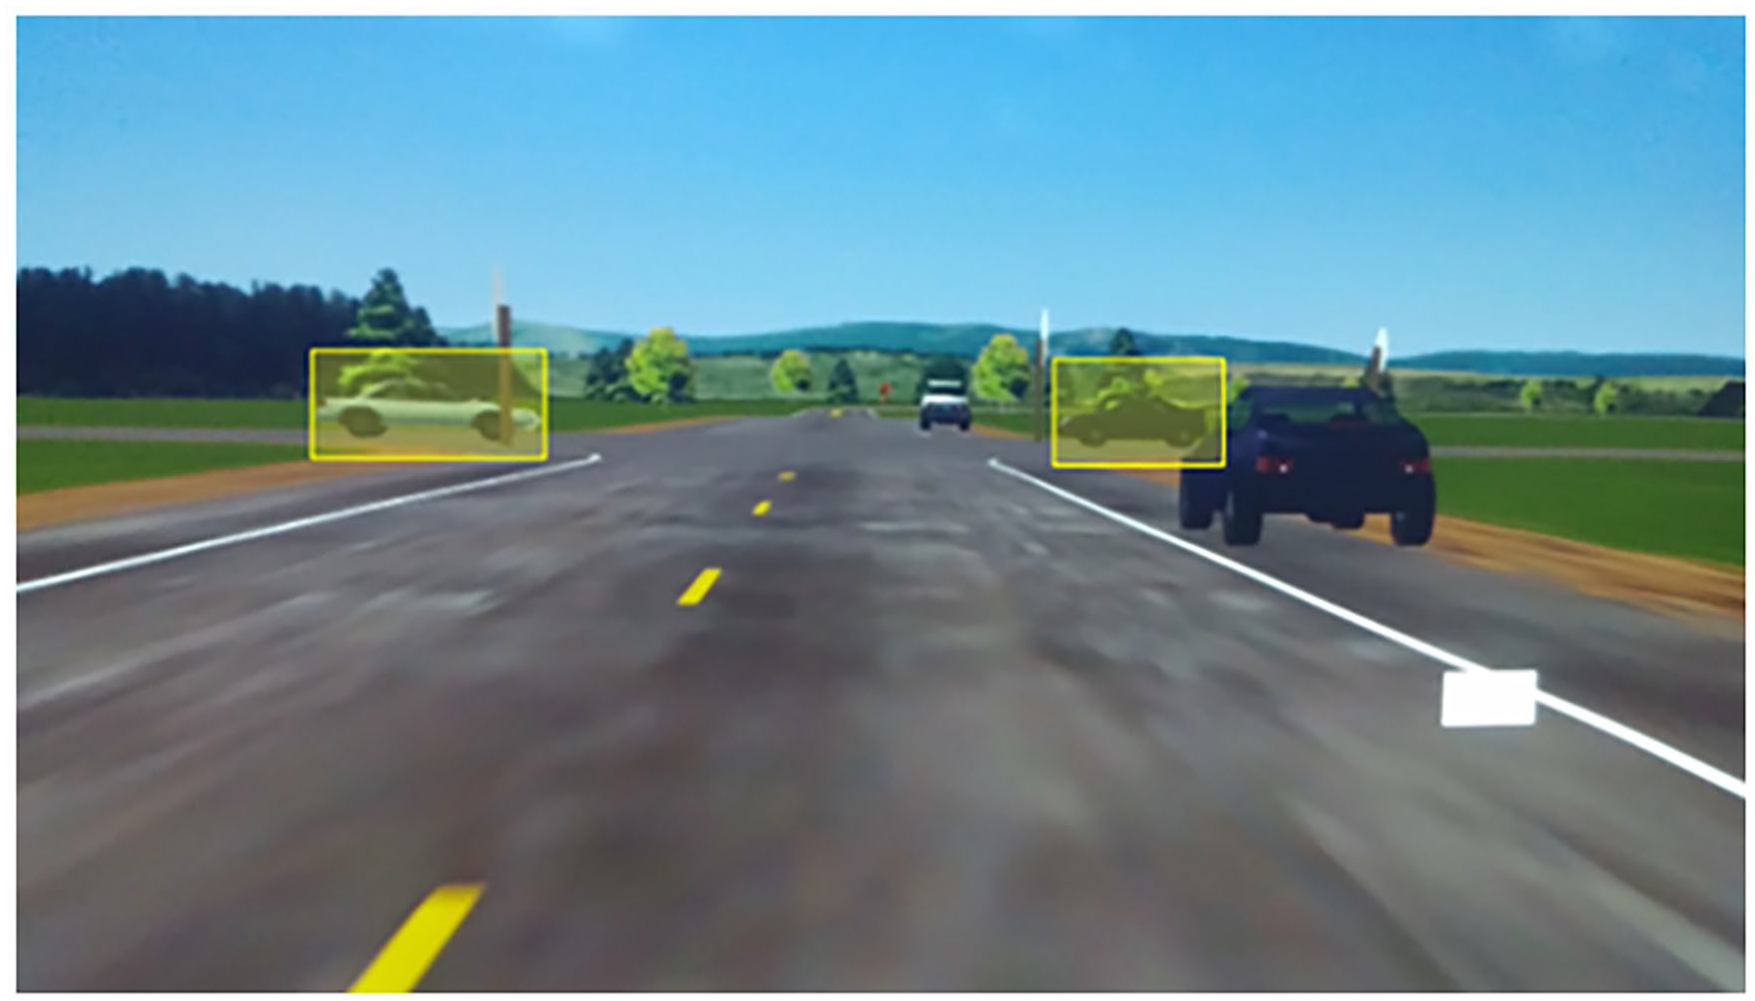
Image of the simulated environment on approach to the critical intersection with the incursion vehicles highlighted with yellow boxes. Note that the unexpected hazard was created by the incursion vehicle on the right accelerating into the subject’s path. The white rectangular box at the lower right side of the image represents the location of the headway distance heads-up display (HUD).
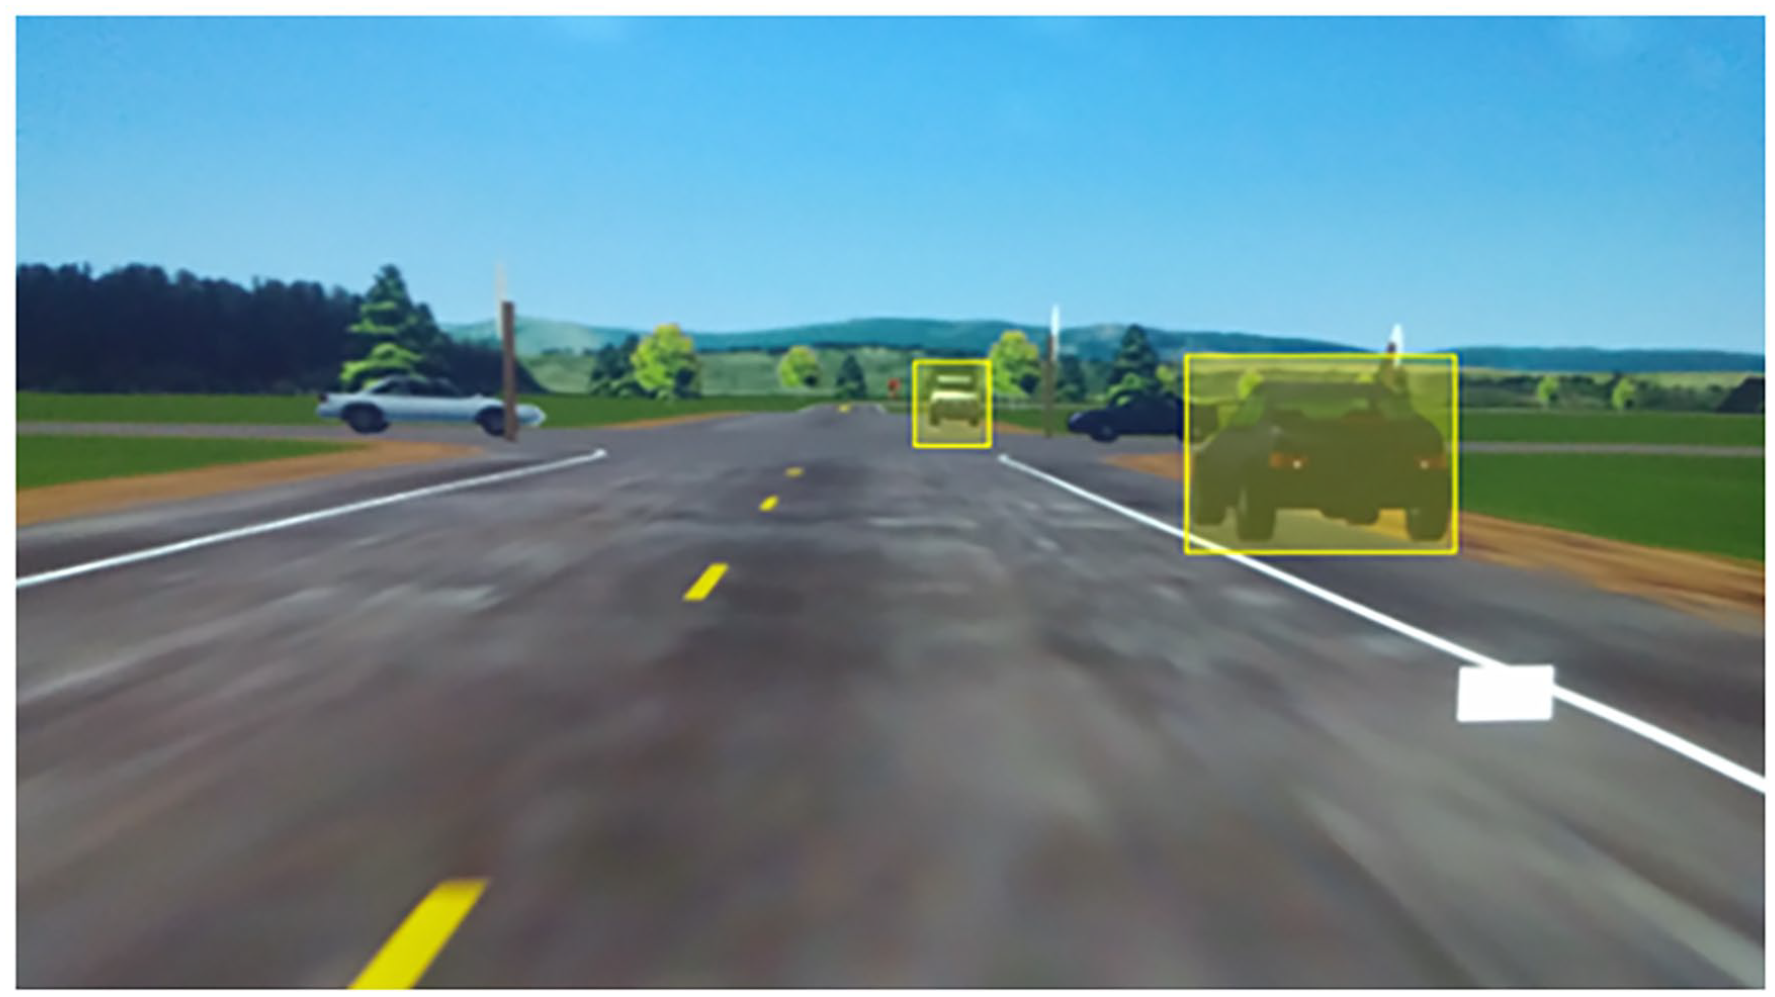
Image of the simulated environment on approach to the critical intersection with the parked vehicles along the side of the road vehicles highlighted with yellow boxes. The white rectangular box at the lower right side of the image represents the location of the headway distance heads-up display (HUD).
Experimental Design
Subjects drove four laps of the figure-eight loop, passing through the critical intersection on each lap. No critical events occurred during the first three passes. During the fourth pass, the vehicle stopped on the subject’s right side unexpectedly accelerated into their path at a time-to-impact of 2.5 s. The target approach speed for the subject was 45 mph (72 km/h).
The layout of the critical intersection was manipulated in a two-by-two between-subjects design. The first factor was the presence/absence of the two vehicles on the cross street during the first three laps. These vehicles were designed to replicate those used in the Mazzae et al. (2003) on-road study. They were both stopped at the stop signs of the critical intersection, with a white sedan on the subject’s left and a dark blue sedan on the subject’s right. The blue sedan at the right side was the incursion vehicle that initiates the critical event, with its motion replicating the motion used in the Mazzae study (Figure 2). The second factor was the presence/absence of two vehicles parked parallel to the route along the right roadside during all laps. These vehicles also replicated those present throughout all trials of the test-track study by Mazzae et al. (2003). The first vehicle was a dark sedan parked along the right side of the road, right of the fog line, facing the same direction as the subject’s vehicle before the critical intersection. The second vehicle was a white van parked beyond the intersection, also on the right roadside but facing the subject’s vehicle (Figure 3).
Dependent Variables
Subject responses were quantified using accelerator release time (ART), foot movement time (MT), and brake response time (BRT).
• ART was defined as the time between hazard onset, that is, the moment the incursion vehicle started to accelerate at a time-to-impact of 2.5 s, and when the subject first started to release the accelerator pedal.
• MT was defined as the time between the start of the accelerator pedal release and the initial contact with the brake pedal, as previously used by Olson and Sivak (1986) and Fitch et al. (2010).
• BRT was defined as the time from hazard onset to initial contact with the brake pedal. BRT is the sum of ART and MT, and it follows the definition set out in SAE International J2944 (2015).
Statistical Analysis
Non-parametric bootstrapping techniques were used to compare our response times to Mazzae’s response times, and a general linear model (GLM) was used to assess the effect of the presence/absence of the other vehicles. An interaction term between the two vehicle conditions was included, and vehicle speed and collision occurrence were covariates. Significance was set at p < .05.
Results
Within our dataset, a collision occurred in 78 of 88 subjects, with only one subject having no pedal response at all prior to impact. This subject was excluded from the analysis. There were eight subjects who did not have their foot on the accelerator at hazard onset (NART = 79) and five subjects who released the accelerator but did not apply the brakes (NBRT = 82) (Table 1). Since MT required that both ART and BRT be present, there were 13 subjects with missing movement times (NMT = 74).
Descriptive Statistics for ART, MT, and BRT (In Seconds) Based on the Presence or Absence of the Incursion and Parked Cars.
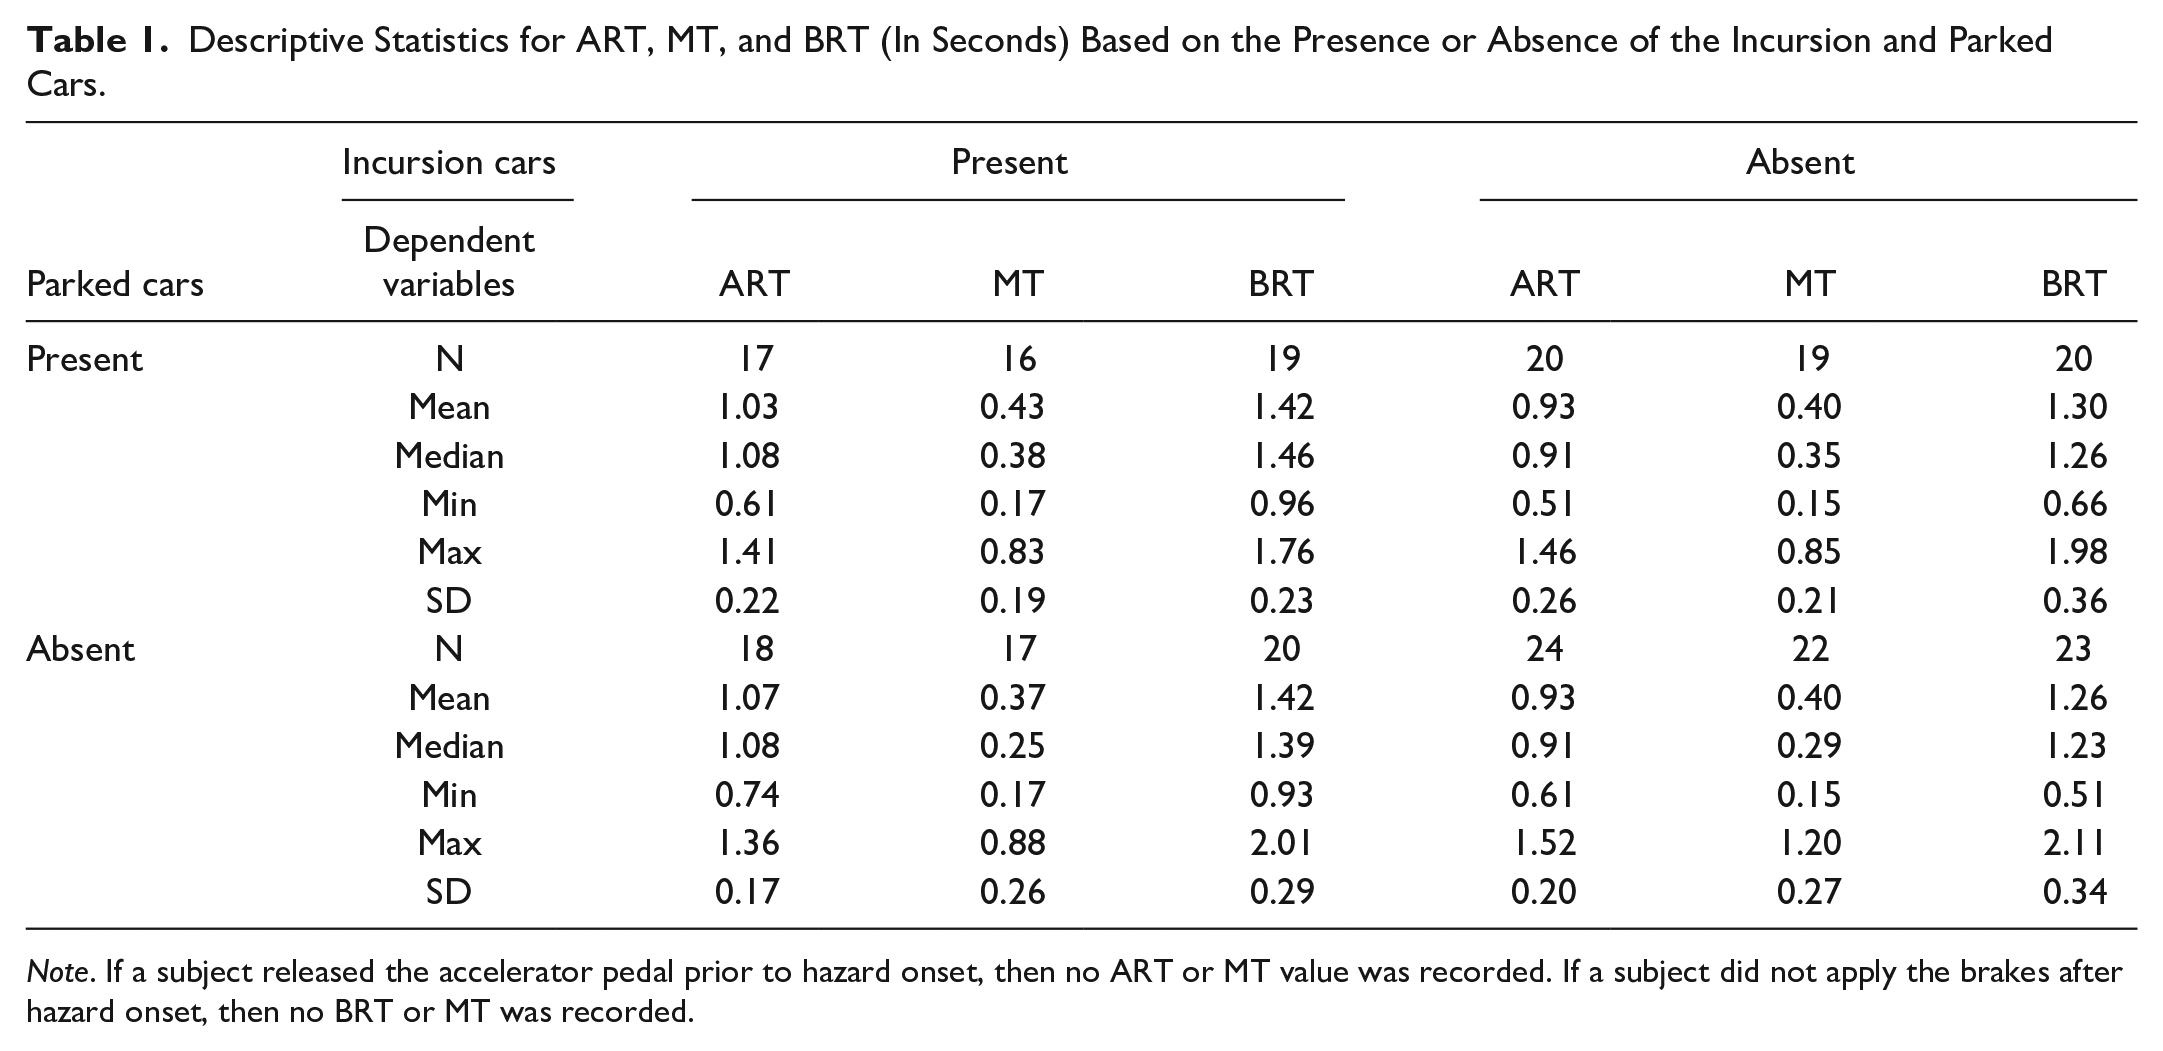
Note. If a subject released the accelerator pedal prior to hazard onset, then no ART or MT value was recorded. If a subject did not apply the brakes after hazard onset, then no BRT or MT was recorded.
Vehicle speeds varied from 51 to 80 km/h (70 ± 6 km/h) at hazard onset. Given this relatively wide range, we chose to include vehicle speed at hazard onset as a covariate in the GLMs. Descriptive statistics for the dependent variables are presented in Table 1.
When comparing our response-times for the condition with all cars present to the results of the Mazzae study, we found no differences for ART (p = .365) and BRT (p = .169) (Figure 4). Mean BRT was 1.42 ± 0.23 s in our study and 1.44 ± 0.26 s in the Mazzae study. Our movement times, however, were 120 ms longer than those reported by Mazzae (p = .002, Figure 4).
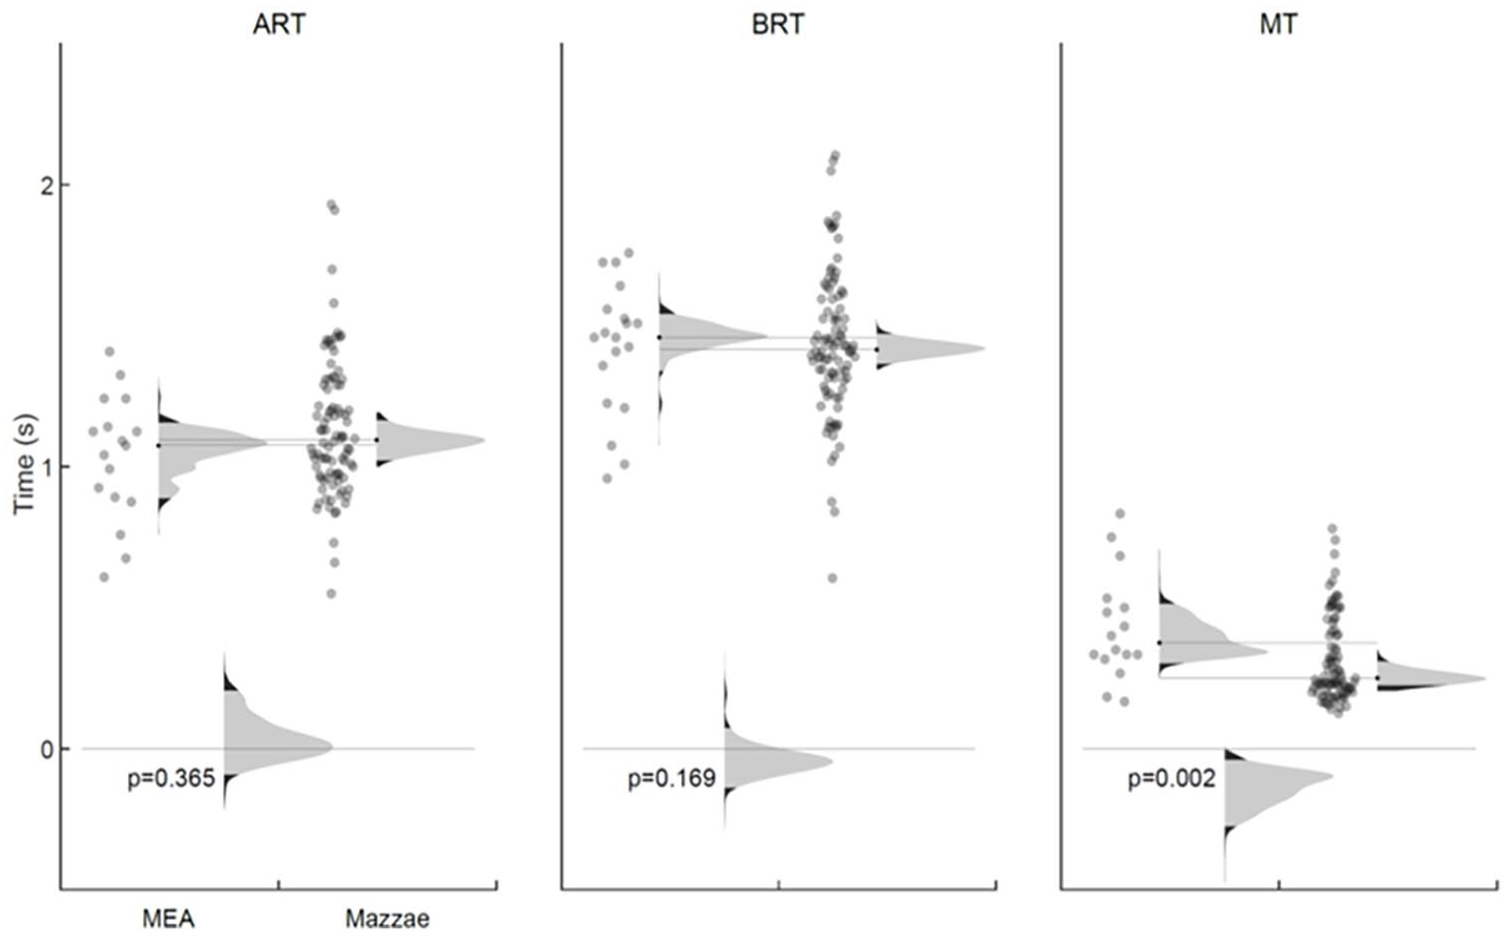
Comparison between the current data (MEA) and the Mazzae data (Mazzae) for the accelerator release time (ART), brake response time (BRT), and movement time (MT) when the parked and incurring vehicles are present. The jitter plots show the actual data, and the adjacent distributions show the median of 10,000 bootstrapped samples (with replication) that have been fit with a normal kernel function (Matlab fitdist, bandwidth 0.02). The lower distribution shows the bootstrapped difference (Mazzae—MEA) relative to zero, with the p-value equal to the proportion of the area below (ART) or above (BRT, MT) zero. The black shaded regions show the outer 2.5%iles of the distributions.
The GLM analysis showed that all three response times (in seconds) were significantly longer if a collision occurred (C = 1) than if no collision occurred (C = 0) (equations (1)-(3)). ART was 0.122 s longer when the incurring cars were present in the first 3 laps (ICP = 1) than when they were absent (ICP = 0) during the first 3 laps. Movement times also varied with vehicle speed at hazard onset, increasing by 0.339 s over the 29 km/h range of observed speeds. None of the response times varied with the presence/absence of the parked cars, and there were no interactions between the parked and incurring car conditions.


Discussion
Our goals were to replicate a prior test-track study in a driving simulator and assess whether specific features of the test-track study design may have affected the results of that study. In particular, we were interested whether the presence of parked cars on the right side of the road affected the response times and whether the presence of the stopped vehicles on the cross street during the initial 3 laps affected the response times. Many real-world collisions occur without parked cars present and most real-world collisions do not occur after passing through an intersection four times with the same cars stopped at the stop sign on the cross street.
In so far as the data from the Mazzae study can be applied to real-world hazard responses, the data acquired here provide additional insights regarding the effects of the incurring and parked vehicles on driver behavior. Subjects were slower to release the accelerator pedal after hazard onset when the incursion cars were present during the three prior non-event passes through the critical intersection. This delay in ART suggests that subjects may have habituated to the presence of the cars at the stop signs on the cross street and assumed, based on their prior passes, that the vehicles would remain stationary. This suggestion is consistent with top-down processing, whereby perception can be driven by prior experiences and expectations.
The presence of vehicles parked parallel on the right shoulder before and after the intersection did not affect response times. Nevertheless, parked vehicles can be crucial when assessing sightlines to a hazard. Our data suggest that as long as the parked vehicles do not restrict sightlines, their mere presence does not affect response times.
The accelerator-release times and brake response times from our simulator study were not significantly different than the response-time data observed by Mazzae et al. (2003) on a test-track. These results suggest a strong degree of absolute validity in using driving simulators to measure emergency hazard response times, although further testing is required to determine if these results hold true for other hazard types. These findings can also provide insight to those investigating the use of simulators as a research tool for automated driving research.
Further testing is required to investigate if these simulator response times and Mazzae’s test-track response times translate to a more naturalistic on-road setting. Additional investigation is also needed to determine if simulator data can replicate brake ramp-up times from initial application to various degrees of deceleration. Prior studies comparing test-track versus a simulated environment have found differences from brake onset through the braking process (Hoffman et al., 2002). Therefore, caution should be used if applying brake ramp-up times and peak deceleration rates from simulated studies to a real-world scenario. Differences in brake ramp-up times and braking rates could explain the differences we found in collision occurrence, which was far greater in our simulator study than in the Mazzae study.
Conclusion
In summary, this study provides insight as to the effects of incurring vehicles and parked roadside vehicles on driver behavior. The data also showed good translation between test-track and simulator testing environments with respect to driver response times to a laterally incurring vehicle hazard.
Footnotes
Acknowledgements
We wish to thank Dr. Thomas M. Spalek and the Spalek Laboratory of Attention Memory and Perception at Simon Fraser University for the use of their driving simulator. We also wish to thank Dr. Matthew R. Yanko for his assistance and contributions.
Declaration of Conflicting Interests
The author(s) declared no potential conflicts of interest with respect to the research, authorship, and/or publication of this article.
Funding
The author(s) received no financial support for the research, authorship, and/or publication of this article.