
Abstract
Background:
Definitive and successful treatment of end-stage ankle arthritis is either total ankle replacement (TAR) or ankle fusion (AF). The long-term implications of both treatments remain unclear. AF may predispose patients to subsequent hindfoot joint fusion, and TAR potentially risks high rates of complex revision surgery. The study investigates the risks of further surgery, adjacent joint surgery, and rare but serious complications following AF and TAR.
Methods:
An England population cohort study was performed using the Hospital Episode Statistics database, linked to Office of National Statistics (ONS) mortality data (1998-2023). The primary outcome was Kaplan-Meier curve analysis of revision surgery–free survival of TAR vs AF. Secondary outcome measures were the rates of adjacent joint/hindfoot fusion, any further re-intervention to the ankle, peri-operative mortality, 90-day complications, and serious adverse events.
Results:
A total of 10 335 TARs and 30 704 AFs were analyzed. The AF revision rate was significantly lower than TAR at all time points including 5 years (2% vs 6.1%, relative risk [RR] 0.12, 95% CI 0.10-0.16), 10 years (2.5% vs 10.2%, RR 0.12, 95% CI 0.08-0.18), and 20 years (3.1% vs 13.55%, RR 0.12, 95% CI 0.01-0.23). There was no significant difference in the 25-year risk of adjacent joint fusion following AF (8.64%, 95% CI 7.79%-9.58%) vs TAR (6.82%, 95% CI 5.36% to 8.66%). TAR was associated with higher risks of intra-operative fracture (0.42% vs 0.10%, RR=4.35) and re-intervention for wound infection (0.26% vs 0.15%, RR 1.74) but a lower observed 90-day pulmonary embolus rate than AF (0.23% vs 0.58% respectively).
Conclusion:
Both TAR and AF are definitive treatments of ankle arthritis with low peri-operative risk. In this England-wide registry cohort, TAR showed higher cumulative revision risk than AF over long-term follow-up. Estimates at the furthest time points have lower certainty. Furthermore, AF did not appear to pre-dispose patients to hindfoot fusion and was not associated with a higher 25-year rate of hindfoot fusion than TAR. These estimates do not capture joint degeneration managed non-operatively.
Introduction
Ankle arthritis affects approximately 1% of the global population and can be as debilitating as hip arthritis.13,15,18,23 Total ankle replacement (TAR) and ankle fusion (AF) are both definitive operations for end-stage disease. 21 The UK-based TARVA randomized controlled trial showed they are equally successful in the short term. 14 The choice of TAR or AF is based on multiple factors, including surgeon preference, patient expectations, and regional practice. To inform decision making, we need to understand better the long-term risks and sequelae of these 2 treatments at a population level.
AF is a well-established treatment with reliable results and high levels of patient satisfaction. 3,5,11,26 An ongoing concern is that it predisposes patients to developing adjacent joint degeneration, requiring a hindfoot fusion.32,35 This can shift a patient from a high-functioning individual to someone with a rigid ankle-hindfoot complex.2,3,7
In contrast, TAR may protect against the development of adjacent joint disease by preserving ankle motion.4,17,30 The main concern with TAR is the high revision rates, which vary across different National Joint Registries (NJRs). A recent systematic review of 3 national Registries found a 20% revision rate at 5 years and a range of 26% to 32% at 10 years. 29 The UK NJR describes a lower 10-year revision rate of 14%, 19 similar to meta-analyses of 22 non-Registry cohorts (9.9% at 5 years). 34 Failing TARs also undergo minor procedures, including open/arthroscopic debridement, grafting of bone defects, and bearing exchange; potentially posing further harm to patients.10,21
Although TARVA has demonstrated equivalent results of TAR and AF at 1 year, 14 it may not be sufficiently powered to detect rare, but serious, adverse events and cannot readily describe the ≥20-year impact of these 2 operations. This study aims to examine national population data over a 25-year period to understand better the lifetime risk of further surgery and the rate of rare but serious peri-operative risks following TAR vs AF.
Methods
We conducted an analysis of prospectively collected data from the England Hospital Episodes Statistics (HES) database, combined with Office of National Statistics (ONS) mortality data to provide date and cause of death. HES contains a record of all patient attendances to NHS hospitals in England, including NHS-funded care in the private sector. The data includes OPCS Classification of Interventions and Procedures (OPCS-4) codes for procedures, International Classification of Diseases, Tenth Revision (ICD-10) codes for diagnoses, detailed demographic data, co-morbidities, peri-operative complications, and further operative intervention. The Office of National Statistics mortality database contains national death certificate data, irrespective of whether the death occurred in or out of hospital. These records were linked with HES to give time and cause of death for participants.
We identified all patients undergoing either TAR or AF, between 1998 and 2023. The list of OPCS-4 codes used to define procedures and re-interventions is available in Supplementary File 1. The AF group did not include patients who underwent tibio-talar-calcaneal (TTC) fusion or an ankle fusion as part of fracture fixation. The primary outcome was the rate of revision post TAR vs AF, analysed by Kaplan-Meier revision-free survival. In the case of TAR, revision surgery was defined as, and included all OPSC-4 codes pertaining to, revision arthroplasty (revision of at least 1 metal component) or revision to fusion. Revision surgery post AF was defined as, and included all, OPSC-4 codes pertaining to revision of the ankle fusion (Supplementary File 1). Secondary outcome measures included the rates of 90-day postoperative complications. Kaplan-Meier analysis of hindfoot fusion-free survival was used to determine the rate of adjacent joint disease progression to fusion. Hindfoot fusion included OPSC-4 codes for any operative event recorded as a subtalar fusion (including talo-calcaneal fusion), talo-navicular fusion, hindfoot fusion, and/or a triple fusion.
Any subsequent re-interventions following TAR/AF were compared and reported as “re-intervention”-free survival. We included any re-intervention to the ipsilateral ankle/hindfoot and did not censor on an individual basis; that is, every re-intervention would be recorded as an event, regardless of whether it was on the same individual. Data were presented as rates of the outcome of interest with CIs, and survival analysis was performed using R and StataSE.
Pearson χ2 tests were used to determine if the assigned intervention was associated with differences in the demographic distributions (for sex, age, IMD quintile, race, Charlson score). In order to account for the large numbers of patients, an effect estimate was used based on the Cramér V correction to determine if any of the statistically significant differences seen were practically significant. This method adjusts for very large population size when applying χ2 calculations. The estimated effects following adjustment are classified as very small (Cramér V = 0.01-0.09), small (Cramér V = 0.10-0.29), medium (Cramér V = 0.30-0.49), large (Cramér V = 0.50-0.69), and very large (Cramér V ≥ 0.70).
A time-varying Cox hazards model was used to calculate the adjusted hazard ratios of revision over time by index surgery, age group, sex, index of multiple deprivation (quintile derived from regional factors in England including average income, employment, education, housing and crime; 1 = least deprived area, 5 = most deprived), race, and modified Charlson co-morbidity index score. The Charlson co-morbidity index score was calculated according to a previously defined method and derived with maximum 5-year diagnosis code lookback period.6,28,36 The models were stratified by era to account for potential biases that may arise from changes in practice, implant type, and indication for intervention over time.
Results
Following data cleaning, 10,335 TAR and 30,704 AF patients were eligible for analysis (Supplementary Figures 1 and 2). TAR patients had a mean follow-up of 9.5 years (IQR 4.93-13.68), AF patients had a mean follow-up of 8.99 years (IQR 4.93-13.68). The mean age for TAR was 63.8 years (median = 65 years) and 55.2 years (median = 60 years) for AF (Table 1).
Demographic Data of Patients Undergoing Total Ankle Replacement and Ankle Fusion. a
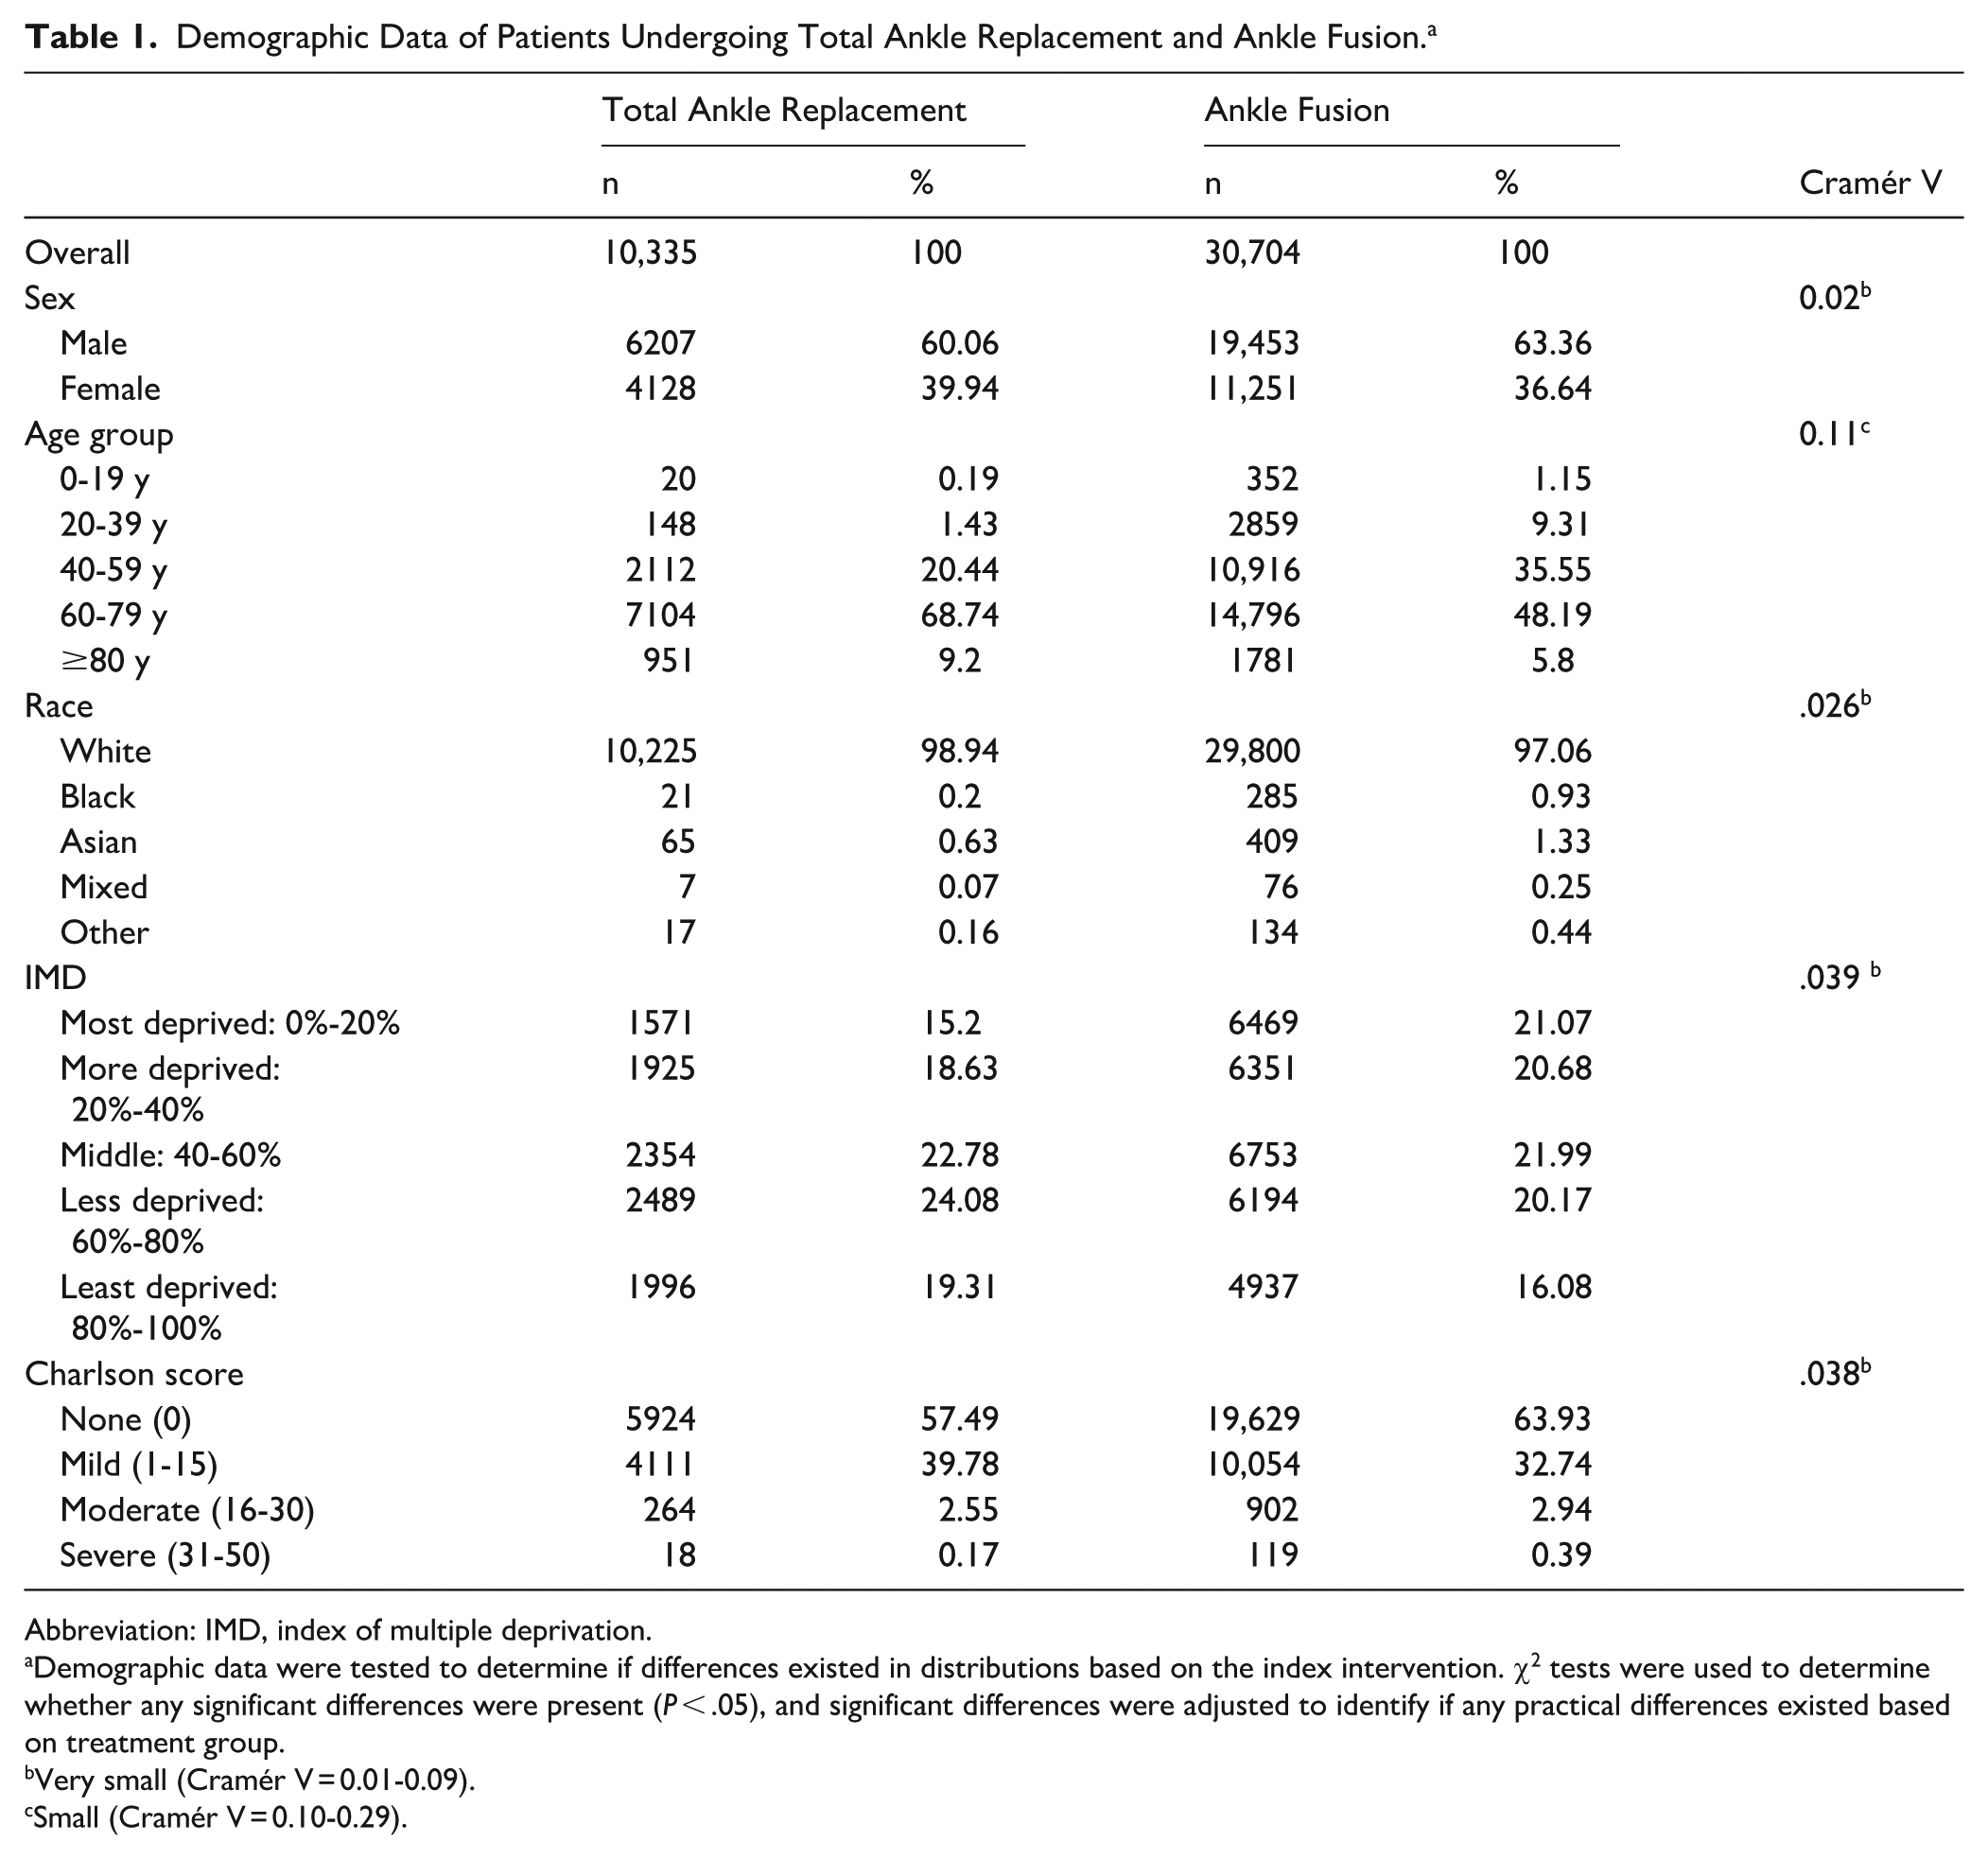
Abbreviation: IMD, index of multiple deprivation.
Demographic data were tested to determine if differences existed in distributions based on the index intervention. χ2 tests were used to determine whether any significant differences were present (P < .05), and significant differences were adjusted to identify if any practical differences existed based on treatment group.
Very small (Cramér V = 0.01-0.09).
Small (Cramér V = 0.10-0.29).
Both operations were associated with low 90-day mortality rates: 0.23% for TAR and 0.41% for AF (relative risk [RR] 0.57, 95% CI 0.37-0.89; Figure 1 and Supplementary Figure 3). Beyond 7 years, the mortality was significantly greater post TAR than post AF (Supplementary Figure 3). Fewer pulmonary emboli were observed within 90 days following TAR compared to AF (0.23% vs 0.58%, RR = 0.40). TAR was associated with higher risks of intra-operative fracture (0.43% vs 0.10%, RR = 4.35) and re-intervention for wound infection (0.26% vs 0.15%, RR 1.74). There was a significantly greater risk of re-intervention within 90 days for metalware complications following AF compared with TAR (2.99% AF vs 1.70% TAR, RR 0.40).
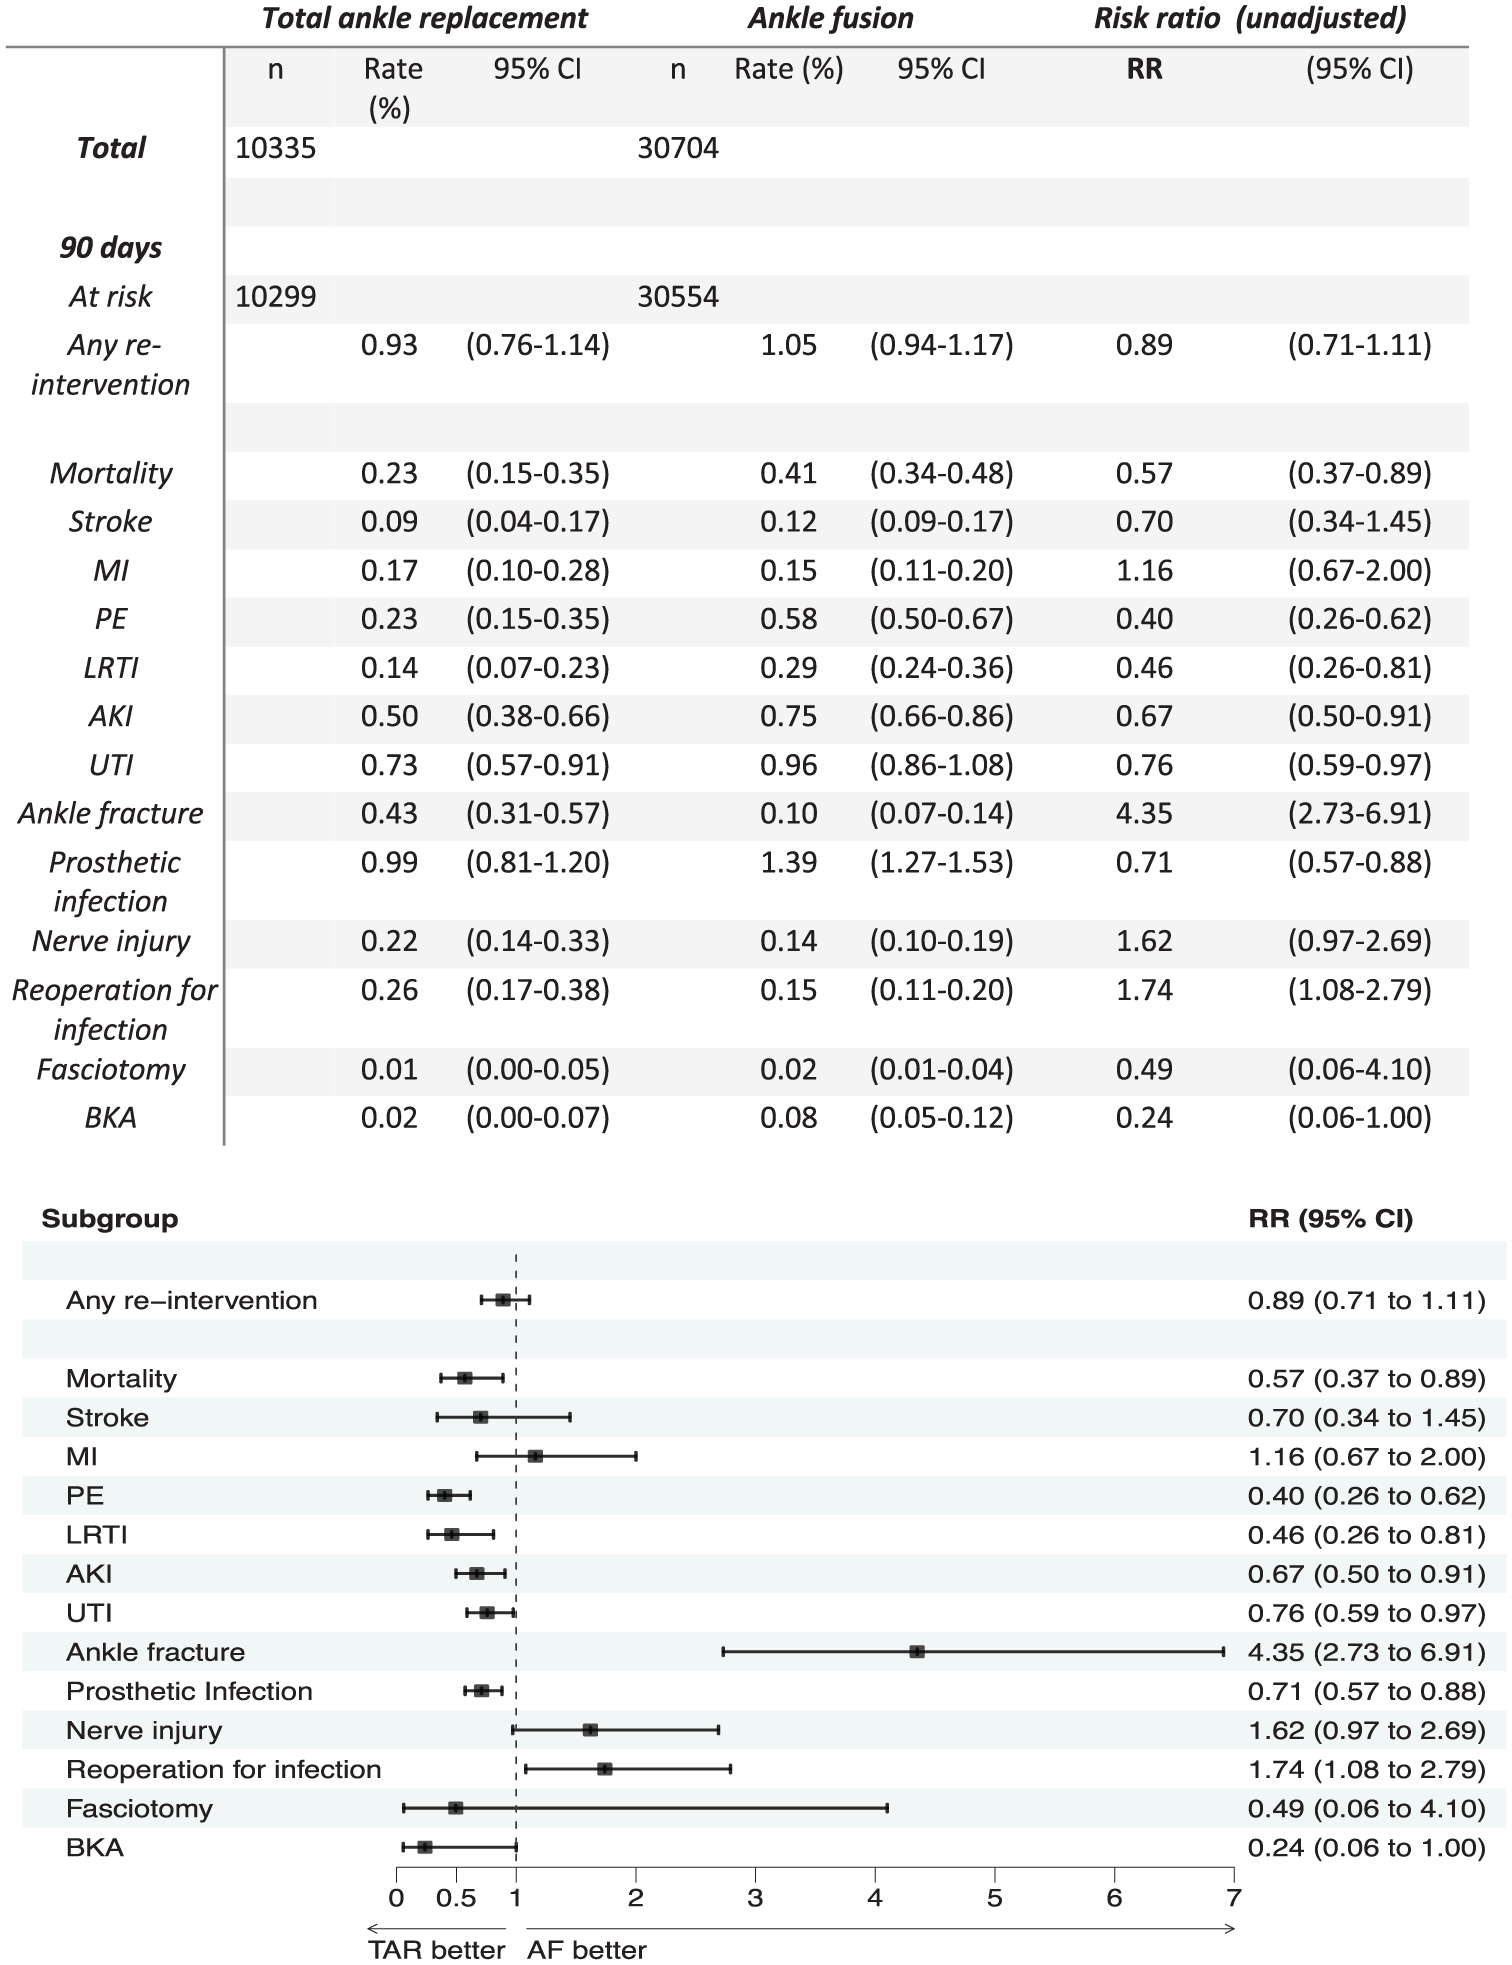
Ninety-day complications following ankle fusion (AF) and total ankle replacement (TAR). The complication rate is shown for each procedure, as well as the relative risk (RR) at 90 days when the two are compared. MI, myocardial infarction; PE, pulmonary embolism; LRTI, lower respiratory tract infection; AKI = acute kidney injury; UTI, urinary tract infection; BKA, below knee amputation.
Lower revision rates were observed for AF compared to TAR at all time points, including at 10 years (RR 0.12, 95% CI 0.08-0.18) and 20 years (RR 0.12, 95% CI 0.01-0.23; Figure 2). The observed revision rates of TAR were 10.9% at 10 years in 4447 patients (95% CI 9.5% to 10.9%), and 13.5% at 20 years in 661 patients (95% CI 12.6% to 14.6%). In comparison, the revision rate of post AF was 2.5% at 10 years in 13,306 patients (95% CI 2.3% to 2.7%) and 3.1% at 20 years in 1705 patients (95% CI 2.8% to 3.4%). The effective ‘drop-out rate’ is detailed in Supplementary Figure 4.
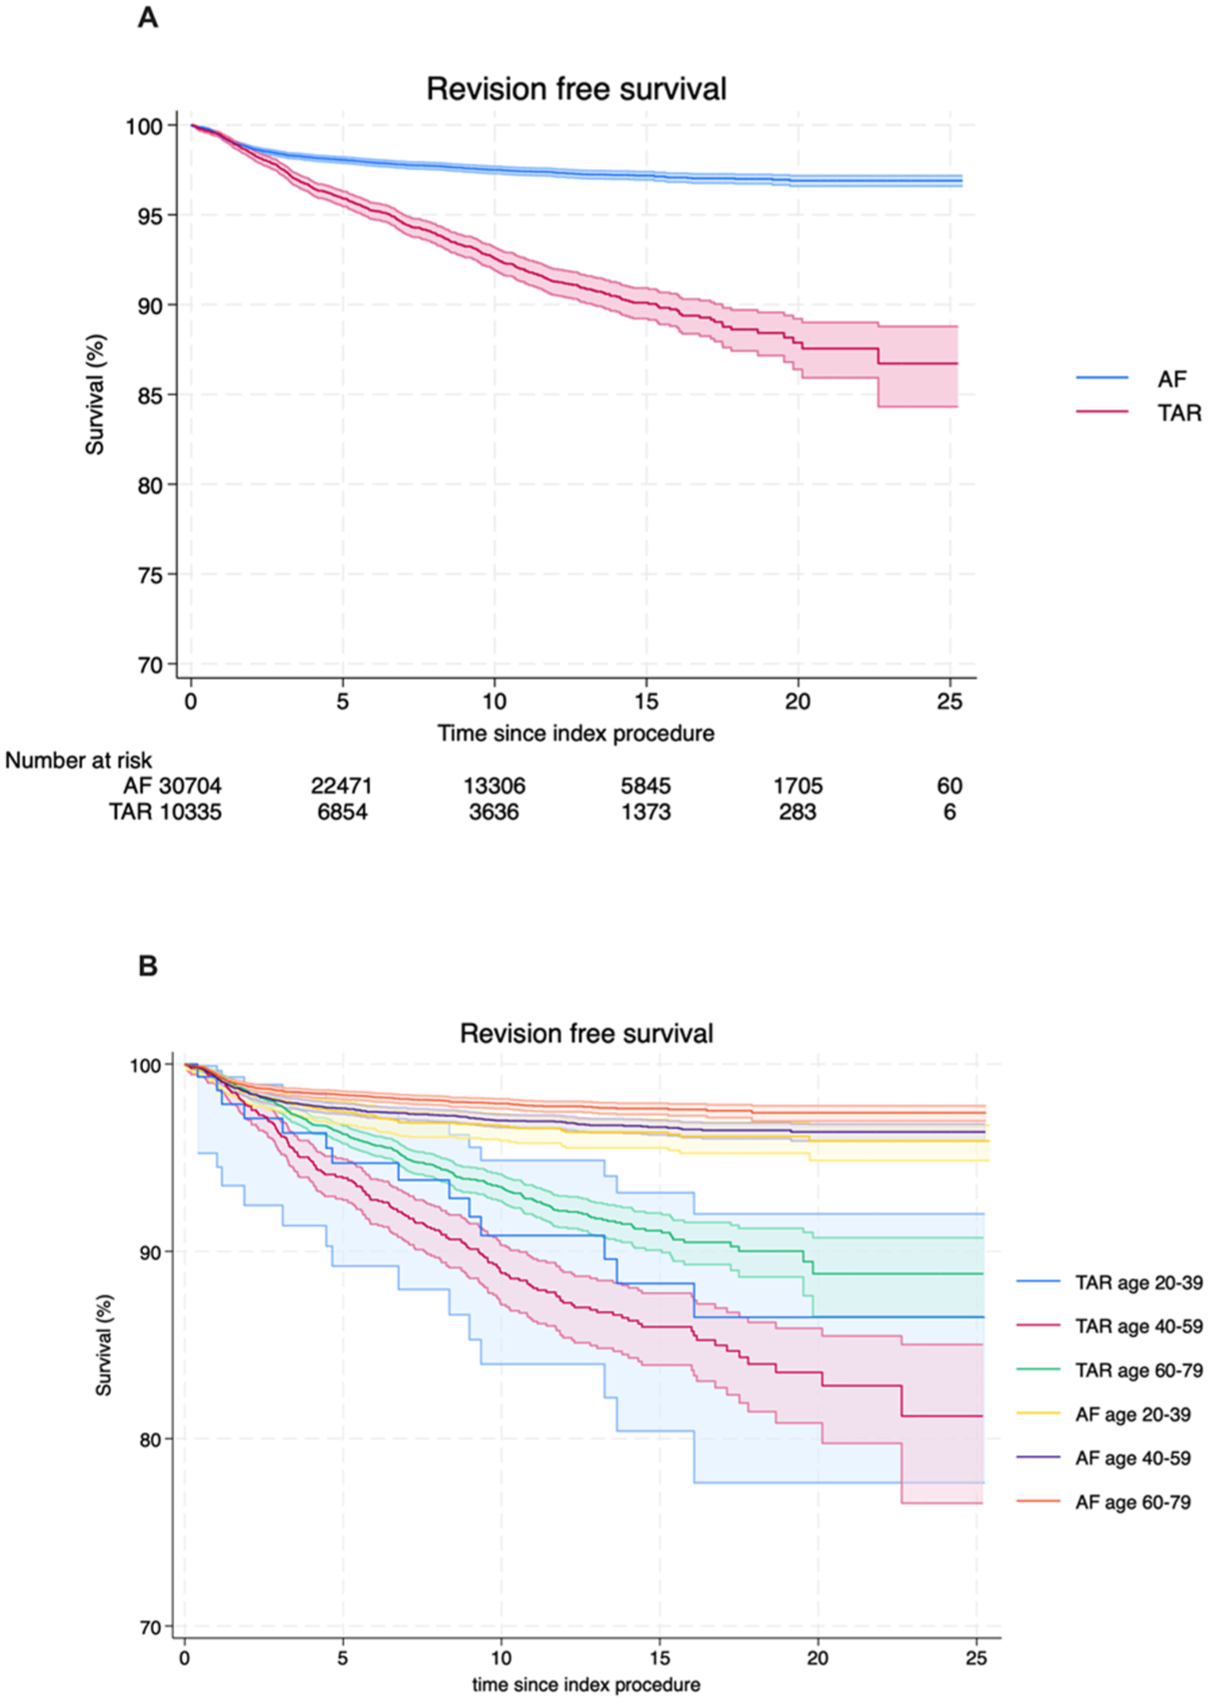
Kaplan-Meier analysis of revision-free survival following total ankle replacement (TAR) vs ankle fusion (AF); all patients (A) and patients by age group (B).
To assess the impact of potential confounders, the adjusted hazard ratio of revision across the study period was calculated using a time varying cox proportional hazards model, stratified by era. After adjusting for age, sex, year of procedure, IMD, race and Charlson score, TAR had a higher risk of revision (HR 3.98, 95% CI 3.62-4.39) when compared to AF (Table 2 and Figure 2B by age). The increased hazard of revision of TAR when compared to AF persisted across the study duration (Supplementary Table 1 and Supplemental Figure 5).
Crude and Adjusted Hazard Ratios. a
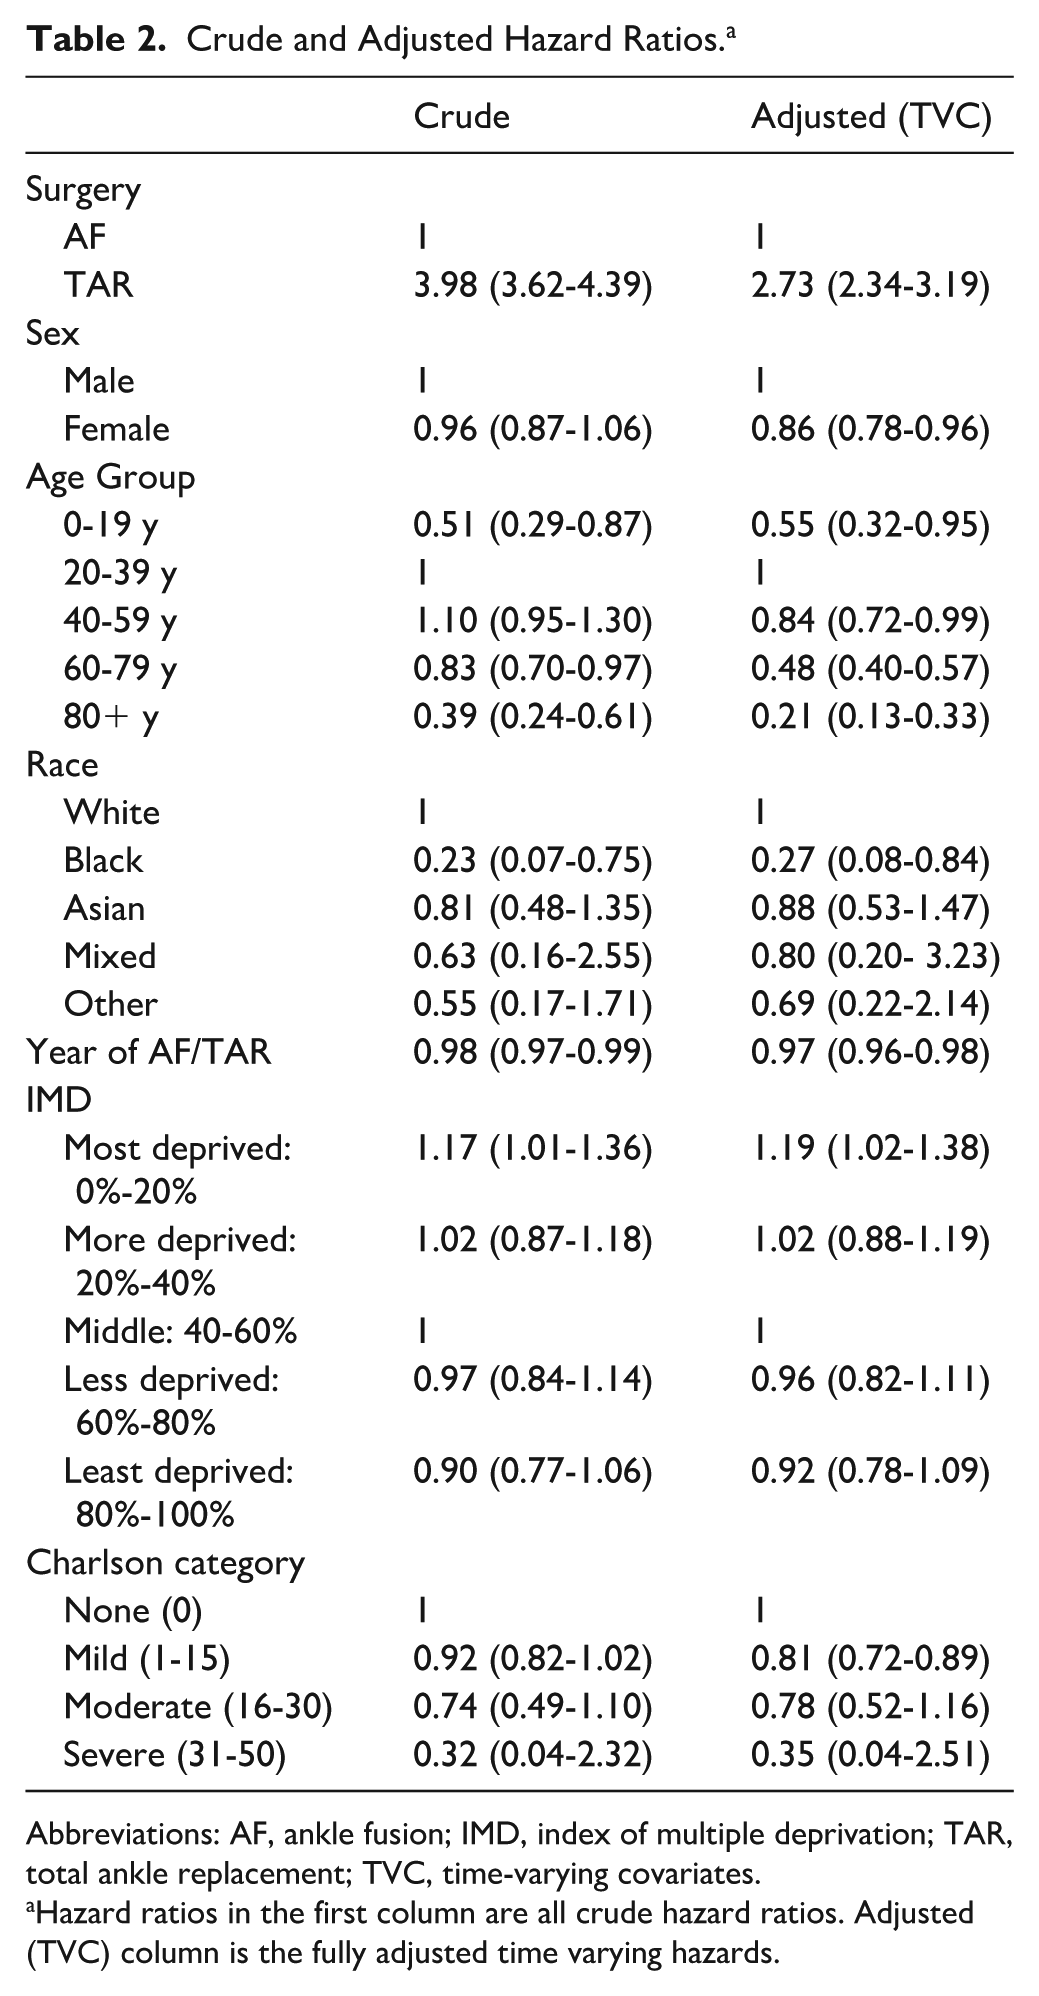
Abbreviations: AF, ankle fusion; IMD, index of multiple deprivation; TAR, total ankle replacement; TVC, time-varying covariates.
Hazard ratios in the first column are all crude hazard ratios. Adjusted (TVC) column is the fully adjusted time varying hazards.
Figure 3 demonstrates the rate of subsequent hindfoot fusion following either TAR or AF. In this study, hindfoot fusion included any operative event recorded as a subtalar fusion (including talo-calcaneal fusion), talonavicular fusion, hindfoot fusion, and/or a triple fusion. Over the 25-year period, 8.64% of AF patients (95% CI 7.79%-9.58%) and 6.82% of TAR patients (95% CI 5.36%-8.66%) required a hindfoot fusion. Thus, there was no significant difference in the risk of subsequent hindfoot fusion post TAR vs AF (RR 1.26, 95% CI 0.15-10.28).
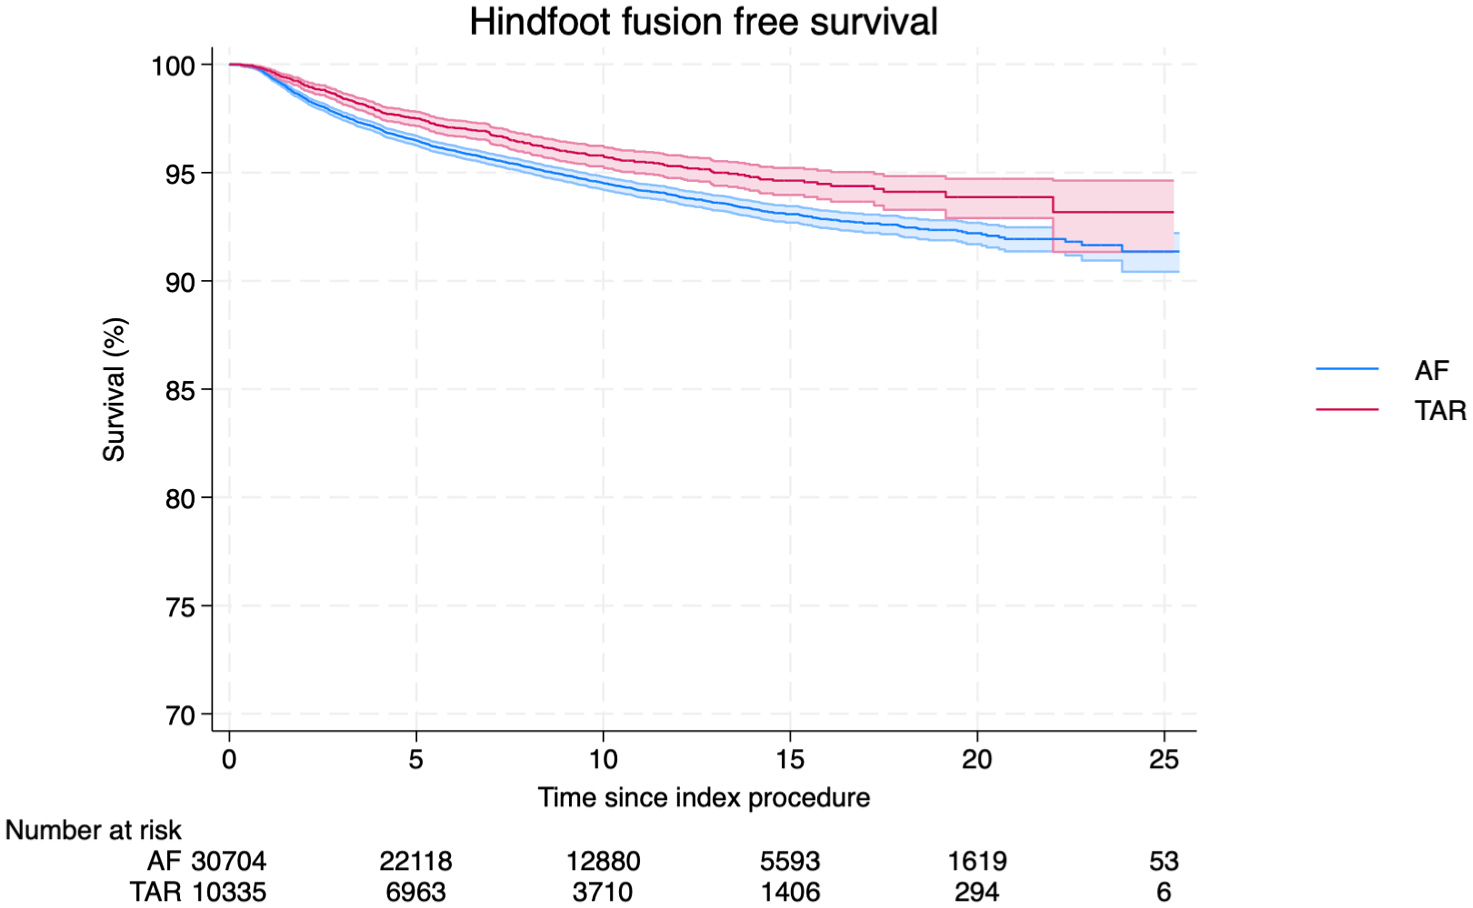
Hindfoot fusion-free survival over 25 years in total ankle replacement (TAR) and ankle fusion (AF).
We next explored the long-term risk of any further intervention to the same ankle and/or hindfoot following either TAR or AF. The overall re-intervention–free survival over 25 years was 65% (95% CI 62%-68%) following TAR and 69.2% (95% CI 69%-70%) following AF (Figure 4). The commonest re-interventions after TAR were exploration/debridement of ankle joint, wound infection surgery, joint aspiration, and revision TAR, together accounting for more than 60% of all re-interventions at 90 days, 1 year, and 5 years (Figure 5 and Table 3). There was a significant increase in the rate of re-intervention within the first year following AF (9.1%, 95% CI 8.7%-9.4%) compared with TAR (5.0%, 95% CI 4.6%-5.4%). The majority of these were removal of metal (Figure 6 and Table 4).
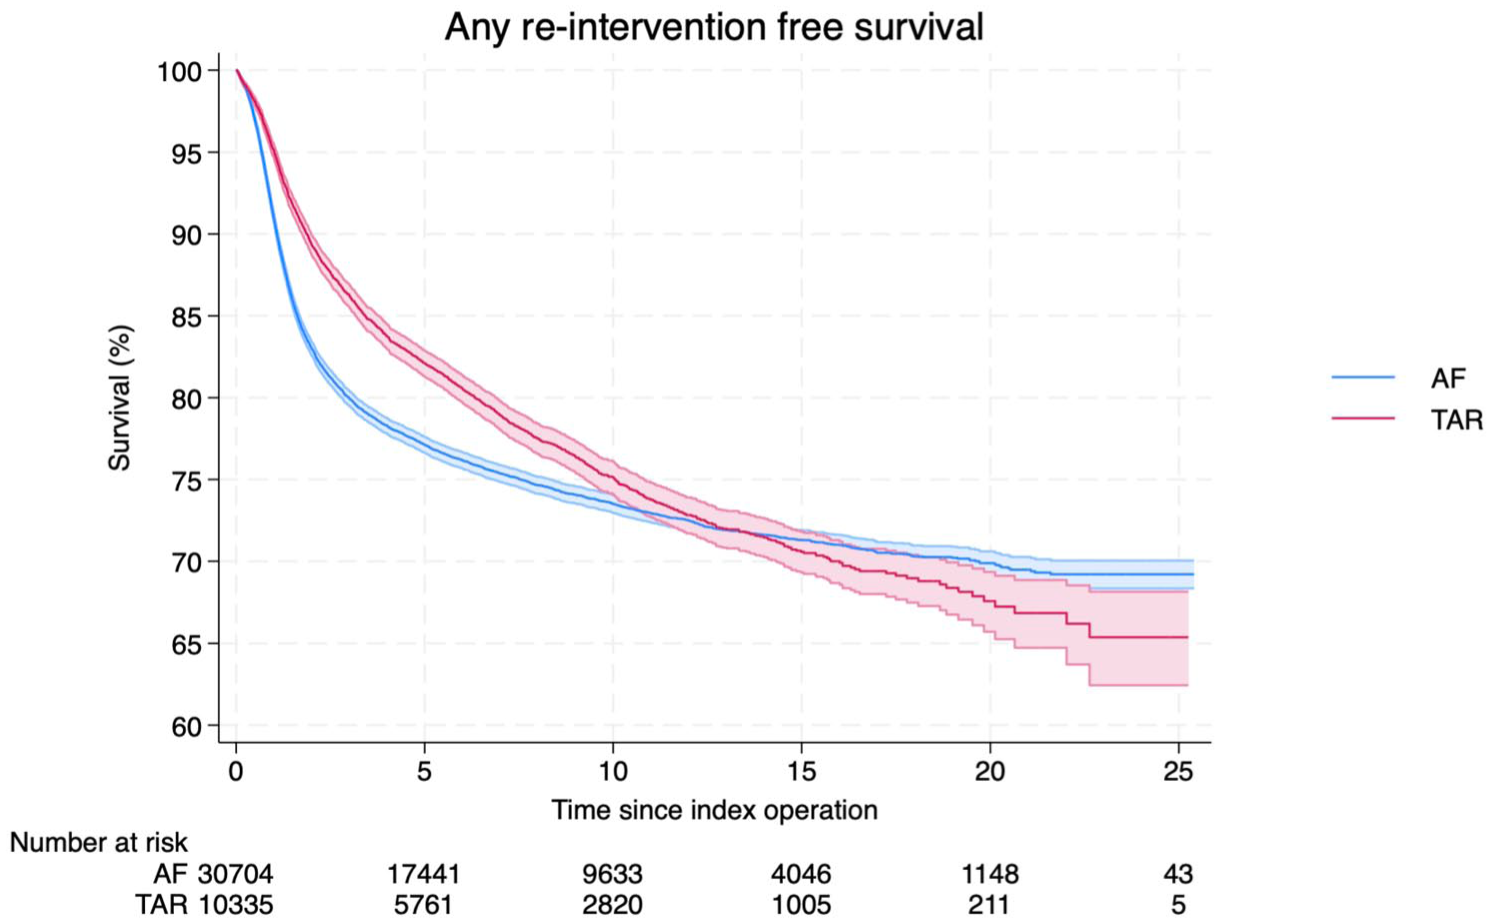
Any re-intervention–free survival over 25 years in total ankle replacement (TAR) and ankle fusion (AF). Any re-interventions on the ipsilateral ankle or hindfoot were counted. Re-interventions included any procedure to the ipsilateral ankle and/or hindfoot following the index procedure of interest. Examples of procedures are presented in Figures 5 and 6.
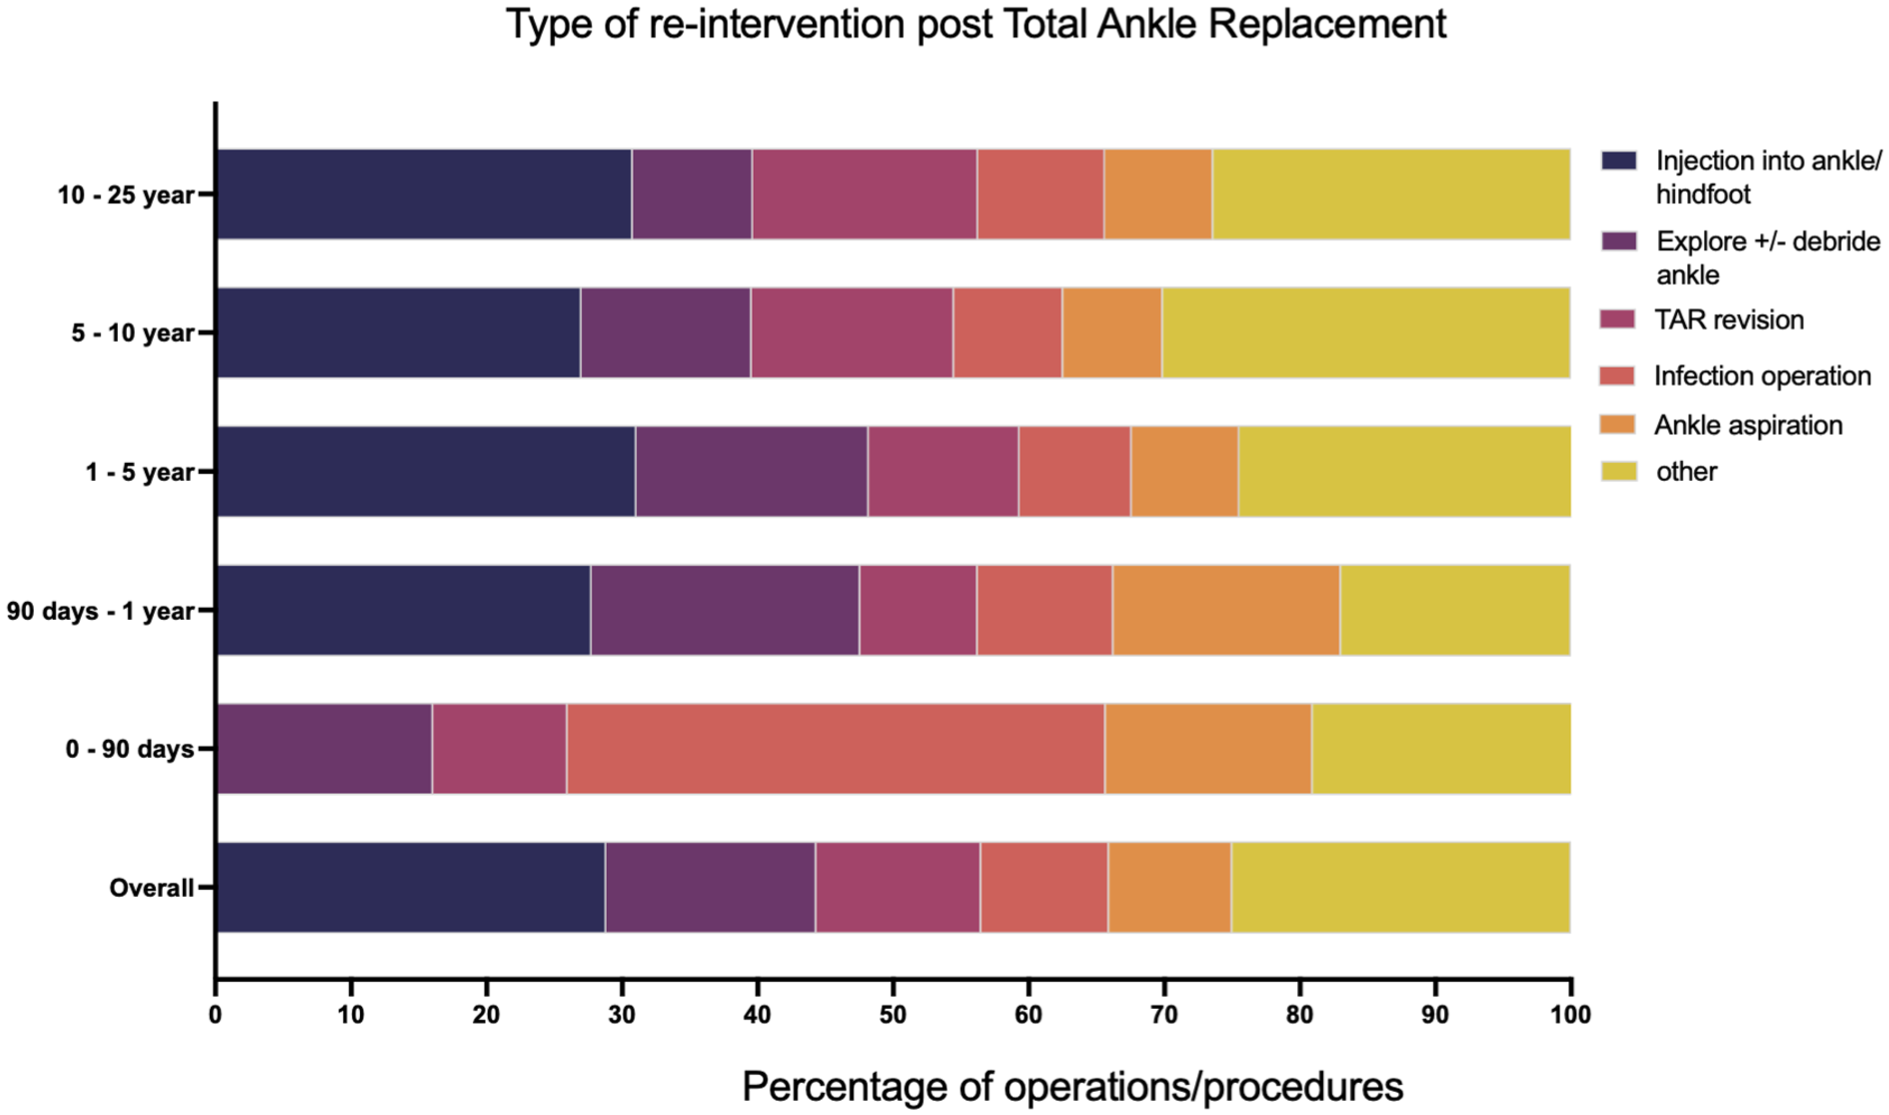
All operations to the same ankle and/or hindfoot as the original total ankle replacement were analysed and classified based on the nature of the operation. Data shown are the operation as a proportion of all re-interventions at a particular time point: 0-90 days show all operations that occurred between day 0 and day 90; 90 days–1 year is operations between day 90 and day 365; 1-5 years is data between 1 year and up to 5 years post index procedure; 5-10 years is operations over 5 years and up to 10 years post index procedure; 10-25 years is operations over ten years and up to 25 years post index procedure.
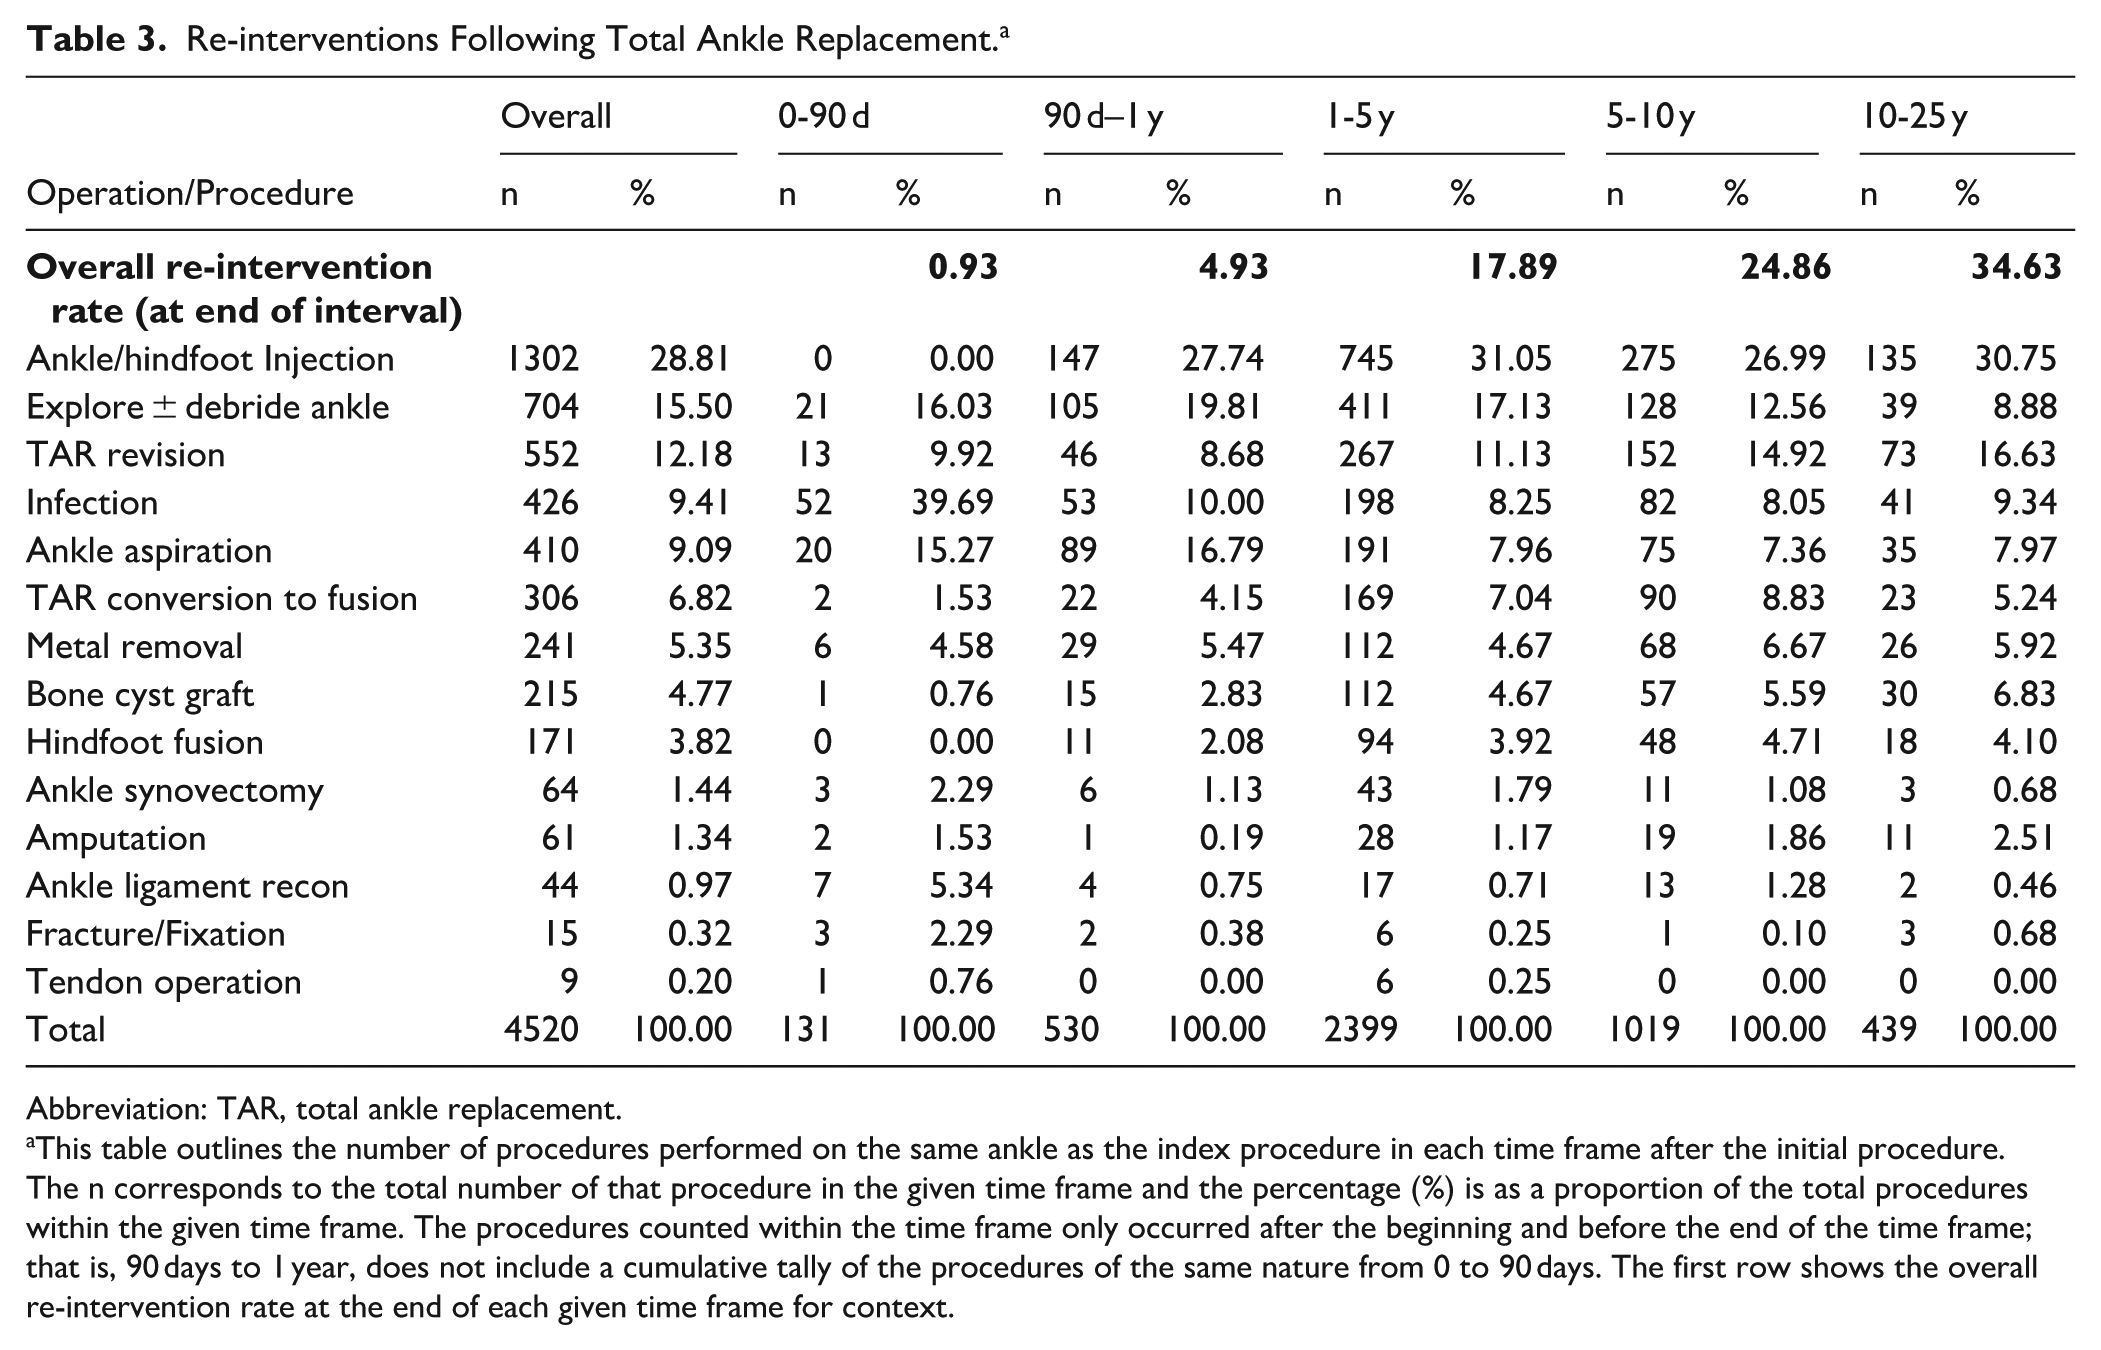
Re-interventions Following Total Ankle Replacement. a
Abbreviation: TAR, total ankle replacement.
This table outlines the number of procedures performed on the same ankle as the index procedure in each time frame after the initial procedure. The n corresponds to the total number of that procedure in the given time frame and the percentage (%) is as a proportion of the total procedures within the given time frame. The procedures counted within the time frame only occurred after the beginning and before the end of the time frame; that is, 90 days to 1 year, does not include a cumulative tally of the procedures of the same nature from 0 to 90 days. The first row shows the overall re-intervention rate at the end of each given time frame for context.
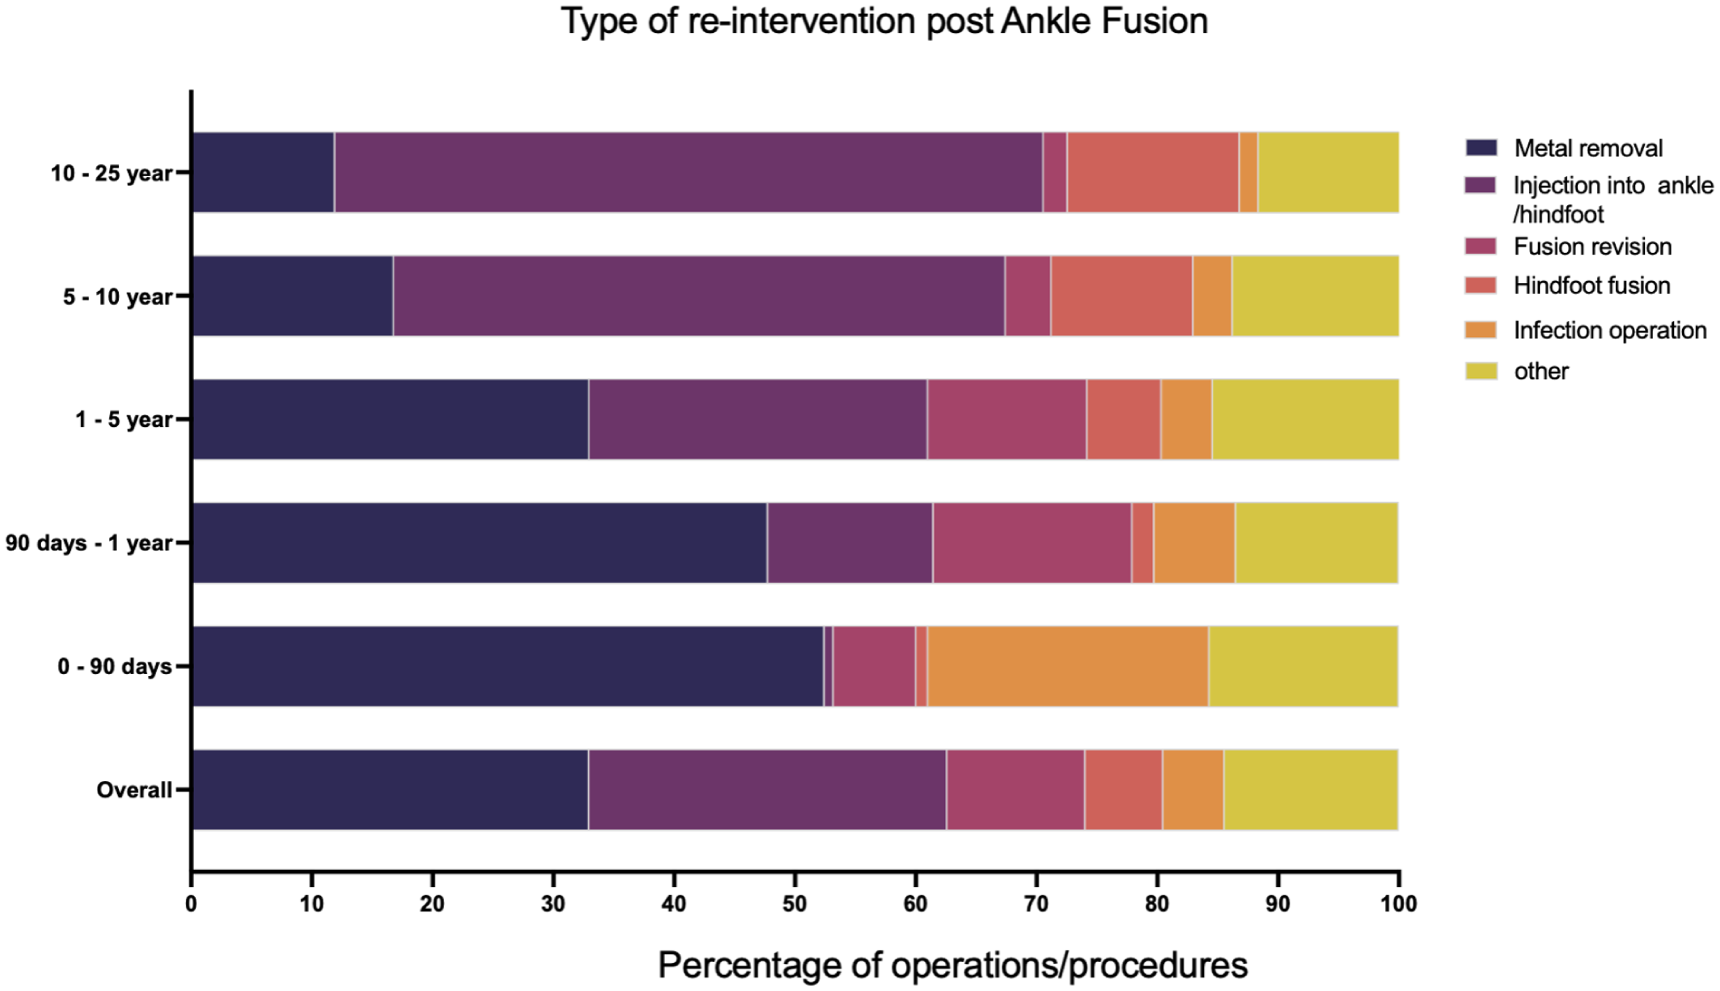
All operations to the same ankle and/or hindfoot as the original ankle fusion were analysed and classified based on the nature of the operation. Data shown are the operation as a proportion of all reinterventions at a particular time point: 0-90 days show all operations that occurred between day 0 and day 90; 90 days–1 year is operations between day 90 and day 365; 1-5 years is data between 1 year and up to 5 years post index procedure; 5-10 years is operations over 5 years and up to 10 years post index procedure; 10-25 years is operations over 10 years and up to 25 years post index procedure.
Re-interventions Following Ankle Fusion. a
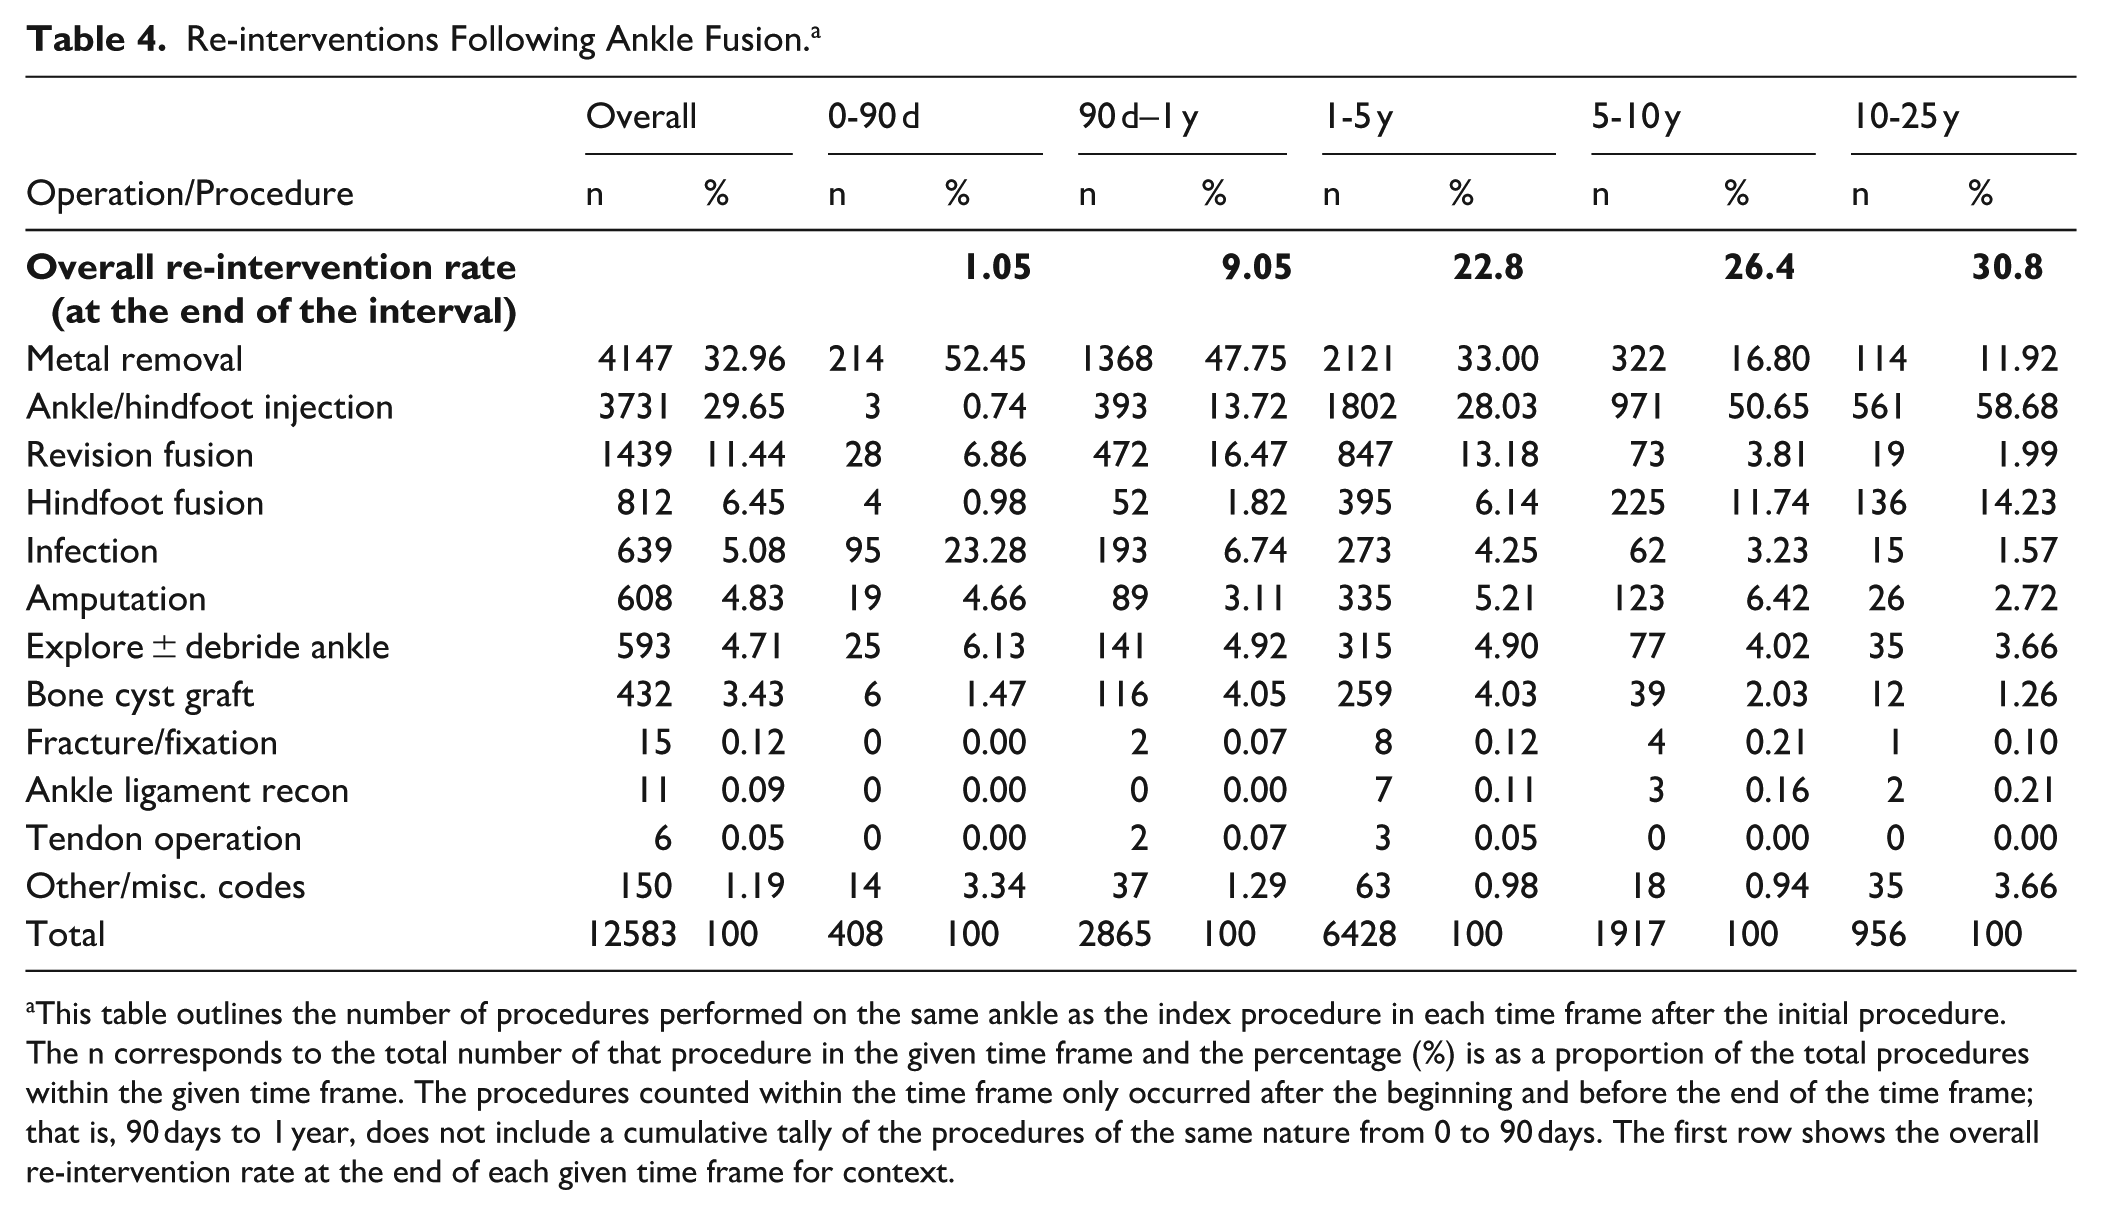
This table outlines the number of procedures performed on the same ankle as the index procedure in each time frame after the initial procedure. The n corresponds to the total number of that procedure in the given time frame and the percentage (%) is as a proportion of the total procedures within the given time frame. The procedures counted within the time frame only occurred after the beginning and before the end of the time frame; that is, 90 days to 1 year, does not include a cumulative tally of the procedures of the same nature from 0 to 90 days. The first row shows the overall re-intervention rate at the end of each given time frame for context.
Discussion
The study is the first national population study of its kind to inform patients and clinicians on the long-term implications of TAR vs AF for end-stage arthritis. Our data demonstrate that both operations have a very low risk of peri-operative complications, but in the long-term AF was associated with lower revision rates (3.1% vs 13.6% for TAR), lower re-operation rates (30.8% v 35% for TAR), and no significant increase in the risk of subsequent hindfoot fusion compared with TAR (8.1% AF vs 6.8% TAR).
Revision and Re-intervention Rates
The observed 10-year TAR revision rate of 10 335 patients was 10.9%, and the 20-year revision rate was 13.5%. This is lower than the pooled data of 4123 patients from 3 Registries with long follow-up data (New Zealand, Sweden, and Norway), demonstrating mean revision rates of 34% at 15 years and 38% at 19 years. 29 Our observations, however, are consistent with a recent study involving a subset of 5562 TARs from linked England HES-National Joint Registry data that found 10-year revision rates of 13.8%. 19
It is not clear why TAR revision rates are lower in the United Kingdom compared with more established Registries. Single-centre studies have shown low early revision rates for more modern prostheses, 33 and these are increasingly used in England. 1 The NJR-HES linked study also found a survival advantage for the more modern Infinity TAR compared with other implants, but interestingly not when compared to the STAR implant that has been widely used for decades.8,12 A limitation of the HES data is that it does not contain information on the specific implants used, the extent of deformity, or surgical techniques.
Alternatively, the lower TAR revision rates in England may reflect surgical caution in attempting revision surgery. TAR revision procedures are complex, require a high level of experience and have poor outcomes compared to primary TAR.9,10,30 For these reasons, HES revision rates of TAR are not necessarily the same as failure rates of TAR, with symptomatic patients potentially being dissuaded from surgery. The large number of minor operations we observe enroute to the major revision supports this understandable procrastination (Figure 5 and Table 3). More than half (52%) of all re-interventions post TAR in England involve ankle exploration/debridement, aspiration, and/or injection.
At our own centre, we found TAR revision surgery had very poor post-operative Manchester-Oxford Foot Questionnaire 27 scores. 31 Despite this, 73% of patients reported an overall improvement and would recommend the surgery, implying even worse pre-operative scores and indicating a high “threshold” for surgery. A similar phenomenon was described in revision of total (TKR) vs uni-compartmental (UKR) knee arthroplasty, where worse scores were needed before the more demanding TKR revision. 16
It is similarly possible that the observed AF revision rate does not reflect the true non-union rate; for example the TARVA trial found a far higher “symptomatic” non-union rate of 7% at 1 year. 14 This is a limitation of our study, in that it does not detect patients with delayed-union or non-union who do not undergo revision surgery. It is also possible that patients underwent revision procedures that were not specifically coded as such. For this reason, we used HES data to generate an unbiased list of all operations (OPCS-4 codes) performed on the ipsilateral foot/ankle to identify any possible operations not coded as revision fusions (Figures 5 and 6 and Tables 3 and 4). The commonest re-interventions were removal of metal, hindfoot injection, and hindfoot fusion. A further 4.7% (of all re-interventions) were coded as ankle joint debridement/exploration. Although unlikely, we cannot exclude that some of these were mis-coded ankle fusion revision procedures.
Low Risk of Adjacent Joint Fusion Post AF
Our study does not support the hypothesis that AF predisposes patients to adjacent joint fusion. A major concern of AF has been that sacrificing ankle range of motion comes with the long-term “cost” of adjacent joint fusion and ultimately a rigid ankle-hindfoot.32,35 SooHoo et al 32 found TAR was associated with a lower rate of subtalar joint (STJ) fusion at 5 years vs AF: 0.7% vs 2.8% respectively (hazard ratio = 0.28, 95% CI 0.09-0.87, P = .03). In a recent single-centre study of >250 AF patients, Kaplan-Meier analysis estimated an STJ “survivorship” of 74% at 9 years despite only 4% (11 patients in total) requiring an STJ fusion, highlighting the potential limitations of applying survival analysis to smaller cohorts. 35 In this 25-year study of over 40 000 patients, we defined hindfoot fusion very broadly and included any codes for subtalar joint fusion, triple fusion, hindfoot fusion, and talo-navicular joint fusion. Based on these national population data, the risk of subsequent hindfoot fusion is low (8.6%) and not significantly different to the hindfoot fusion rate post TAR (6.8%). The latter also excludes patients who received a revision TAR, many of whom underwent a TTC fusion as their “revision TAR” procedure and ended up with a rigid ankle/hindfoot complex. It further excludes any patients who had a primary TAR following a previous hindfoot fusion (Supplementary Figure 2).
We accept there may also be a “high threshold” to fusing the hindfoot in someone with AF. This study is limited to investigating hindfoot fusion rates, not hindfoot arthritis. Of note, a similar percentage of hindfoot injections was observed post TAR vs AF (Tables 3 and 4, Figures 5 and 6). A further limitation of the HES database is that it does not include functional data or patient-reported outcome measures. The TARVA prospective randomized controlled trial found significant, and similar, improvements MOXFQ at 1 year following both TAR and AF. 14
Low 90-Day Mortality and Morbidity
Both TAR and AF are safe operations with very low 90-day mortality and morbidity rates. The observed pulmonary embolus rate post AF of 0.58% is higher than TAR (0.23%), but both are low overall in comparison to recently published prospective UK Foot Ankle Thrombo-Embolism Audit (UK-FATE) data showing an overall Foot Ankle peri-operative VTE rate of 1.1%. 25 A meta-analysis of 6 studies found an increased rate of complications post AF compared with TAR but a lower re-intervention and revision rate. 22 The Canadian Orthopaedic Foot and Ankle Society (COFAS) Prospective Ankle Reconstruction Database of 388 ankles (281 TAR and 107 AF) found higher peri-operative complications following TAR, and similar improvements in outcome scores. 9 A more recent meta-analysis involving 13 studies found no difference in post-operative complication rates between TAR and AF. 24
The 90-day mortality rate post AF was 0.41 vs 0.23 post TAR (odds ratio 0.57; Figure 1). It is only after 7 years that the observed mortality rate post TAR is greater than in patients post AF (Supplementary Figure 3). This finding was unexpected and is an area of future investigation. The survival curves continue to diverge such that by 15 years, 59% survival (95% CI 58%-61%) was seen in TAR patients, compared with 67% (95% CI 66%-68%) in AF patients. TAR was more commonly performed on patients over the age of 60 years old (78% vs 54% of AF; Table 1), although this alone may not fully explain the observed differences in patient survival. This is not a matched study; however, the 2 groups were similar in terms of other demographics (Table 1). Future work involving well-matched cohorts is required to investigate if there is a genuine associated long-term reduction in survival associated with TAR.
Further Limitations
All HES database studies are limited by the accuracy of the recorded OPCS-4 and ICD-10 codes. The results and conclusions drawn are susceptible to coding misclassification or omission, and do not include patients with incomplete data (Supplementary Figures 1 and 2).
A major limitation of this study is the confounding effect of the inherent selection bias of patients receiving either AF or TAR. We chose to analyse un-matched population data rather than apply adjustment models, for example, propensity score matching, that greatly diminishes the numbers in each group. 20 We began with the assumption that for the last 25 years, health care professionals and patients have used the information available to them to make the most appropriate individual choice of TAR or AF. We were interested in the real-world consequences of these choices. Age was the only patient demographic with significant difference. This fits with our clinical practice whereby younger, fitter, more active patients are thought to have a greater risk of TAR revision and so are more likely to undergo AF. However, the estimate of size effect testing revealed this difference to be of minimal practical significance (Table 1).
Further work will focus on subgroup analysis of open vs arthroscopic ankle fusion, the effect of arthritis aetiology on outcomes, and an economic analysis of TAR vs AF.
Conclusions
Both TAR and AF for end-stage arthritis are effective operations with very low peri-operative complication rates. The observed revision rate of TAR in this national population study is 13.5% over 20 years and lower than reported previously. There was no long-term difference in fusion rates of adjacent joints in AF vs TAR. Overall, these observations alone do not support the use of TAR over AF in treating end-stage isolated ankle arthritis.
Supplemental Material
sj-jpg-3-fai-10.1177_10711007251388444 – Supplemental material for Long-term Consequences of Total Ankle Replacement vs Ankle Fusion in England: A 25-Year National Population Study of 41 000 patients
Supplemental material, sj-jpg-3-fai-10.1177_10711007251388444 for Long-term Consequences of Total Ankle Replacement vs Ankle Fusion in England: A 25-Year National Population Study of 41 000 patients by Conor Hennessy, Simon Abram, Rick Brown, Constantinos Loizou, Robert Sharp and Adrian Kendal in Foot & Ankle International
Supplemental Material
sj-pdf-1-fai-10.1177_10711007251388444 – Supplemental material for Long-term Consequences of Total Ankle Replacement vs Ankle Fusion in England: A 25-Year National Population Study of 41 000 patients
Supplemental material, sj-pdf-1-fai-10.1177_10711007251388444 for Long-term Consequences of Total Ankle Replacement vs Ankle Fusion in England: A 25-Year National Population Study of 41 000 patients by Conor Hennessy, Simon Abram, Rick Brown, Constantinos Loizou, Robert Sharp and Adrian Kendal in Foot & Ankle International
Supplemental Material
sj-pdf-2-fai-10.1177_10711007251388444 – Supplemental material for Long-term Consequences of Total Ankle Replacement vs Ankle Fusion in England: A 25-Year National Population Study of 41 000 patients
Supplemental material, sj-pdf-2-fai-10.1177_10711007251388444 for Long-term Consequences of Total Ankle Replacement vs Ankle Fusion in England: A 25-Year National Population Study of 41 000 patients by Conor Hennessy, Simon Abram, Rick Brown, Constantinos Loizou, Robert Sharp and Adrian Kendal in Foot & Ankle International
Supplemental Material
sj-pdf-4-fai-10.1177_10711007251388444 – Supplemental material for Long-term Consequences of Total Ankle Replacement vs Ankle Fusion in England: A 25-Year National Population Study of 41 000 patients
Supplemental material, sj-pdf-4-fai-10.1177_10711007251388444 for Long-term Consequences of Total Ankle Replacement vs Ankle Fusion in England: A 25-Year National Population Study of 41 000 patients by Conor Hennessy, Simon Abram, Rick Brown, Constantinos Loizou, Robert Sharp and Adrian Kendal in Foot & Ankle International
Supplemental Material
sj-pdf-5-fai-10.1177_10711007251388444 – Supplemental material for Long-term Consequences of Total Ankle Replacement vs Ankle Fusion in England: A 25-Year National Population Study of 41 000 patients
Supplemental material, sj-pdf-5-fai-10.1177_10711007251388444 for Long-term Consequences of Total Ankle Replacement vs Ankle Fusion in England: A 25-Year National Population Study of 41 000 patients by Conor Hennessy, Simon Abram, Rick Brown, Constantinos Loizou, Robert Sharp and Adrian Kendal in Foot & Ankle International
Footnotes
Acknowledgements
There are no author affiliations. There are no sources of financial support and industry affiliations for those involved in this study.
Ethical Considerations
Ethical approval was not sought for the present study because the nature of the data requested, the methods of analysis, and dissemination were discussed with NHS Digital and the University of Oxford Clinical Trials and Research governance team (CTRG). Although the project was classified as research and has obtained university sponsorship under NDORMS, University of Oxford, it did not require ethical approval. No patient identifiable data is presented.
Funding
The authors disclosed receipt of the following financial support for the research, authorship, and/or publication of this article: support from the British Orthopaedic Foot and Ankle Society and Royal College of Surgeons of England.
Declaration of Conflicting Interests
The authors declared the following potential conflicts of interest with respect to the research, authorship, and/or publication of this article: Adrian Kendal, BMBCh, DPhil, reports disclosures related to manuscript of research grants from British Orthopaedic Foot Ankle Society and Royal College of Surgeons. No personal support. Disclosure forms for all authors are available online.
Supplemental Material
Supplementary material is available online with this article.
References
Supplementary Material
Please find the following supplemental material available below.
For Open Access articles published under a Creative Commons License, all supplemental material carries the same license as the article it is associated with.
For non-Open Access articles published, all supplemental material carries a non-exclusive license, and permission requests for re-use of supplemental material or any part of supplemental material shall be sent directly to the copyright owner as specified in the copyright notice associated with the article.