
Abstract
Background:
The diagnosis and treatment of distal tibiofibular syndesmosis (DTFS) injury can be challenging, especially in cases of subtle instability that may be masked on 2-dimensional conventional radiographs. Weightbearing computed tomography (WBCT) has recently emerged as a useful diagnostic tool allowing direct assessment of distal tibiofibular area widening. The purpose of the current study was to examine and report normal threshold values for DTFS area measurements in a cohort of healthy volunteers, assessing the ankles in natural weightbearing position and under subject-driven external rotation stress.
Methods:
In this prospective study, we enrolled 25 healthy volunteers without a history of DTFS injury or high ankle sprain, previous foot and ankle surgery, or current ankle pain. Subjects with any prior ankle injuries were excluded. Study participants underwent bilateral standing nonstress and external rotation stress WBCT scans. The DTFS area (mm2) was semiautomatically quantified on axial-plane WBCT images 1 cm proximal to the apex of the talar dome using validated software. Syndesmosis area values were compared between “unstressed” and “stressed” ankles, as well as left and right ankles. Statistical analysis was performed using independent t tests/Wilcoxon analysis with statistical significance defined as P <.05.
Results:
The study cohort consisted of 50 ankles in 25 patients (12 males, 48%) with a mean age of 28.7 ± 9.3 years. In the unstressed ankle, the mean pooled DTFS area was determined to be 103.8 + 20.8 mm2. The mean syndesmosis area of unstressed left ankles (104.2 + 19.5 mm2) was similar to unstressed right ankles (109.2 + 17.2 mm2) in the cohort (P = .117). With external rotation stress, the DTFS area of left ankles (mean difference −0.304 mm2, CI −12.1 to 11.5; P = .082), right ankles (mean difference −5.5 mm2, CI 16.7-5.7; P = .132), and all ankles (mean difference −2.9 mm2, CI −10.8 to 5.1; P = .324) remained similar.
Conclusion:
This study presents normal values and range for DTFS area calculation. In uninjured ankles with expected intact ligaments, subject-driven external rotation stress did not result in significant widening of the DTFS space as imaged on with WBCT.
Level of Evidence:
Level II, cross-sectional study.
Introduction
The diagnosis and treatment of distal tibiofibular syndesmosis (DTFS) injury can be challenging, especially in cases of subtle instability that may be masked on 2-dimensional conventional radiographs.7,16,24 Ignored or undiagnosed syndesmotic instability can result in irreversible morbidity, including pain, dysfunction, mortise incongruence, and early-onset ankle arthritis.11,29 Diagnosis has traditionally relied on clinical examination combined with pathology appreciable on an imaging modality, both of which have limitations. Weightbearing plain radiographs are widely available but are 2-dimensional with rather low sensitivity. Additionally, external rotation stress radiographs have been shown to preferentially stress the deltoid ligament instead of the ankle syndesmosis. 16 Advanced cross-sectional imaging including magnetic resonance imaging (MRI) is very sensitive in detecting DTFS injury but lack a comparison to the contralateral ankle and may miss dynamic instability unless bony relationships have become abnormal statically.8,31 Similarly, conventional computed tomography (CT) assesses bony structure and alignment in a nonstressed state. Ankle arthroscopy permits direct visualization of the syndesmosis but is invasive, costly, and requires a general anesthetic.20,21
Weightbearing computed tomography (WBCT) has emerged as a useful diagnostic tool allowing direct assessment of distal tibiofibular are widening while under physiologic load.1,7,10,12,18,22,30 Furthermore, anatomy of the distal tibia incisura has been shown to vary across individuals and WBCT allows evaluation of both injured and uninjured ankles.10,12,18 Instability of the DTFS represents a three-dimensional (3D) pathologic process that involves components of rotational and translational abnormality of fibular position relative to the distal tibia, and stressing the syndesmosis with external rotation torque has been demonstrated to be paramount to unmask joint instability.6,14 Area measurements of the distal tibiofibular incisura assessed 1 cm proximal to the tibial plafond using WBCT have been proposed as an accurate diagnostic tool to differentiate stable and unstable DTFS2,9,12,26; however, the literature lacks information regarding normal DTFS area measurements in asymptomatic ankles. The purpose of the current study was to provide baseline DTFS area values in normal stable ankles and to determine if limb internal rotation while standing still shows changes in this area value. Our hypothesis was that no significant widening would be observed when comparing limb rotated vs nonrotated standing ankles.
Materials and Methods
Following institutional review board approval (IRB), we prospectively enrolled 25 healthy adult (age > 18 y) volunteers without a history of DTFS injury or high ankle sprain, previous foot and ankle surgery, or current ankle pain. The design of the study was compliant with the Health Insurance Portability and Accountability Act (HIPAA) and the Declaration of Helsinki. Study participants underwent bilateral standing nonstress and external rotation stress WBCT scans. A cone-beam CT scanner was used for WBCT study acquisitions (PedCAT, CurveBeam, LLC). On nonstress WBCT scans, subjects stood with feet shoulder width apart in a natural, upright position with body weight evenly distributed. For external rotation stress of the ankle joint, patients were instructed to rotate their body and position one of their lower extremities in maximal internal rotation while the foot was held in a fixed plantigrade position on the platform, leading to external rotation torque of the ankle joint. Study subjects underwent a total of 3 WBCT scans: nonstressed physiological weightbearing load and external rotation stress of separately of each lower extremity independently.
The DTFS area (mm2) measurements were semiautomatically quantified on axial-plane WBCT images 1 cm proximal to the apex of the tibial plafond using dedicated software (Figure 1; CubeVue; CurveBeam, LLC). 3 The apex of tibial plafond was digitally marked using the software program, leading the axial plane automatically to 1 cm proximal to the marked point. The area of the syndesmosis was then delineated by 2 tangential lines from the anterior and posterior cortices of the tibia and fibula as previously described. 12 The area between the fibula and the distal tibia between the 2 marked lines (apex of the distal tibia articular dome and 1 cm proximal) were then automatically calculated by the software in millimeters squared, based on a Hounsfield units (HU) algorithm (250 HU bony threshold).
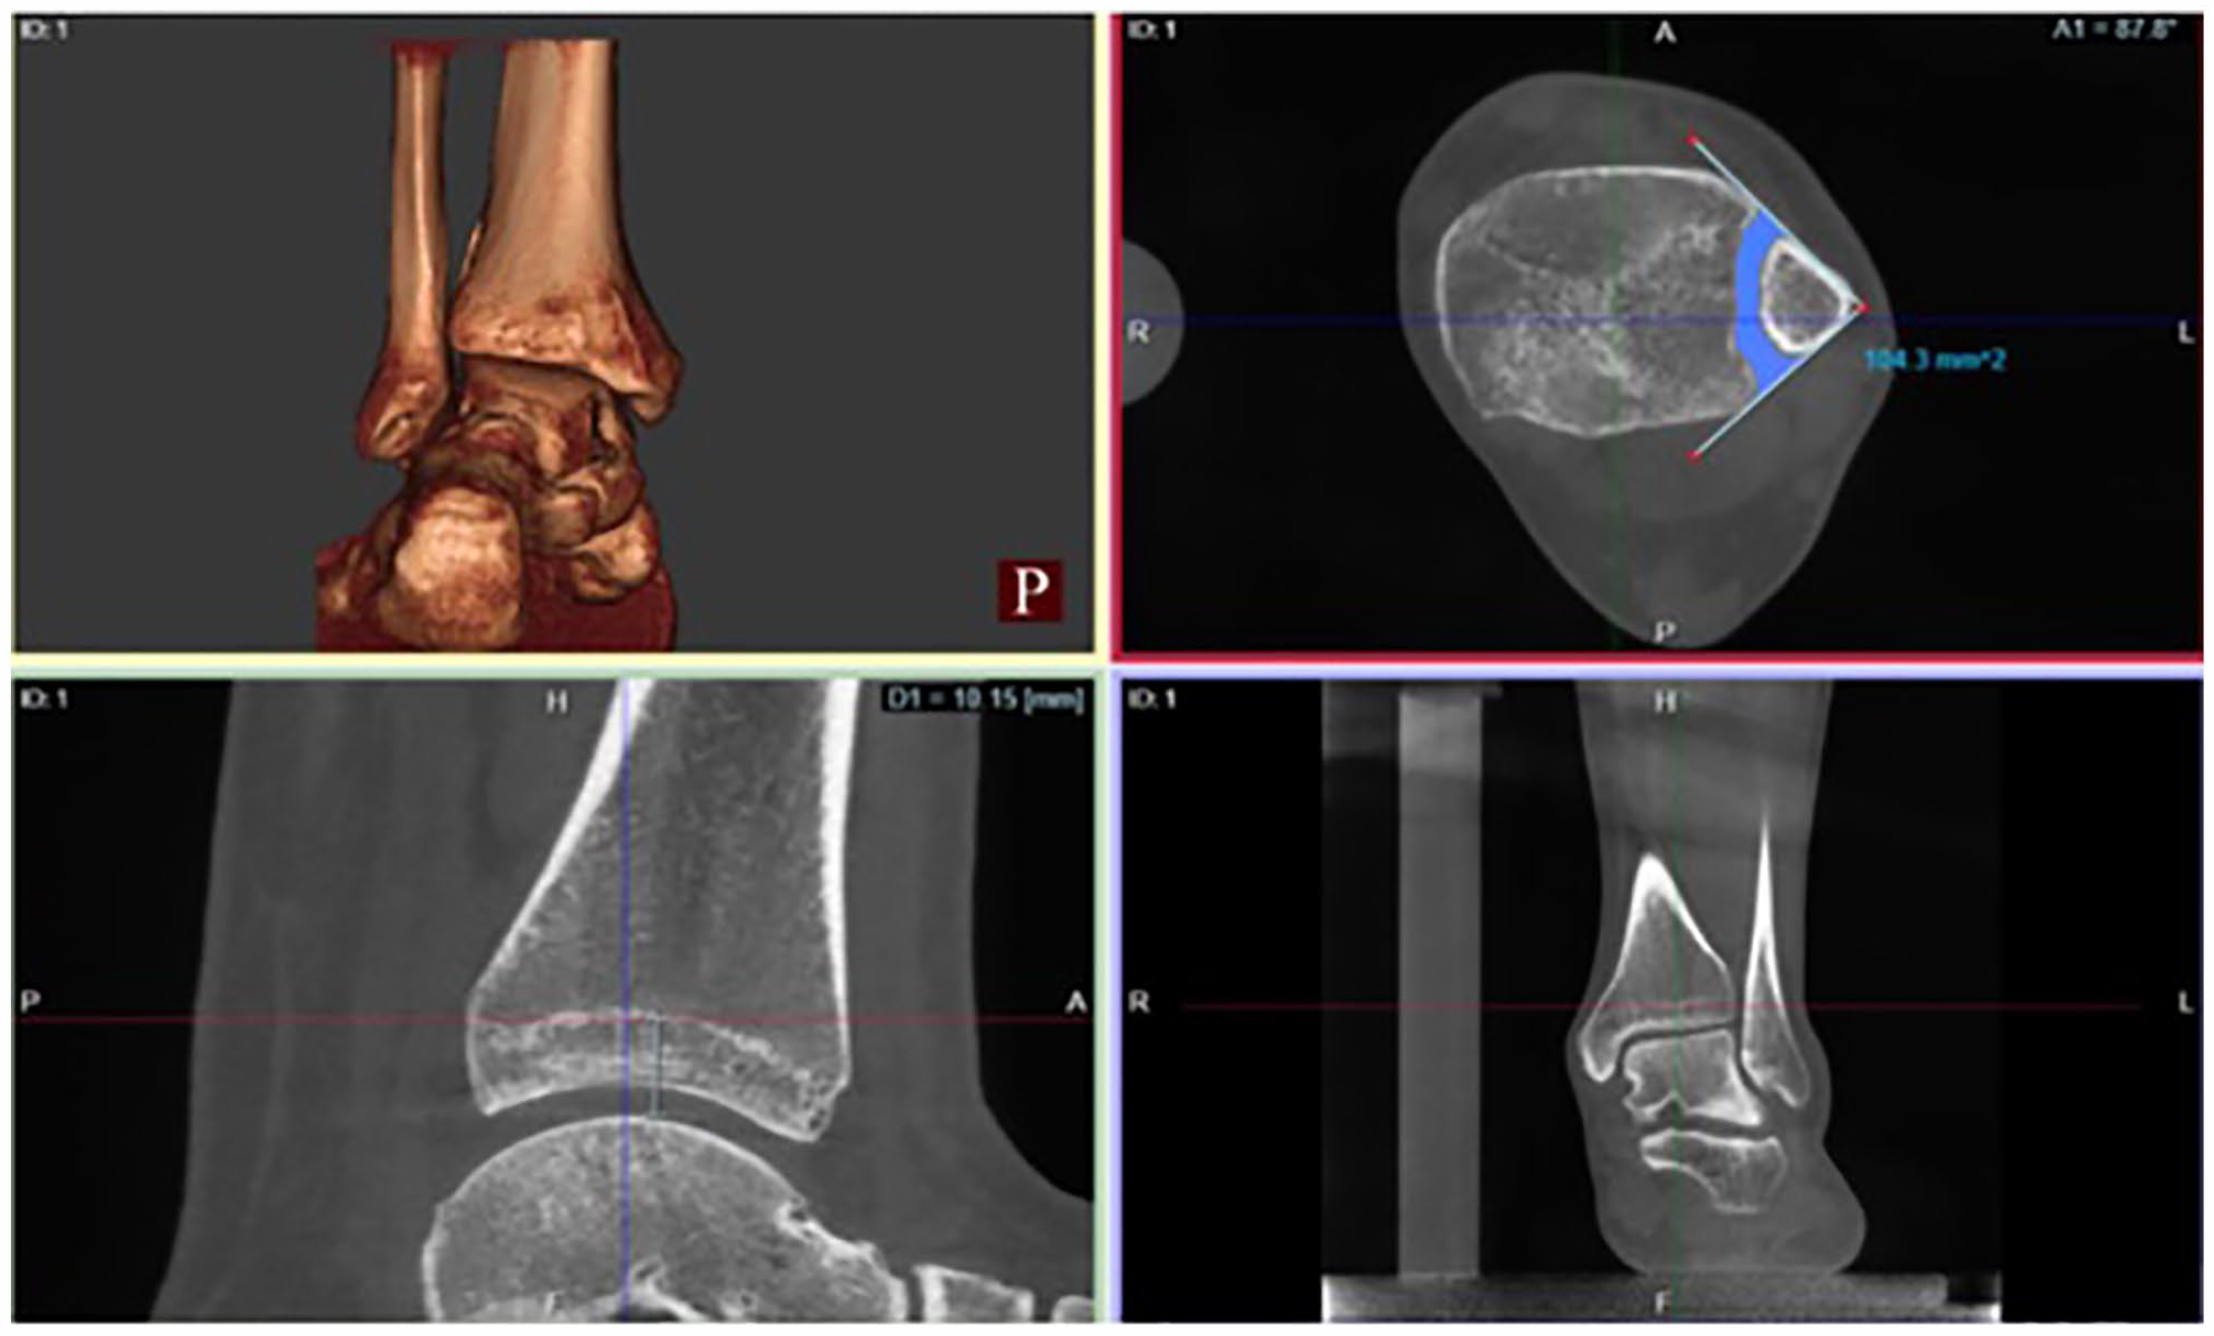
Example of distal tibiofibular syndesmosis (DTFS) area quantification. Area measurements are obtained 1 cm proximal to the apex of the tibial plafond (bottom left and bottom right images). Two lines are drawn along the anterior and posterior edges of the syndesmotic space in the axial plane (top right image). DTFS area in millimeters squared is measured automatically by the software.
Statistical Analysis
A sample sizing was executed using G*Power (version 3.1.9.6; Dusseldorf University, Dusseldorf, Germany). The calculation was based on a recent systematic review of DTFS area measurements on normal and injured ankles. 26 The average percentage increase in DTFS area measurements without external rotation stress on injured ankles was 40% when compared to normal contralateral noninjured ankles. To be able to detect a 5% difference in area measurements between unstressed and stressed normal ankles, a total of 21 ankles would be needed in each group to achieve a power of 95%, with an alpha of 0.05. Syndesmosis area values were assessed for normality using the Shapiro-Wilk test, and then compared between nonstressed and stressed ankles, as well as left and right ankles, using paired t tests and Wilcoxon analysis with statistical significance, defined as P <.05.
Results
The study cohort consisted of 50 ankles in 25 patients (12 males, 13 females) with a mean age of 28.7 + 9.3 years. In the unstressed condition, the mean DTFS area ± SD for all ankles assessed (n = 50) was determined to be 106.7 ± 18.3 mm2. The mean syndesmosis area of unstressed, not rotated, left ankles (104.2 ± 19.5 mm2) was similar to unstressed, not rotated, right ankles (109.2 ± 17.2 mm2, P = .117). With external rotation stress, the DTFS area of left ankles (mean difference −0.304 mm2, CI −12.1 to 11.5; P = .082), right ankles (mean difference −5.5 mm2, CI 16.7-5.7; P = .132), and all ankles (mean difference −2.9 mm2, CI −10.8 to 5.1; P = .324) remained similar (Table 1).
Mean DTFS Area Measurement Values ± SD of Both Stressed and Unstressed Ankles Stratified by Laterality.
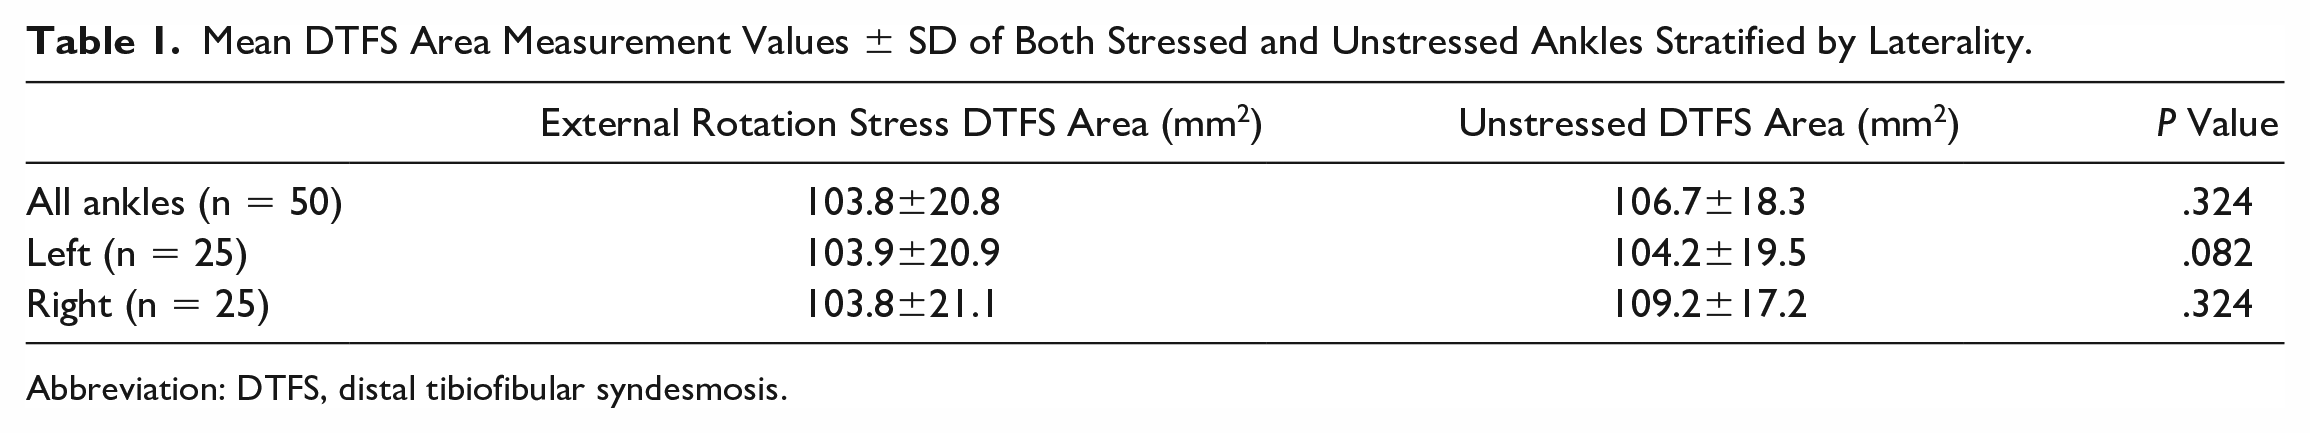
Abbreviation: DTFS, distal tibiofibular syndesmosis.
Discussion
Recognition and treatment of DTFS instability is vital to optimize clinical outcomes and prevent chronic ankle morbidity such as osteoarthritis. Traditional imaging tools for the DTFS are limited, lack sensitivity, and are unable to distinguish between DTFS injury and DTFS instability as they assess the ankle in a nonstressed state.4,16 Recent work has indicated that WBCT may be useful in detecting DTFS instability as it assesses the syndesmosis cross-sectionally with a physiologic load applied with the contralateral, presumably uninjured, limb as a reference.1,7,10,12,18,22,23,30
The evaluation of syndesmotic area measurements was first described in nonweightbearing CT images by Malhotra et al 22 who examined DTFS area measurements of nonstressed bilateral ankle in patients with known unilateral syndesmotic instability following ankle fracture. The authors reported a larger syndesmotic area of the injured ankles when compared to the asymptomatic limbs. Similarly, Hagemeijer et al 12 compared 12 patients with unilateral DTFS instability with 24 healthy controls using standing WBCT images and found increased area DTFS measurements in unstable ankles. The metric was also found to be extremely reliable with intra- and interobserver correlation coefficient values of 0.91 and 0.86, respectively. This study demonstrated that WBCT could differentiate between stable and unstable syndesmoses and benefited from the presence of an internal contralateral-side healthy control,12,22 but did not perform external rotation stress evaluation.
Prior clinical work examining DTFS in uninjured ankles of healthy patients using conventional CT and WBCT reported contradictory findings. Hoogervorst et al 13 and Shakoor et al 28 observed no differences in syndesmotic metrics with or without weightbearing, whereas Malhotra et al 22 reported subtle lateral and posterior translation of the fibula with respect to the tibia as well as minor fibular external rotation when standing physiological weightbearing load was applied. These findings highlight the wide variation of DTFS anatomy across individuals with a range of what should be considered physiologically normal.10,12,18
Combining external rotation stress with WBCT technology can be useful in cases of subtle syndesmotic instability when DTFS may be normal in a normal physiologic weightbearing state. 23 Krahenbuhl et al 15 have demonstrated in cadaveric testing that axial load in isolation was not enough to induce syndesmotic widening in specimens with severed syndesmotic ligaments. However, Krahenbuhl et al 14 later demonstrated that the ability to diagnose syndesmotic instability using WBCT measurements improved when external rotation torque was applied in cadaveric specimens with injured DTFS ligaments. The importance of the external rotational stress was then confirmed with a WBCT 3-dimensional evaluation of injured specimens by Burssens et al. 6 More recently, in a clinical diagnostic study, Rodrigues et al 27 also demonstrated significantly improved diagnostic accuracy of simulated WBCT imaging when external rotation stress was applied to detect DTFS instability. In our cohort, the mean pooled DTFS area across all unstressed ankles was found to be 106.7 ± 18.3 mm2. This is consistent with what has been reported in the literature.3,12,22,23 When stratifying unstressed DTFS area based on laterality, no difference was observed (P = .117). This finding is also in agreement with previous work comparing right ankles to left ankles using WBCT without an external rotation stress.12,19
The current study also demonstrated that when compared to the quiet “unstressed” weightbearing condition, no increase in DTFS WBCT area measurements was observed when an external rotation stress was added in uninjured healthy ankles. The lack of difference was again observed when data were stratified by laterality. This observation is important clinically, as an increase in DTFS with external rotation stress would potentially be consistent with presence of subtle syndesmotic instability, which was previously masked without stress applied to the ankle. The presence of an increased DTFS area measurement when external rotation stress is applied could then represent a potential indication for operative intervention to stabilize the DTFS. Further work is needed to delineate thresholds for the diagnosis of instability, correlate DTFS area with clinical outcomes, and discover potential other markers and measurements for subtle DTFS instability that may be masked by nonstress WBCT examinations. Three-dimensional analysis might add good information to future studies.17,25
The current study has several limitations. First, we are limited by our relatively small sample size, and the homogeneity of the subjects in terms of age and ethnicity as they were overwhelmingly Caucasian because we used a sample of convenience from midwestern USA. Second, patients with confirmed DTFS instability were not included in the study, which limits any direct comparisons and conclusions able to be drawn. With larger amounts of data, it is feasible to develop a true diagnostic study that would be capable of demonstrating threshold values of subtle syndesmotic instability appreciable on WBCT and subtle instability requiring external rotation stress. Third, absence of a dedicated torque platform to standardize the amount of external rotation could have led to a change in our findings—as each individual applied what they perceived to be adequate torque to the ankle, but we had no way to standardize the amount of torque. Lastly, other software programs and volumetric measurements to calculate DTFS area have been described and could be used in the assessment of syndesmotic instability. 5 The current study used a single area measurement method for DTFS instability quantification because it has been recently shown to have high diagnostic accuracy in major syndesmotic instability.9,26 However, clear superiority of one method over another has not been demonstrated in the literature.
Conclusion
This is the first study to assess standing WBCT DTFS area measurements in a cohort of volunteer controls, with and without external rotation stress. We sought to determine baseline DTFS values with external rotation stress and observed a mean DTFS value of 106.7 ± 18.3 mm². In uninjured ankles with expected intact ligaments, WBCT with a subject-driven external rotation stress did not result in significant area widening of the DTFS. The results of this study can be used in the literature as normal threshold values for DTFS area measurements, fostering additional investigations of patients with suspected and confirmed DTFS instability.
Supplemental Material
sj-pdf-1-fai-10.1177_10711007231205576 – Supplemental material for Normal Values for Distal Tibiofibular Syndesmotic Space With and Without Subject-Driven External Rotation Stress
Supplemental material, sj-pdf-1-fai-10.1177_10711007231205576 for Normal Values for Distal Tibiofibular Syndesmotic Space With and Without Subject-Driven External Rotation Stress by Alan Shamrock, Taylor J. Den Hartog, Kieran Dowley, Jonathan Day, Nacime Salomao Barbachan Mansur, Kepler Alencar Mendes de Carvalho, Cesar de Cesar Netto and Martin O’Malley in Foot & Ankle International
Footnotes
Ethical Approval
University Ethics Committee approved this research under the number 201912144 in accordance with the Declaration of Helsinki. The study complies with the Health Insurance Portability and Accountability Act (HIPAA).
Declaration of Conflicting Interests
The author(s) declared the following potential conflicts of interest with respect to the research, authorship, and/or publication of this article: Cesar de Cesar Netto, MD, PhD, reports payment or honoraria for lectures, presentations, speakers’ bureaus, manuscript writing, or educational events and stock or stock options from CurveBeam. Martin O’Malley, MD, reports payment or honoraria for lectures, presentations, speakers’ bureaus, manuscript writing, or educational events from Curvebeam. ICMJE forms for all authors are available online.
Funding
The author(s) received no financial support for the research, authorship, and/or publication of this article.
References
Supplementary Material
Please find the following supplemental material available below.
For Open Access articles published under a Creative Commons License, all supplemental material carries the same license as the article it is associated with.
For non-Open Access articles published, all supplemental material carries a non-exclusive license, and permission requests for re-use of supplemental material or any part of supplemental material shall be sent directly to the copyright owner as specified in the copyright notice associated with the article.