
Abstract
Background:
The current reference standard for postoperative evaluation of total ankle arthroplasty (TAA) positioning, weightbearing radiography (WBXR), is subject to technical bias. Weightbearing cone beam computed tomography (WBCT) enables visualization of the foot’s complex 3-dimensional (3D) structure under standing load. To date, no WBCT-based system for TAA positioning has been validated. The purpose of this study was to (1) assess TAA positioning using WBCT 3D models and (2) evaluate the agreement levels between 2 raters and thus evaluate the intermethod reliability with respect to WBXR.
Methods:
Fifty-five consecutive patients were retrospectively reviewed. Two raters independently created a 3D WBCT model using dedicated software and recorded the following measurements: α angle, tibiotalar surface angle (TSA), hindfoot angle (HFA), tibiotalar ratio (TTR), β angle, γ angle, and Φ angle. Measurements were repeated 2 months apart in similar, independent fashion and compared to WBXR. Interobserver, intraobserver, and intermethod agreements were calculated.
Results:
All 7 measurements showed good to excellent intraobserver and interobserver reliability (ICC 0.85-0.95). The intermethod (WBCT vs WBXR) agreement showed good agreement for the γ angle (ICC 0.79); moderate agreement levels for the α angle, TSA angle, β angle, and TTR (ICC 0.68, 0.69, 0.70, and 0.69, respectively); poor agreement for the HFA (ICC 0.25); and negative agreement for the φ angle (ICC −0.2).
Conclusion:
Position analysis of TAA using WBCT demonstrated good to excellent interobserver and intraobserver agreement and can be reliably used. Additionally, a negative to moderate agreement between standard WBCT and standard WBXR was found.
Level of Evidence:
Level III, retrospective study.
Introduction
Patients with end-stage osteoarthritis (OA) suffer from debilitating pain, physical function limitations, and a notable reduction to quality of life. Historically, total ankle arthroplasty (TAA) was associated with high levels of failure and revision. 11 Improvement in total ankle implant design, surgical techniques, and better patient selection has improved the clinical and surgical results rendering TAA a viable treatment option for OA.11,24 Accurate radiologic assessment of the foot and ankle alignment is fundamental for preoperative planning, intraoperative execution, and postoperative analysis.
The reference standard for evaluating preoperative and postoperative alignment is based on a standard weightbearing radiography (WBXR) in the anteroposterior, lateral, and hindfoot views. However, standard WBXR is limited, mainly because of object superimposition and rotational bias.3,19 Consequently, any measurement system based on a conventional WBXR is inherently flawed. 2
The introduction of weightbearing cone beam computed tomography (WBCT) has revolutionized the field of foot and ankle surgery. This relatively new imaging modality allows for the investigation of the complex 3-dimensional (3D) morphology of the foot and ankle under the influence of body weight and ground reaction force. It has been demonstrated that that angle measurements in the hindfoot alignment view as well as the medial distal tibial angle are more precise using WBCT compared to WBXR. 2 Additionally, newer segmentation software currently allows for the creation of 3D models, the production of anatomical axes, and semiautomatic measurement of angles.
In the field of TAA, a few authors proposed innovative techniques to use WBCT. de Cesar Netto et al 8 used a 3D biometric foot and ankle offset to predict additional realignment procedures in TAA. They concluded that the amount of further bony surgeries required increases significantly with an increase in the foot and ankle offset. Lintz et al 18 used WBCT to study the correlation between TAA malalignment and the formation of postoperative cysts and found a correlation between malalignment and cyst volume. Currently, there is no WBCT-based system that evaluates TAA positioning. Most surgeons rely on previously validated WBXR-based measurement systems such as the one by Usuelli et al 26 for the coronal and sagittal TAA alignment or the Manzi et al 19 system to assess the axial rotation in mobile- and fixed-bearing TAA.
Because WBCT has become an increasingly popular imaging modality, validating a reliable WBCT-based TAA alignment measurement system that will include both TAA extrinsic alignment and intrinsic alignment is vital. It will allow the use of WBCT for preoperative planning, the introduction of custom surgical cutting designs, and the postoperative alignment analysis. Additionally, because WBXR measurement systems are subjected to bias, it is also imperative to compare the results of WBCT measurements to the current reference standard to understand if intermethod disparities in a measurement exist.
Because WBCT has been shown to be more accurate in other fields of foot and ankle surgery, we hypothesize that this imaging modality can be used to successfully analyze TAA positioning. 17 This study aims to measure the TAA positioning in the coronal, sagittal, and axial planes using a WBCT-generated 3D model and to assess the interobserver and intraobserver reliability between 2 raters. Secondarily, this study aims to assesses the intermethod reliability between the currently available 2-dimensional measurement system (WBXR) and WBCT.
Material and Method
Patient population
This retrospective study was approved by our institutional review board (IRB Hu. A.R 887/20) and was conducted in accordance with the Helsinki declaration. Fifty-five consecutive patients were treated with TAA for end-stage OA between January 2021 and December 2022. The senior author, a high-volume foot and ankle surgeon specializing in ankle arthroplasty, performed all surgeries. Surgeries were performed through a lateral transfibular approach using a 2-component Zimmer Trabecular Metal Total Ankle prosthesis (Zimmer Biomet, Warsaw, IN, USA) according to the surgical technique previously published by Usuelli and Maccario. 25
The inclusion criteria for this study were patients >18 years old who underwent TAA through a transfibular lateral approach. Patients with active infection, revision surgeries, or subtalar fusion were excluded from this study. All patients had either a preoperative WBXR or WBCT. Two images, WBCT and WBXR, were acquired postoperatively during the 6-month follow-up in the outpatient setting. The images were identified through the medical center’s picture archiving and communications system (PACS) database. Demographics were obtained through electronic medical records scanned for relevant surgical and orthopaedic history. List of additional procedures performed are displayed in Table 1.
Additional Procedures (Total Ankles = 55).
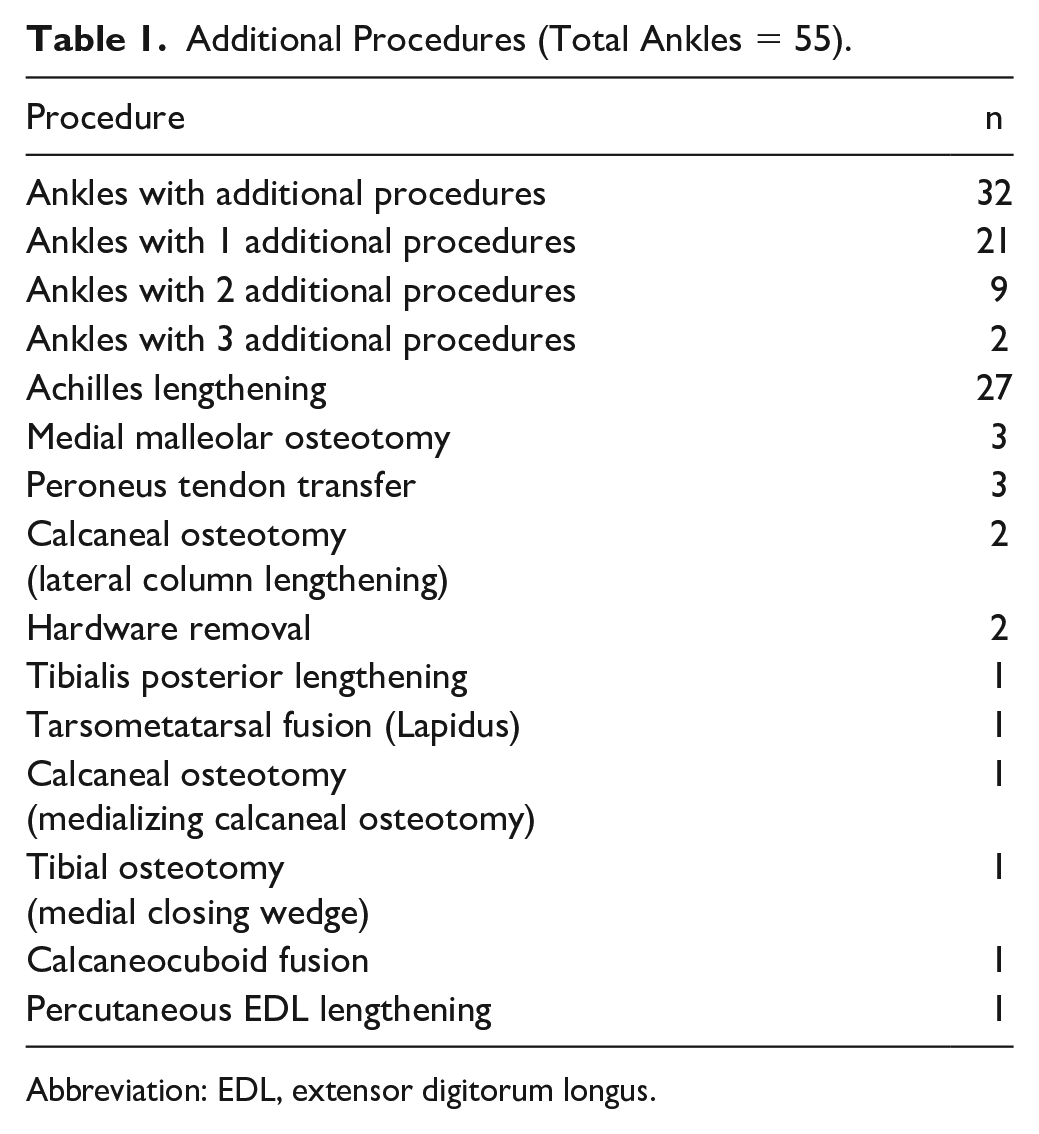
Abbreviation: EDL, extensor digitorum longus.
Primary and secondary outcome
The primary outcome of this study was to measure the TAA positioning alignment using WBCT 3D models. The secondary outcomes were to assess the interobserver and intraobserver agreement between 2 raters and evaluate the intermethod agreement between the conventional WBXR and WBCT.
WBCT scan protocol and image processing
A WBCT was performed in a unipedal single-stance position. The following image acquisition protocol was implemented for all patients: 0.2-mm slice thickness, 1-mm slice, and 0.014-mSv effective radiation dose per scan (Planmed Verity, Planmed Oy; Helsinki, Finland). The system requires separate acquisition of the forefoot and hindfoot. Then, a stitching algorithm (Planmeca, Roxemis; Helsinki, Finland) was used to fuse the multiple volumes into a single volume. Additionally, a metal artifact reduction algorithm was used to ensure high-quality images. Image analysis was performed semiautomatically by DISIOR Bonelogic Ortho Foot and Ankle Software (version 2.0; Helsinki, Finland). This software additionally has built-in metal artifact reduction capabilities that allow for image processing in the setting of implants. Initially, a 3D model was reconstructed from the WBCT-generated DICOM files. The software uses the 3D model and landmarks to calculate the axis and angles. An orthopaedic surgeon marked each bone in a designated maker point. The tibia and talar TAA components were marked as part of the respective bones. Subsequently, the software segmented the module. Each bone was assigned a different color. The raters then reviewed the proposed segmented model in cases where the suggested model did not correspond accurately with the bone or TAA outlines. Correction to the segmentation was made manually, and the image was analyzed. The software automatically registered a mathematical model of the ankle on the image and computed the location of the measurement landmarks and longitudinal axes of the bones of interest. The software found the center curve of the foot and ankle bony structures by analyzing its cross sections along the respective bones and fitted axes representative of the center curve. The algorithm automatically recognized the metal components and identified them as an independent entity. The following measures were generated semiautomatically: the anatomical axis of the tibia (TAX), fibula (FAX), calcaneus (CAX), talus (TALAX), and the second metatarsus shaft (MATAX). Each rater generated a 3D model for each patient independently. Each case was assigned a random number, and a database containing all the images was compiled.
Two-dimensional radiographic evaluation of the alignment
The 2-dimensional coronal and sagittal angles were measured according to the Usuelli et al 26 measurement system, and the axial alignment was calculated according to the Manzi et al 19 system. The axial alignment was assessed using the Φ angle (Figure 1). The sagittal angles were evaluated using the β angle, γ angle, and tibiatalar ratio (TTR). The α angle, tibiotalar surface angle (TSA), and hindfoot angle (HFA) evaluated the coronal alignment.
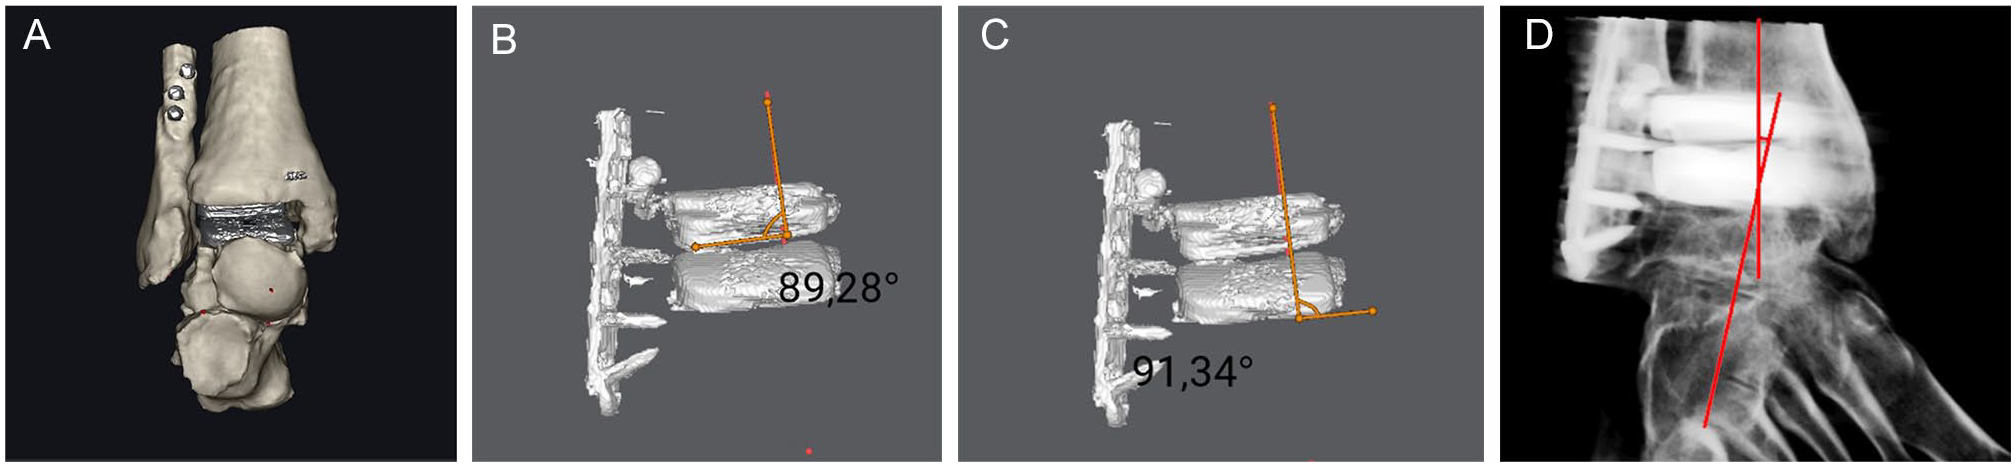
(A) Image of an anteroposterior view of the ankle. (B) Alpha angle: defined by the intersection of the axis of the tibia (TAX) and a line parallel to the anterior surface of the tibial component. (C) Tibiotalar surface angle (TSA) defined by the intersection of TAX and a line parallel to the anterior surface of the talar components. (D) Hindfoot angle (HFA) is defined as the intersection between the TAX and the longitudinal anatomical axes of the calcaneus (CAX).
Coronal alignment analysis
To accurately measure the coronal alignment, the model was rotated so that the anterior aspect of the measured component would be perfectly perpendicular to the viewer (Figure 1). Three angles were measured: α, TSA, and HFA.
The α angle and TSA assess the coronal alignment of the tibial and talar components. They are defined by the intersection of the semiautomatic axes of the tibia (TAX) and a line parallel to the anterior surface of the tibial component and talar components, respectively. The HFA assesses the hindfoot alignment, defined as the intersection between the TAX and the longitudinal anatomical axis of the calcaneus (CAX).
Sagittal alignment
To accurately measure the sagittal alignment of the components, the model was rotated so that the component’s medial aspect would be perpendicular to the raters (Figure 2). The β angle, which assesses the sagittal alignment of the tibial component, is defined by the intersection of the TAX and the line perpendicular to the medial surface of the tibial component.
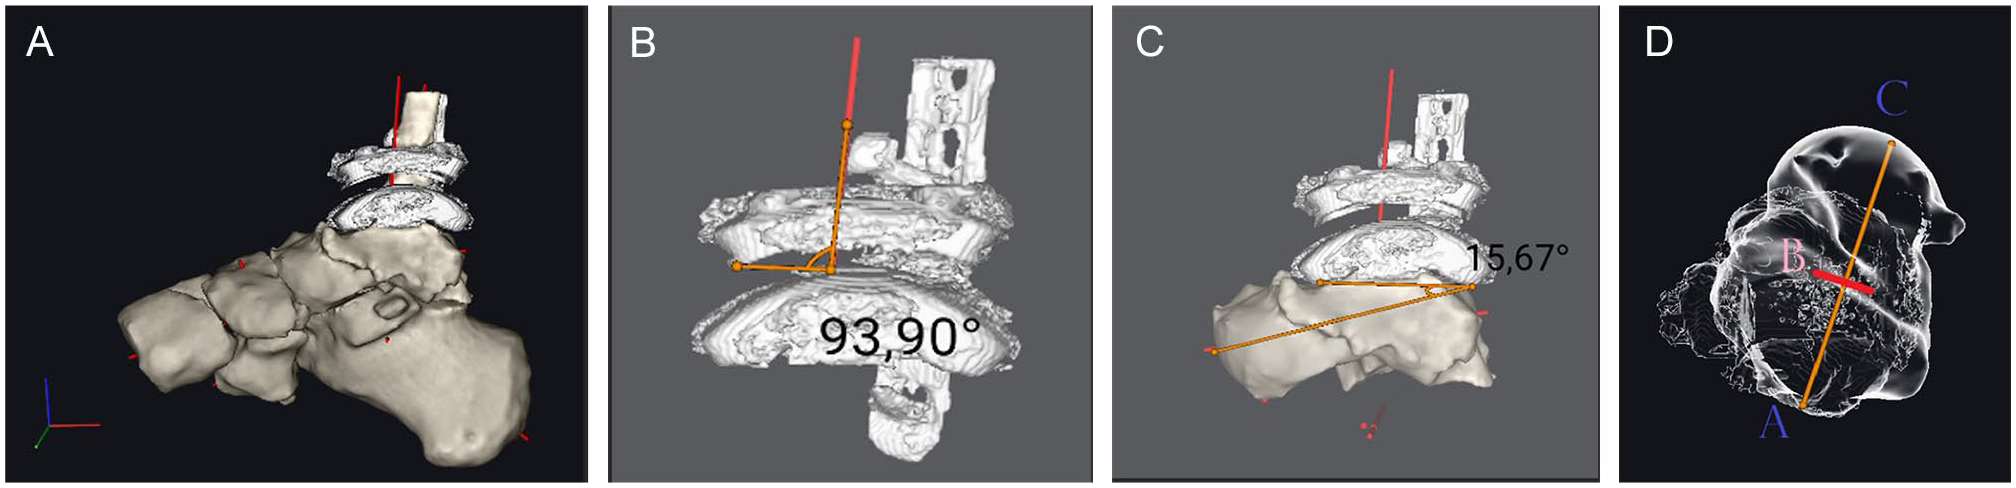
(A) Sagittal view of the foot and ankle. (B) The β angle is defined by the intersection of the TAX and the line perpendicular to the medial surface of the tibial component. (C) The γ angle, as defined by the intersection of the line perpendicular to the medial aspect of the talar component and the line from center of the talar head to the posterior aspect of the talar component. (D) The TTR. This model is rotated to an axial view. It is measured along the TALAX. Three points are assigned along the longitudinal axis. Point A corresponds to the posterior aspect of the talar component; point B corresponds to the intersection of TAX and the TALAX. Point C corresponds to the intersection of the TALAX and the talar head. TTR is the ratio of the posterior part of the talus (AB) to its full length (AC) expressed as a percentage. TALAX, longitudinal anatomical axis of the talus; TAX, axis of the tibia; TTR, tibiotalar ratio.
The γ angle assesses the talar inclination. It is defined as the intersection of 2 lines. The first is a line perpendicular to the medial aspect of the talar component, and a second line that passes from the posterior aspect of the talar component to the center of the talar head.
The third measurement, the TTR, assesses the anterior translation; the model was rotated to an axial view. It is measured along the TALAX. Three points were assigned along the TALAX. Point A corresponds to the posterior aspect of the talar component, point B corresponds to the intersection of the TAX and the TALAX, and the third point is the intersection of the TALAX and the talar head. TTR is defined as the ratio between the AB and the AC segment.
Axial rotation analysis
To accurately measure the axial rotation of the components, the model was rotated so that the TAX would be perfectly perpendicular to the viewer (Figure 3). Φ angle was calculated as the angle produced from the intersection of a line parallel to the medial aspect of the tibial component and one perpendicular to the MATAX.
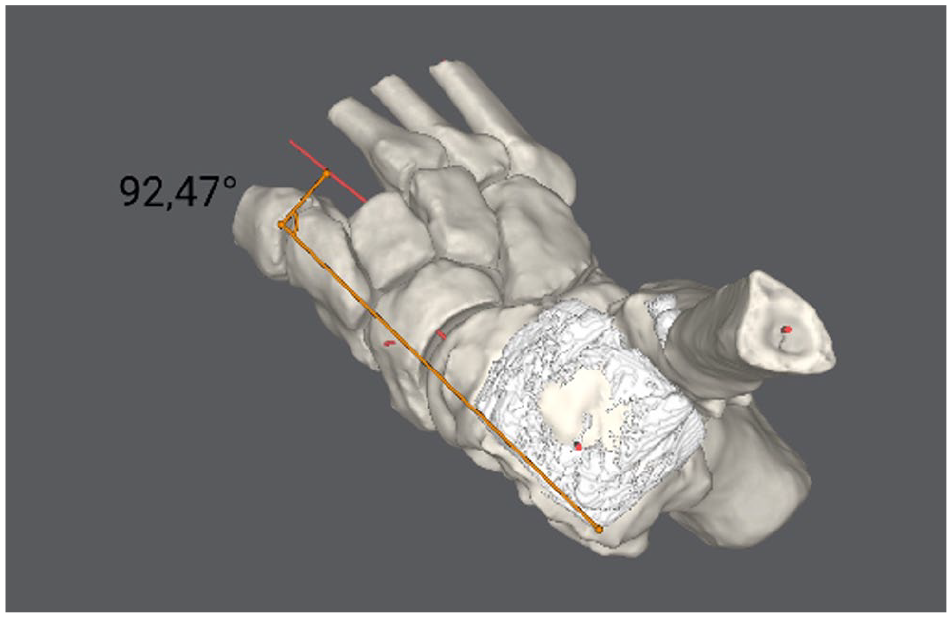
Axial rotation analysis. To accurately measure the axial rotation of the components, the model was rotated so that the TAX would be perfectly perpendicular to the viewer. Phi (Φ) angle was evaluated as a line parallel to the medial aspect of the tibial component and perpendicular to the axis of the second metatarsal shaft (MATAX). TAX, axis of the tibia.
Data comparison
To ensure the use of standardized measures, a pilot evaluation of 10 cases was performed. The angles were measured by 2 fellowship-trained foot and ankle orthopaedic surgeons. In the study, each surgeon received a digital folder containing the generated 3D model and was asked to measure the 7 suggested angles. Each rater conducted the analysis separately to ensure independent, anonymized results, eliminating potential biases. A minimum of 2 months after the initial reading, a second reading by the 2 raters took place, for a repeated measure of the 7 angles, following the same process. Subsequently, the interobserver, intraobserver, and intermethod agreement was evaluated.
Statistical analysis
For each rater, intraobserver reliability between the 2 readings and interobserver reliability between the 2 raters was calculated using interclass correlation coefficient (ICC) and presented with a 95% CI. The ICC was calculated for a single measure using a 2-way random effects model of absolute agreement. An ICC <0.5 was interpreted as poor agreement, ICC of 0.5 to 0.75 as moderate agreement, ICC of 0.75 to 0.9 was considered good agreement, and ICC of 0.9 to 1.0 as excellent agreement. 14 Continuous data are presented as mean ± SD. Statistical analysis was performed by IBM SPSS Statistics software (version 29.0; IBM Corp).
Results
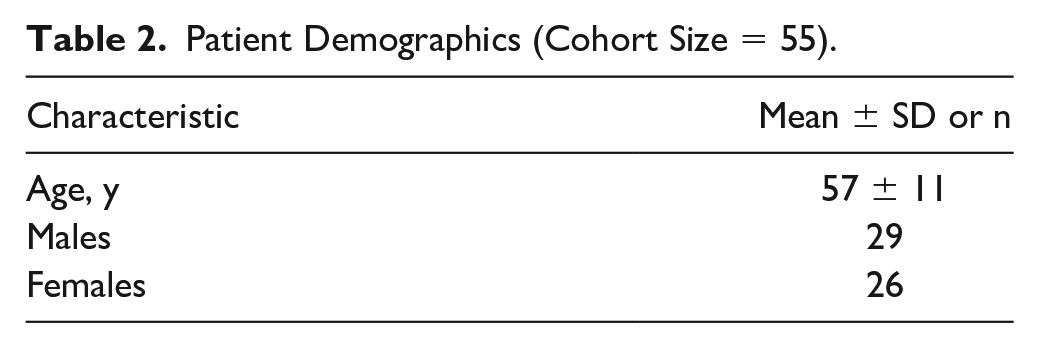
Patient demographics are displayed in Table 2. All measurements under WBXR and WBCT are presented in Tables 2 and Table 3. In the WBCT reading session, the individual intraobserver agreement levels were measured for each individual angle. For the first rater, good agreement was found for the α angle, γ angle, and Φ angle. Concurrently, rater 1 demonstrated an excellent agreement with respect to the TSA, HFA, and TTR. The second rater demonstrated an excellent agreement for all measurements and angles with the exception of the γ angle, for which a good agreement was noted (Table 3 and Table 4).
Patient Demographics (Cohort Size = 55).
Angles of Interest Separated by Their Orientation of Viewing on WBXR and WBCT.
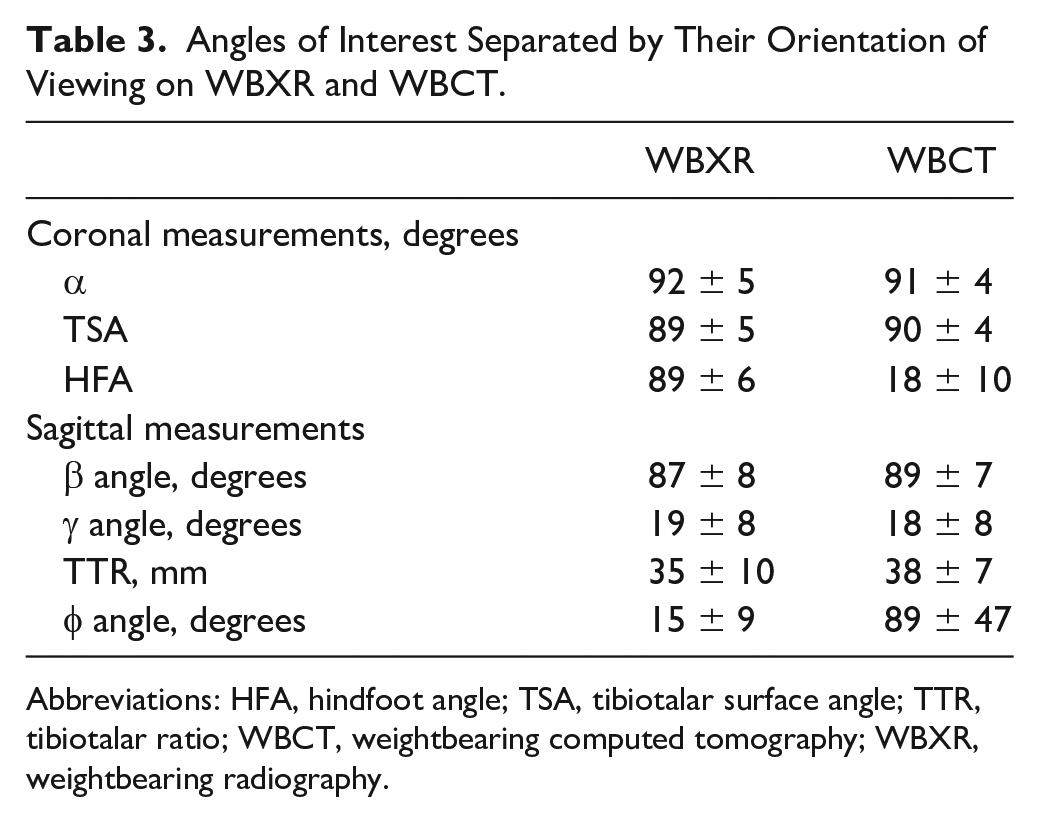
Abbreviations: HFA, hindfoot angle; TSA, tibiotalar surface angle; TTR, tibiotalar ratio; WBCT, weightbearing computed tomography; WBXR, weightbearing radiography.
Intraobserver Agreements of Each Rater During the WBCT Reading Session.
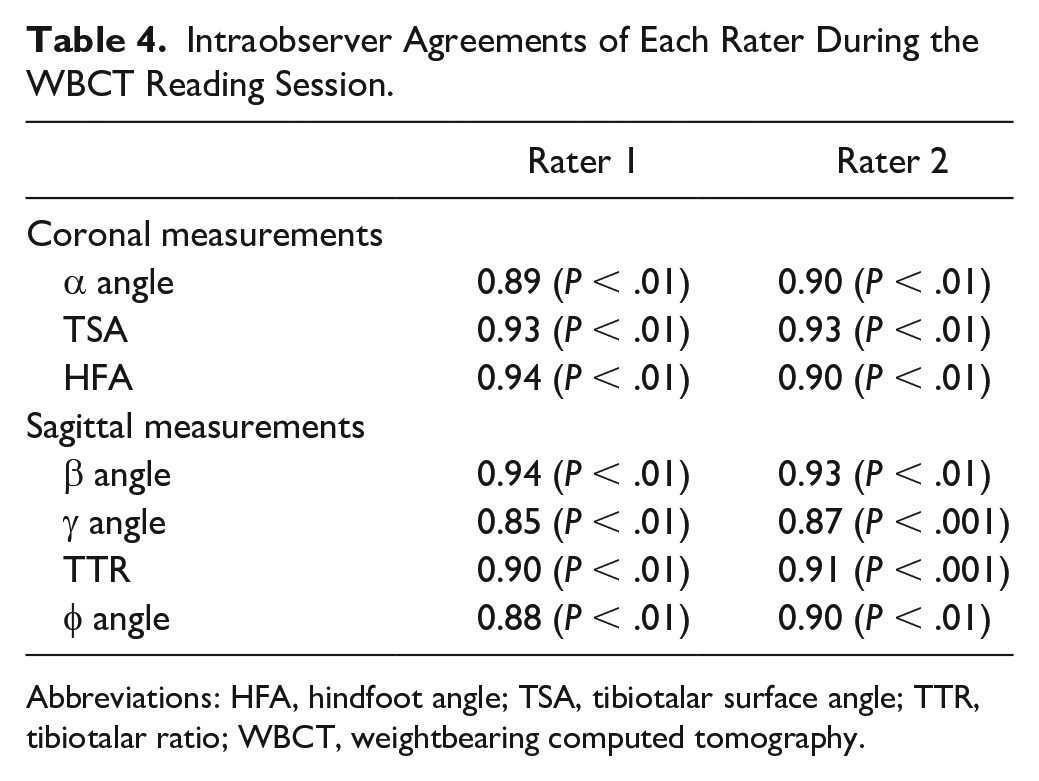
Abbreviations: HFA, hindfoot angle; TSA, tibiotalar surface angle; TTR, tibiotalar ratio; WBCT, weightbearing computed tomography.
The interobserver analysis in the first reading yielded an excellent agreement across all measurements and angles. The second session interobserver agreement was excellent for all angles aside from the good agreement derived for the γ angle (Table 4 and Table 5).
Interobserver Agreement Across the 2 Image-Viewing Sessions.
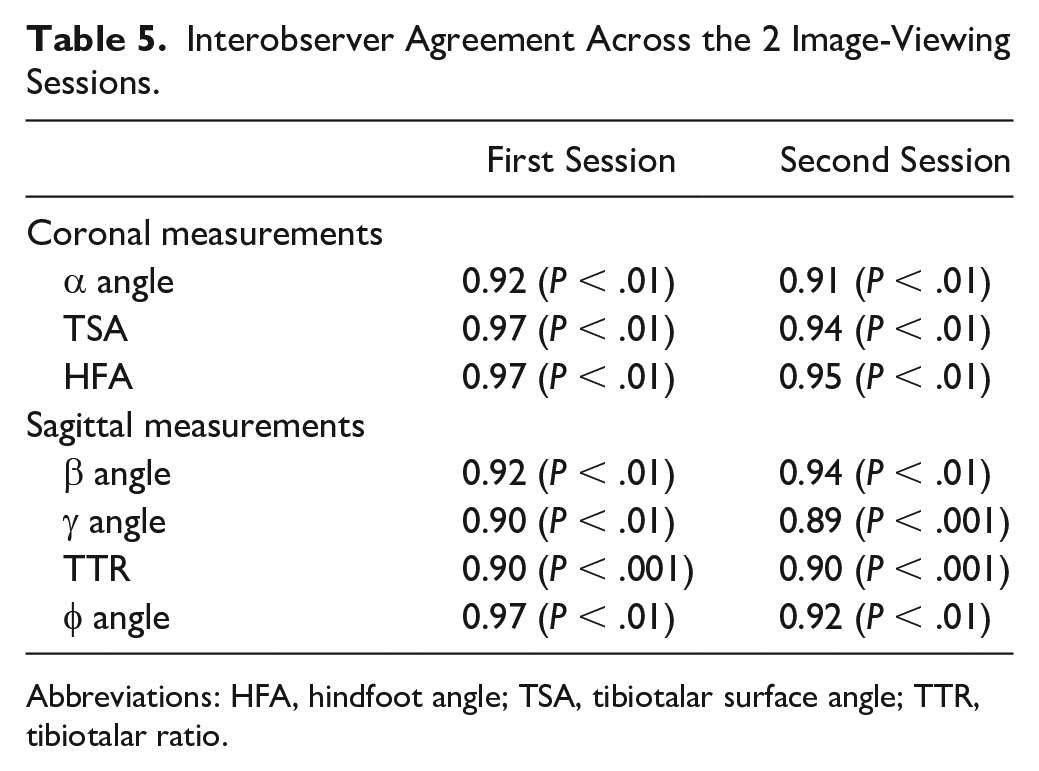
Abbreviations: HFA, hindfoot angle; TSA, tibiotalar surface angle; TTR, tibiotalar ratio.
The following mean intermethod agreement levels across the 4 readings were calculated. A good intermethod agreement was reported for the γ angle (0.79; P < .001). For the α angle, TSA, β angle, and TTR the agreement was moderate (0.68; P < .1, 0.69; P < .1, 0.7; P < .01, respectively). The agreement for the HFA was poor (0.25; P < .001), and a negative intermethod agreement for the Φ angle was observed (−0.2; P < .67).
Discussion
The principal finding of this study is that the WBCT measurements yielded good to excellent agreement levels of intraobserver and interobserver agreement across all 7 measurements (Tables 2 and 3). Secondarily, a good intermethod agreement was measured for the γ angle; moderate intermethod agreements were measured for the α angle, TSA, β angle, and TTR; poor intermethod agreement for the HFA; and negative intermethod agreement for the Φ angle.
Introducing a new surgical technique or technology should follow a specific, stepwise validation process, including concept/theory formation, procedure development and exploration, procedure assessment, and long-term evidence-based studies. 10
Introducing WBCT to the field of TAA should follow the same rigorous validation process. The current study used computer software to produce the anatomical axis of the tibia, talus, calcaneus, and second metatarsal in a semiautomatic manner based on WBCT imaging. Additionally, one angle was measured semiautomatically. The good to excellent intraobserver and interobserver agreement levels indicate that computer-generated 3D models are reliable in assessing TAA positioning.
The current study has a notable advantage. This is the first study that used semiautomatic generated 3D models to evaluate the positioning of TAA, especially in the setting of the rising popularity of this new technology.6,9 It can be used for preoperative planning, 3D printing, and postoperative analysis. Therefore, creating and validating a measurement system that can accurately evaluate postoperative positioning is imperative. However, semiautomatic measurements in the presence of high volume of artifacts are challenging. In our experience, the semiautomatic measurements generated where the bone-to-metal interface exists are unreliable. By using the anatomical axis as a reference, we overcame this limitation. We created a reliable and reproducible measurement system that entails the necessary means to evaluate TAA positioning in the coronal, sagittal, and axial planes. As of this writing, few studies have evaluated the implication and importance of alignment and rotation in these planes.5,12,16,20,22,27
Other authors have evaluated the reliability of semiautomatic applications based on WBCT measurements to evaluate foot and ankle alignment. de Cesar Netto et al 7 found higher reliability for semiautomatic measurements with respect to manual measurements. Bernasconi et al 4 assessed the interobserver and intraobserver reliability in assessing symptomatic pes cavovarus and found excellent interobserver agreement. The current study demonstrates a good to excellent agreement across all the angles that were measured using semiautomatic means. Unlike these studies, the current study evaluates postoperative positioning in the presence of many metal artifacts, rendering image processing more challenging and often time-consuming. We analyzed each case independently and were able to produce similar models and measurements, even in cases where a high quantity of metal implants was present. This indicates that WBCT and 3D models can be used for postoperative positioning evaluation. On the other hand, because of technical limitations, we could not measure in a semiautomatic manner the angles where the bone and metal interaction were involved (α, TSA, β, and γ angles). This is a significant disadvantage of this system.
The second outcome of this study was to compare the current reference standard, 2-dimensional WBXR images, to WBCT. Day et al 9 compared the WBCT 3D images to WBXR across 83 hallux valgus patients. They found very strong intraobserver reliability and moderate to very strong intermethod correlations. Kvarda et al 15 evaluated the agreement levels between semiautomated measurements based on WBCT and measurements of WBXR in normally aligned feet and ankles. They found that semiautomated measurements were more reliable than those derived from WBXR. In the current study, the coronal and sagittal alignment of the components yielded a moderate to good agreement level, and the coronal alignment of the hindfoot yielded only poor agreement. This indicates that comparing 2-dimensional results to WBCT results on the coronal and sagittal planes should be done cautiously. One angle, the φ angle, was used to assess the axial rotation of the components. Negative agreement levels were observed across all readings, indicating that 2-dimensional radiography results of axial plane alignment cannot be compared to WBCT.
The lack of intermethod agreement between WBCT and WBXR indicates that one system is less reliable or both systems need to be more reliable. Studies have demonstrated the inherent biases associated with conventional radiography such as rotational biases and superimposition, along with technical errors in positioning that may obscure the anatomic reality.1,3 Furthermore, the complex morphology of the foot and ankle requires precise assessment in 3 dimensions, which can now be feasibly performed in a standing position similar to standard radiogrpahs. 23 We assume that the current system is more reliable than the traditional WBXR.
This study is not without limitations. This measuring technique uses relatively expensive imaging modalities and software that are not readily available. Additionally, the software used often requires manual correction of the segmentation, and the number of attempts to achieve adequate image correction was not logged. Second, all retrospective studies are subject to bias. This is a relatively small cohort that tested a specific measuring system. We choose these 2 validated measurement systems because they include all the means to evaluate the positioning in the coronal, sagittal, and axial alignment19,26; however, other measurement systems exist, and a more extensive study should include more patients and additional measurements.13,21 We used the metal component as a reference point to increase reproducibility between the readings, even though WBXR usually relies on the foot and ankle as a reference. This could partially explain the discrepancy between WBXR and WBCT. Finally, we used a single-foot WBCT that requires image stitching to represent the foot and ankle, and its entirety and may have led to changes in how alignment was evaluated.
In conclusion, coronal, sagittal, and axial intrinsic and extrinsic alignment of the TAA component and hindfoot could be measured using WBCT 3D models with good to excellent interobserver and intraobserver agreement. Negative to a moderate intermethod agreement between WBXR and WBCT was measured, indicating that results between these 2 measures cannot be reliably compared. Because WBXR has been shown to be less reliable for 3D imaging, we assume that WBCT is more reliable in determining the TAA alignment. Finally, semiautomatic segmentation software is limited in measuring angles where a bone-to-metal interface exists.
Supplemental Material
sj-pdf-1-fai-10.1177_10711007231173672 – Supplemental material for Reliability of Cone Beam Weightbearing Computed Tomography Analysis of Total Ankle Arthroplasty Positioning and Comparison to Weightbearing X-Ray Measurements
Supplemental material, sj-pdf-1-fai-10.1177_10711007231173672 for Reliability of Cone Beam Weightbearing Computed Tomography Analysis of Total Ankle Arthroplasty Positioning and Comparison to Weightbearing X-Ray Measurements by Ben Efrima, Agustin Barbero, Joshua E. Ovadia, Cristian Indino, Camilla Maccario and Federico Giuseppe Usuelli in Foot & Ankle International
Footnotes
Declaration of Conflicting Interests
The author(s) declared the following potential conflicts of interest with respect to the research, authorship, and/or publication of this article: Federico Giuseppe Usuelli, MD, reports consulting fees from ZimmerBiomet. ICMJE forms for all authors are available online.
Funding
The author(s) received no financial support for the research, authorship, and/or publication of this article.
References
Supplementary Material
Please find the following supplemental material available below.
For Open Access articles published under a Creative Commons License, all supplemental material carries the same license as the article it is associated with.
For non-Open Access articles published, all supplemental material carries a non-exclusive license, and permission requests for re-use of supplemental material or any part of supplemental material shall be sent directly to the copyright owner as specified in the copyright notice associated with the article.