
Abstract
Background:
Ankle, hindfoot, and midfoot arthrodesis surgeries are standard procedures performed in orthopaedics to treat pain and functional disabilities. Although fusions can effectively improve pain and quality of life, nonunions remain a significant concern for surgeons. With the increased availability of computed tomography (CT), more surgeons rely on this modality for increased accuracy in determining whether a fusion was successful. The objective of this study was to report the rates of CT-confirmed fusion following ankle, hindfoot, or midfoot arthrodesis.
Methods:
A systematic review was performed using EMBASE, Medline, and Cochrane central register from January 2000 to March 2020. Inclusion criteria included studies with adults (<18 years) that received 1 or multiple fusions of the ankle, hindfoot, or midfoot. At least 75% of the study cohort must have been evaluated by CT postoperatively. Basic information was collected, including journal, author, year published, and level of evidence. Other specific information was collected, including patient risk factors, fusion site, surgical technique and fixation, adjuncts, union rates, criteria for successful fusion (%), and time of CT. Once data were collected, a descriptive and comparative analysis was performed.
Results:
Included studies (26, n = 1300) had an overall CT-confirmed fusion rate of 78.7% (69.6-87.7). Individual joints had an overall fusion rate of 83.0% (73-92.9). The highest rate of union was in the talonavicular joint (TNJ).
Conclusion:
These values are lower than previous studies, which found the same procedures to have greater than 90% fusion rates. With these updated figures, as confirmed by CT, surgeons will have better information for clinical decision making and when having informed consent conversations.
Introduction
Arthrodesis of the ankle, hindfoot, or midfoot are common procedures used to treat severe arthritis, trauma, instability, or deformity. These conditions can cause pain, functional disability, and impaired quality of life.2,21,32 Joint fusion may be performed when conservative management has failed. The goals of surgery are to reduce pain and improve patient function 11 ; however, high nonunion rates remain a significant concern.8,15,22,32,38,40,43
Traditionally, the assessment of union following joint fusion was through plain film radiographs and clinical findings. 9 There are several validated tools for assessing outcomes but typically patient-reported pain, stiffness, and difficulty weightbearing can be indications for the need for further intervention. In the case of unfavorable clinical outcomes, plain film radiographs can be utilized to evaluate union. However, the accuracy of radiographs has been questioned in determining osseous healing and has been shown to have poor correlation to bone strength during the fracture healing process.6,9 Additionally, there are no standardized views or analysis techniques in the literature for measuring fusion by plain radiographs. Coughlin et al 9 found that osseous healing appears to be overestimated by plain radiographs when compared to computed tomography (CT) images from the same time. Furthermore, assessment of fusion by plain film radiography becomes difficult when images become distorted by overlying casts/splints. 29 Previous studies using plain radiography have reported union rates between 80% and 100%.9,23,25,30,34
CT can be used to evaluate the osseous bridging. It allows for imaging of the fused joint in multiple planes to enhance the resolution in which joints can be evaluated. Limited studies are available investigating the CT-verified fusion rates of ankle, hindfoot, and midfoot fusions, this study aims to elucidate the overall rate of fusion from the current literature and compare it to previously published literature based on plain radiographs.
Materials and Methods
This systematic review was performed using a study protocol in accordance with the Preferred Reporting Items for Systematic Reviews and Meta-analyses (PRISMA) guidelines (Figure 1) and was registered with PROSPERO (CRD42020178703).
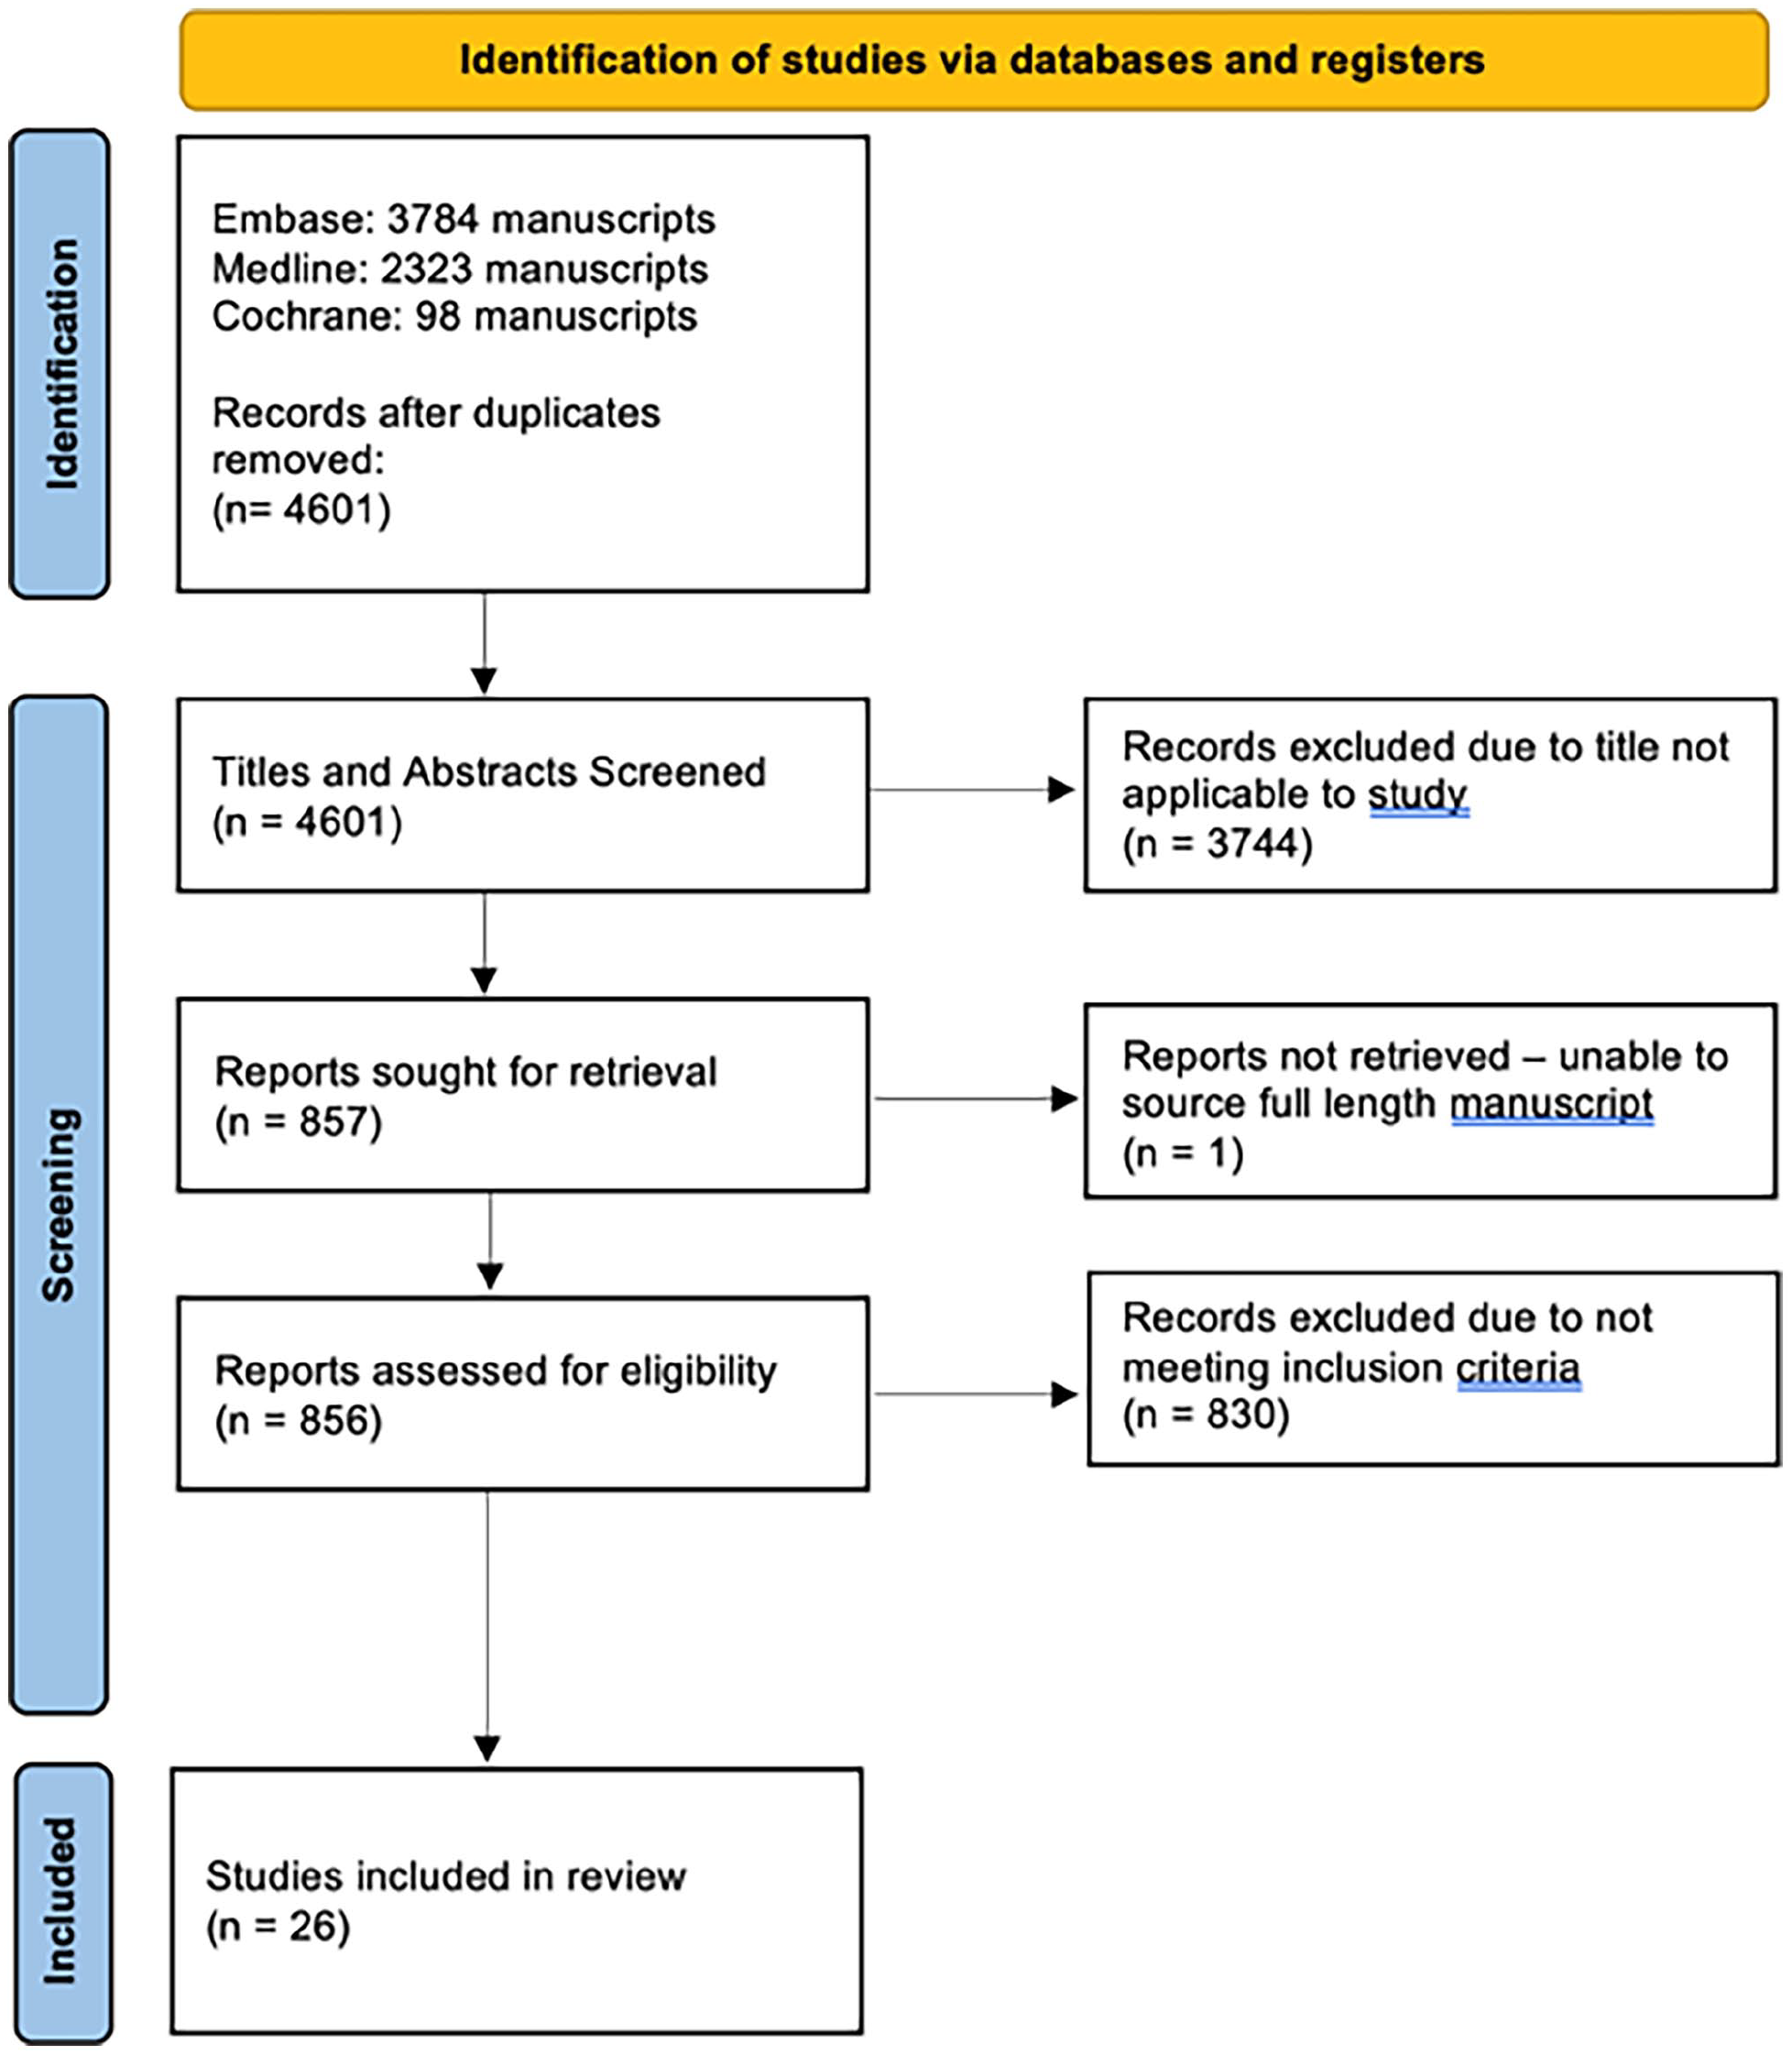
PRISMA flow diagram.
Search Strategy
With help from a medical librarian, a literature search was performed using the OVID search engine: EMBASE and Medline, Cochrane CENTRAL Register of Controlled Trials, and the Cochrane Database of Systematic Reviews in the English language from January 2000 to March 2020. The electronic search was supplemented by contacting authors for unavailable and ambiguous articles, along with bibliographic searches in the selected articles.
Search Terms
The search strategy input into OVID is provided in the supplemental material.
Study Selection
The studies identified in the search were compiled using EndNote and duplicates were deleted. Two authors (CS, ML) independently screened the titles and abstracts according to the inclusion and exclusion criteria. Disagreement at this stage led to inclusion. A full-text review was conducted independently by 2 authors (CS, ML) for inclusion and data extraction. Any discrepancies at this point in review were resolved by consensus decision or by a third reviewer (AD) if required.
Eligibility Criteria
Criteria for inclusion were investigations including adults (>18 years) that received 1 or multiple fusions of the ankle, hindfoot, or midfoot. Studies that were published from the year 2000 and more recently were included. Only studies that obtained CT scans for the evaluation of union rates of at least 75% of the study population were included.
Arthrodesis of the metatarsophalangeal (MTP) joints or distal were excluded. Case series including fewer than 10 patients were excluded as well as studies that included arthrodesis of joints in the acute fracture or septic joint setting.
Only studies written in English were included.
Data Extraction
A data extraction form was developed before the start of the review and the data items described below were collected and stored in a Microsoft Excel sheet. Data extraction was performed independently by 2 of the authors (CS, ML). Disagreement will be solved by discussion, contacting the study author or an arbitrator (AD). Author names, trial identification numbers (for randomized controlled trials), location, details of the intervention, number of participants, and date/duration were screened for the presence of multiple reports. Multiple reports of the same study were collated to make sure each study is only considered once.
Data Items
The following data were extracted from selected studies: journal, authors, year of publications, title, number of patients, patient risk factors, fusion site, surgical technique and fixation, adjuncts if any (allograft vs autograft), union rates, criteria for successful fusion (%), time of CT, duration of follow-up, and level of evidence.
Data Analysis
Descriptive analysis was performed using Microsoft Excel (365), utilizing the method described by Neyeloff et al. 36 Comparative analysis of patients within certain demographics (smoking status, presence of diabetes, primary vs revision surgery, and gender) was performed by comparing fusion outcomes within competing populations using Review Manager 5.4 (RevMan, Cochrane Collection, 2020).
Risk of Bias Analysis
The risk of bias or quality assessment was performed based on the Newcastle-Ottawa Scale of the studies included in the systematic review (Table 1).
Quality Assessment Based on the Newcastle-Ottawa Scale of Studies Included in the Systematic Review.
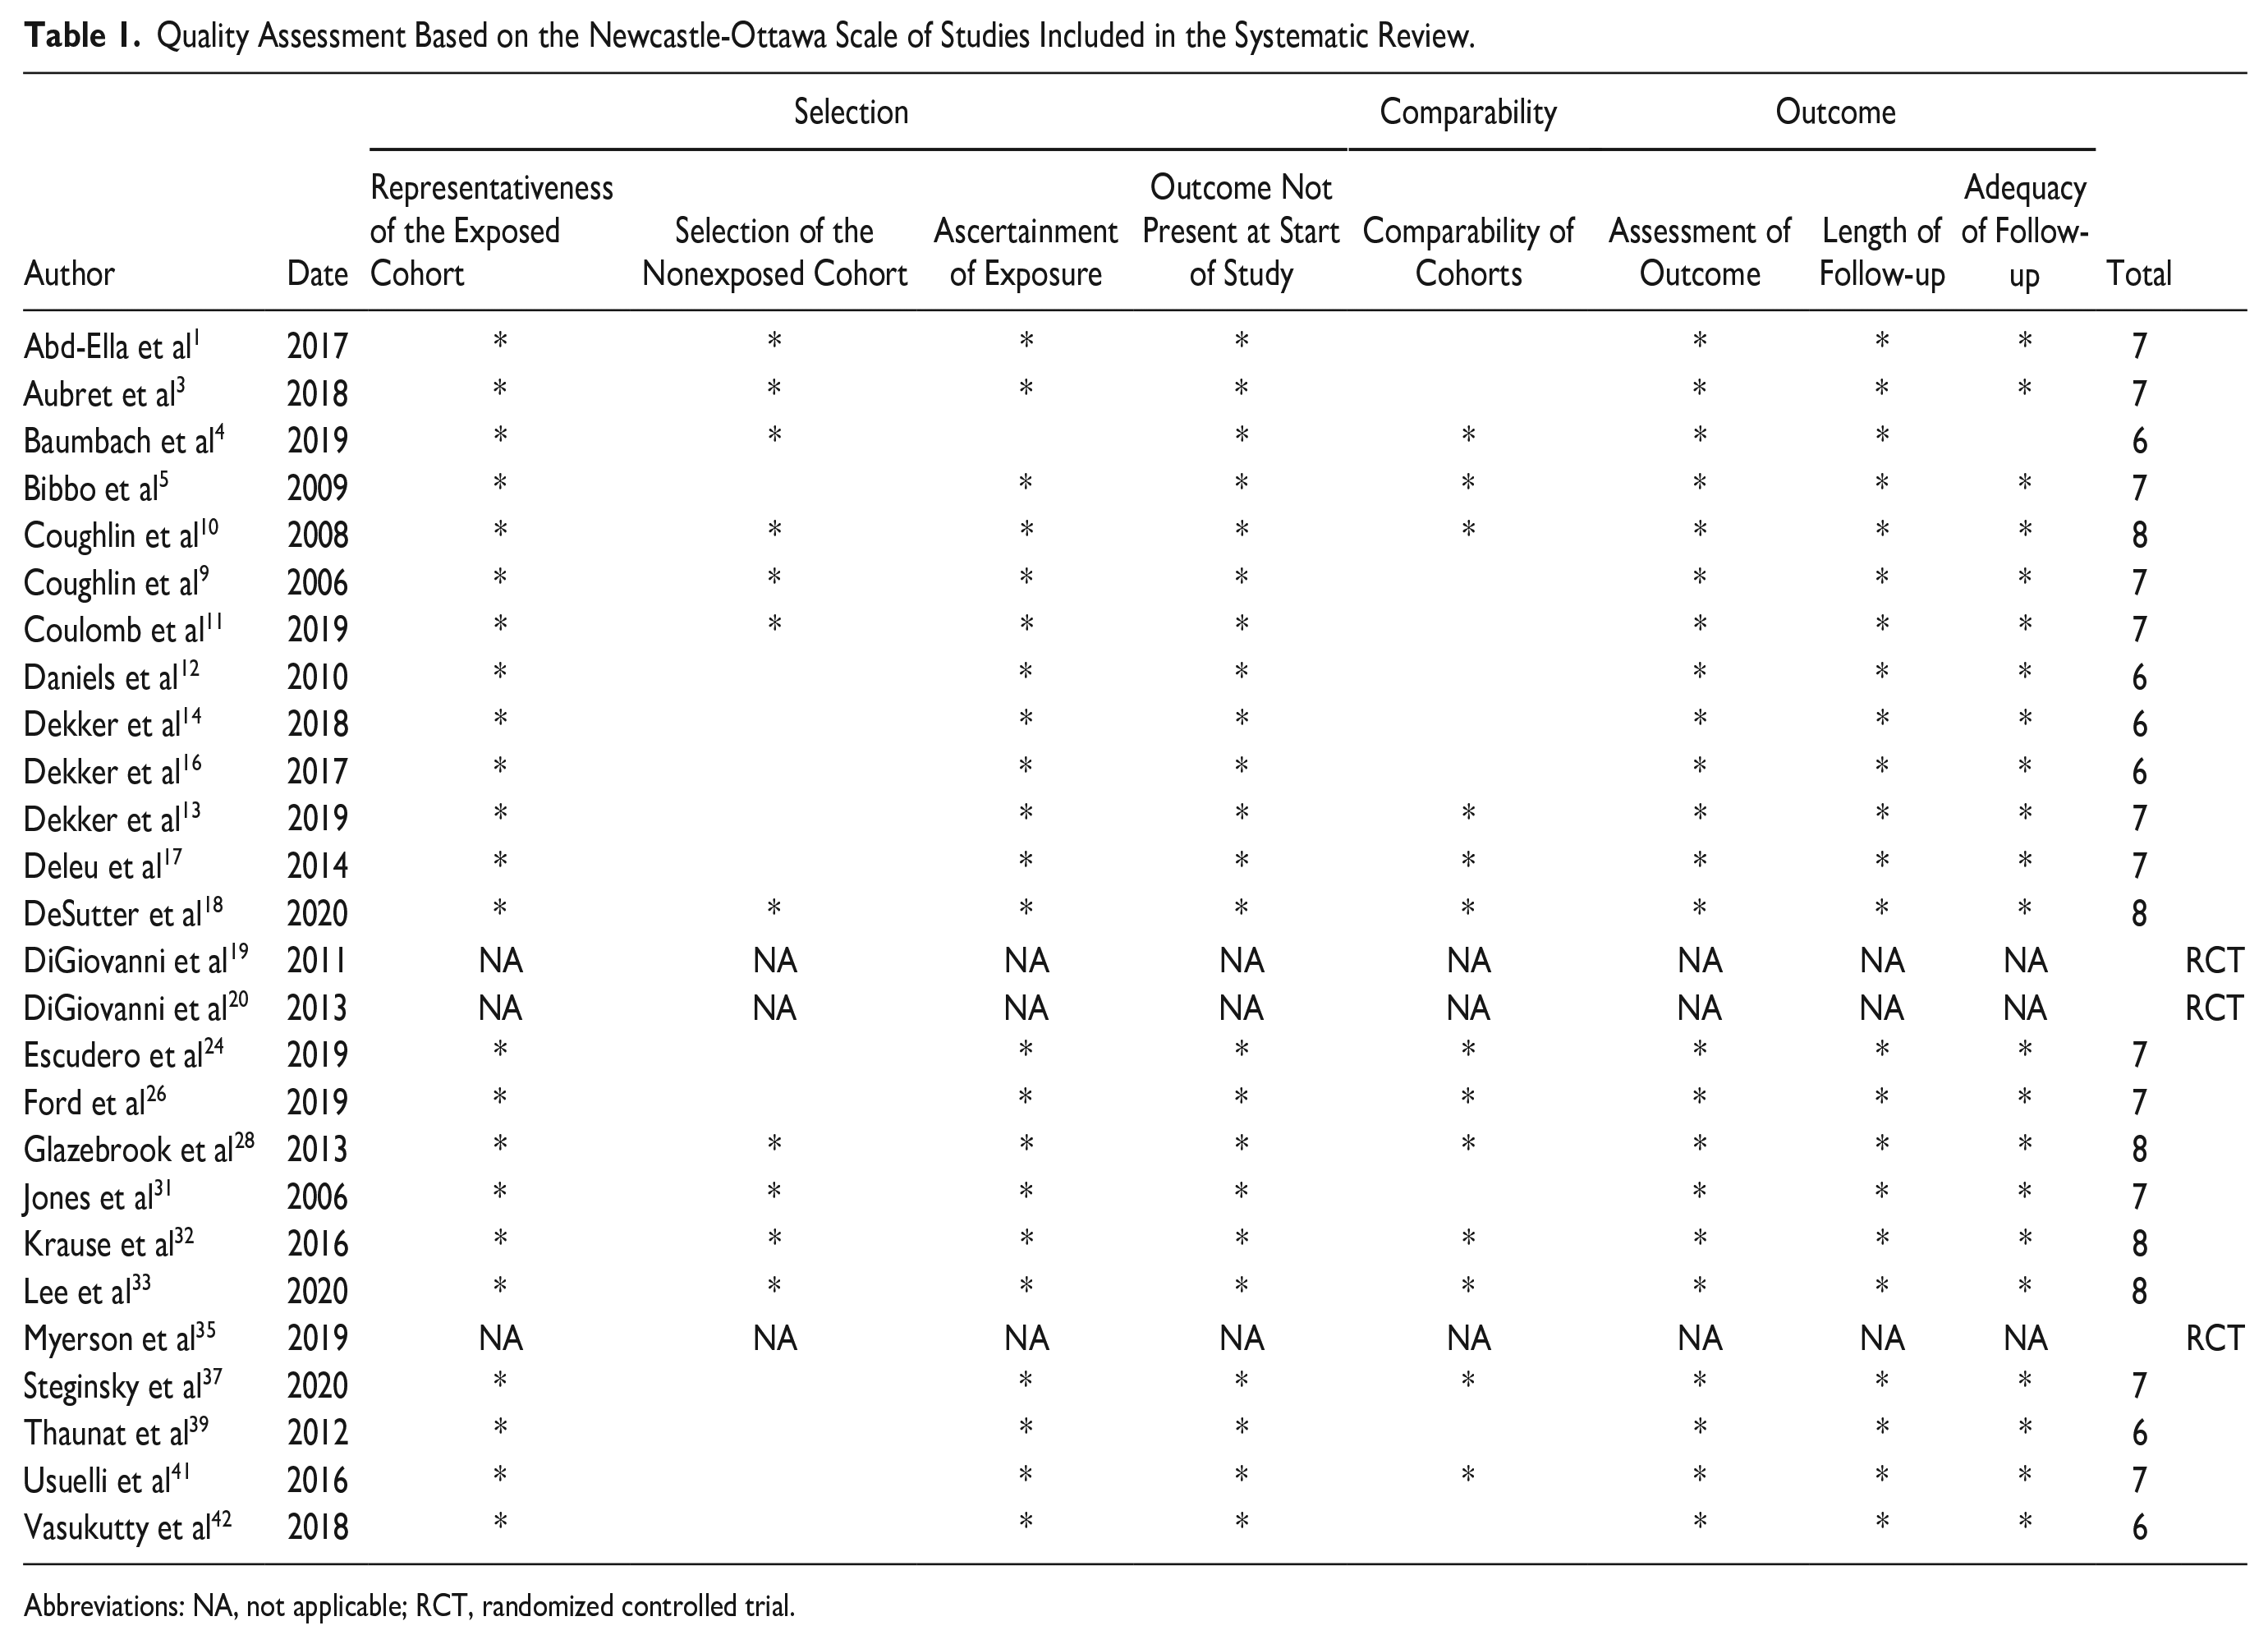
Abbreviations: NA, not applicable; RCT, randomized controlled trial.
Results
Twenty-six articles were included in the analysis, representing 1300 patients undergoing ankle, hindfoot, and midfoot arthrodesis. The mean age of patients included in analysis was 55.9 years old (range 27.7-72) and had a mean follow-up of 48.0 months (range 6-68), where reported. The average time from arthrodesis procedure to CT scan was 21.9 weeks (range 11-39).
After review of 24 studies, the percentage of patients who achieved fusions of all joints was 78.7% (range 50%-100%) (95% CI 69.6-87.7) across the 1015 patients as summarized in Table 2 and visualized in Figure 2. The highest rates of fusion were reported in Coughlin et al 10 where patients underwent subtalar arthrodesis for hindfoot pain. The overall fusion rate of this study was at 100% (15/15). The lowest fusion rate was 50% (5/10) from Aubret et al 3 where failed total ankle replacements were revised with ankle fusions using a trabecular metal implant.
Fusion Rates Across All Patients for Studies Reporting Complete Fusion. a
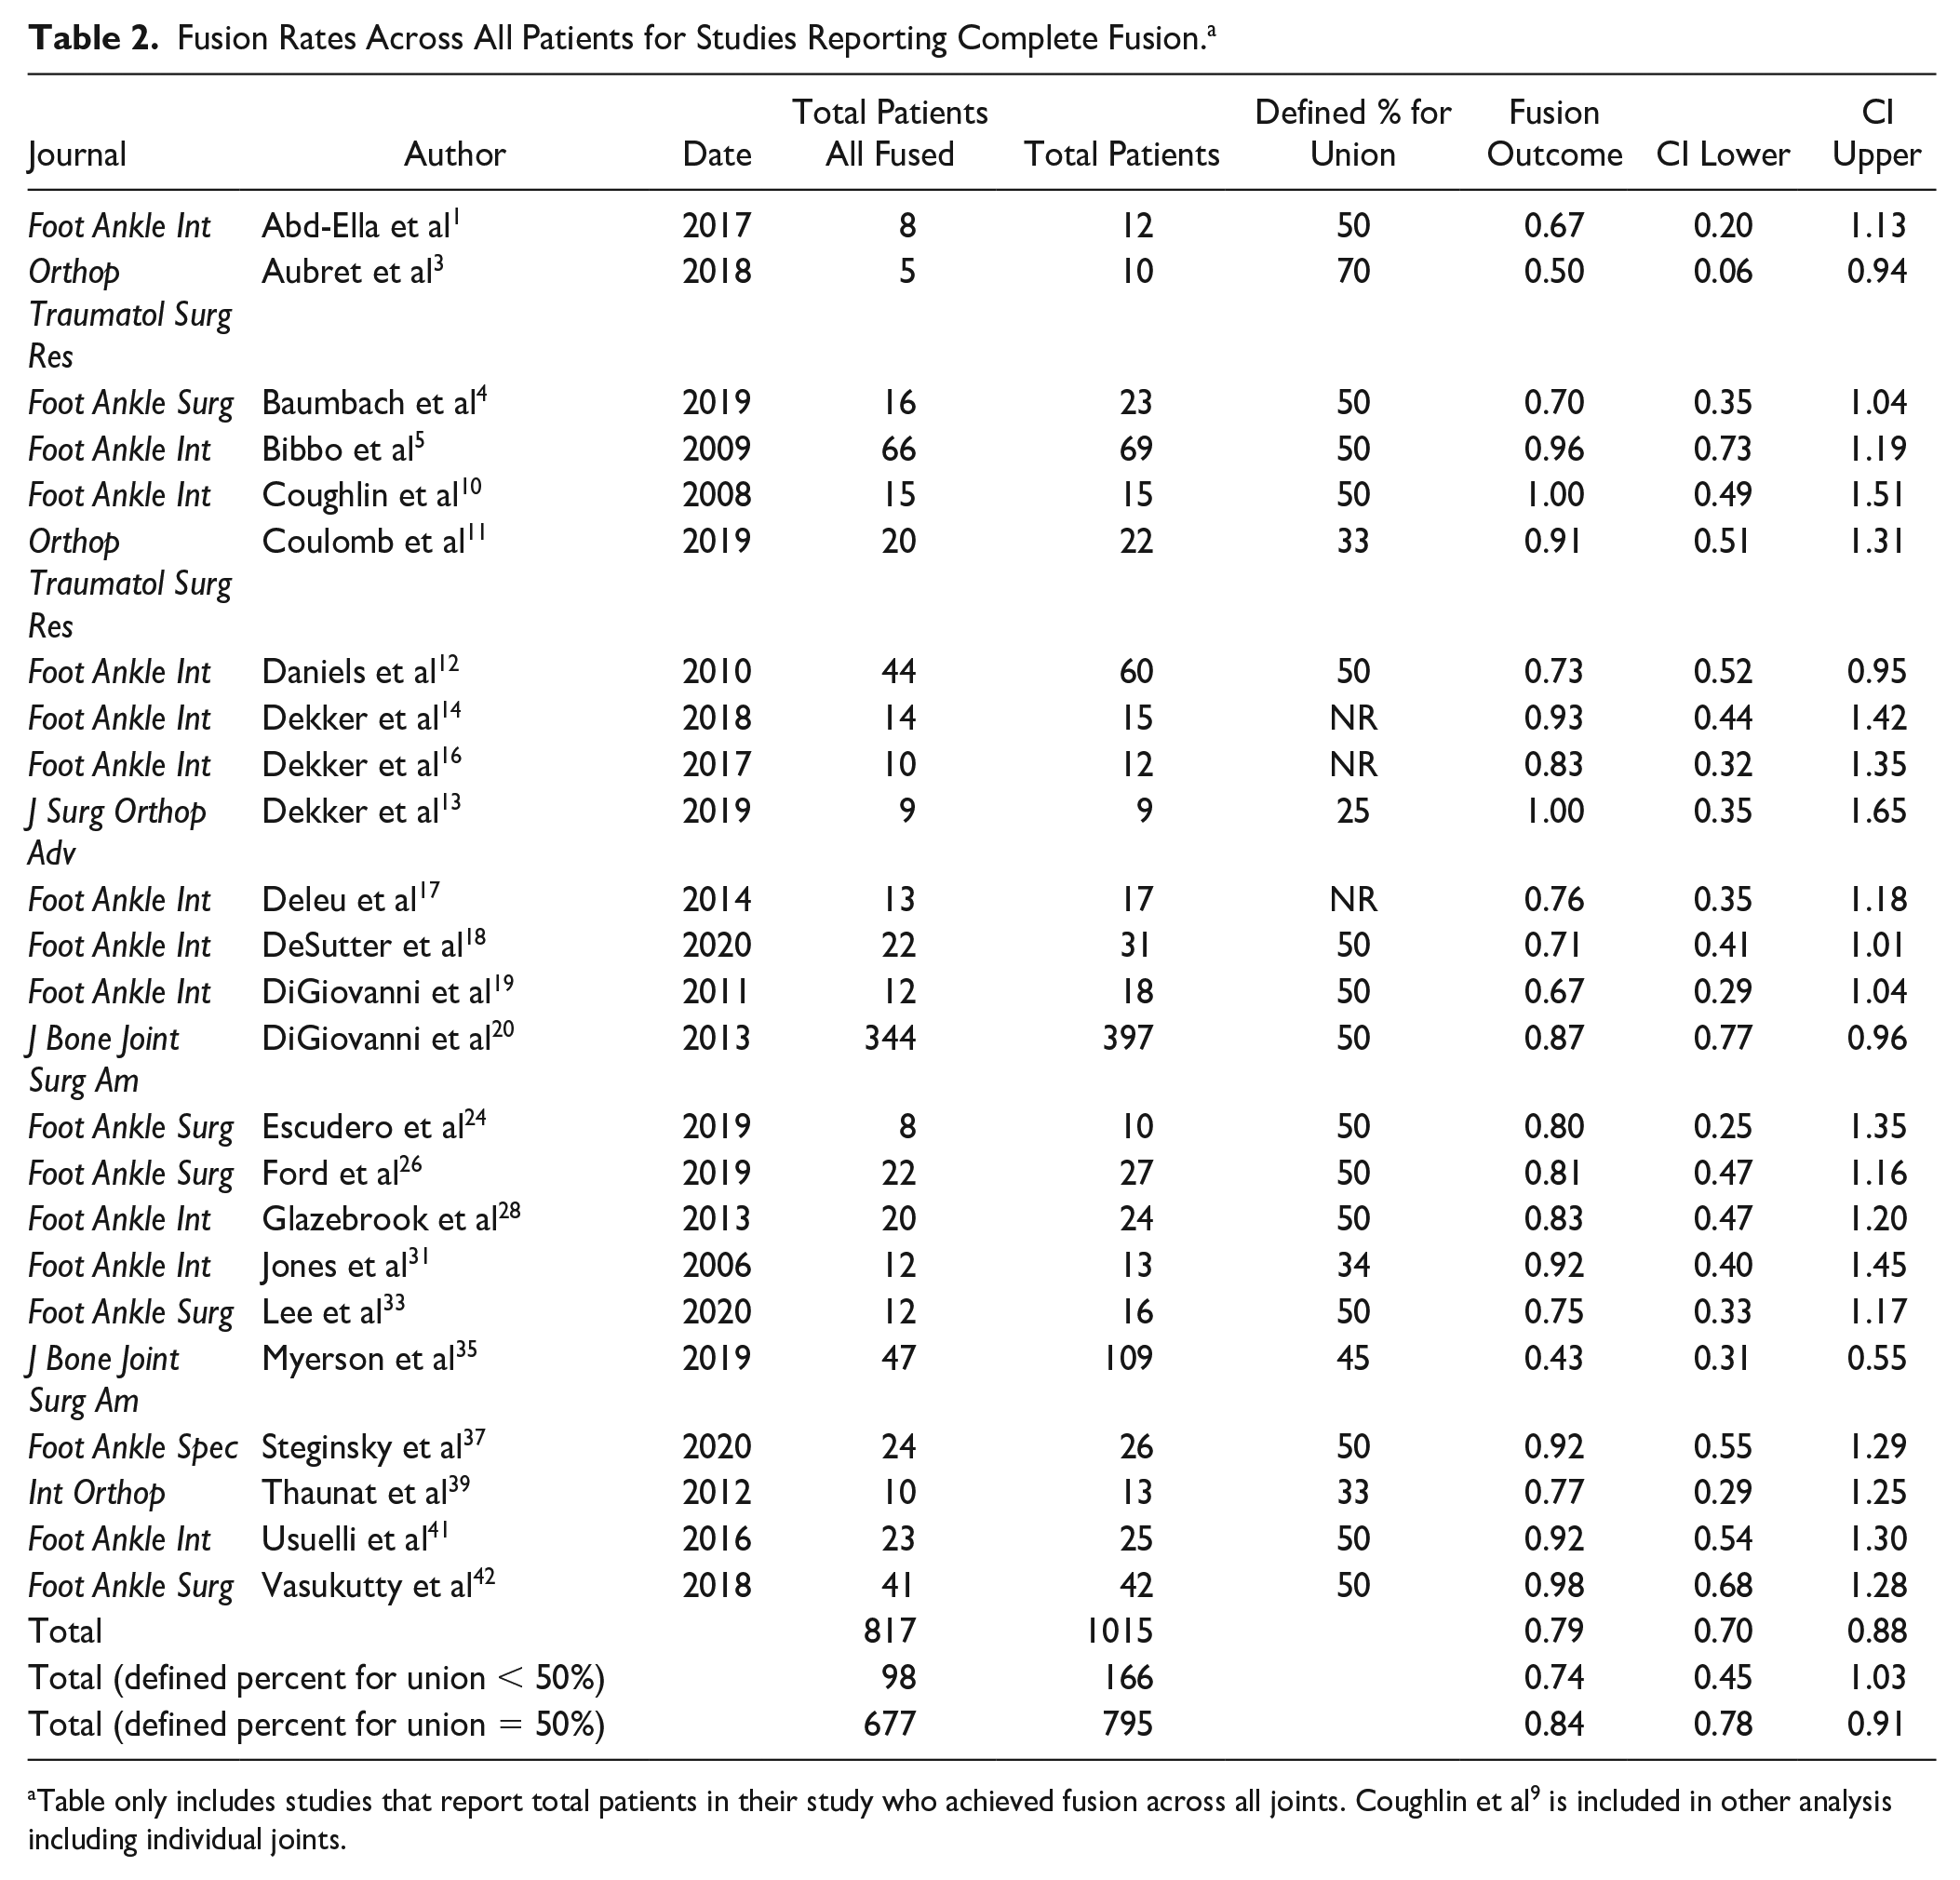
Table only includes studies that report total patients in their study who achieved fusion across all joints. Coughlin et al 9 is included in other analysis including individual joints.
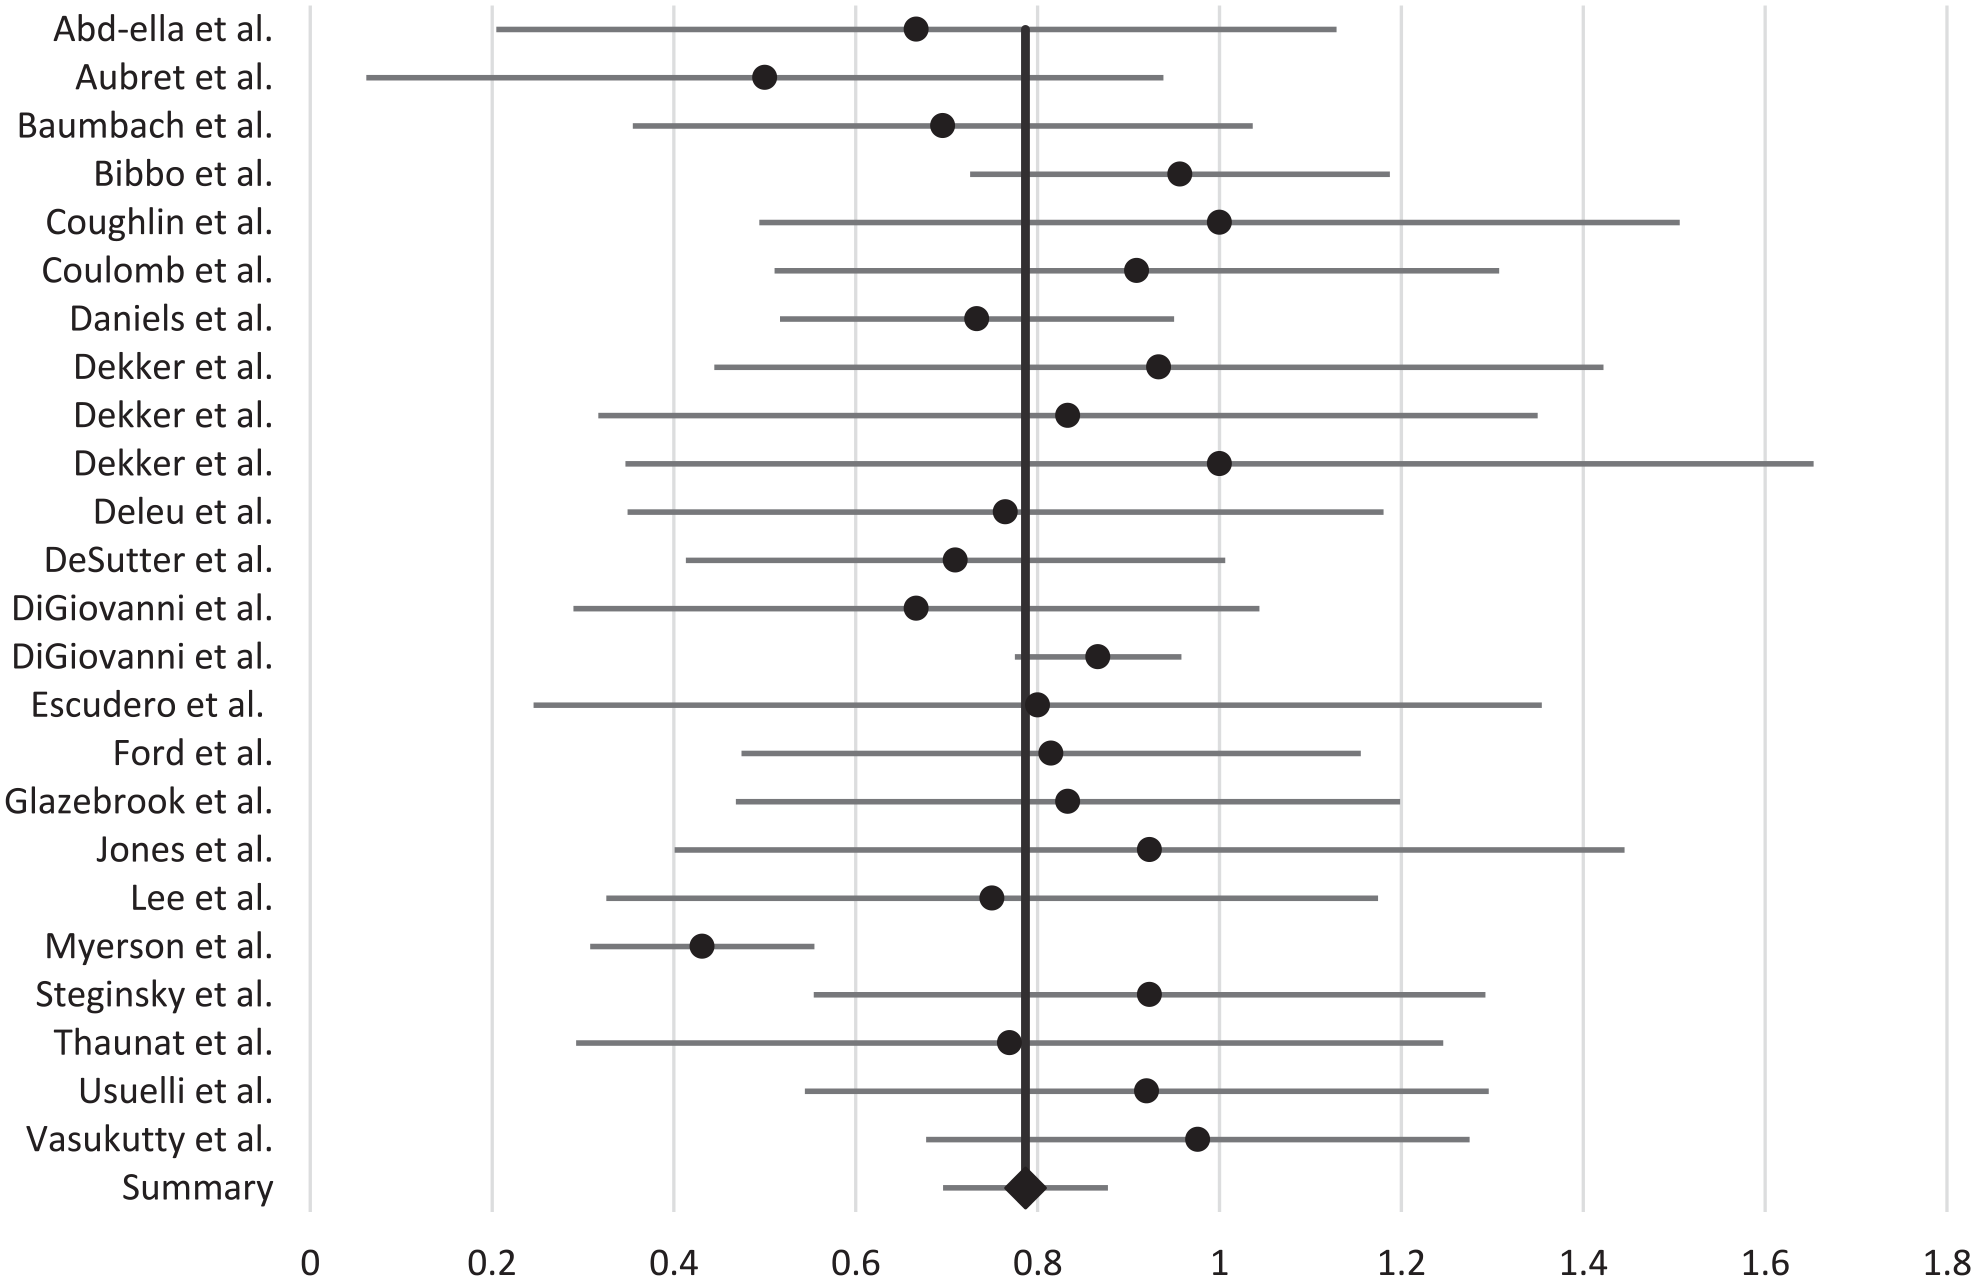
Overall fusion rates, all patients. Dots represent the fusion rates and lines represent the 95% CI.
In a total of 19 articles, the percentage of individual joint fusion was found to be 83.0% (range 43%-100%; 95% CI 73.0%-92.9%) for 1301 joints. Talonavicular (TNJ) joint fusions had the highest rate of CT-verified union of 90% (range 86%-95%; 95% CI 59%-121%). The combination of hindfoot fusions (combination of subtalar joints, talonavicular joints, or calcaneocuboid joints) had the lowest rate of union at 78% (range 67%-79%; 95% CI 60%-97%). The fusion rates by joints are summarized in Table 3 and are visualized in Figure 3. As seen above, the 95% CI is >100%, the authors are aware that it is not feasible to have more than complete fusion, and therefore the CI above 100% should be considered complete fusion.
Fusion Rate by Subgroup. a
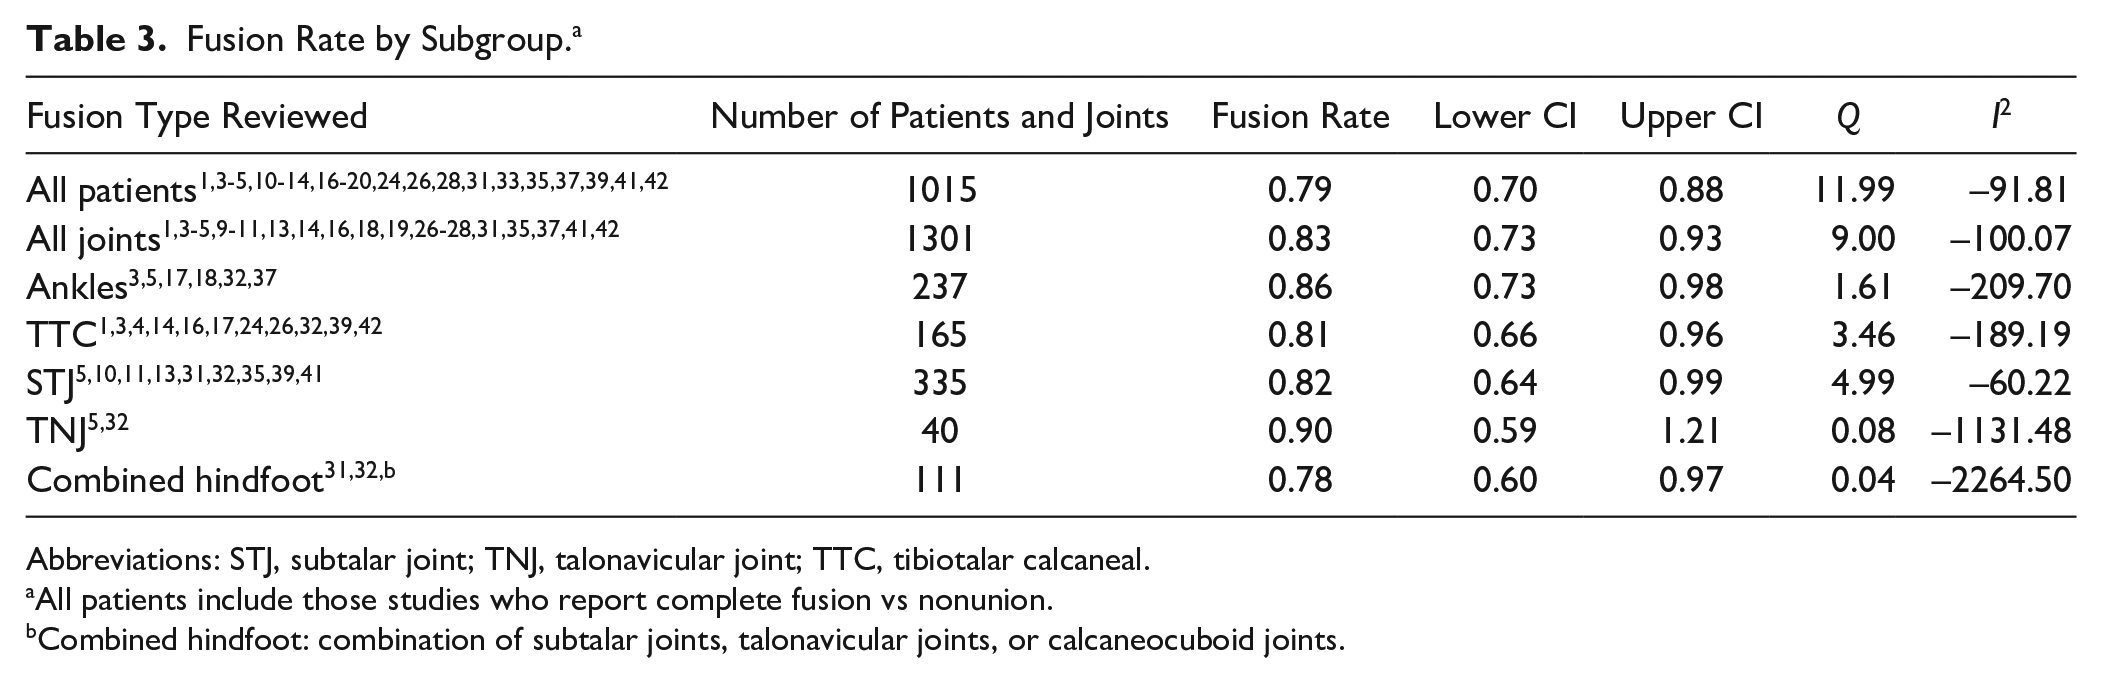
Abbreviations: STJ, subtalar joint; TNJ, talonavicular joint; TTC, tibiotalar calcaneal.
All patients include those studies who report complete fusion vs nonunion.
Combined hindfoot: combination of subtalar joints, talonavicular joints, or calcaneocuboid joints.
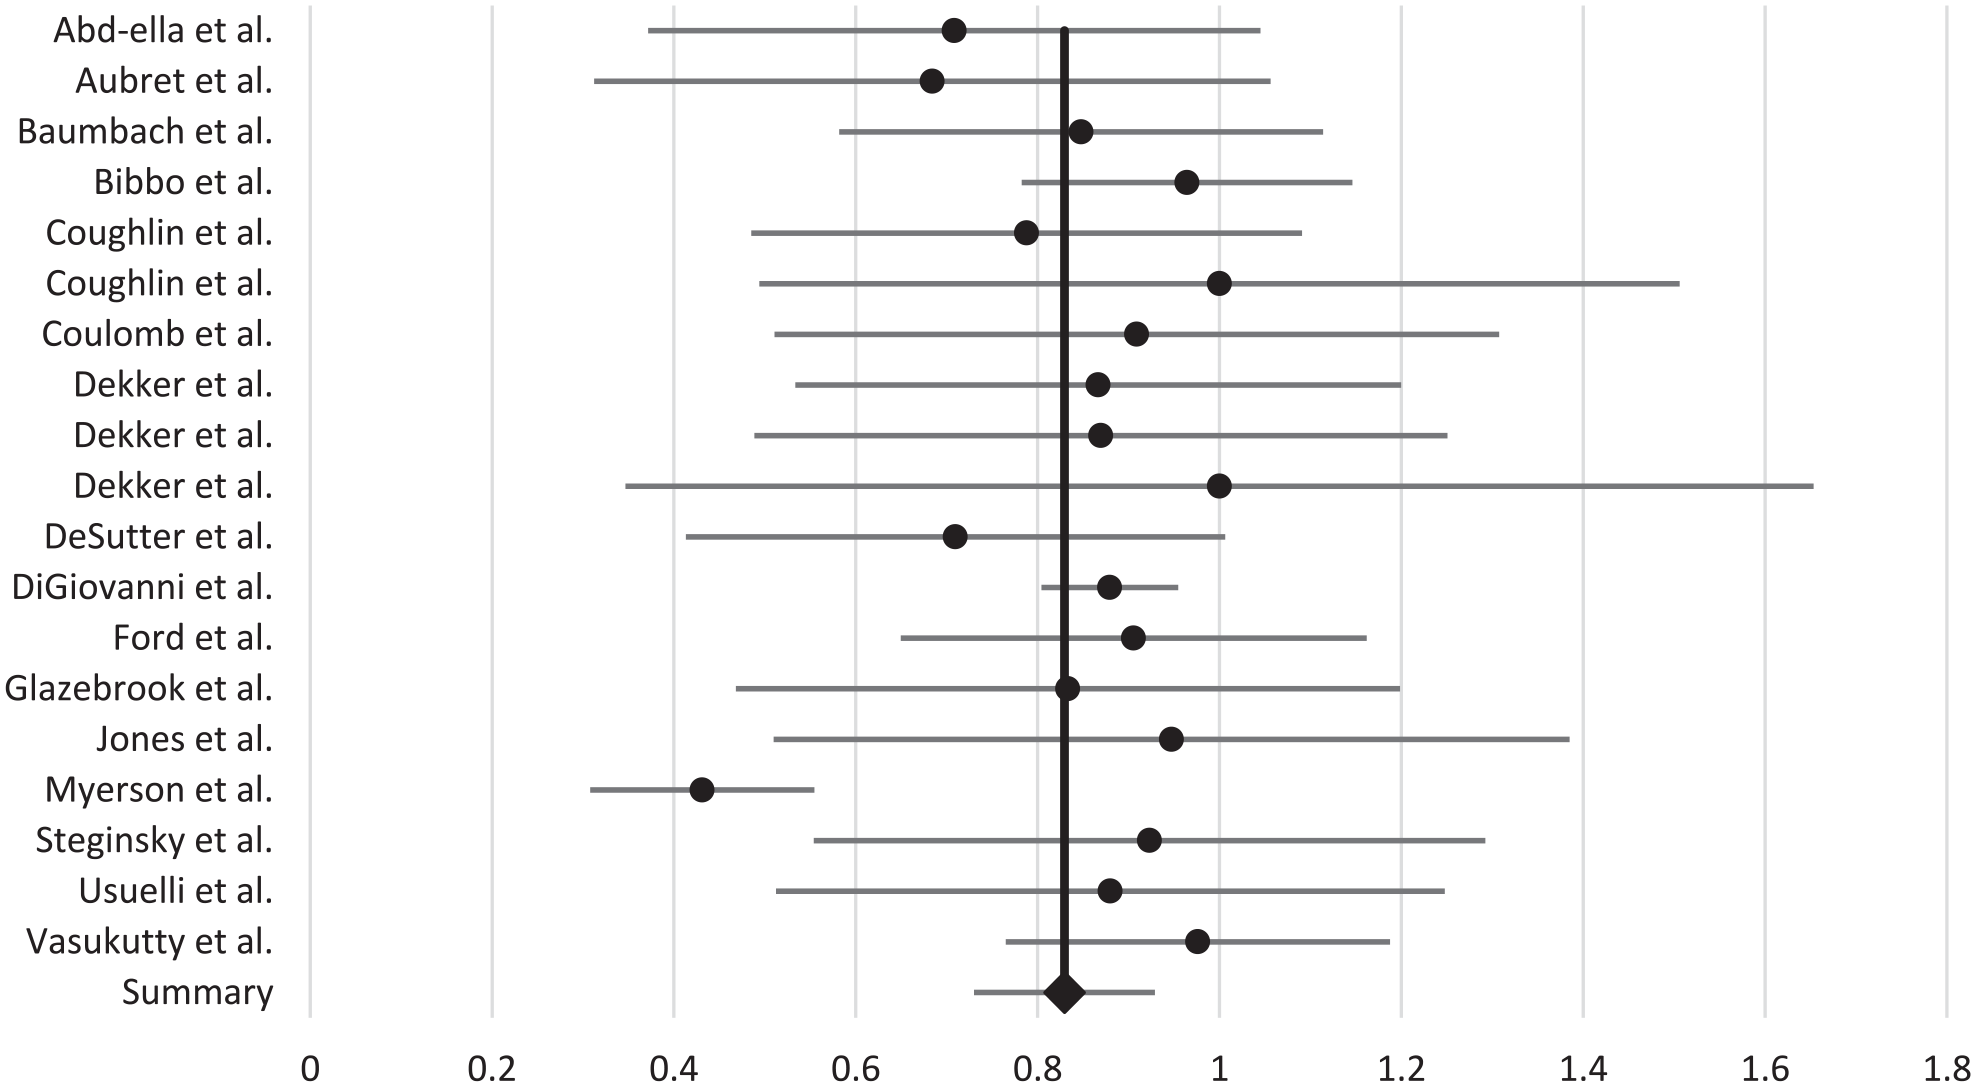
Fusion rates of individual joints including ankles, tibiotalar calcanea joints, subtalar joints, talonavicular joints. Dots represent the fusion rates and lines represent the 95% CI.
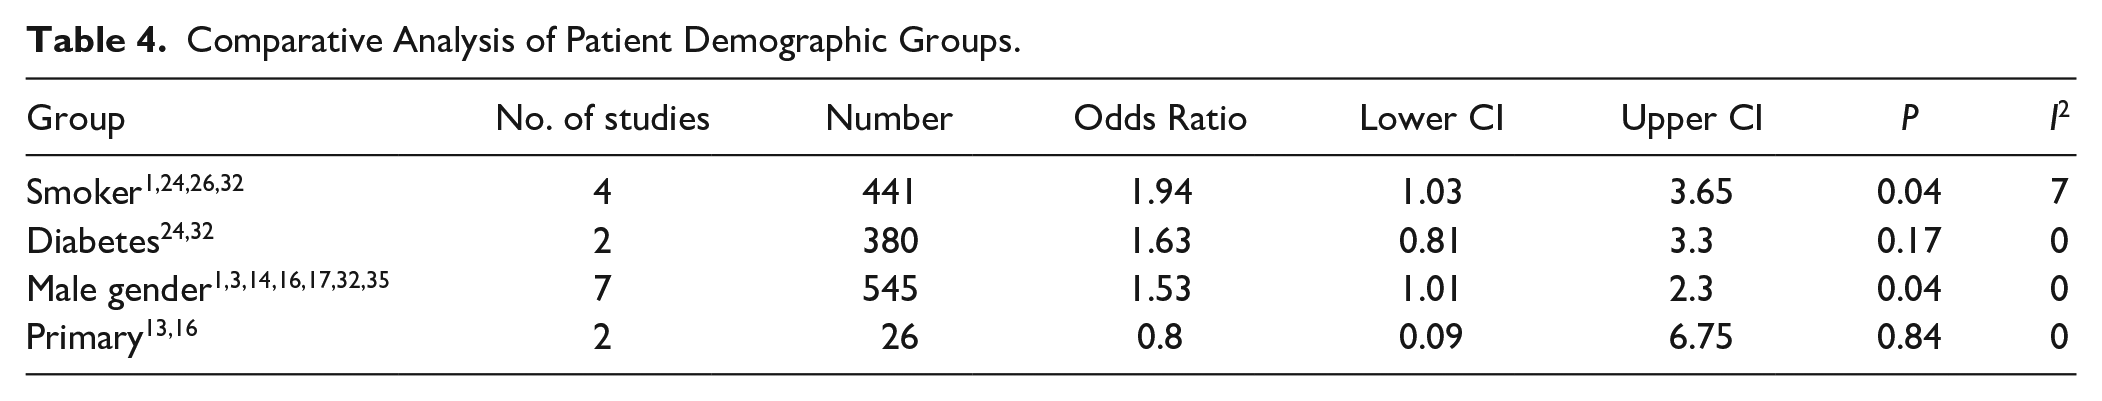
Several patient demographics including gender, smoking status, diagnosis of diabetes, and whether the operation was a primary vs revision case were compared. It was found that the rate of nonunion is statistically significantly greater in males and patients who smoke (odds ratios 1.53, 95% CI 1.01-2.30, P = .04, and 1.94, 95% CI 1.03-3.65, P = .04, respectively). There was no statistically significant difference in patients with diabetes or comparing primary or revision procedures, although both these analyses had lower numbers. The comparative analysis is summarized in Table 4.
Comparative Analysis of Patient Demographic Groups.
Discussion
At the time of literature search there was a total of 26 studies that fit the inclusion criteria. Included studies had an overall fusion rate of 78.7%, a value that is lower than that reported in previous literature, specifically literature sources using plain film radiography for union evaluation.9,23,25,30,34 A recent systematic review reported plain radiograph confirmed fusion rates of 91.8% and 92.9% for double and triple arthrodesis, respectively. 7 Interestingly, in contrast to the same study listed above, this systematic review found that TNJ joints had the highest CT-confirmed union rates at 90% whereas they found TNJ joints had the worst fusion among joints at 79.6%. 7 CT provides the practitioner an in-depth 3-dimensional analysis of the fused joint allowing for better evaluation of the success of the procedure. With a total of 21.3% of the surgical population in this cohort not going on to union, it brings pause to the conversation around informed consent and provides patients and practitioners with accurate information regarding the risks of proposed procedures.
In a majority of the studies, an arbitrary value of 50% was used to characterize successful union by CT—meaning that ≥50% of the joint area has osseous bridging present. Some studies used values as low as 25% 13 to characterize successful union and some as high as 70%. 3 Interestingly, for studies that used values ≤50% (n = 166) for union showed to have a decreased rate of union compared to those with values ≥50% (n = 795) with rates of 74% and 84%, respectively. Although this may not have significance clinically, academically it poses an interesting question of what the right value is for CT-verified union. A 2013 study by Glazebrook et al 27 showed that patients with CT-verified osseous bridging of 25% to 49% across the fused joint had clinical improvement based on the SF-12, Foot Function Index, and AOFAS, whereas those with <25% osseous bridging did not. The aforementioned study suggests that successful clinical outcomes are likely in joints with only 25% to 49% osseous bridging present, raising the question if 50% is the right value in determining fusion and, ultimately, the success of the surgery.
A comparative analysis was performed and smoking was identified as a negative modifiable risk factor for union in ankle, hindfoot, and midfoot fusions. Smoking cessation should be recommended for patients undergoing elective fusions. Diabetes, although not statistically significant in our analysis, did have a lower rate of union compared to the general population. The included articles did not provide enough information regarding blood sugar control (hemoglobin A1c) for analysis. Further research on the impact of diabetes on fusion surgery to establish goals of blood sugar control to minimize nonunion would be beneficial. Male sex was a nonmodifiable risk factor for nonunion.
This study has brought to light a more accurate representation of modern union rates in ankle, hindfoot, and midfoot fusion patients. Using CT as the assessment tool, the practitioner has a wealth of information and data that they can use to objectively assess union of fused joints. Previous standards of practice of plain film radiographs may have been overestimating union rates because of a relative lack of sensitivity and overlapping joints in the foot and ankle. With computed tomography, the quality of union can be assessed in multiple planes throughout multiples slices. Although it may be the superior modality for assessing union in arthrodesis patients, limitations exist for its widespread implementation such as increased cost and reduced availability of CT scanners when compared to X-ray machines. It is not clear based on the results of this study if routine assessment of union based on CT would improve patient outcomes; however, the results may encourage practitioners to obtain a CT scan in the setting of ongoing pain after fusion surgery despite radiographic appearance of union.
A major limitation of this study was the heterogeneity of surgical techniques and care pathways within the studies with usage of different bone grafts, approaches, and postoperative pathways. Additionally, most of the data are collected from Level IV evidence sources and therefore may be subject to biases. The figures presented in this article are a collation of the available data, and interpretation of the results should be considered with this in mind. Finally, with the heterogeneity of definitions of union by CT, there may be discrepancies in the fusion rates across papers.
In this systematic review, it was found that patients undergoing arthrodesis of their ankle had a CT-verified union rate of 78.7%, which is lower than previously reported values. This figure should add value to the conversation around informed consent for procedures and increase surgeon’s awareness that nonunion remains common. With a nonunion rate of >20% for all joints in this review, further research should investigate reproducible methods to reduce nonunion rates for future patients.
Supplemental Material
sj-docx-2-fai-10.1177_10711007231171087 – Supplemental material for CT-Verified Union Rate Following Arthrodesis of Ankle, Hindfoot, or Midfoot: A Systematic Review
Supplemental material, sj-docx-2-fai-10.1177_10711007231171087 for CT-Verified Union Rate Following Arthrodesis of Ankle, Hindfoot, or Midfoot: A Systematic Review by Michael David Leslie, Christin Schindler, Gareth M. J. Rooke and Andrew Dodd in Foot & Ankle International
Supplemental Material
sj-pdf-1-fai-10.1177_10711007231171087 – Supplemental material for CT-Verified Union Rate Following Arthrodesis of Ankle, Hindfoot, or Midfoot: A Systematic Review
Supplemental material, sj-pdf-1-fai-10.1177_10711007231171087 for CT-Verified Union Rate Following Arthrodesis of Ankle, Hindfoot, or Midfoot: A Systematic Review by Michael David Leslie, Christin Schindler, Gareth M. J. Rooke and Andrew Dodd in Foot & Ankle International
Footnotes
Declaration of Conflicting Interests
The author(s) declared no potential conflicts of interest with respect to the research, authorship, and/or publication of this article. ICMJE forms for all authors are available online.
Funding
The author(s) received no financial support for the research, authorship, and/or publication of this article.
Supplemental Material
Supplemental material for this article is available online.
References
Supplementary Material
Please find the following supplemental material available below.
For Open Access articles published under a Creative Commons License, all supplemental material carries the same license as the article it is associated with.
For non-Open Access articles published, all supplemental material carries a non-exclusive license, and permission requests for re-use of supplemental material or any part of supplemental material shall be sent directly to the copyright owner as specified in the copyright notice associated with the article.