
Abstract
Background:
Corrective surgery for flexible flatfoot deformity (FD) remains controversial, and one of the main reasons for this is the lack of standardized radiographic measurements to define an FD. Previously published radiographic parameters to differentiate between a foot with and without an FD do not have a commonly accepted and distinct threshold.
Methods:
The plantar fascia–talar head correlation (PTC) with its defined threshold was assessed by measuring the distance between the medial border of the plantar fascia and the center of the talar head (DPT) on conventional dorsoplantar and lateral weightbearing radiographs; the authors were blinded to the clinical diagnosis of the 189 patients’ first visits. Feet were sorted into groups with and without an FD based on their clinical examination. The effect of operative corrections of FD on the PTC was retrospectively evaluated on an additional 38 patients.
Results:
The sensitivity of the PTC was 0.98 (95% CI: 0.9-1) and specificity 0.96 (95% CI: 0.92-0.98), respectively, to identify an FD, consistent with the clinical examination. Thirty-five of 38 surgeries sufficiently corrected the FD and the PTC comparable to that in subjects without an FD. Three corrections with a residual FD did not adequately correct the PTC.
Conclusion:
The PTC is a reliable radiographic parameter with a distinct threshold that is sensitive and specific for the differentiation of feet with and without an FD including feet with and without residual FD after corrective surgery. The PTC is applicable to monitor the needed intraoperative amount of correction using simulated weightbearing fluoroscopy.
Level of Evidence:
Level III, diagnostic.
Introduction
Corrective surgery for flexible flatfoot deformity (FD) remains controversial despite numerous studies investigating the correlation of operative outcomes with clinical and radiographic parameters.5,6,11,12,15,17 The lack of a widely accepted definition of what constitutes an FD in an adult1,10,21,26,28,31 and the lack of standardized radiographic measurements to define an FD are the main reasons for this controversy.13,17,28,29,35 The clinical recognition of an FD is a subjective conclusion based on the identification of a lowering of the longitudinal arch on inspection of the foot and was shown to correlate with the lateral talar–first metatarsal angle. 13 The challenges in diagnosis and treatment of FD are not related to its identification, rather to the variations in etiologies and morphologies that complicate a reliable description of a subjective conclusion with an objective measurement. Many radiographic parameters on weightbearing conventional radiographs have been proposed to evaluate FDs, but only a few, such as the lateral talar–first metatarsal angle (Tal1mt) and talonavicular uncoverage angle (TNuncov),3,17,28,35 have proved reliable. More recently, the understanding of FD has evolved tremendously owing to weightbearing computed tomography (CT).2,25,27 However, none of the radiographic parameters have a commonly accepted distinct threshold to differentiate between a foot with and without FD.9,20,23,26 The absence of a radiographic parameter to reliably differentiate feet with and without FD results in inaccuracies to set an operative target regarding when sufficient correction of an FD is achieved.7,8,11,15,17,28,33
The importance of the plantar fascia is well recognized to stabilize the longitudinal arch of the foot, indicated by the truss and windlass mechanism.22,24,30,32 Crary et al 14 revealed that the spring ligament and long plantar ligament function synergistically with the plantar fascia. This synergy might explain the findings of a magnetic resonance imaging (MRI) study that compared the involvement of ligaments in tibialis posterior tendon insufficiency to that in controls. 16 The plantar fascia did not show significant involvement, and the long and short plantar ligaments were the least involved ligaments. Other ligaments such as the superomedial calcaneonavicular, inferomedial calcaneonavicular, and talocalcaneal interosseous ligaments were often attenuated. 16 Based on these results, involvement of the ligaments in tibialis posterior tendon insufficiency seemed to follow a pattern. Ligaments were less involved in the proximity of the enduring plantar fascia. 16 Thus, we hypothesized that the truss protects the foot from a fallen arch if the arch-decreasing forces are aligned with the apex (talus) and the base (plantar fascia) of the truss. However, the truss may not prevent a flattening of the arch once the arch is medially displaced to the plantar fascia’s medial edge. This medial displacement is often evident in FDs on conventional weightbearing radiographs, revealing the talar head shifted medially at the talonavicular joint.17,26,28,34
We hypothesized that on weightbearing radiographs, the talar head sits medially to the medial border of the plantar fascia in feet with FD and on the edge or laterally in feet without FD. This relationship was referred to as the plantar fascia–talar head correlation (PTC).
The purpose of this study was to assess a new conventional radiographic parameter with a distinct threshold that allowed the differentiation between feet with and without an FD and evaluate its application in corrective surgery for FD.
Methods
This study was approved by the local ethics committee and consists of 2 sections: A prospective study introducing a new radiographic parameter and a retrospective study evaluating the effect of corrective surgery on this new parameter.
X-Ray Technique
Patients’ feet were radiographed similar to the acquisition of dorsoplantar (DP) and lateral weightbearing conventional radiographs of a previous study. 17 Only the DP radiograph was modified in the prospective study. The X-ray beam was angled at 17 instead of 15 degrees posteriorly toward the heel, and the collimator setting of the foot included the entire calcaneus. The exposure parameters were 54 kV and 1.6 mAs, performed using a digital radiography system (CXDI, Canon Medical Systems, Tustin, USA).
Radiographic Measurement
Two examiners, blinded to the clinical diagnosis of the patients, used the Synedra software (Synedra Information Technologies, Innsbruck, Austria) to measure the TNuncov, Tal1mt, and the shortest distance between the medial border of the plantar fascia to the center of the talar head (DPT).
The measurements of DPT required to define the radiolucent medial border of the plantar fascia on a conventional DP radiograph with its osseous landmarks. The plantar fascia is composed of multiple layers of fibers without a distinct anatomical medial border. 4 However, it may be concluded that the biomechanically relevant fibers of the truss must insert on the calcaneus and run through the sesamoids.4,22,24 Therefore, the medial border of the plantar fascia was defined as a connecting line between the medial border of the tibial sesamoid and the medial wall of the calcaneus. The projection of the medial wall of the calcaneus on a DP radiographic view was consistent with a sclerotic line slightly lateral to the concavity of the proximal sustentaculum tali confirmed on 8 feet during a weightbearing CT. The medial wall of the calcaneus represented the insertion point of the functionally relevant fibers of the plantar fascia very well because of its proximity to the medial plantar fascia’s calcaneal insertion (mPCal) and its own biomechanical relevance as part of the medial edge of the truss (Figure 1). Furthermore, mPCal marked using a metallic marker on an X-ray phantom foot consistently projected onto the medial calcaneal sclerotic line despite translational and rotational malalignment of the X-ray beam.
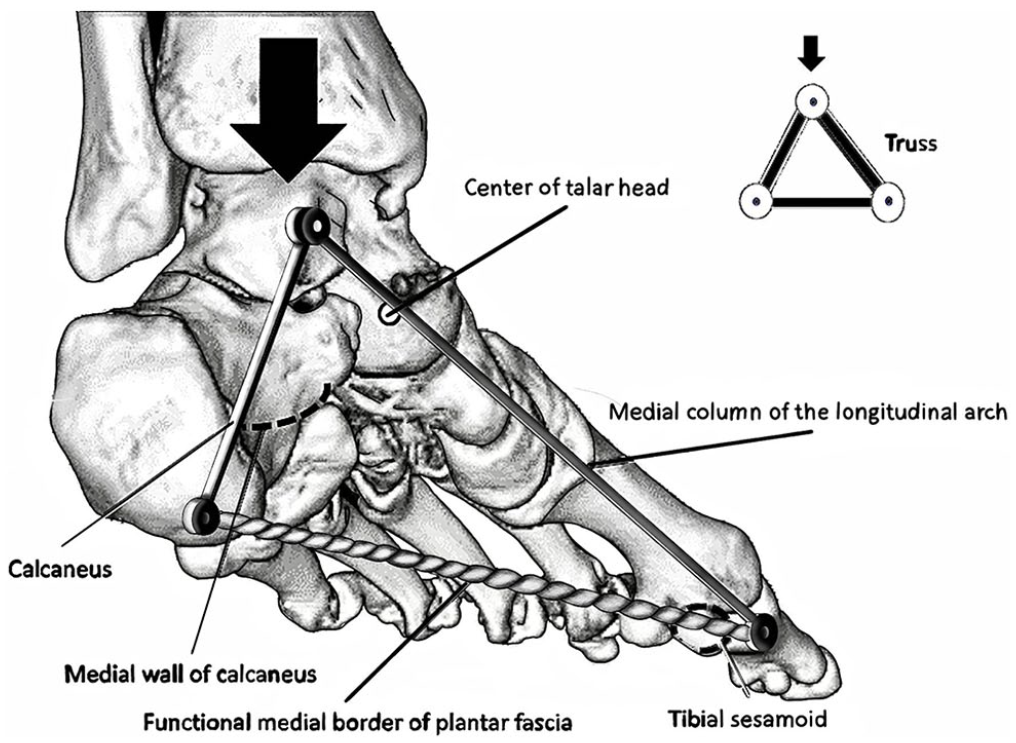
The arch supporting functionally relevant fibers of the medial border of the plantar fascia are defined by a representative line drawn through the medial border of the tibial sesamoid and the medial wall of the calcaneus. The calcaneus, medial column of the longitudinal arch, and plantar fascia are part of the truss resisting the arch depressing forces.
Pilot measurements of the feet later made obvious that mPCal showed a variance on the DP weightbearing radiograph, where some were closer and some more distant to the heel. Considering the lateral radiograph, this variance in distance to the heel was addressed by defining the relationship of the distances between the plantar fascia’s insertion and easily recognizable radiographic landmarks on a DP radiograph, for example, the posterior border of the talus, the anterior intermalleolar line, and the sustentaculum tali (Figures 2A and B). The intersection of the established distance with the sclerotic line of the medial wall of the calcaneus was defined as mPCal for DPT measurements (Figures 3A and B).
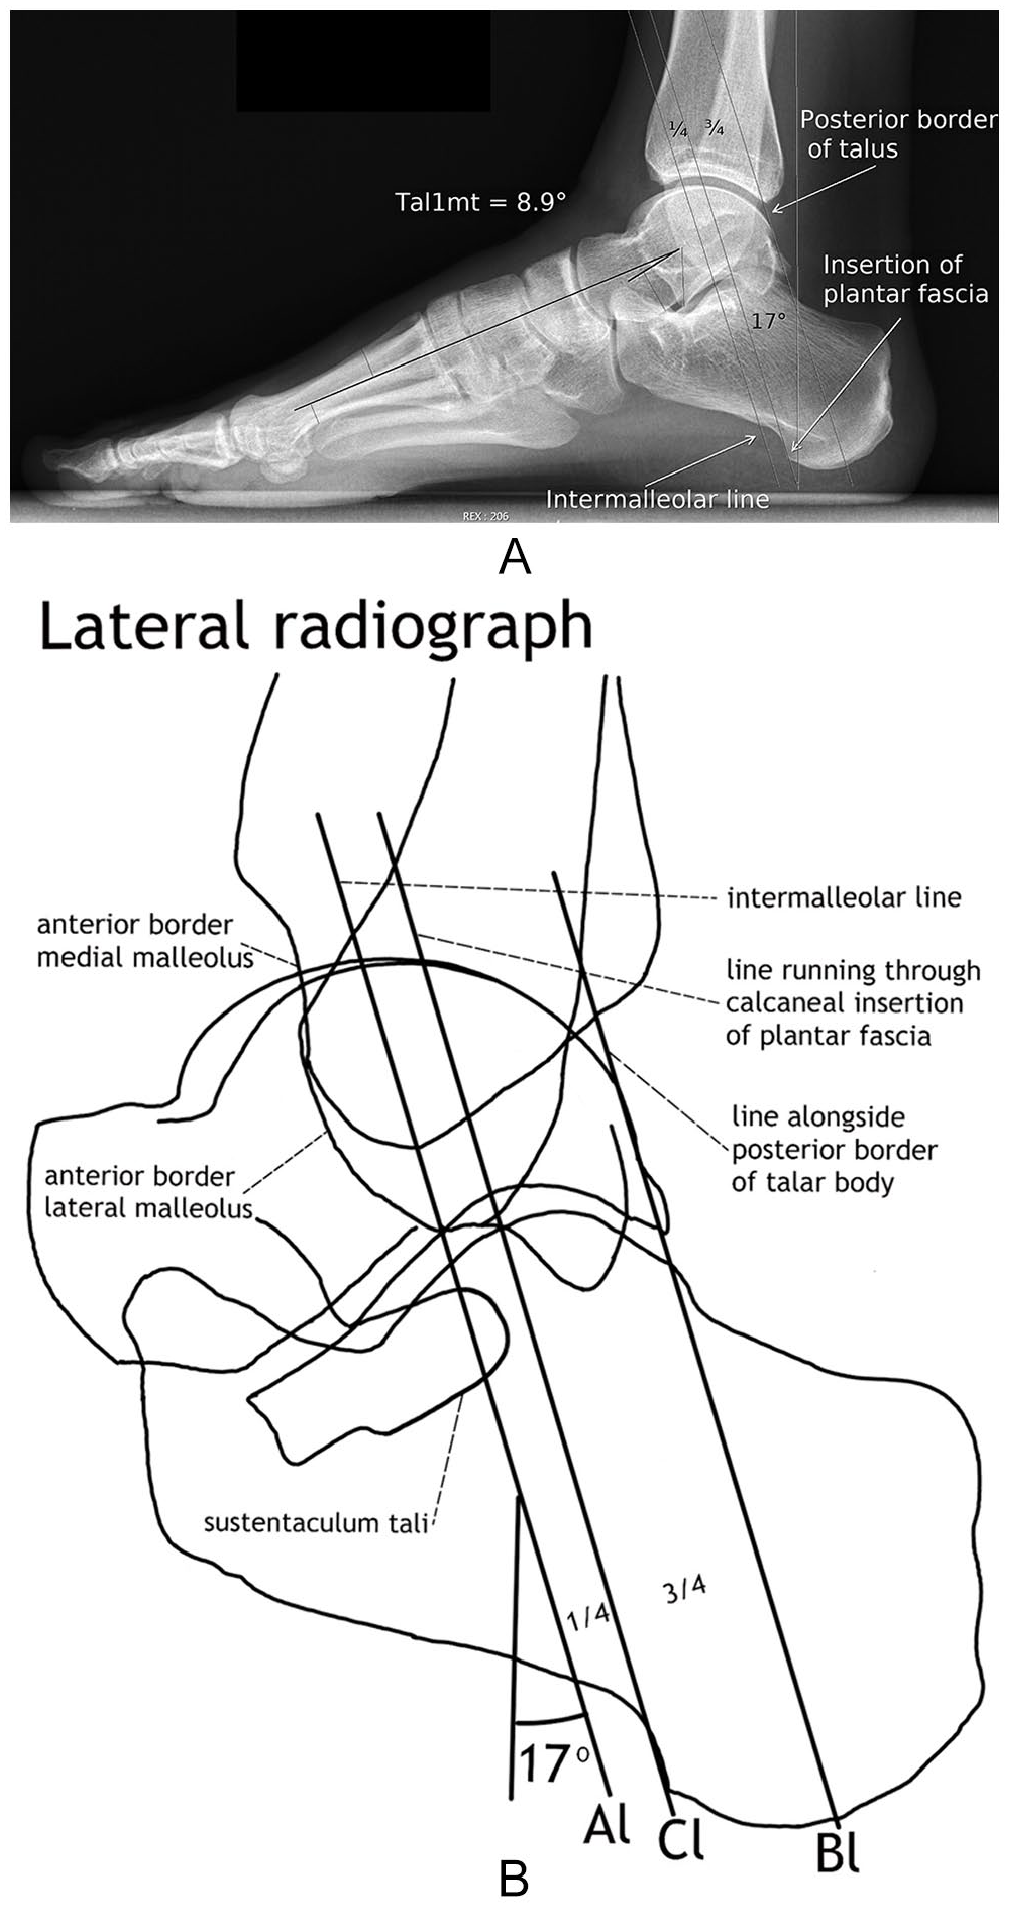
(A) Lateral radiograph of a foot without a flatfoot deformity. For measurement of DPT (the shortest distance between the medial border of the plantar fascia and the center of the talar head) planes are drawn on the lateral and dorsoplantar radiograph parallel to the X-ray beams of these radiographs. Therefore, the lines representing these planes on the lateral radiograph are angled at 17 degrees posteriorly toward the heel. The proportions of the distances between these planes are on the lateral and dorsoplantar radiograph the same. Hence, lines representing these planes running through the insertion of the plantar fascia, the tip of the lateral malleolus, and the posterior border of the talus are drawn to reproduce these proportions on the dorsoplantar radiograph and help to define the medial plantar fascia’s calcaneal insertion (mPCal). In this case, the line running through the tip of the lateral malleolus is identical with the intermalleolar line, a common finding on a lateral radiograph when the foot was correctly positioned during the acquisition of the radiograph. (Tal1mt, lateral talar–first metatarsal angle.)
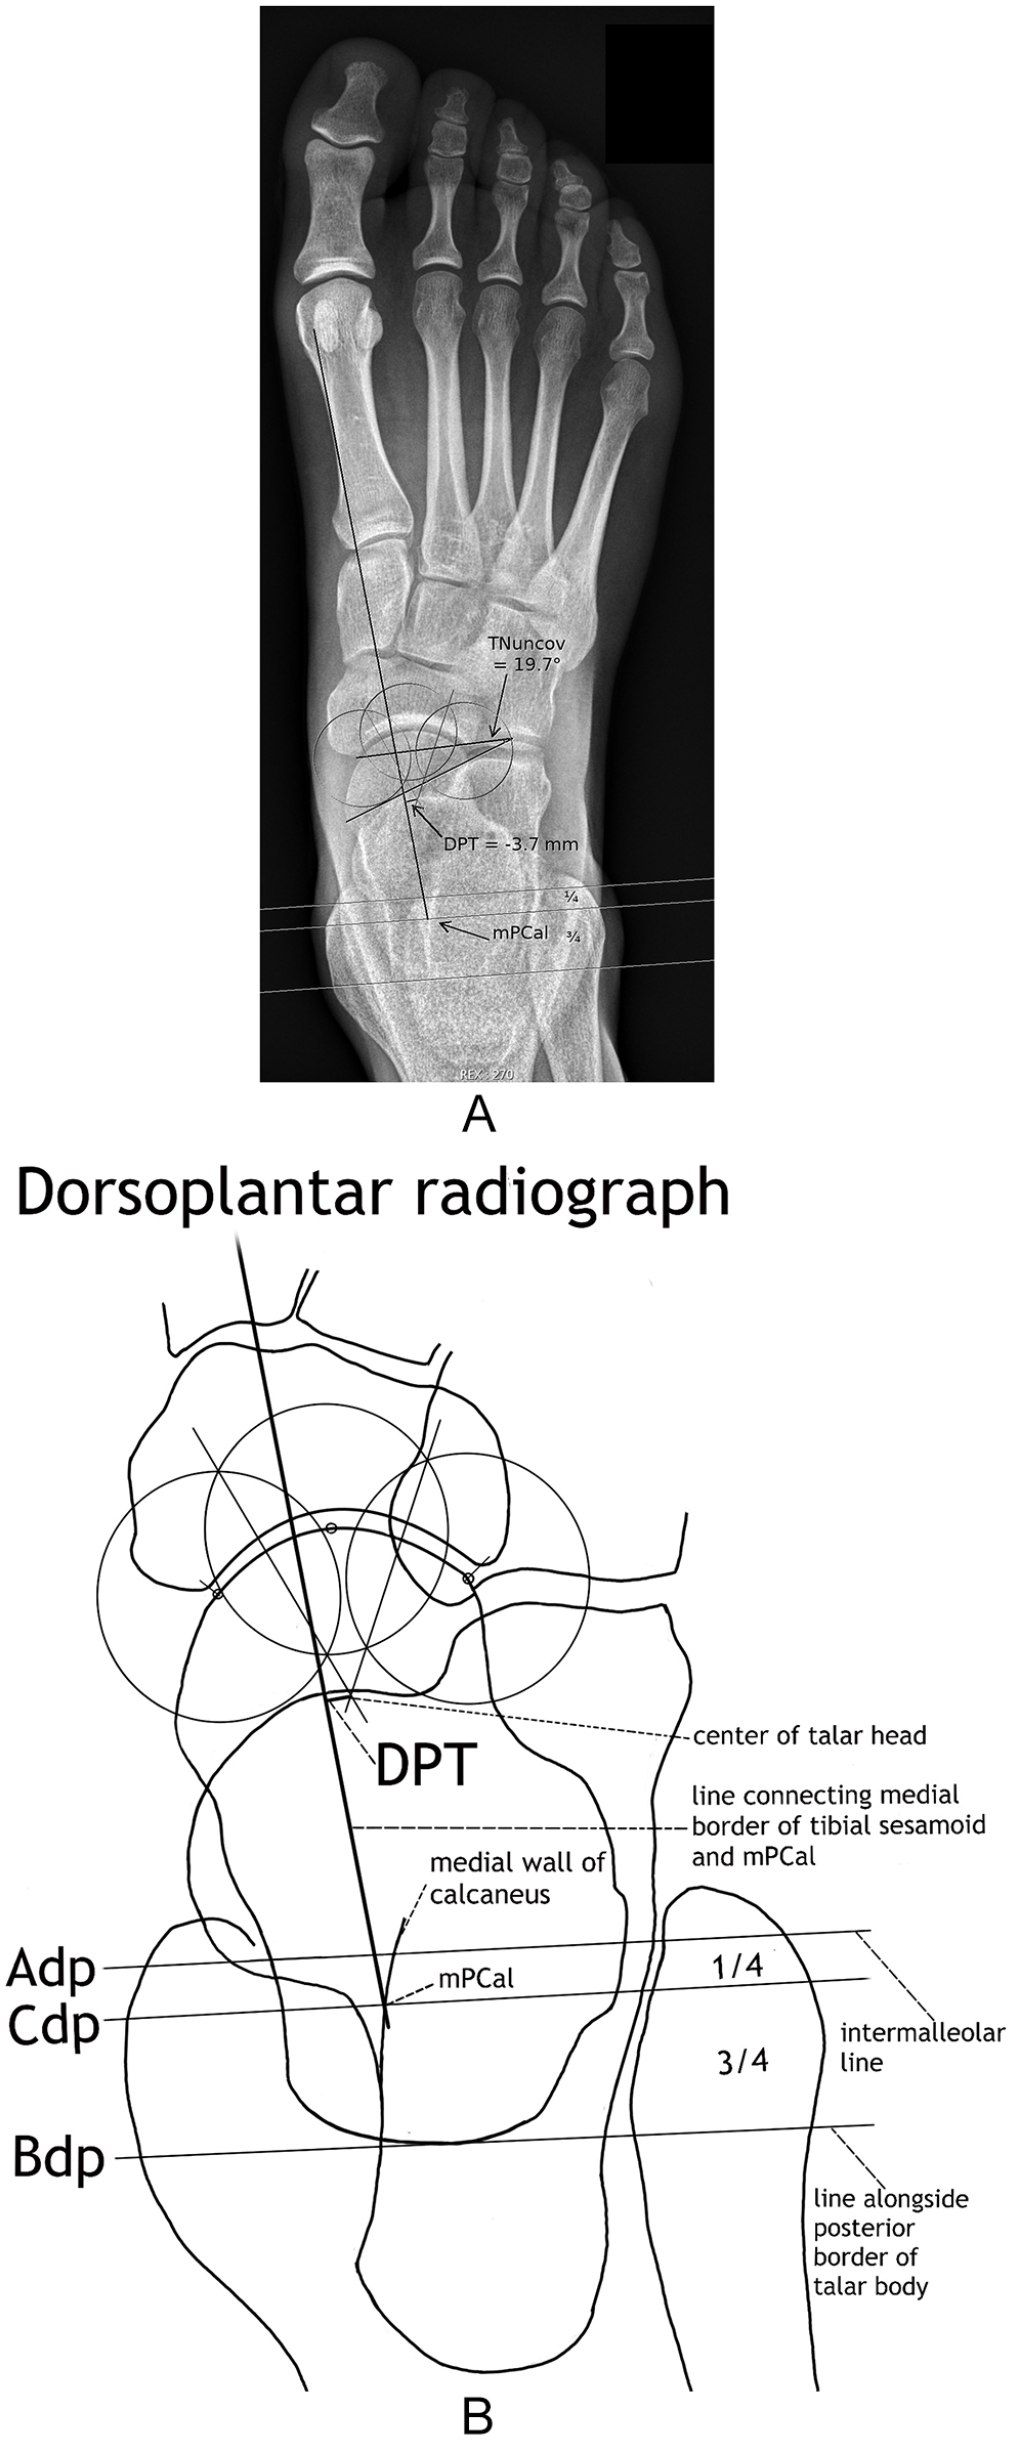
(A) Dorsoplantar radiograph of the foot in Figure 2A. Measurement of DPT (the shortest distance between the medial border of the plantar fascia and the center of the talar head). The medial plantar fascia’s calcaneal insertion (mPCal) is located at the intersection of the established distance on the lateral radiograph with a hyperdense line (medial wall of the calcaneus) running slightly lateral to the concavity of the proximal sustentaculum tali. (TNuncov, talonavicular uncoverage angle.)
Using the method of perpendicular bisectors of 2 chords to define the center of a circle, the center of the talar head was established with 3 equal circles centered on the most lateral, distal, and medial talar head circumference articulating with the navicular. DPT received a negative sign for the center of the talar head resting laterally and a positive sign for the center of the talar head resting medially to the medial edge of the plantar fascia (Figures 3 and 4). See for DPT measurements also instructional video in the supplementary online files. All DP radiographs were graded for visibility of mPCal.
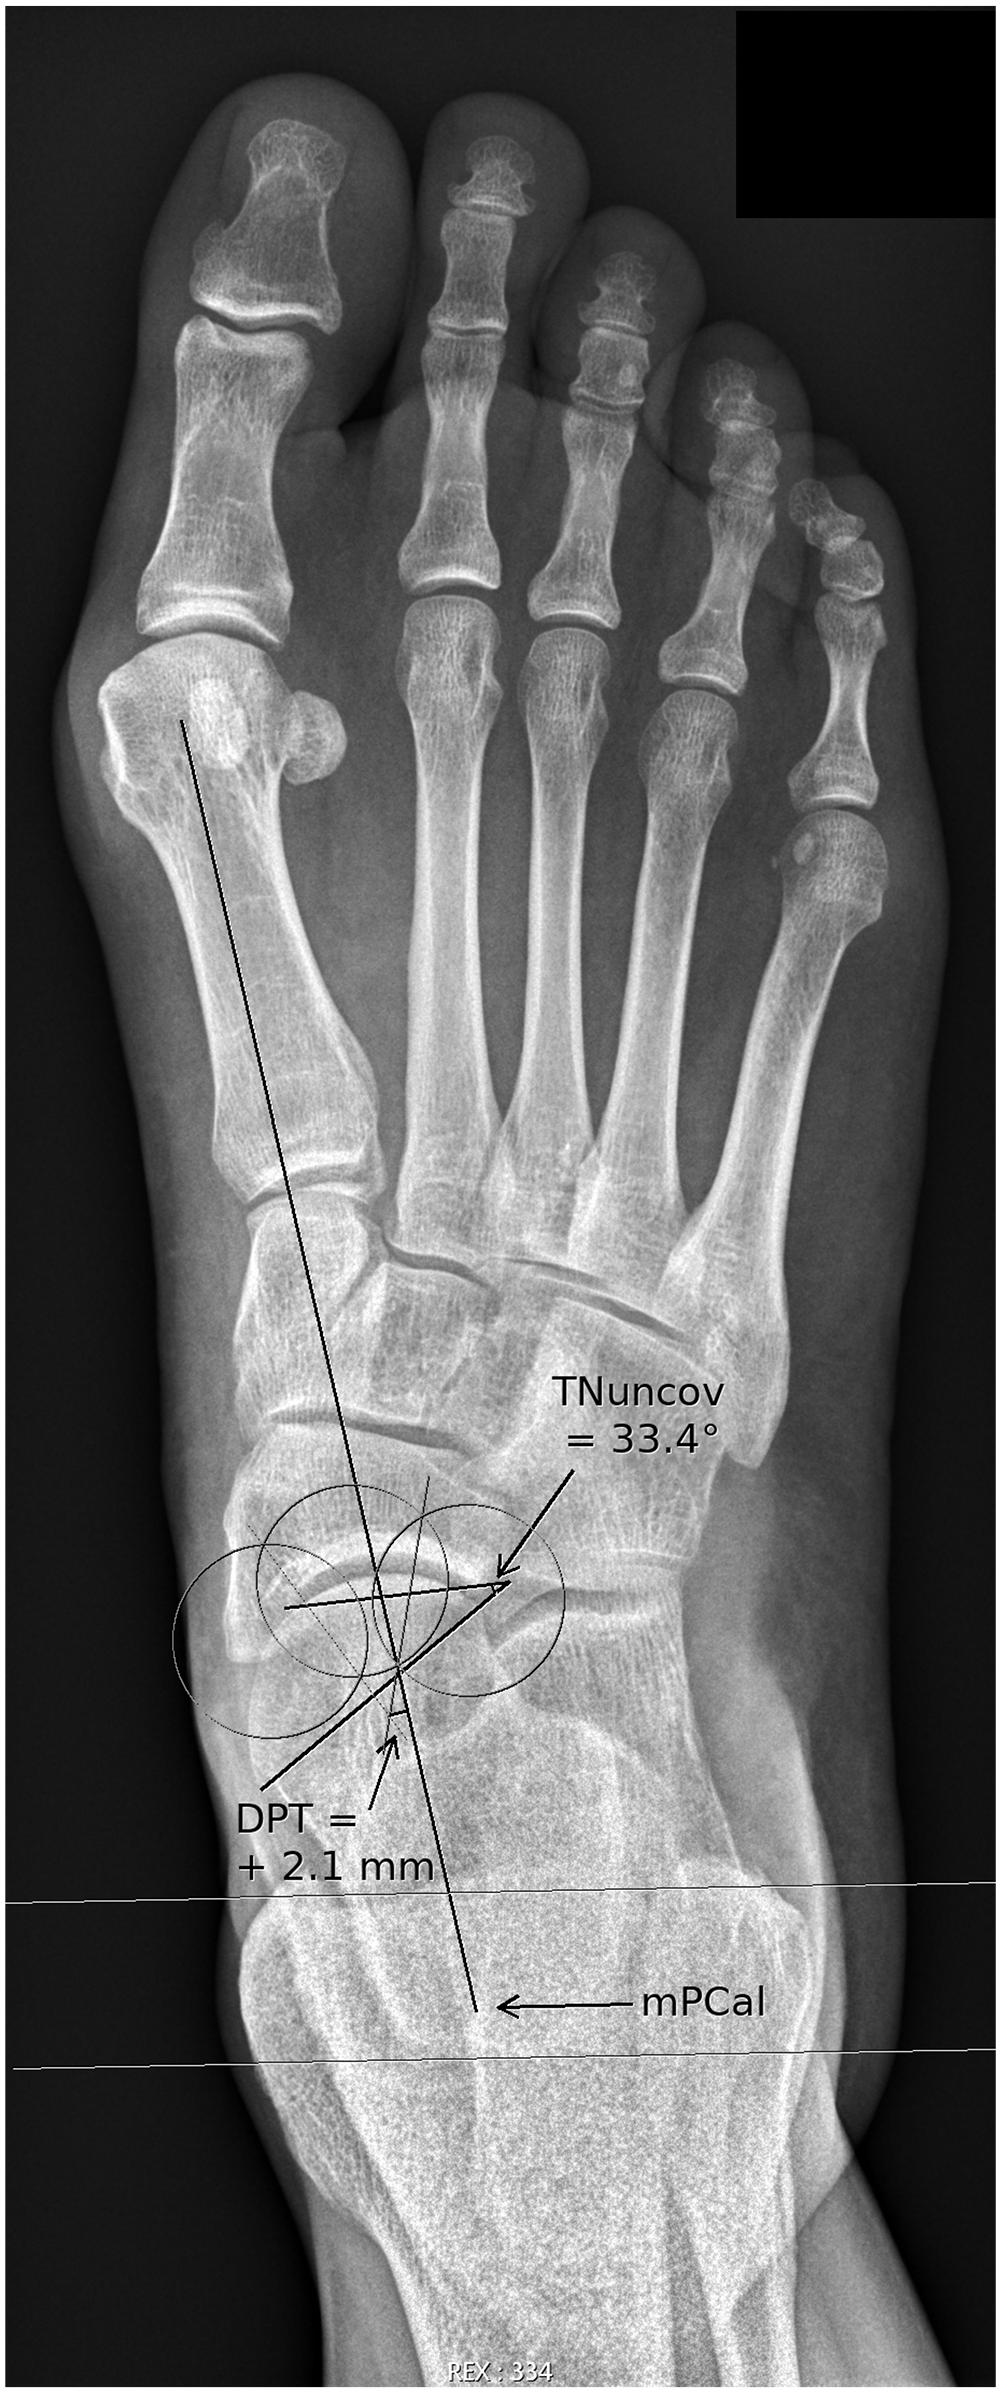
Dorsoplantar radiograph of a foot with a flatfoot deformity. Measurement of DPT (the shortest distance between the medial border of the plantar fascia and the center of the talar head). Contrary to the foot without a flatfoot deformity in Figures 2 and 3, the DPT is positive. (mPCal, medial plantar fascia’s calcaneal insertion; TNuncov, talonavicular uncoverage angle.)
Subjects and Clinical Examination (Prospective Study)
From January to September 2020, all consecutive first visits to a foot and ankle surgeon were evaluated by a clinical examination before the assessment of DPT. An FD was diagnosed when during inspection, the medial column of the longitudinal arch sagged—the only consistent finding between all FDs.
All subjects that needed a DP radiograph of the foot in our clinic were included in the study except 1 subject who did not let the longitudinal arch sag during the acquisition of the radiographs as noted in the clinical chart.
Evaluation of the Effect of Corrective Surgery on PTC (Retrospective Study)
All radiographs were collected from patients who underwent corrective surgery for FD between February 2013 and October 2019. Fifty-five patients were identified by performing a computerized database search for operative procedure including medial slide calcaneal osteotomy, lateral column lengthening calcaneal osteotomy, and talonavicular or subtalar arthrodesis. The inclusion criteria were an assessable mPCal on pre- and postoperative weightbearing radiographs and the patient’s capacity of full weightbearing on the operated foot during image acquisition.
Sufficient correction of an FD was defined on the basis of the absence of any signs of FD during the postoperative clinical and radiographic assessments.
Statistical Analysis (Prospective Study)
The reliability of PTC was estimated by calculating the intra- and the interobserver reliability of the DPT measurement. In both cases, the intraclass correlation coefficient (ICC2) was calculated on 50 randomly selected feet.
The accuracy of PTC, the ability to differentiate feet with and without FD consistent with the clinical examination, was expressed by calculating the sensitivity and specificity on 218 feet.
For each of these statistics, the point estimate alongside the 95% confidence intervals (CIs) was presented. The Wilcoxon test was performed to evaluate whether the 3 measures (DPT, Tal1mt, and TNuncov) differed between feet with and without FD.
Results
Prospective Study
The ICC2 of the intraobserver reliability of DPT measurement was 0.95 (95% CI: 0.92-0.97), and the ICC2 of the interobserver reliability was 0.93 (95% CI: 0.89-0.95).
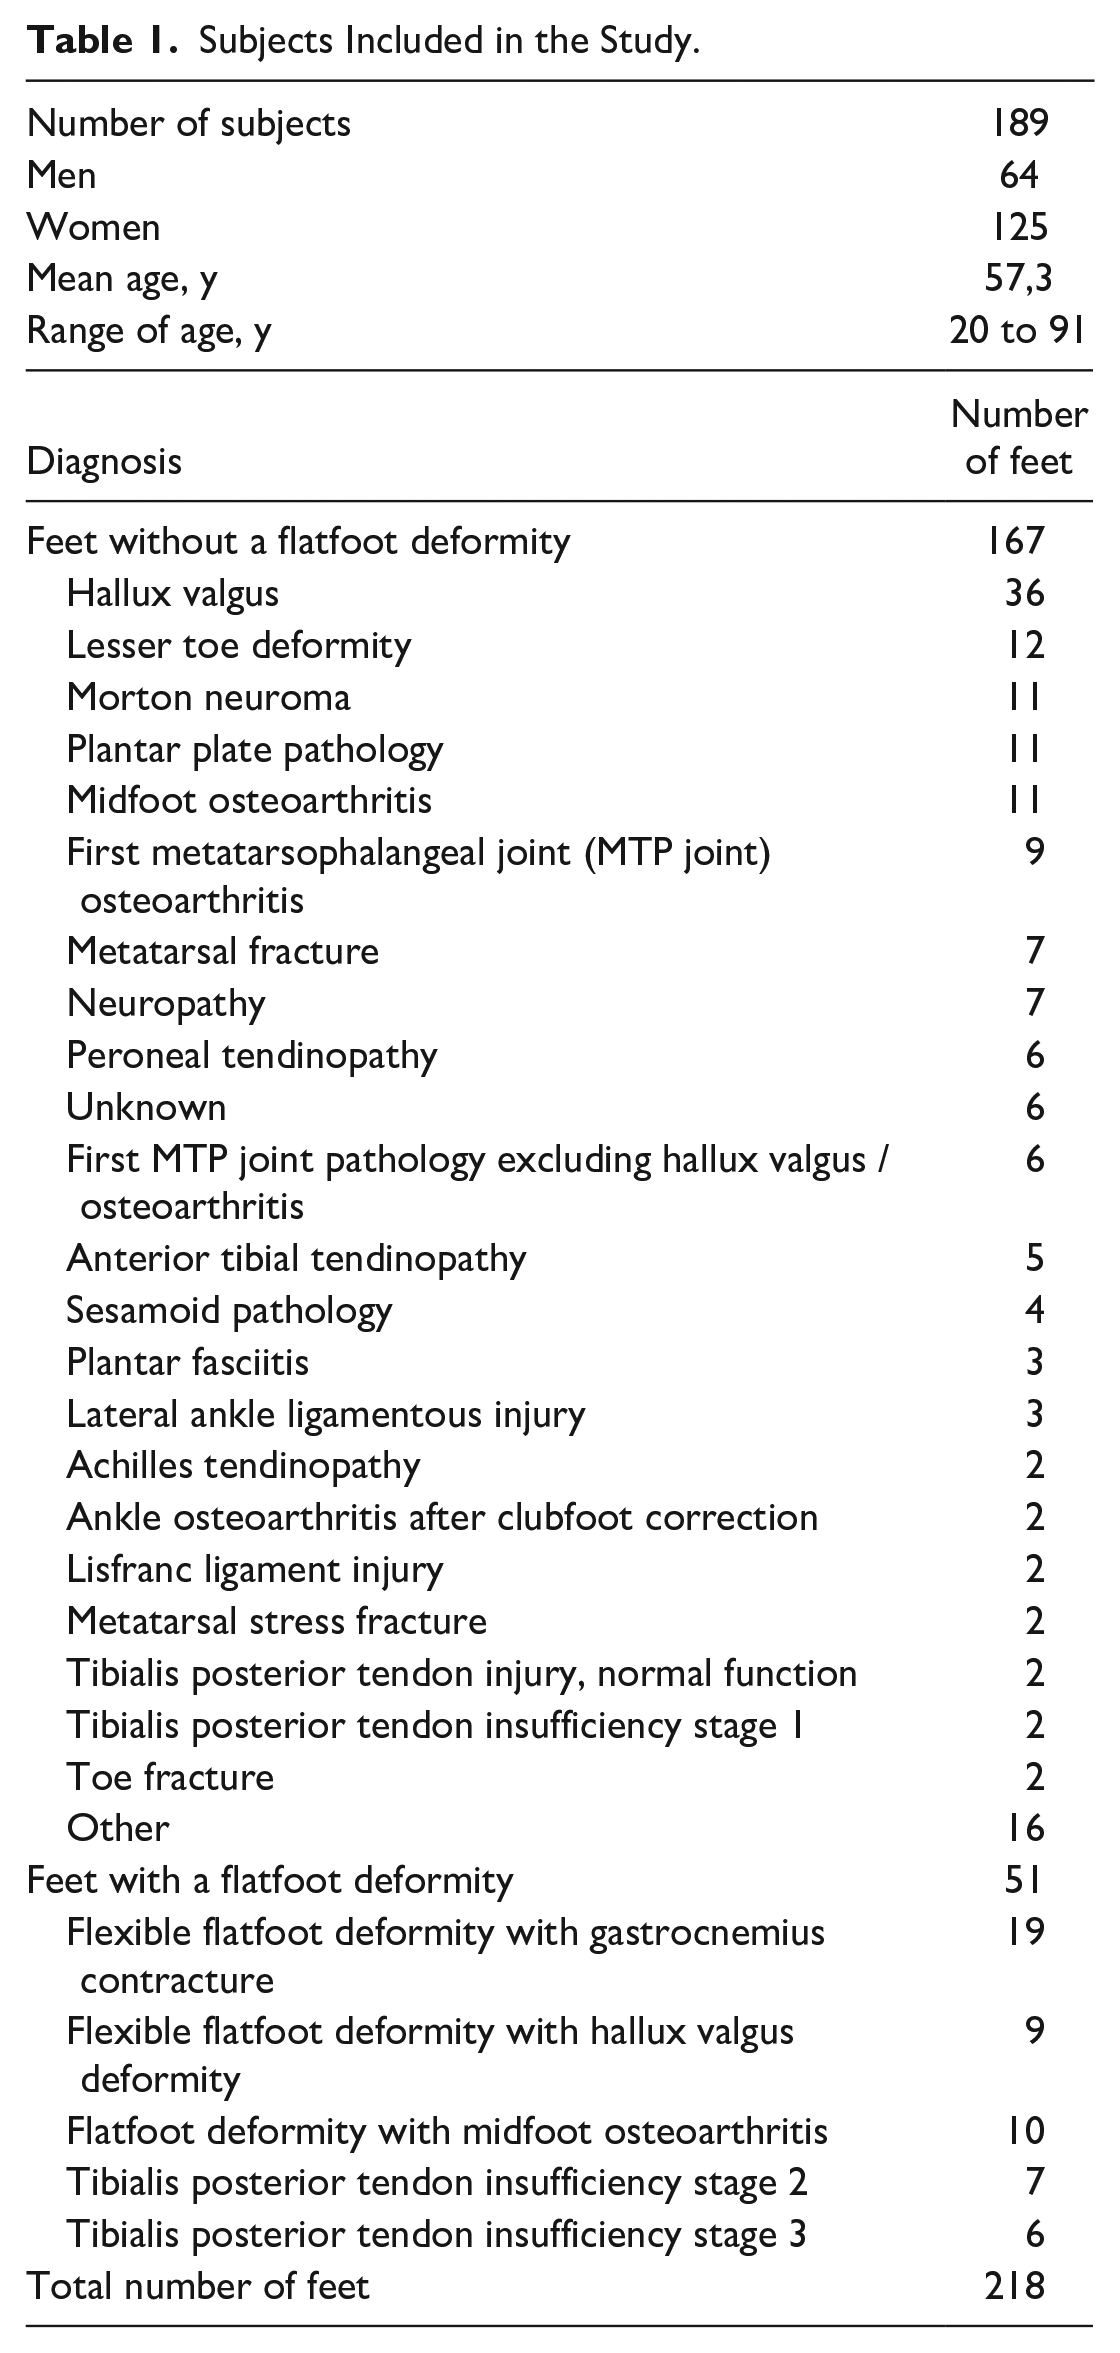
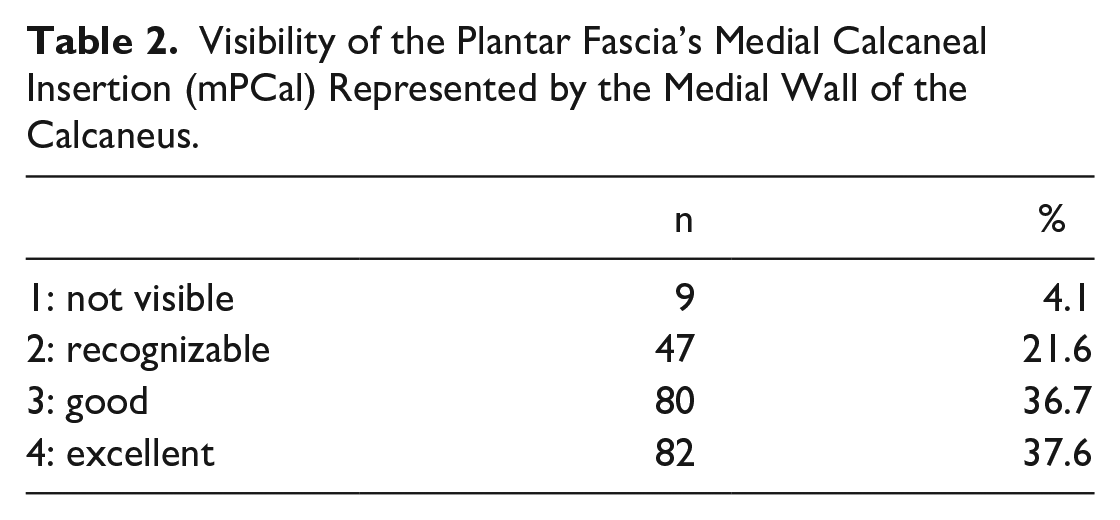
The summary of the subjects’ demographics and the diagnosis of the 218 feet sorted into groups with and without FD are shown in Table 1. The detailed findings of the clinical examination of the feet with FD are presented in the supplementary online files, including a table of the excluded subjects. Table 2 shows the visibility of mPCal on all 218 radiographs.
Subjects Included in the Study.
Visibility of the Plantar Fascia’s Medial Calcaneal Insertion (mPCal) Represented by the Medial Wall of the Calcaneus.
The diagnostic accuracy of PTC measuring DPT to differentiate feet with and without FD consistent with the clinical examination was expressed by a sensitivity of 0.88 (95% CI: 0.77-0.95) and a specificity of 0.96 (95% CI: 0.92-0.98). Five of 6 false negative results were FDs showing an evident collapse of the longitudinal arch on the lateral view at the tarsometatarsal and/or naviculocuneiform joints due to midfoot osteoarthritis (range of Tal1mt: 17.3-25.7 degrees) (Figures 5 and 6). Including the lateral weightbearing radiograph to identify an obvious midfoot collapse increased the sensitivity of the combined method to 0.98 (95% CI: 0.9-1).
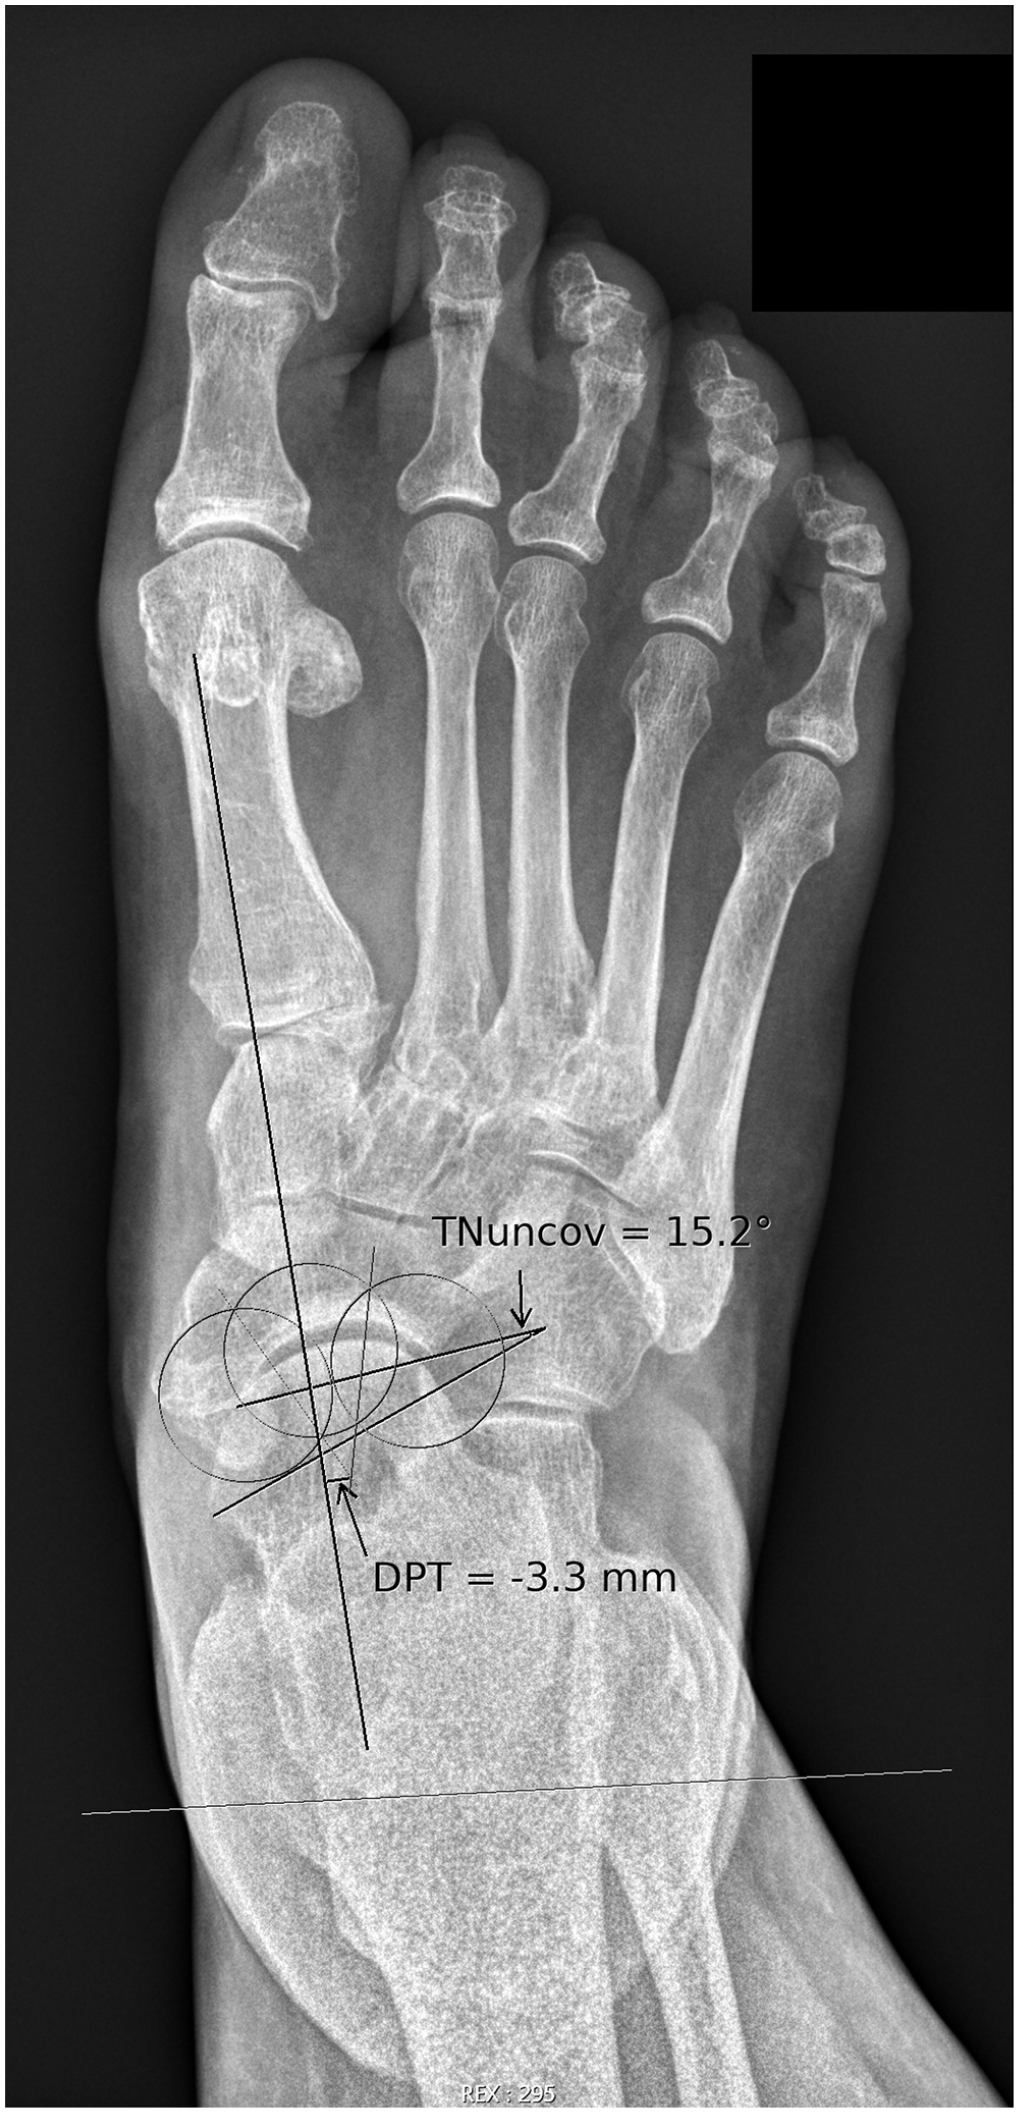
Dorsoplantar radiograph of a foot with exclusive sagittal plane flatfoot deformity due to midfoot osteoarthritis. DPT (the shortest distance between the medial border of the plantar fascia and the center of the talar head) was −3.3 mm, and talonavicular uncoverage angle (TNuncov) was 15.2 degrees.
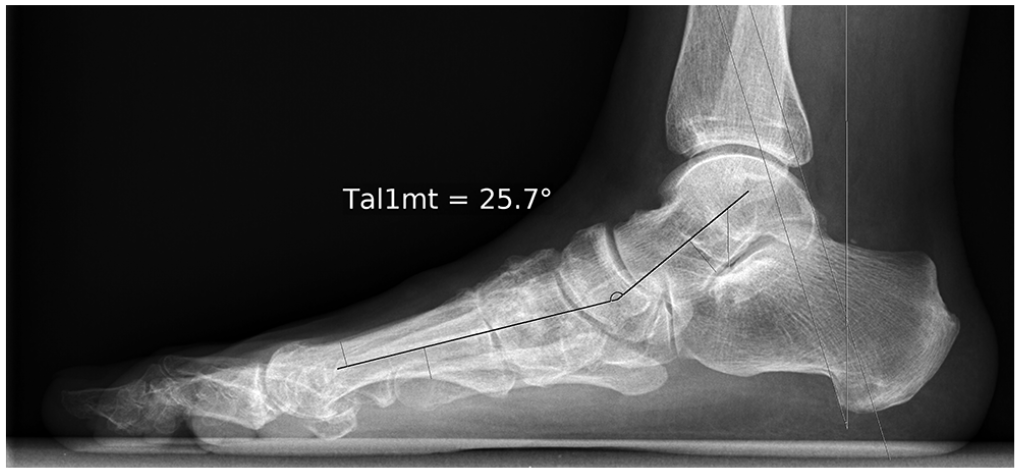
Lateral radiograph of the foot in Figure 5 with exclusive sagittal plane flatfoot deformity and a lateral talar–first metatarsal angle (Tal1mt) of 25.7 degrees.
The distribution of DPT, Tal1mt, and TNuncov showed significant differences between feet with and without FD (Wilcoxon test, P < .001) (Figure 7). However, the discriminatory power of DPT’s threshold set at 0 based on the hypothesis would result in a stronger than any arbitrary chosen threshold for DPT, Tal1mt, and TNuncov (Figure 8).
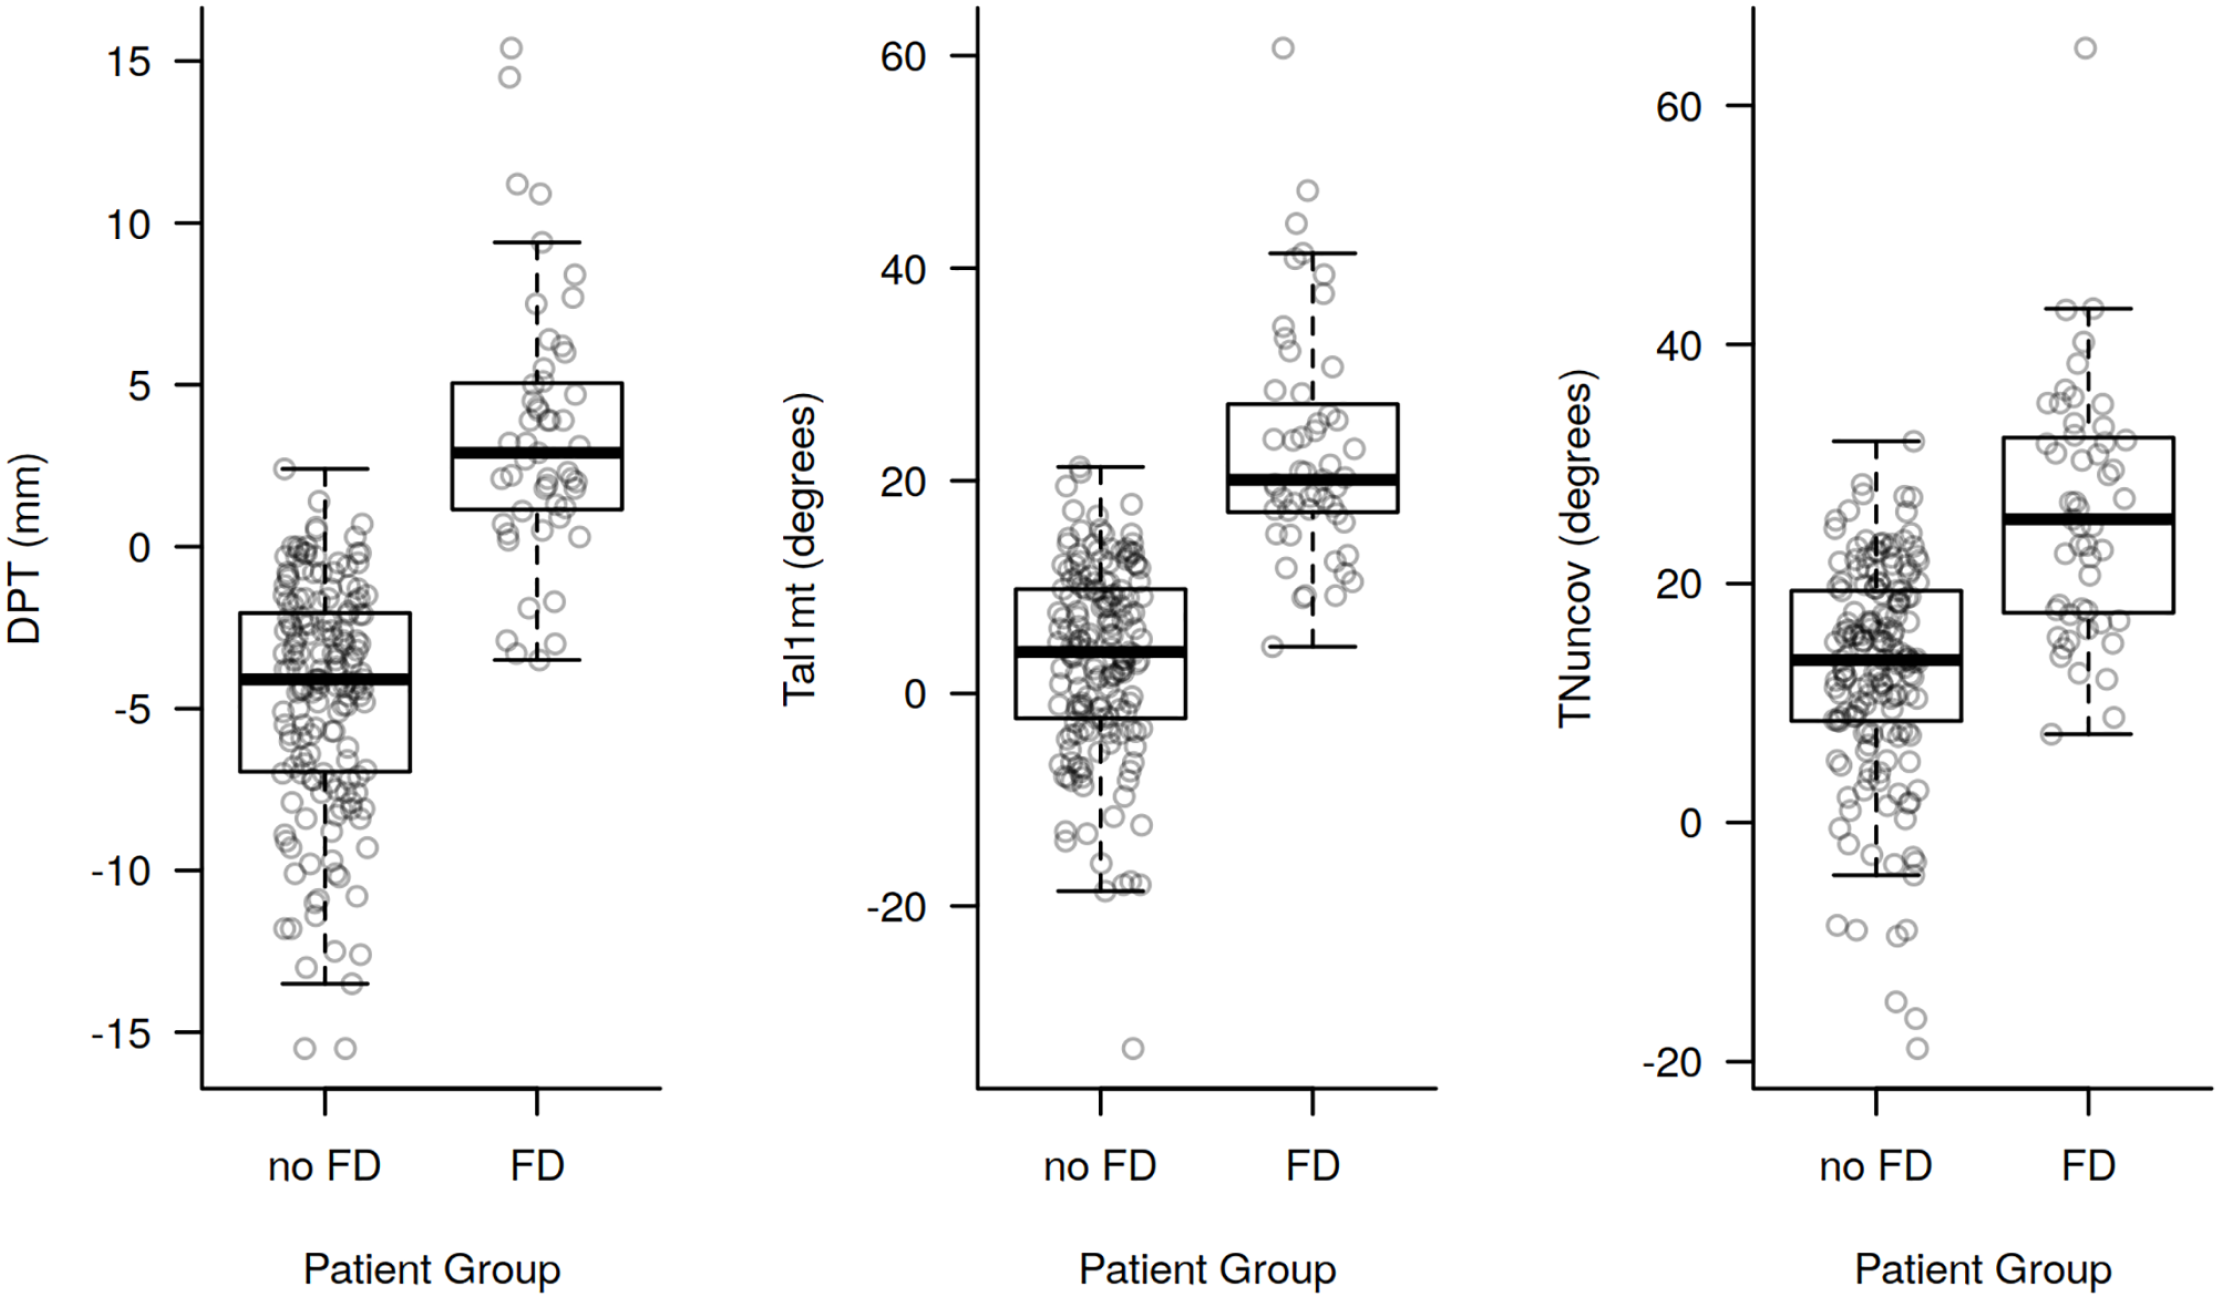
Distribution of the shortest distance between the medial border of the plantar fascia and the center of the talar head (DPT), the lateral talar–first metatarsal angle (Tal1mt), and the talonavicular uncoverage angle (TNuncov) for feet with and without a flatfoot deformity. All differences were statistically highly significant with Wilcoxon test (P < .001). The boxes contain the 25% through 75% quantiles (spanning the interquartile range), the thick horizontal line represents the median. Whiskers indicate the most extreme values lying within the box-edge and 1.5 times the interquartile range.
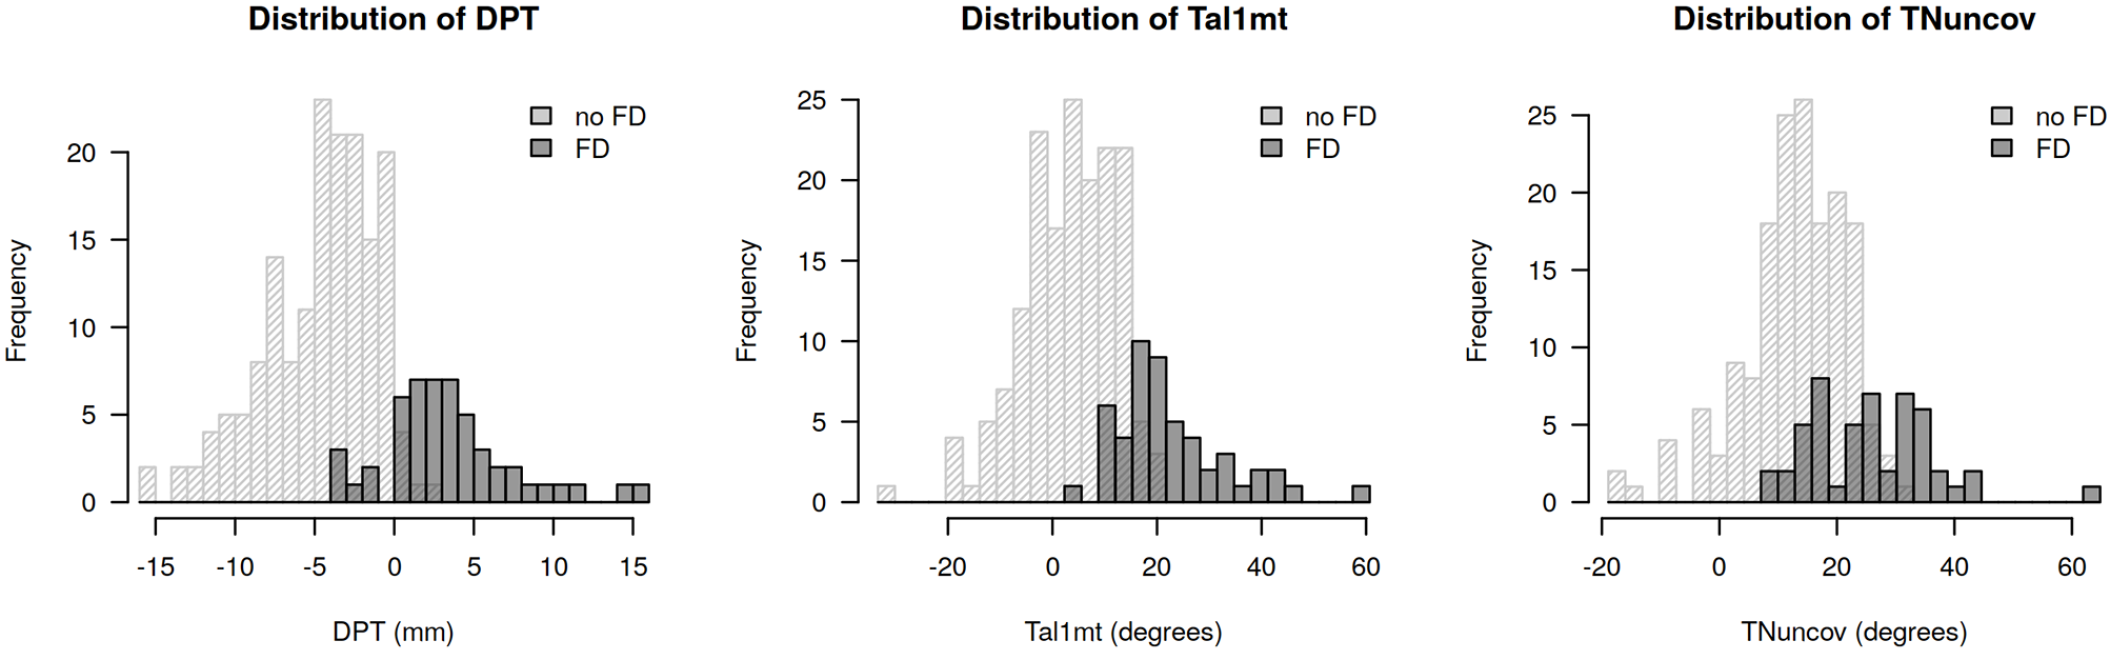
Distribution of the shortest distance between the medial border of the plantar fascia and the center of the talar head (DPT), the lateral talar–first metatarsal angle (Tal1mt), and the talonavicular uncoverage angle (TNuncov) for feet with and without a flatfoot deformity. The dark columns represent the feet with flatfoot deformity and the light columns represent those without the deformity. The threshold of DPT at 0 discriminates very well the feet with and without the flatfoot deformity. Any arbitrary chosen threshold of the Tal1mt and the TNuncov will result in a weaker discriminatory power.
Retrospective Study
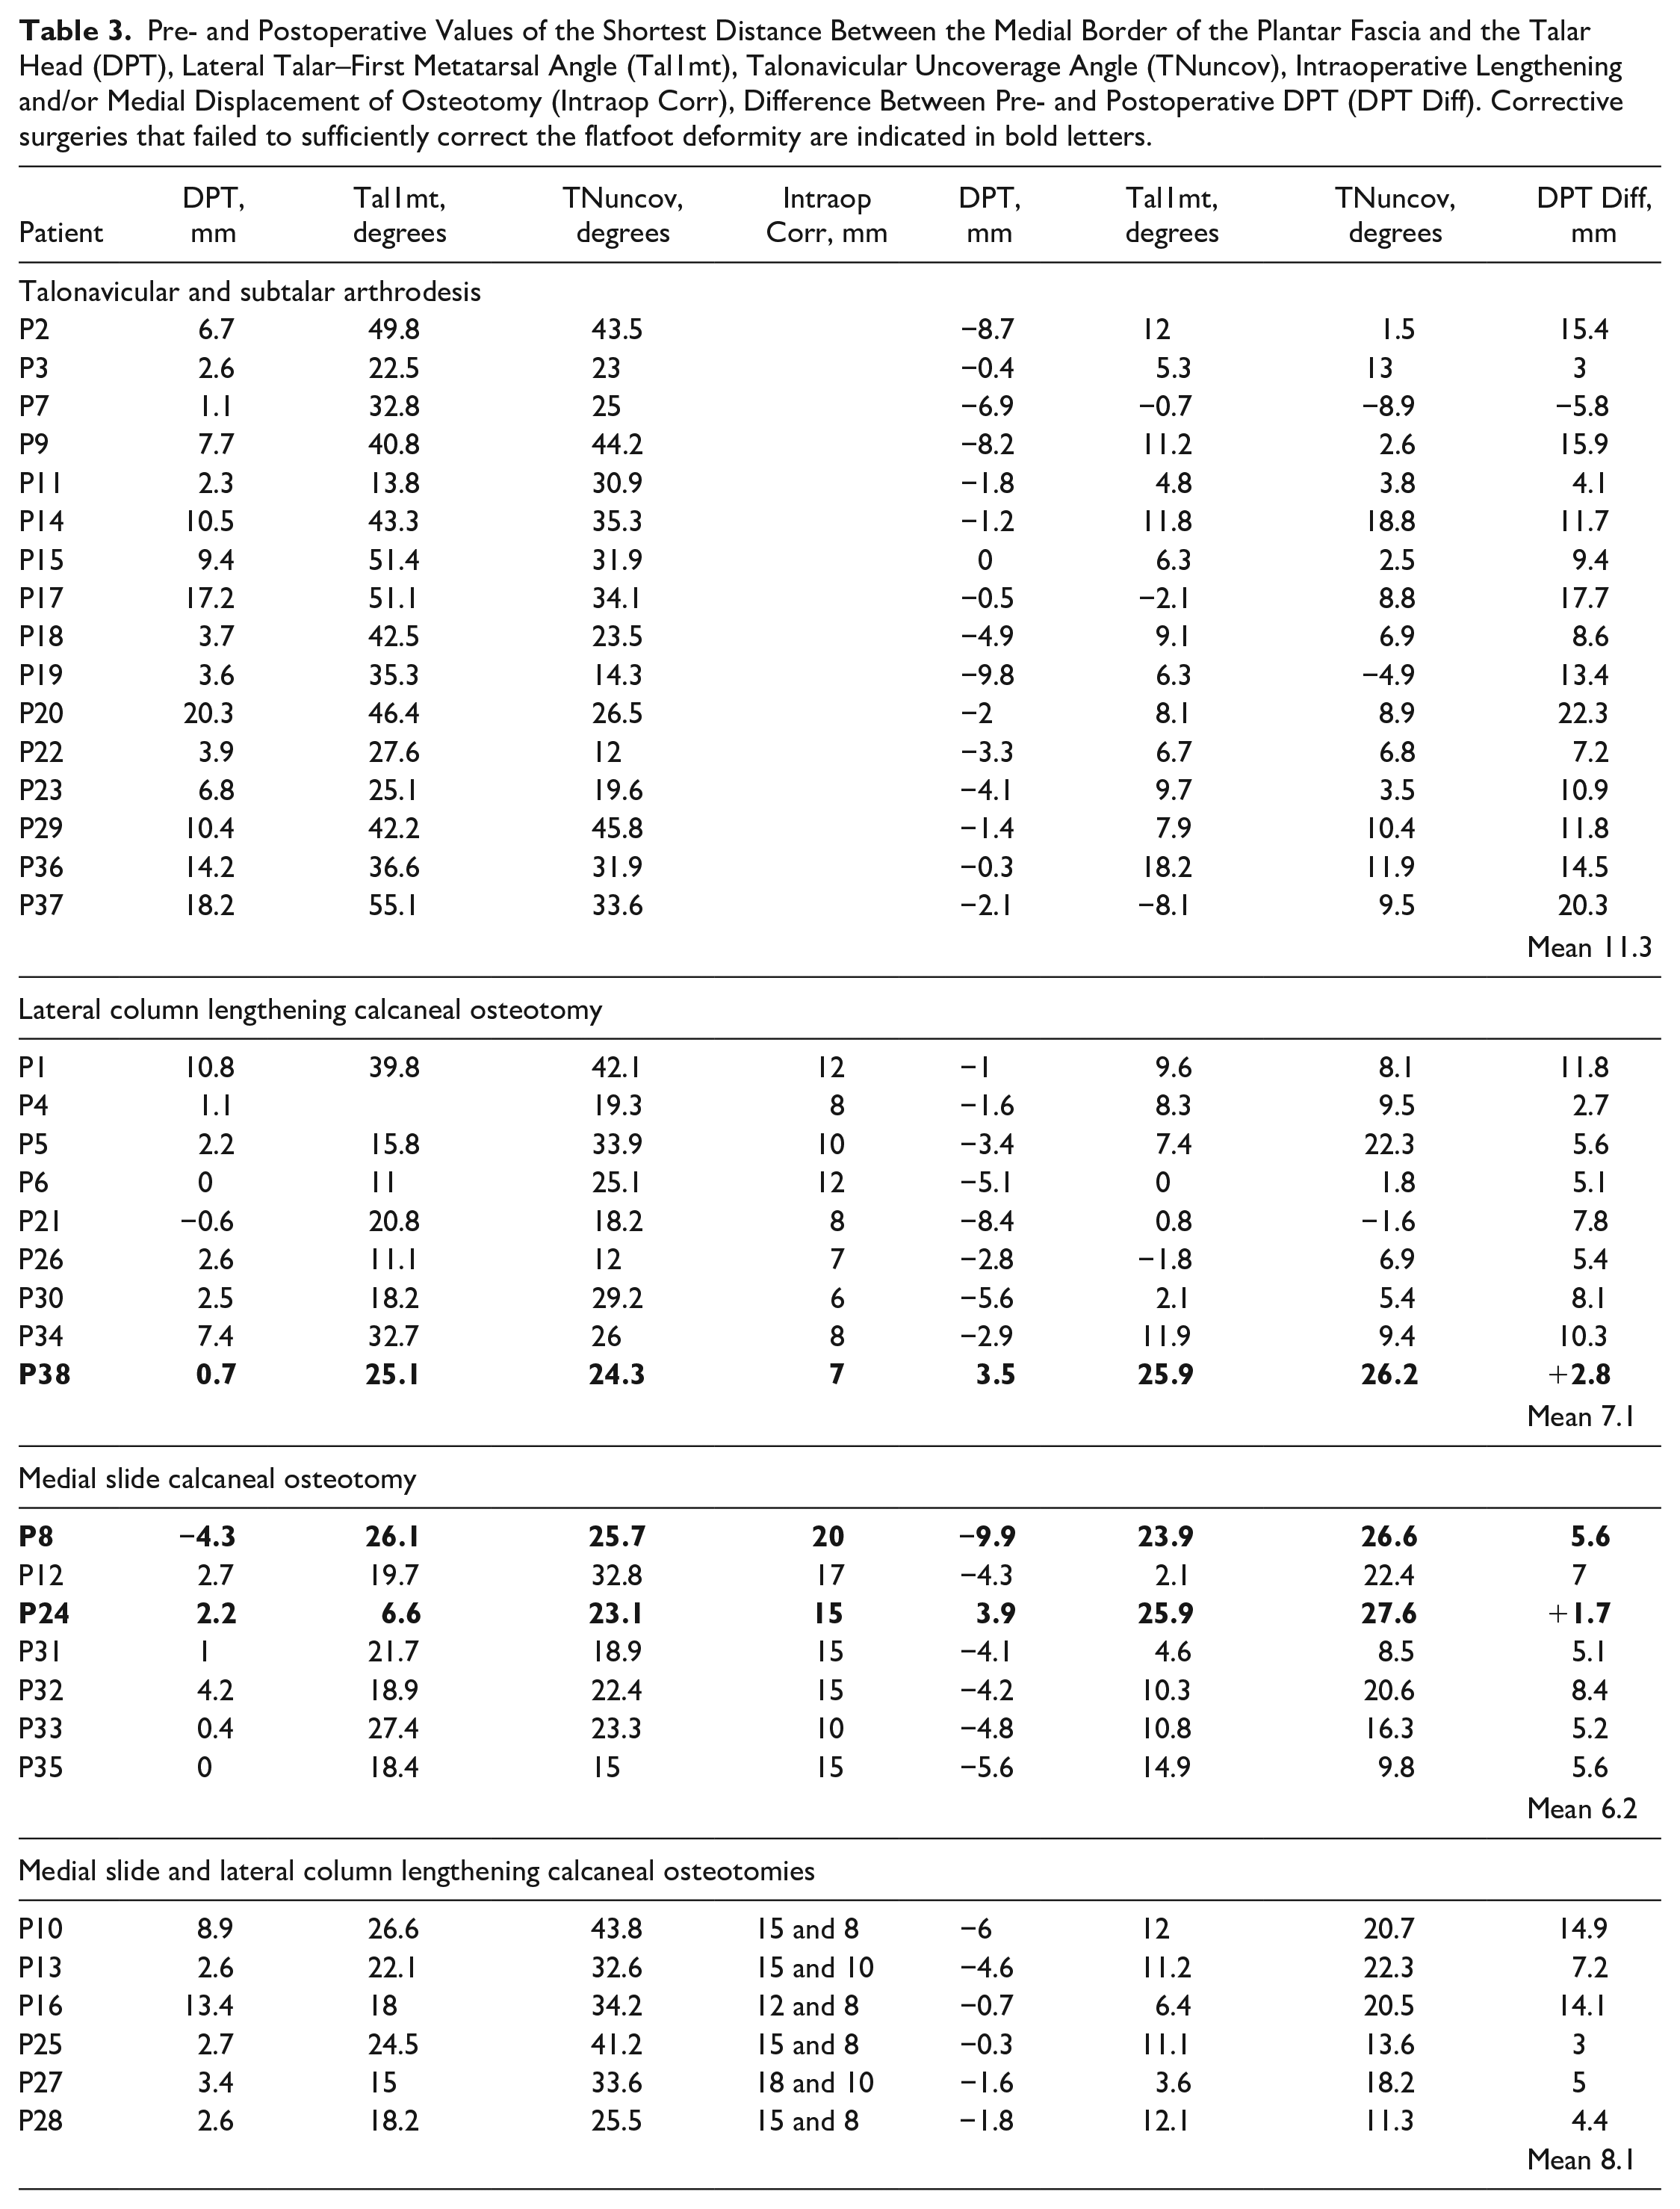
Thirty-eight of the 55 operatively corrected patients met the inclusion criteria (details in the supplementary online files). The pre- and postoperative radiographic measurements of all patients are summarized in Table 3 and Figure 9. Preoperative DPT showed a positive value in 34 patients, as expected in confirmed FD. In 4 patients, DPT was zero or negative. Patients 6 and 21 had a remark in their chart that they did not let the arch sag during preoperative image acquisition. Both had a traumatic deltoid ligament rupture and had to be encouraged to stand without guarding the foot. Patient 35 had a sagittal plane FD due to a midfoot pathology. Patient 8 had a midfoot adduction deformity, and the DPT remained negative after insufficient correction of the FD. Two additional corrective surgeries failed to sufficiently correct the FD (indicated in bold letters in Table 3 and Figure 9). A plantigrade foot was restored following the remaining 35 corrective surgeries resulting in a DPT of ≤0 mm, a Tal1mt of 7.0±5.4 degrees, and a TNuncov of 9.7±7.8 degrees.
Pre- and Postoperative Values of the Shortest Distance Between the Medial Border of the Plantar Fascia and the Talar Head (DPT), Lateral Talar–First Metatarsal Angle (Tal1mt), Talonavicular Uncoverage Angle (TNuncov), Intraoperative Lengthening and/or Medial Displacement of Osteotomy (Intraop Corr), Difference Between Pre- and Postoperative DPT (DPT Diff). Corrective surgeries that failed to sufficiently correct the flatfoot deformity are indicated in bold letters.
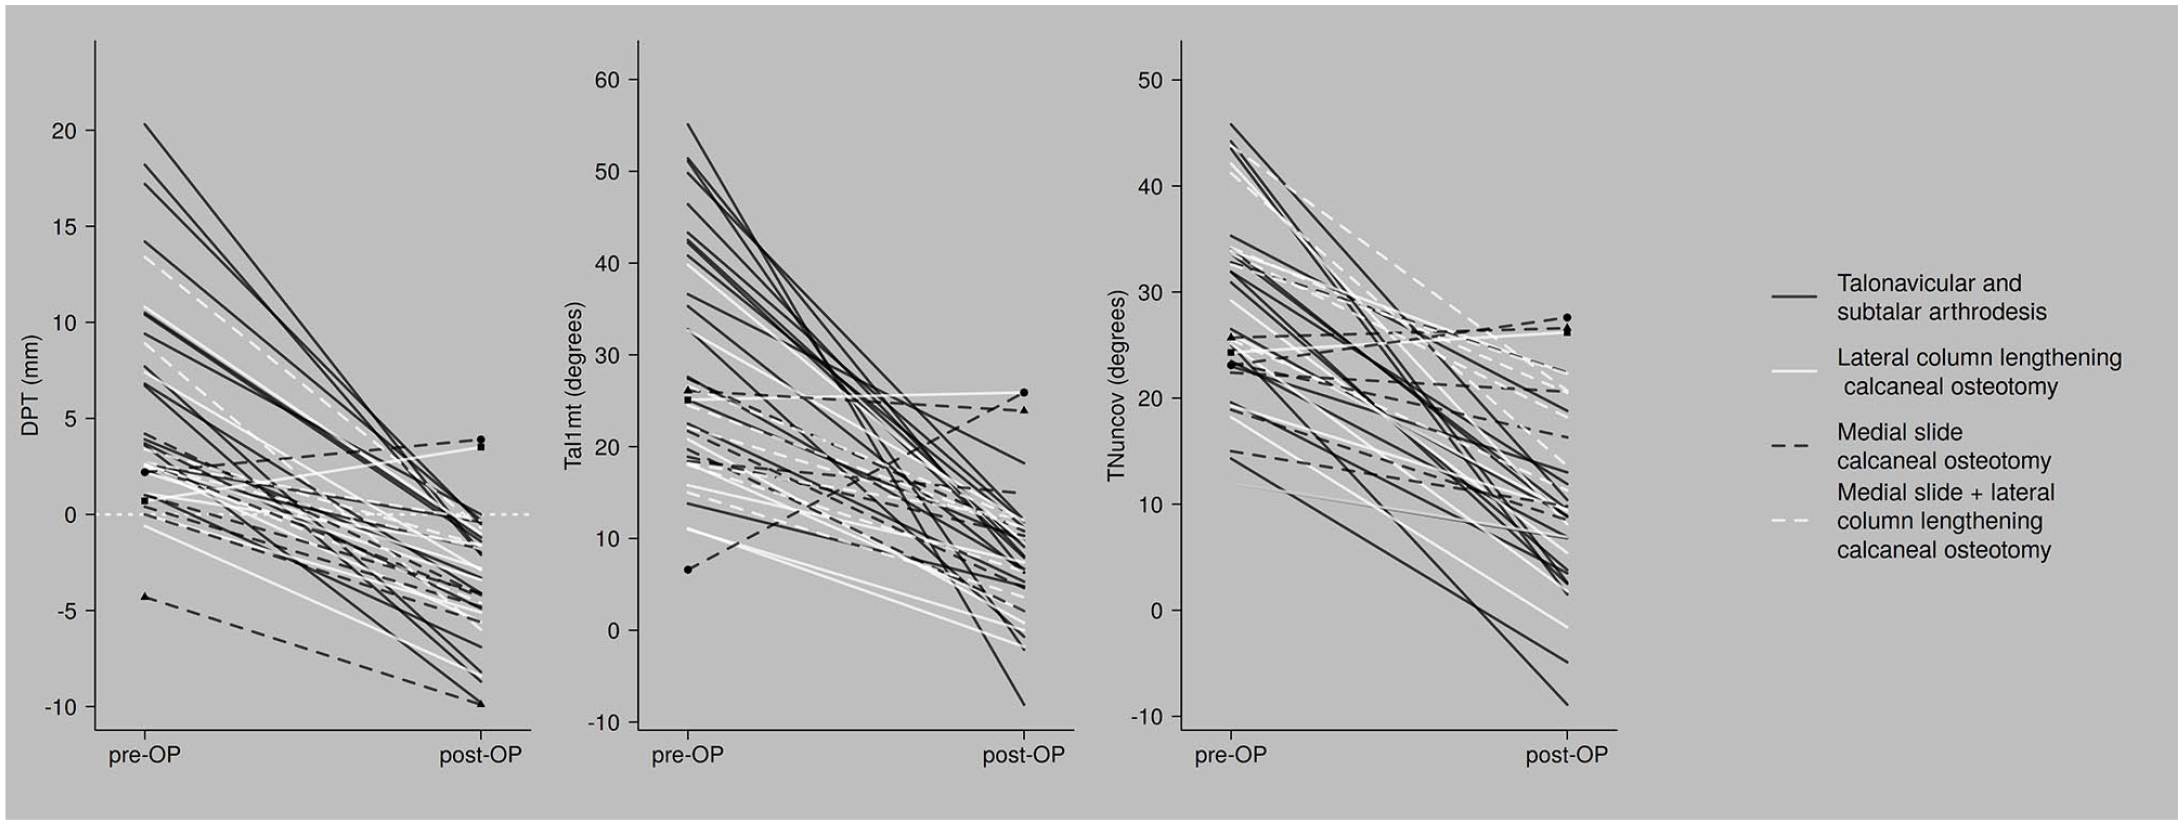
The pre- to postoperative changes of the shortest distance between the medial border of the plantar fascia and the center of the talar head (DPT), lateral talar–first metatarsal angle (Tal1mt), and the talonavicular uncoverage angle (TNuncov) are shown in different shades of gray classified according to their main osseous corrective procedure. The clinically insufficient corrections are marked with geometrical symbols (▲, •, ■).
Discussion
Prospective Study
The center of the talar head was located medially to the plantar fascia’s medial border in all feet with FD, except in 6 feet, of which, 5 had FD due to midfoot osteoarthritis. Osteoarthritis of the tarsometatarsal joints can cause instability with progressive osseous destruction and collapse of the longitudinal arch. Radiographical assessment of the 5 feet showed the deformity only on the lateral view. The deformity appeared explicitly in the sagittal plane. Tal1mt was increased and the values of DPT and TNuncov were within the limits of the controls. Further analysis of the extremes of these 3 values made different types of FDs apparent (Table 4). Stage 3 tibialis posterior tendon insufficiency is the most evident FD, because the deformity is advanced and occurs in all 3 planes. However, DPT also allowed to identify FDs occurring mostly in the coronal plane when the values of Tal1mt and TNuncov were within the limits of the controls. PTC can reliably identify an FD after the exclusion of explicit sagittal plane FDs owing to an isolated midfoot pathology. A rare exception was the FD seen in patient 8 (retrospective study). The midfoot adduction deformity with reduced sesamoids under the first metatarsal head influenced DPT in the opposite direction to the abduction deformity at the talonavicular joint. The resulting DPT did not represent the true extent of the deformity.
Flatfoot Deformities (FD) With Extreme Values of the Shortest Distance Between the Medial Border of the Plantar Fascia and the Center of the Talar Head (DPT), the Lateral Talar–First Metatarsal Angle (Tal1mt), and the Talonavicular Uncoverage Angle (TNuncov).
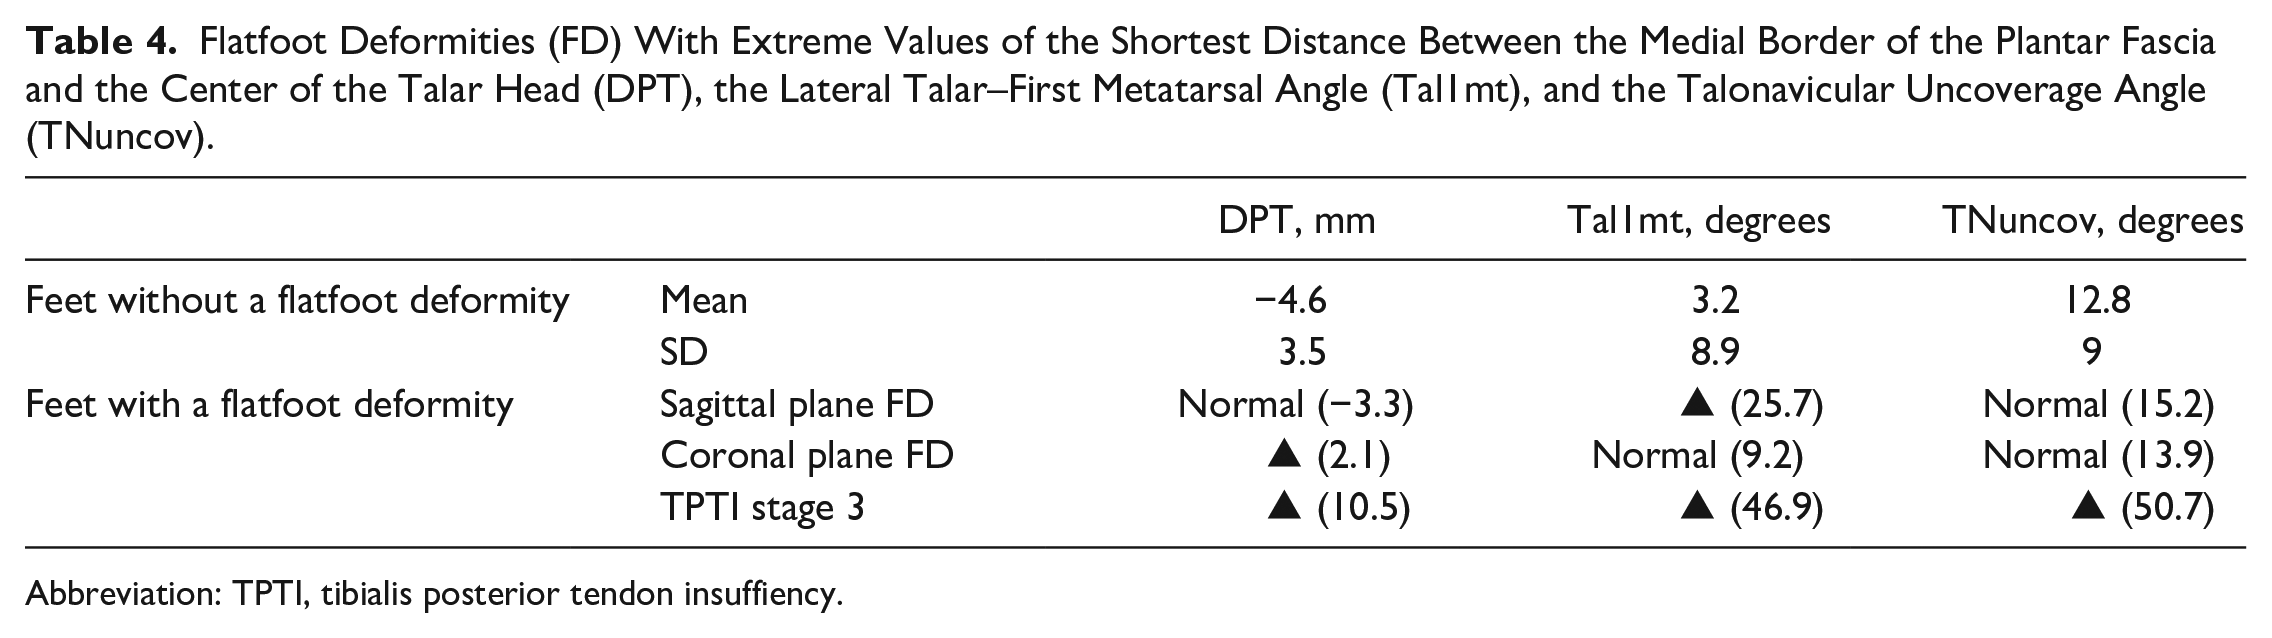
Abbreviation: TPTI, tibialis posterior tendon insuffiency.
All 3 radiographic parameters showed a significant difference in their values between feet with and without FD, consistent with previously reported results for Tal1mt13,17,35 and TNuncov.13,35 However, PTC had a distinct threshold of DPT at zero to differentiate between feet with and without FD. This natural threshold proved to be excellent based on the discriminatory power and high sensitivity and specificity of PTC. Tal1mt and TNuncov did not express such a distinct threshold consistent with previous studies proposing a wide disparity of values for healthy controls, which for Tal1mt were 0 degrees,20,26 −4 to +4 degrees,13,18,19 and mean values of up to 7.1±10.7 degrees. 35 In the current study, the mean value of Tal1mt for feet without an FD was 3.2±8.9 degrees. Limits of TNuncov for feet without an FD were reported as <7 degrees 9 or 14 degrees. 23 However, healthy controls in previous studies were reported to have values of TNuncov of 23.6±9.8 degrees 17 and 19.3±23.8 degrees, 35 which was 12.8±9 degrees in the current study.
In 4% of the feet, the location of mPCal was not assessable on DP radiographs. Repeating the radiographs with an increase of X-ray exposure dosage could improve the visibility of mPCal.
The intra- and interobserver reliability of DPT was excellent. The incongruency of mPCal’s location on the DP view was the main reason for the interobserver discrepancies. However, during the pilot measurements, a learning curve could locate mPCal and correctly assess the superimposed tibia, talus, and the calcaneus. Although weightbearing CT can define the location of mPCal more precisely, a conventional radiographic parameter can be used intraoperatively to titrate the required amount for correction of FD under simulated weightbearing fluoroscopic imaging. 33
Retrospective Study
Figure 9 shows how PTC compares to Tal1mt and TNuncov in validating corrective surgery. The range of preoperative and postoperative values of DPT overlapped less than that of Tal1mt and TNuncov. The few patients causing the overlap of DPT were those with unsuccessful corrections or those who had a reasonable explanation for preoperative negative values as previously mentioned. Conversely, patients with clinically successful corrections had values of Tal1mt and TNuncov within the overlap of pre- and postoperative values. The postoperative values of Tal1mt and TNuncov decreased but only met values within the range of healthy controls in studies evaluating radiographic parameters17,35 and not the proposed values.9,13,18-20,23,26
The numerous diagnoses and procedures (see Supplemental Material) indicate the complexity of FDs and the large variation in morphology that needs to be addressed in surgery. However, in all sufficient corrections of FDs, the common finding was that PTC was restored to a level comparable to that of normal feet. An objective of corrective surgery should be to restore PTC. PTC may be assessed intraoperatively to monitor the titration process of the required amount of correction using simulated weightbearing fluoroscopic imaging (Figure 10). Sufficient correction may be achieved once DPT turns negative.
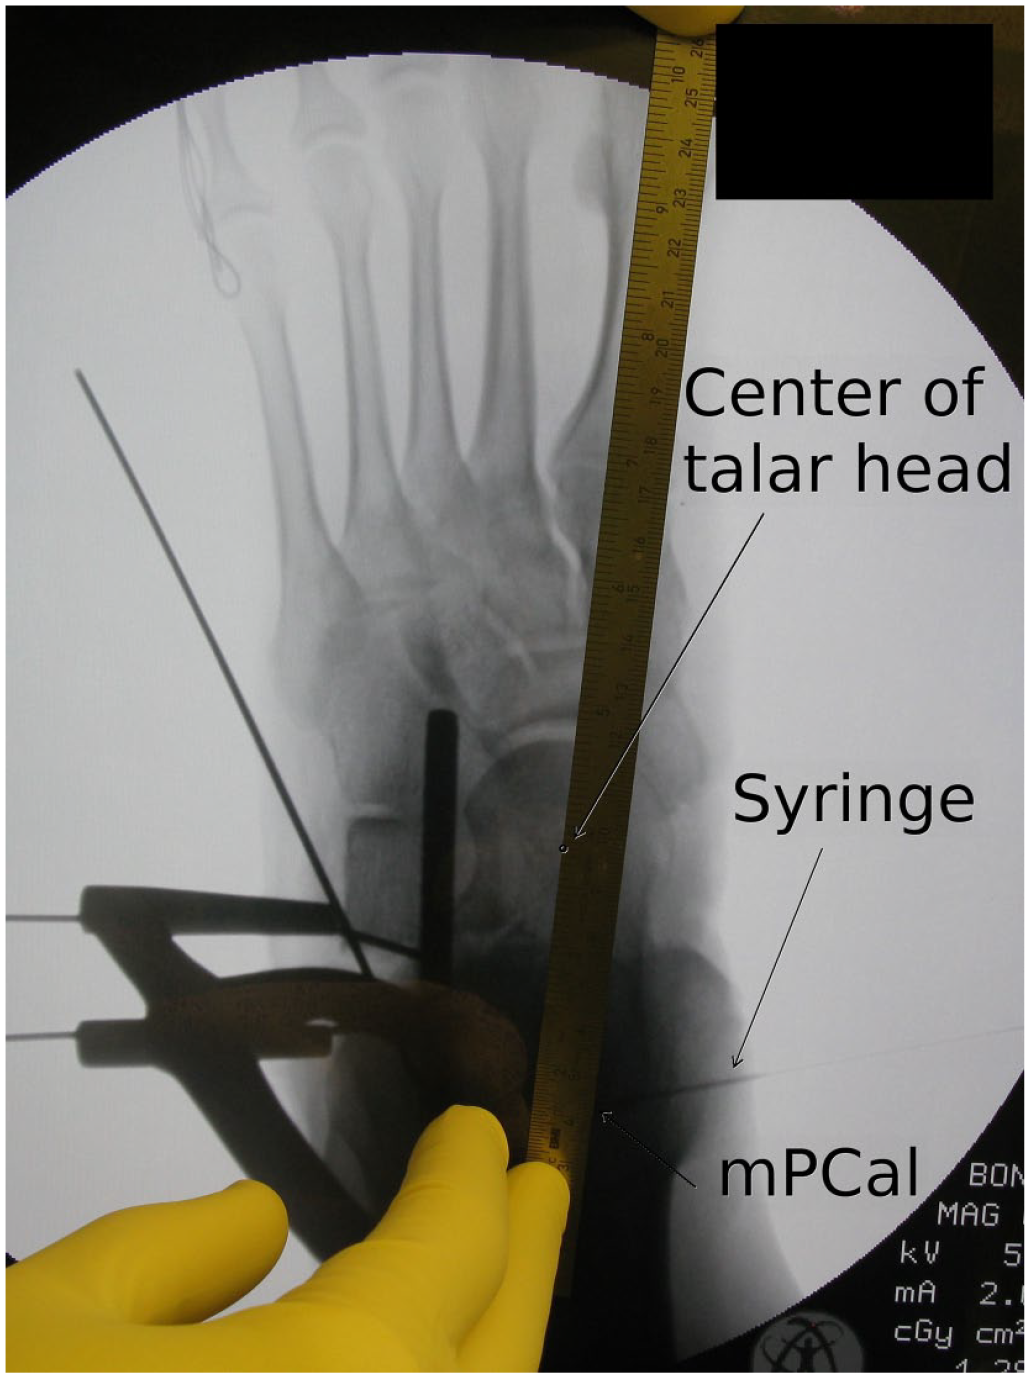
Intraoperative assessment of the shortest distance between the medial border of the plantar fascia and the center of the talar head (DPT) to monitor the required amount of correction for a flatfoot deformity under simulated weightbearing fluoroscopic imaging. The lateral calcaneal lengthening is titrated until the DPT turns negative. The medial calcaneal insertion of the plantar fascia (mPCal) represented by the medial wall of the calcaneus near the insertion is marked during surgery with a syringe to improve the visibility of mPCal.
Limitations
Although defining radiographic landmarks for the medial border of the plantar fascia on conventional radiographs is not precise, the landmarks used in this study were found to be sufficiently accurate to assess the truss for a valgus malalignment and thus identify feet with an FD.
The reliability of the clinical examination was not assessed through an independent examiner. However, the highly significant difference of Tal1mt between feet with and without a lowering of the longitudinal arch aligns with the findings of Coughlin and Kaz, 13 who also noted a correlation between the two, indicating the reliability of the clinical examination in the current study.
Thirty-one per cent of the patients were excluded from the retrospective study because standard DP radiographs did not consistently include mPCal. In addition, the X-ray beam was angled at 15 instead of 17 degrees posteriorly toward the heel. Based on an assessment using an X-ray phantom foot, it was found that the decrease of 2 degrees had a minimal effect on PTC but impaired the visibility of mPCal as more radiolucent and radiodense structures were superimposed.
Although the retrospective data had its shortcomings, absence of treatment bias during corrective surgery was ensured.
The purpose of this study was to explore a new radiographic parameter; therefore, it was difficult to make proper assumptions for a power analysis. This can be included in future studies together with the assessment of the significance of intraoperative measurement of DPT.
Conclusion
PTC is a reliable radiographic parameter with an excellent threshold to confirm an FD and is therefore useful to validate sufficient correction of its reconstructive surgery. PTC is an objective measurement to reliably describe the clinical subjective conclusion of any kind of FD with the exception FDs caused by an explicit midfoot pathology.
Supplemental Material
sj-docx-1-fai-10.1177_10711007211052258 – Supplemental material for The Plantar Fascia Talar Head Correlation: A Radiographic Parameter With a Distinct Threshold to Validate Flatfoot Deformity and Its Corrective Surgery on Conventional Weightbearing Radiographs
Supplemental material, sj-docx-1-fai-10.1177_10711007211052258 for The Plantar Fascia Talar Head Correlation: A Radiographic Parameter With a Distinct Threshold to Validate Flatfoot Deformity and Its Corrective Surgery on Conventional Weightbearing Radiographs by Marc Merian and Achim Kaim in Foot & Ankle International
Supplemental Material
sj-pdf-2-fai-10.1177_10711007211052258 – Supplemental material for The Plantar Fascia Talar Head Correlation: A Radiographic Parameter With a Distinct Threshold to Validate Flatfoot Deformity and Its Corrective Surgery on Conventional Weightbearing Radiographs
Supplemental material, sj-pdf-2-fai-10.1177_10711007211052258 for The Plantar Fascia Talar Head Correlation: A Radiographic Parameter With a Distinct Threshold to Validate Flatfoot Deformity and Its Corrective Surgery on Conventional Weightbearing Radiographs by Marc Merian and Achim Kaim in Foot & Ankle International
Footnotes
Acknowledgements
The authors thank Gilles Dutilh, PhD, statistician at the Department of Clinical Research, Clinical Trial Unit, University of Basel, Basel, Switzerland, and Nicole Hauser, Department of Radiology, Klinik Birshof Hirslanden AG, Münchenstein, Switzerland.
Declaration of Conflicting Interests
The author(s) declared no potential conflicts of interest with respect to the research, authorship, and/or publication of this article. ICMJE forms for all authors are available online.
Funding
The author(s) received no financial support for the research, authorship, and/or publication of this article.
Supplemental Material
Supplementary material is available online with this article.
References
Supplementary Material
Please find the following supplemental material available below.
For Open Access articles published under a Creative Commons License, all supplemental material carries the same license as the article it is associated with.
For non-Open Access articles published, all supplemental material carries a non-exclusive license, and permission requests for re-use of supplemental material or any part of supplemental material shall be sent directly to the copyright owner as specified in the copyright notice associated with the article.