
Abstract
In the present research, we investigate whether cultural value orientations (CVOs) and aggregate personality traits (Big-5) predict actual levels of alcohol consumption, smoking, and obesity across 50 countries using averages derived from millions of data points. Aggregate traits explained variance above and beyond CVOs in obesity (particularly neuroticism and extraversion), while CVOs explained variance beyond aggregate traits in alcohol consumption (particularly harmony and hierarchy). Smoking was not linked to aggregated traits or CVOs. We conclude that an understanding of the cultural correlates of risky health behaviors may help inform important policies and interventions for meeting international sustainable development goals.
Tackling issues such as obesity, abusive alcohol consumption, and smoking are fundamental to meeting the United Nations Sustainable Development Goals for 2030: particularly the goal to ensure healthy lives and promote well-being for all at all ages (United Nations General, 2015). This is unsurprising given that alcohol consumption, smoking, and obesity underpin a number of noncommunicable diseases (NCDs; e.g., type 2 diabetes and liver disease) and are responsible for a significant amount of deaths (World Healthy Organization [WHO], 2013). To ensure healthy lives and to promote well-being, it is important to develop a clear understanding of the cultural factors linked to variance in risky health behaviors. Currently, relatively little is known about correlates of risky health behaviors at the country level, such as aggregated personality and cultural values. Given this gap in the literature, as well as the need for fast and ambitious action to achieve the 2030 goals (Sachs et al., 2019), our main objective was to examine how national averages of alcohol consumption, smoking, and obesity (which can be considered, at least partly, as an indicator of two risky health behaviors: physical inactivity and increased/unhealthy food consumption; Prentice & Jebb, 1995) relate to cultural values and aggregate personality traits (e.g., McCrae et al., 2005; McCrae & Terracciano, 2008). We approached this task using large datasets comprising millions of data points as a way to get very accurate estimates of effect sizes.
Below, we first discuss the relations of traits and values with smoking, obesity, and alcohol consumption separately, before we discuss differences and similarities between traits and values as we outline our predictions. Because our study is one of the first that investigates the correlates of traits and values at the country level, our literature review will focus mainly on studies conducted on an individual level from which we then derive our hypotheses.
Personality Traits and Cultural Value Orientations
Personality traits refer to stable tendencies of how people act, feel, and think at the present time and across situations (McCrae & Costa, 2003; Robins & Donnellan, 2010). A popular model in personality research distinguishes between five dimensions or factors (the so-called Big-5): agreeableness, conscientiousness, extraversion, neuroticism, and openness to new experiences (Digman, 1990).
Human values are typically defined as abstract ideals or guiding principle of our lives (Fischer, 2017b; Maio, 2016; Schwartz, 1992). The most popular model of human values in psychological research was proposed originally by Schwartz and Bilsky (1987) and has since been refined (Schwartz, 1992, 2006; Schwartz et al., 2012). On an individual level, the most often cited version of the model distinguishes between 10 value types, each of which consists of several value items (Schwartz, 1992). The value types are order along a motivational continuum in a quasi-circumplex: universalism, benevolence, tradition, conformity, security, power, achievement, hedonism, stimulation, and self-direction (Figure 1, left panel). The ordering of values based on their underlying motives leads to some intriguing predictions: If a value type is positively associated with an external variable (e.g., tradition with religiosity; Saroglou et al., 2004) then the strength of association is predicted to decrease and be lowest at the opposing end of the circle (for religiosity: stimulation and hedonism). Schwartz’s (1992) ten value type model of human values (left) and Schwartz’s (2006) model of cultural value orientation (right).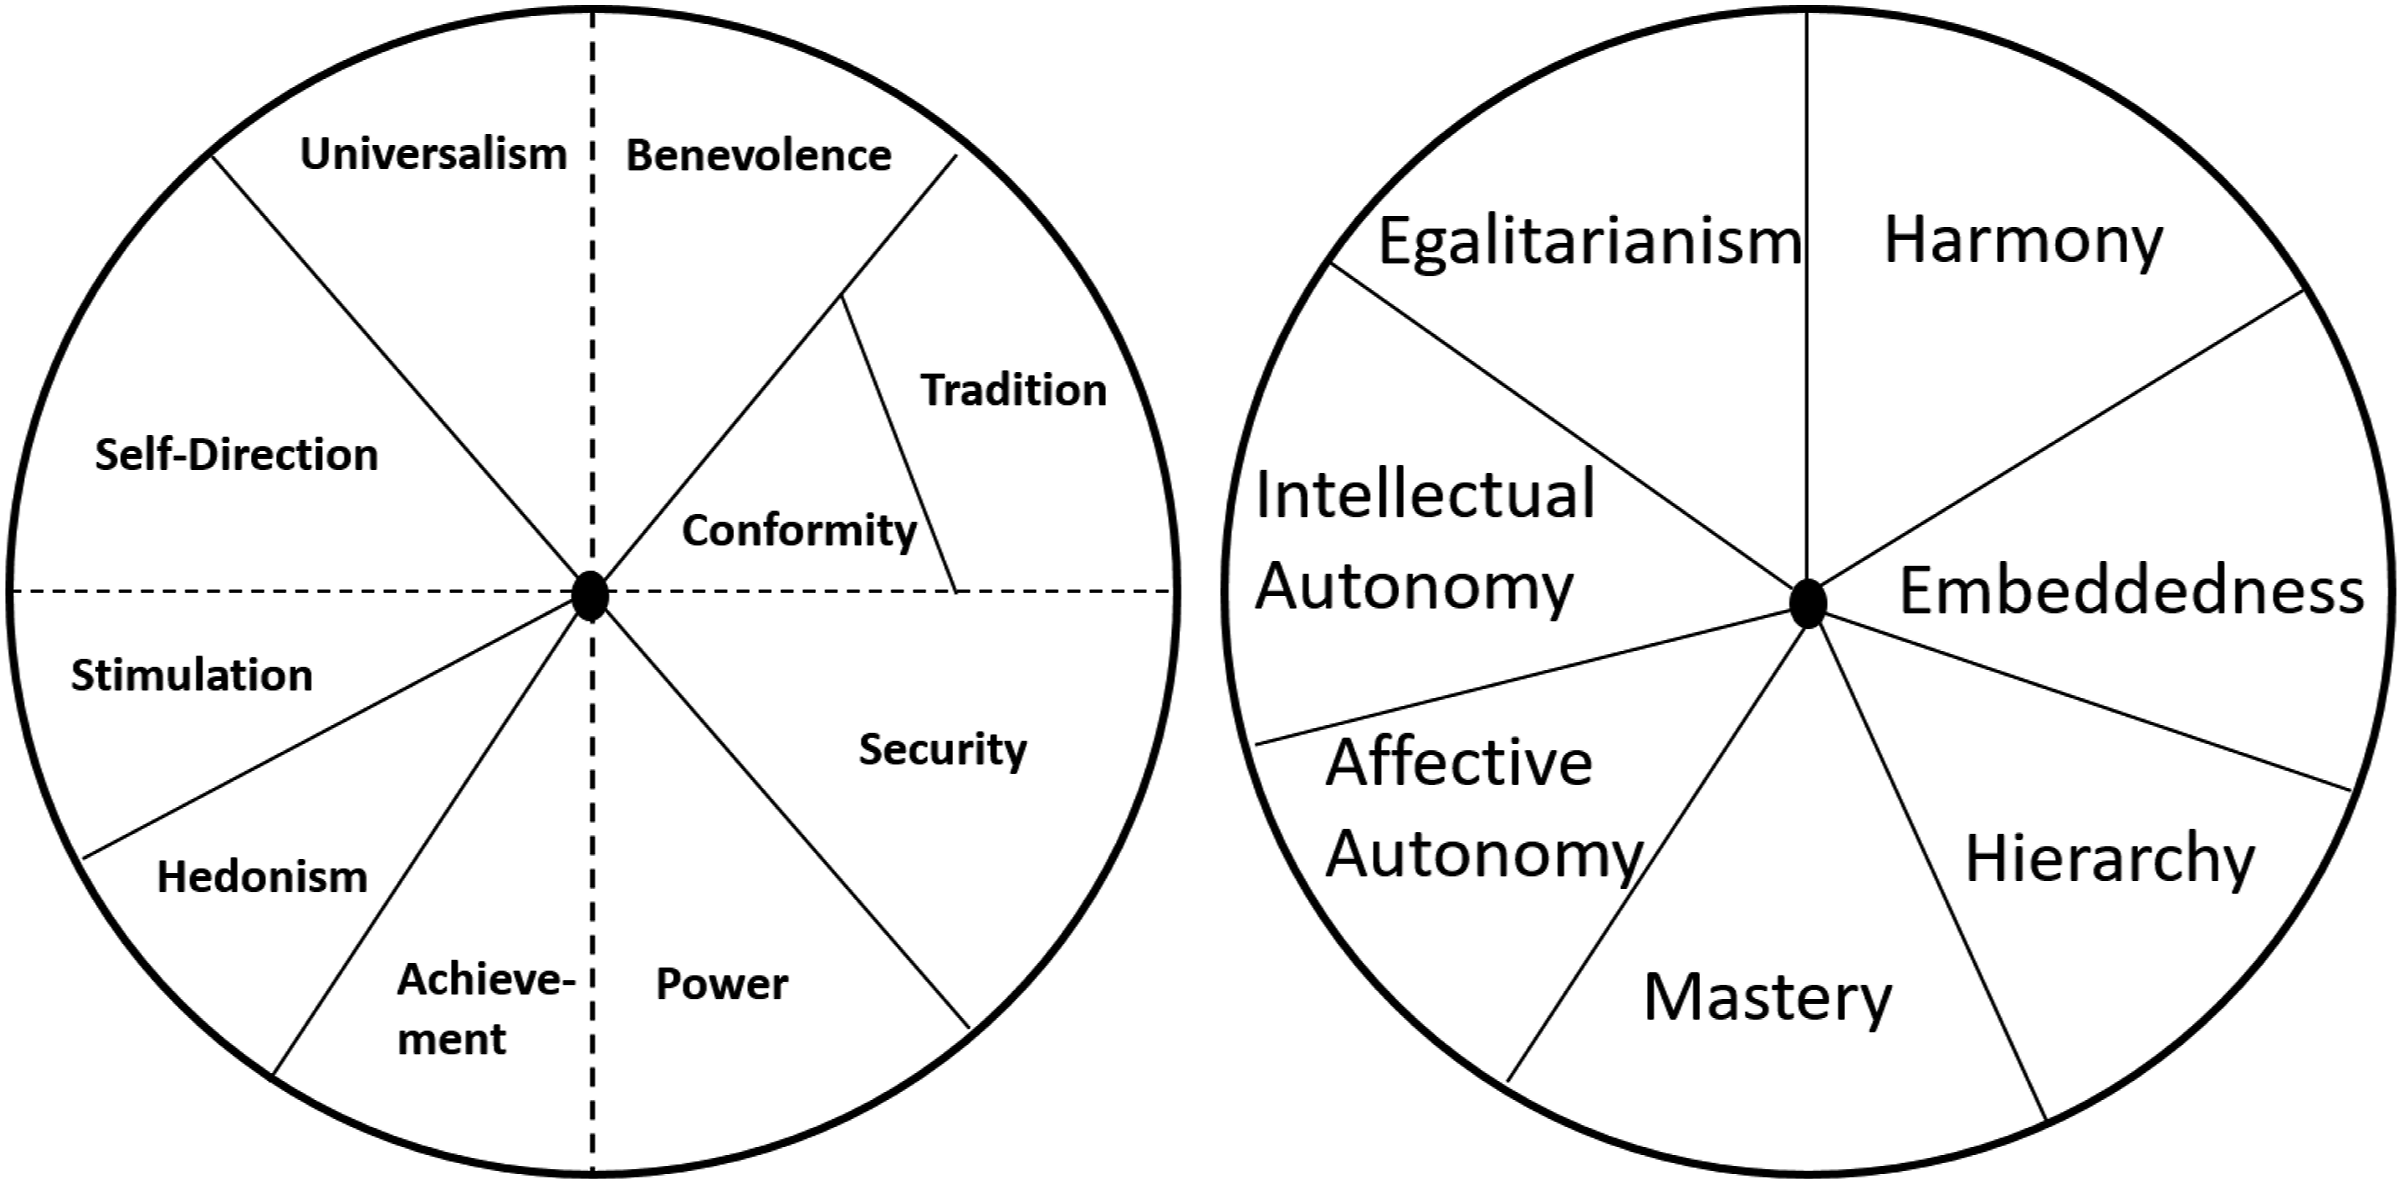
On a country level, however, Schwartz (2006) proposed a different grouping of the values into seven cultural value orientations, to better capture cross-cultural differences. The orientations are egalitarianism (e.g., equality and social justice), harmony (e.g., protecting the environment and world at peace), embeddedness (e.g., obedience and security), hierarchy (e.g., authority and wealth), mastery (e.g., ambitious and independent), affective autonomy (pleasure and exciting life), and intellectual autonomy (e.g., broadmindedness, freedom; Figure 1, right panel). The seven cultural value orientations are ordered along the same motivational continuum and thus allow making the same prediction regarding motivational compatibility.
Associations of Traits and Values with Healthy Behavior
Overview of Selected Past Studies. Letters in Brackets Refer to Empirical Studies (See Note Below Table).
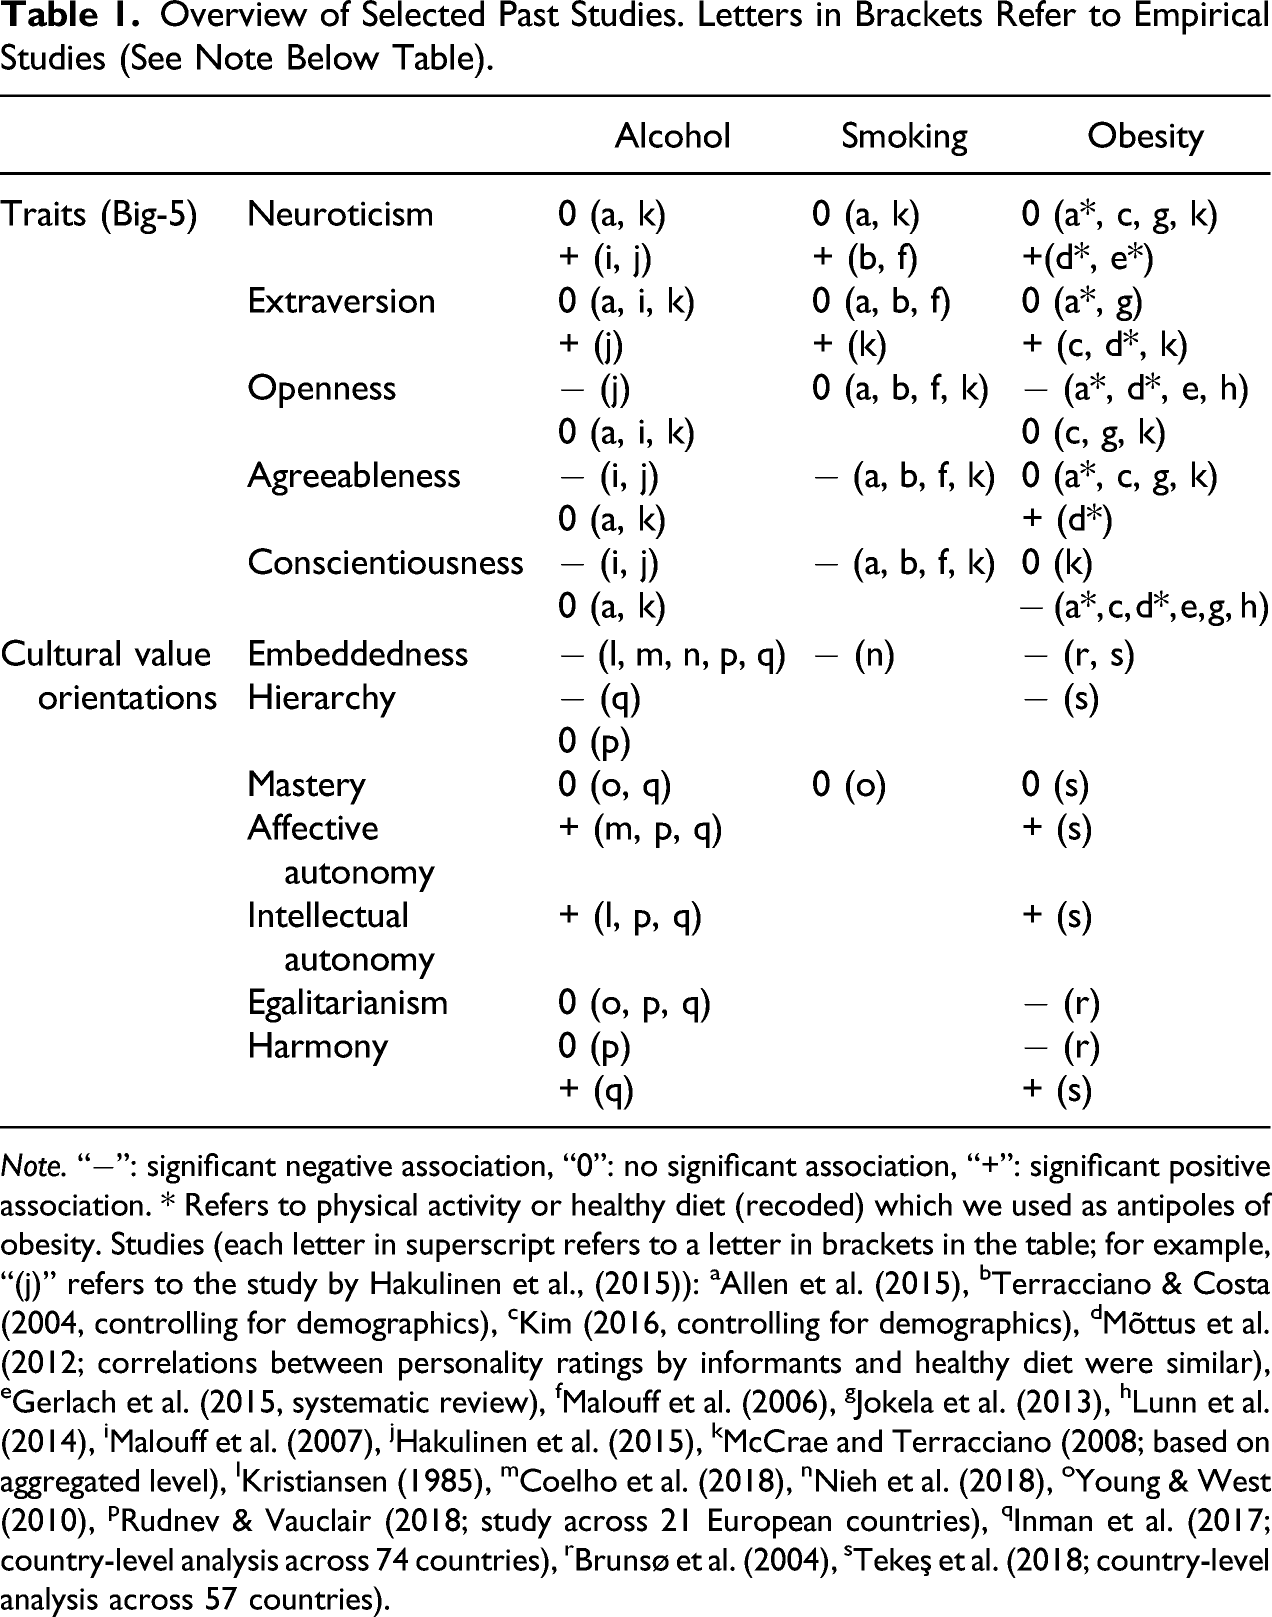
Note. “−”: significant negative association, “0”: no significant association, “+”: significant positive association. * Refers to physical activity or healthy diet (recoded) which we used as antipoles of obesity. Studies (each letter in superscript refers to a letter in brackets in the table; for example, “(j)” refers to the study by Hakulinen et al., (2015)): aAllen et al. (2015), bTerracciano & Costa (2004, controlling for demographics), cKim (2016, controlling for demographics), dMõttus et al. (2012; correlations between personality ratings by informants and healthy diet were similar), eGerlach et al. (2015, systematic review), fMalouff et al. (2006), gJokela et al. (2013), hLunn et al. (2014), iMalouff et al. (2007), jHakulinen et al. (2015), kMcCrae and Terracciano (2008; based on aggregated level), lKristiansen (1985), mCoelho et al. (2018), nNieh et al. (2018), oYoung & West (2010), pRudnev & Vauclair (2018; study across 21 European countries), qInman et al. (2017; country-level analysis across 74 countries), rBrunsø et al. (2004), sTekeş et al. (2018; country-level analysis across 57 countries).
Based on the findings from an individual level, we expect to find alcohol, smoking, and obesity to be positively associated with autonomy and negatively with embeddedness, using country-level data. In other words, we do not expect that the ecological fallacy is an issue because the few studies that investigated aggregated data mainly replicated individual-level findings. Nevertheless, it is important to explicitly test it because differences might be theoretically interesting.
The Present Research
This paper contributes to the literature in at least four ways. First, it investigates the relations between aggregate personality and cultural values with highly reliable measures of risky health behaviors and thus addresses calls to focus more strongly on correlates of psychological constructs with real behaviors (Baumeister et al., 2007; Fischer, 2017a). Simultaneously, focusing on real behavior also allows to make stronger recommendations for global health organizations. Few studies have investigated the psychological predictors of actual risky health behaviors on an aggregated level. In contrast to individual-level data, aggregated data is much more reliable than individual level data because it is more stable, with the stability increasing with the number of data points (i.e., sample size). In the present study, we use average scores based on data from tens of thousands of participants who completed trait and value measures, and millions of data points for the risky health behaviors, making our data very stable. Second, by relying on data from countries of all inhabited continents, we reduce on over reliance on “Western” samples, as findings based on such samples do not necessarily replicate (Henrich et al., 2010; Moreira 2019).
Third, our approach allows us to compare whether aggregate personality or cultural values better predict risky health behaviors. While a range of studies on an individual level has tested whether personality traits or values predict a range of outcomes such as positive affect, religiosity, or leadership aspiration (Lechner et al., 2018; Roccas et al., 2002), the unique influence of personality traits over values and vice versa has neither been investigated for risky health behaviors nor on a cultural level. Testing which of the two sets of constructs explains more variance in risky health behaviors is theoretically interesting because traits and values are often considered as very similar because they are interrelated (Parks-Leduc et al., 2014), although they are differently defined and measured (cf. Hanel & Maio, 2020). As noted above, traits describe cross-situational consistency in action, whereas values are abstract ideals that people hold up as important guides for behavior (Fischer, 2017b; Maio, 2016). Specifically, we expect that traits predict better than values obesity because obesity mainly reflects past and present behavior (values predict stronger future than present behavior intentions; Eyal et al., 2009). In contrast, we expect values to better predict smoking and alcohol consumption than traits because both behaviors are conducted to feel better in the (near) future and have often a social aspect: Previous research found that values are more important for social relationships than traits (Boer et al., 2011) and if people smoke and consume alcohol (also) for social reasons (Berg et al., 2011), values should predict smoking and alcohol consumption better.
Finally, through combining several large global datasets that include data of actual behavior we demonstrate how public data can be used to test theoretical predictions. Findings from such tests may have importance implications for our understanding of risk-factors for risky health behaviors at the country level, and by extension help direct efforts to meet international goals, such as the UN Sustainable Development Goals for 2030.
Materials and Methods
Data Sources
The data for the present study were obtained from a number of different online sources. This is a common approach in the literature that relies on aggregated data (e.g., Inman et al., 2017; McCrae & Terracciano, 2008). In part, this was done to demonstrate the availability of different datasets but mainly to avoid common method bias: Through combining data from different sources that were obtained in different ways (i.e., self-reports vs. actual behavior), any form of response bias that can otherwise drive an effect is eliminated (Podsakoff et al., 2012). Note that the health variables reflect actual behavior, not self-reported behavior. For the purpose of this article, we considered nations/countries as single cultural units. As such, “culture” refers to the average culture measured within a nation. The study was not preregistered and we determined our sample size by using all available data. For consistency, we only included those 50 countries in the analysis for which we had data available for traits, CVOs, health variables, and control variables. All data is in the public domain (see references to the data below).
Cultural value orientations: The national-level average for CVOs (obtained by Schwartz between 1988 and 2000; Schwartz, 2006) across a range of different cultures have been made openly available by Schwartz (2008). Where data from different regions within one country were presented (e.g., East and West Germany), we averaged them.
Aggregate personality: In accordance with previous research (Fischer et al., 2018), country-level variation in personality traits was assessed by obtaining country-level averages of Big-5 traits from various datasets (McCrae, 2001; Schmitt et al., 2007), who reported standardized T-scores using US-norms (i.e., M = 50, SD = 10). We computed the weighted mean when data within one country was divided (e.g., East and West Germany). Traits and values were both measured using self-reports, as these are much more common (as opposed to informant ratings, for example).
Health variables: For consistency, we obtained estimates of smoking, alcohol consumption and obesity from the same year (2015). It is noteworthy that the estimates for CVOs and B5-traits were not collected in this year. However, because our predictors and outcome variables are highly stable across years (Sortheix, 2017; see also Inman et al., 2017), combining them into one dataset is justified.
We obtained our estimates of national smoking prevalence (percentage of men and women aged 15+ who currently smoke any tobacco product on a daily or non-daily basis, age-standardized) from the World Bank Open Data set (The World Bank Group [WBG], 2016; https://data.worldbank.org/indicator/SH.PRV.SMOK). For a large proportion of countries, these estimates are available for the years 2000, 2005, and all years between 2010 and 2016. In two instances, in which data points were not available in the World Bank Open Data set, values were obtained from the World Health Organization (WHO) Global Health Observatory data repository (https://www.who.int/gho/en/).
Estimates of national obesity prevalence (percentage of men and women aged 20+ with a BMI ≥ 30 kg/m2) were obtained online from the NCD Risk Factor Collaboration (NCD-RisC) website (www.ncdrisc.org). Full information about this data source is presented in NCD-RisC (2017). For most countries, estimates of obesity are available for all years 1975 and 2016.
Estimates of total alcohol consumption per capita (15+ years; liters of pure alcohol per year) were retrieved from the WHO Global Health Observatory data repository. In this repository, estimates of alcohol consumption are available for all years for the total adult population (males and females).
Control variables: Human Development Index values for 2015 (HDI; which captures the dimensions of health [life expectancy at birth], education [years of schooling] and standard of living [GNI per capita]) were obtained from the United Nations Developmental Programme website (http://hdr.undp.org/en/data). An indicator of religiousness for each country was obtained from a report based on a Gallup Poll Survey conducted in 2009 (Crabtree, 2010). According to this report, approximately 1000 adults in each country were asked “Is religion an important part of your daily life?”. Data is coded as the percentage of yes responses. We included these control variables because they are all meaningfully correlated with traits, values, and the outcome variables (e.g., Inman et al., 2017; Ng, 2015; Riahi et al., 2018; Ruck et al., 2018; Saroglou, 2002; Saroglou et al., 2004).
Statistical Analysis
Partial Correlations: First, we performed partial correlations between predictor and outcome variables while controlling for HDI and religiosity.
Ridge Regression: We knew that the number of independent variables in our multivariate linear models would be large considering the relatively small sample size. In such instances, standard regression estimators can yield unstable coefficient estimates and inflated SEs (Bühlmann & Van De Geer, 2011). Moreover, because of the nature of the circumplex model for cultural values, we anticipated significant multicollinearity in the data. Indeed, in a linear regression model including both CVOs and B5-traits the highest VIF was 16.27 (embeddedness), indicating severe multicollinearity. To address these issues, we used linear ridge regression. Ridge regression uses a shrinkage constant (k) to make regression coefficients more stable (Ryan, 2008). One side effect of this parameter is that estimates of effect size are conservative (Draper & Smith, 1988). Research has shown ridge regression is effective in cases of high dimensional multivariate data (Finch & Hernandez Finch, 2017). Note that it was not possible to perform multilevel analysis because we only had data available from one level (i.e., country level).
For each of the three health behaviors, we tested the unique influence of aggregate personality traits over values and vice versa using a hierarchical regression approach. For each behavior, we tested three ridge regression models: Model 1 (CVOs only), Model 2 (B5-traits only), and Model 3 (CVOs + B5-traits). Each model results in an r2 value that describes variance in the outcome variable explained by the predictors. Change in r2 (Δr2) between Model 3 and Model 1 describes the unique influence of B5-traits over values. Δr2 between Model 3 and Model 2 described the unique influence of values over B5-traits.
As noted above, data on a country level is more reliable because each data point (e.g., extraversion for a specific country) consists of thousands or even millions (for alcohol consumption) of data points. Thus, using a statistical procedure that was developed for much less reliable data such as null hypothesis significance testing is a very conservative approach and may result in many type-II errors.
Results
Sample Characteristics
The study sample comprised 50 countries. Based on WHO defined geographical regions, our sample comprised 27 countries from Europe (e.g., Austria), 9 countries from the Americas (e.g., Argentina), 6 countries from the West Pacific region (e.g., New Zealand), 3 countries from Africa (e.g., Ethiopia), 1 country from the East Mediterranean region (Jordan), and 4 countries from the South East Asia region (e.g., South Korea). Across countries, HDI ranged from .451 to .948. Thus, according to the 2014 Human Development Report, our sample captured all categories of human development from low human development (HDI <.550) and very high human development (HDI >.800). Countries ranged from mostly believing religion is unimportant (16%; Estonia) to being almost entirely religious (99%; Indonesia). Countries were located in a wide range of latitudes from very North (Finland) to very south (New Zealand), including equatorial countries (Peru, Indonesia, and Malaysia).
Zero-Order Correlations Between All the Dependent Variables, CVOs, Personality Traits, and Control Variables.
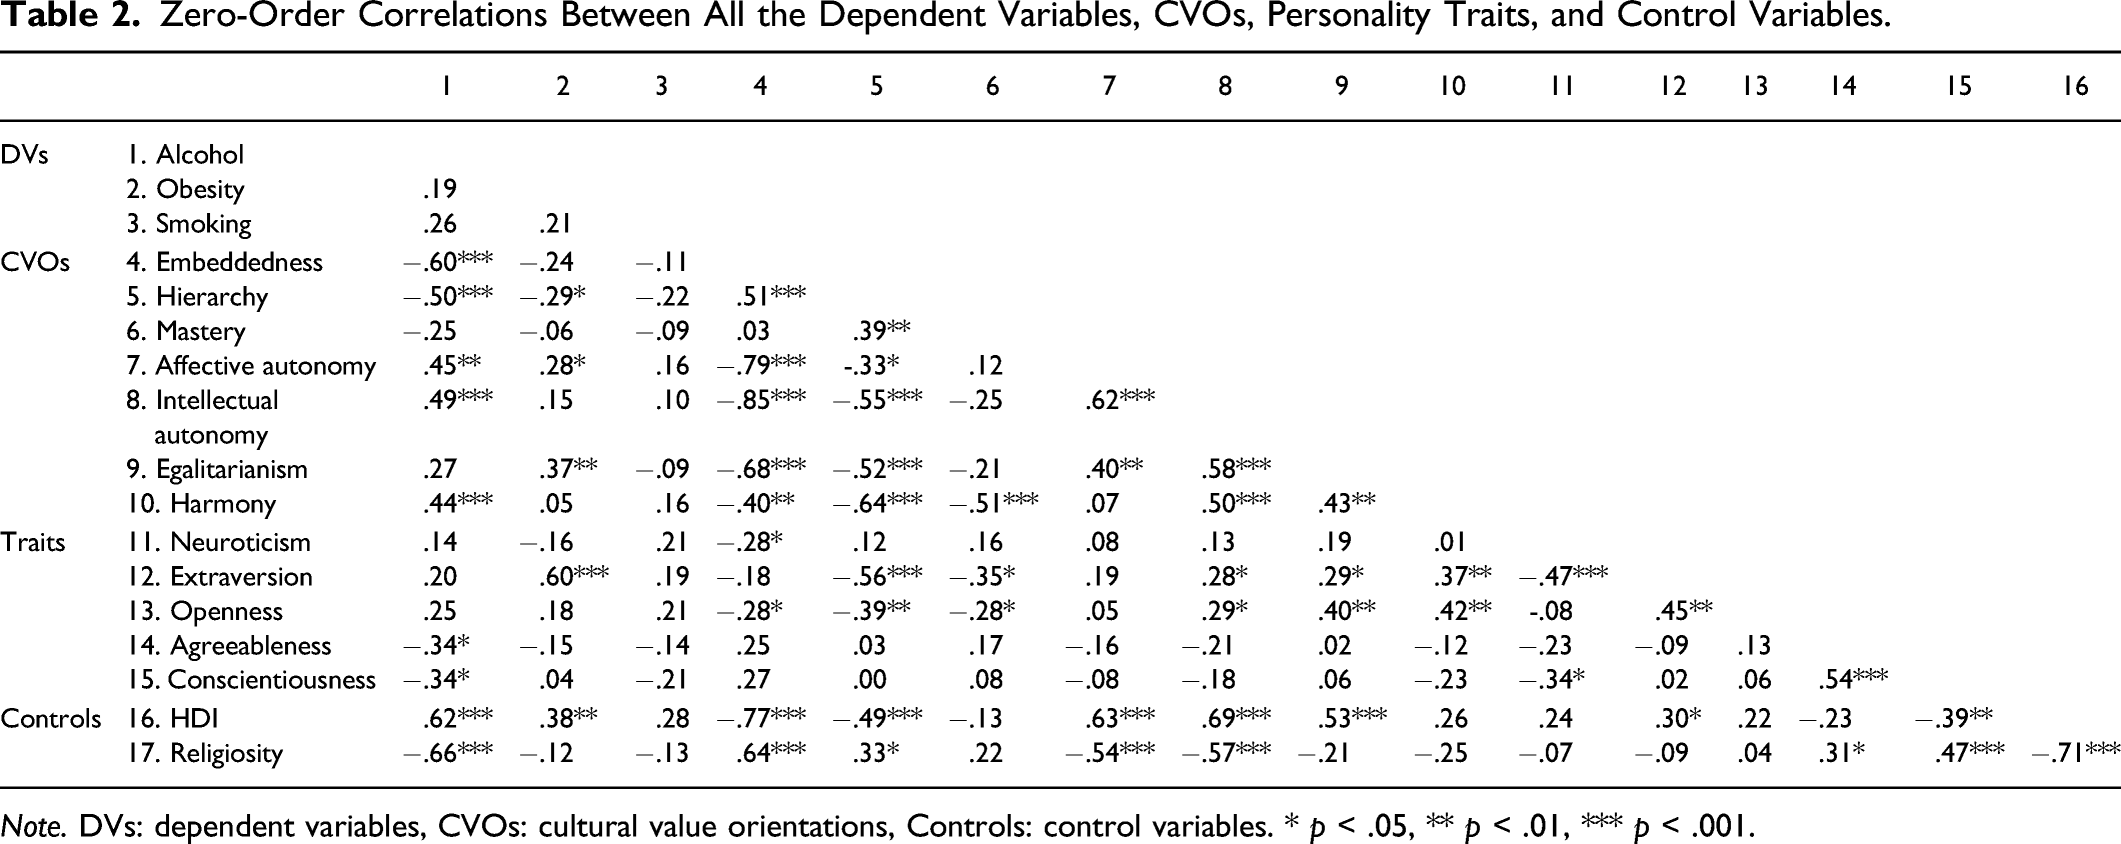
Note. DVs: dependent variables, CVOs: cultural value orientations, Controls: control variables. * p < .05, ** p < .01, *** p < .001.
Partial Correlations
Partial Correlations Between Alcohol Consumption, Obesity, Smoking, and CVOS After Controlling for HDI and Religiousness.
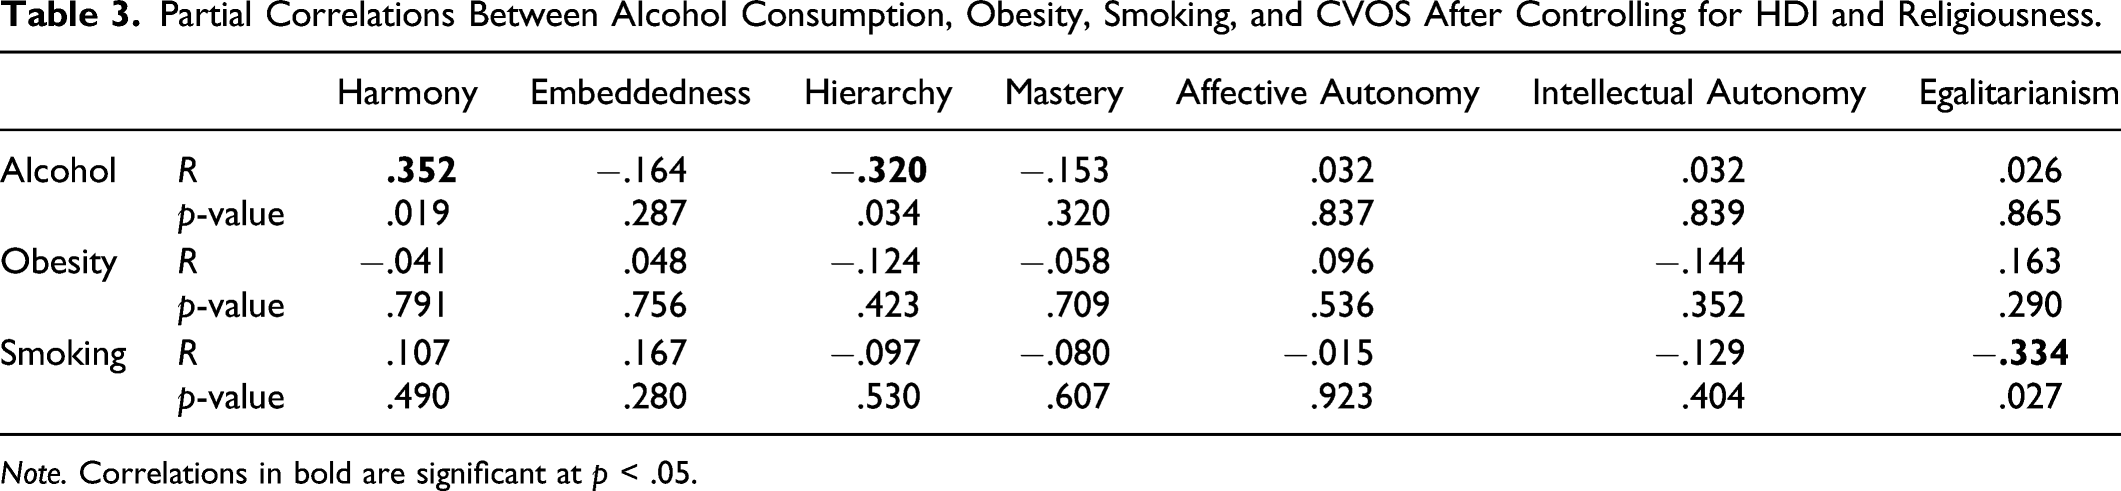
Note. Correlations in bold are significant at p < .05.
Partial Correlations Between Alcohol Consumption, Obesity, Smoking, and Aggregate B5 Personality Dimensions After Controlling for HDI and Religiousness.
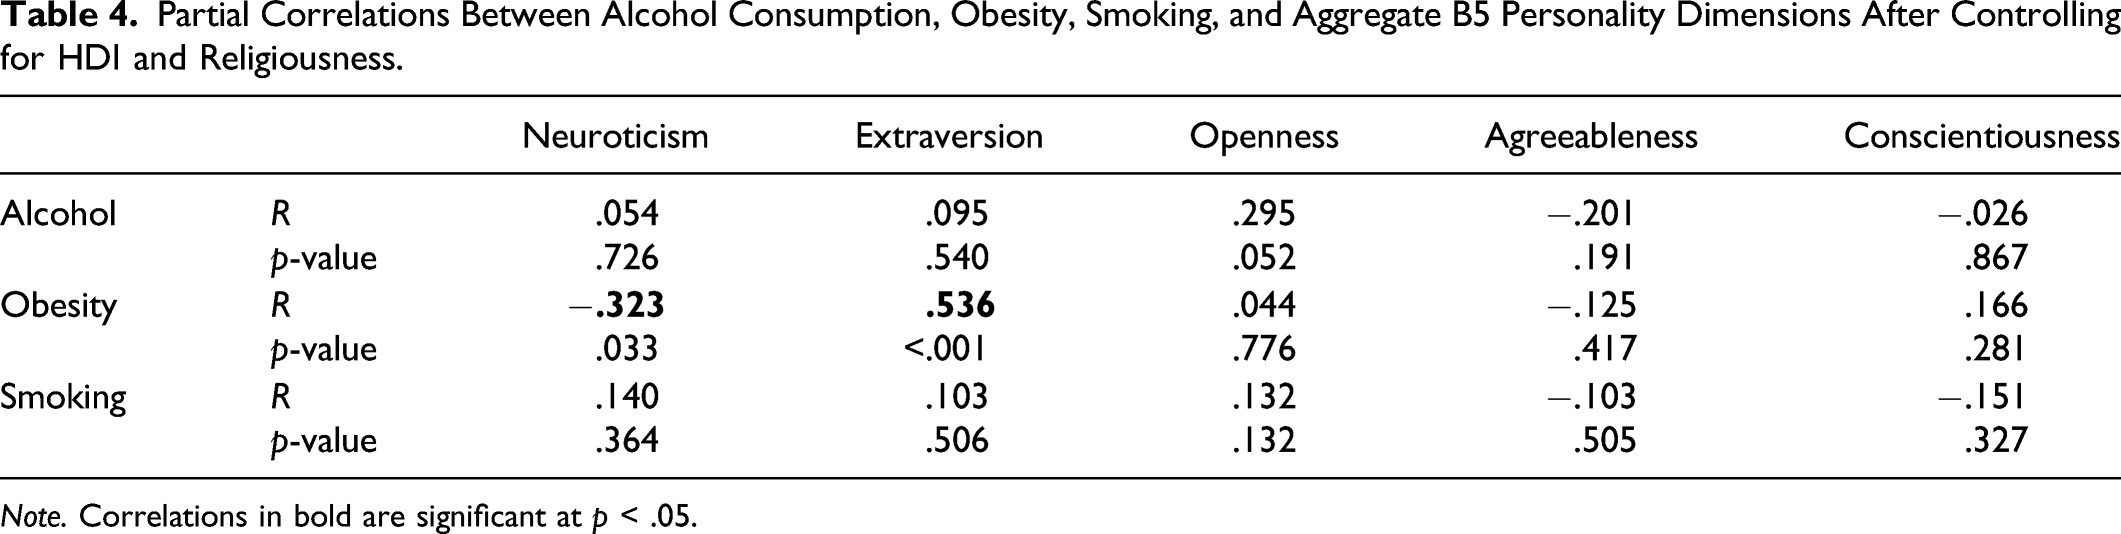
Note. Correlations in bold are significant at p < .05.
Ridge Regressions
Ridge Regression Model Summaries and r2 Change Statistics.
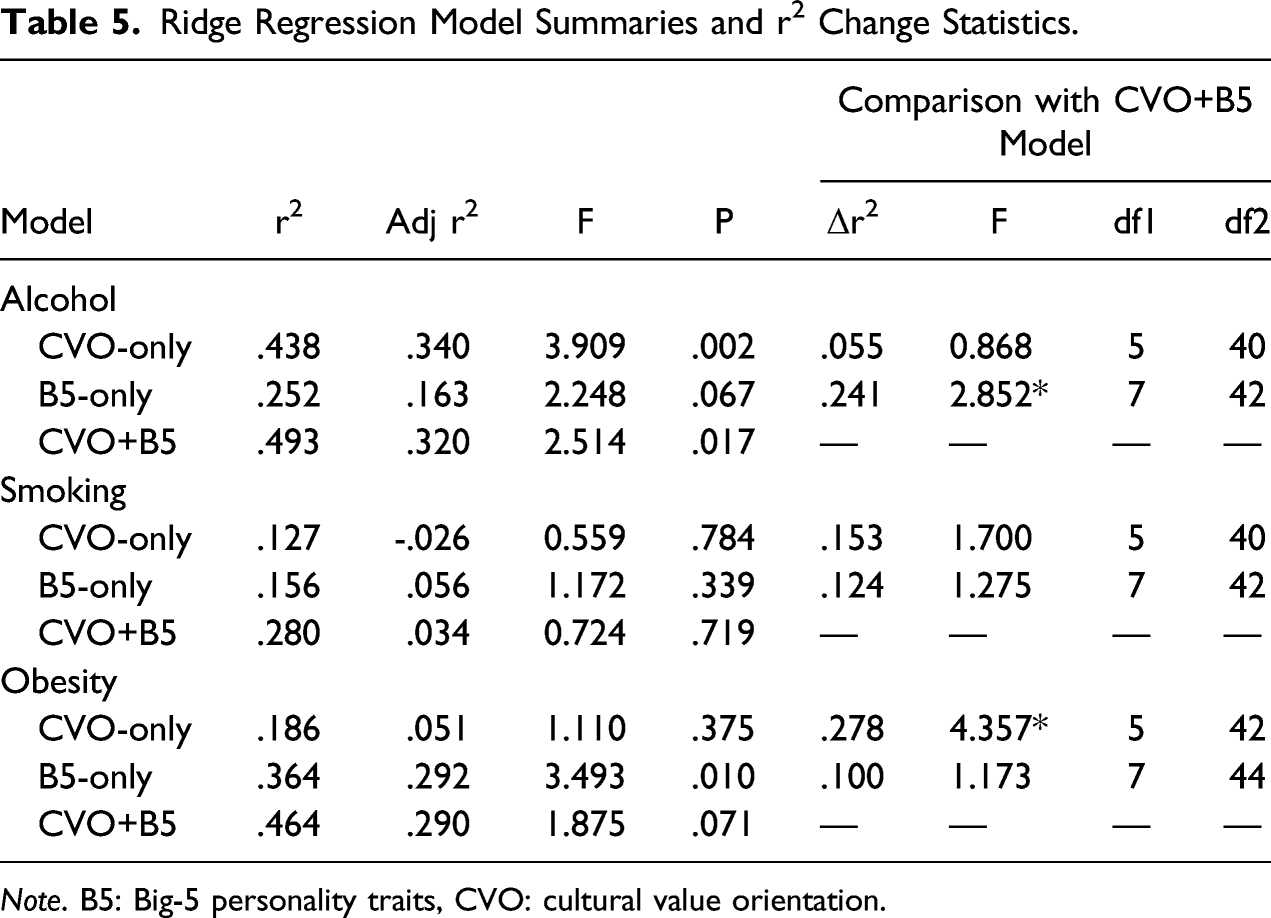
Note. B5: Big-5 personality traits, CVO: cultural value orientation.
Beta Coefficients for the Suitable Models for Alcohol and Obesity.
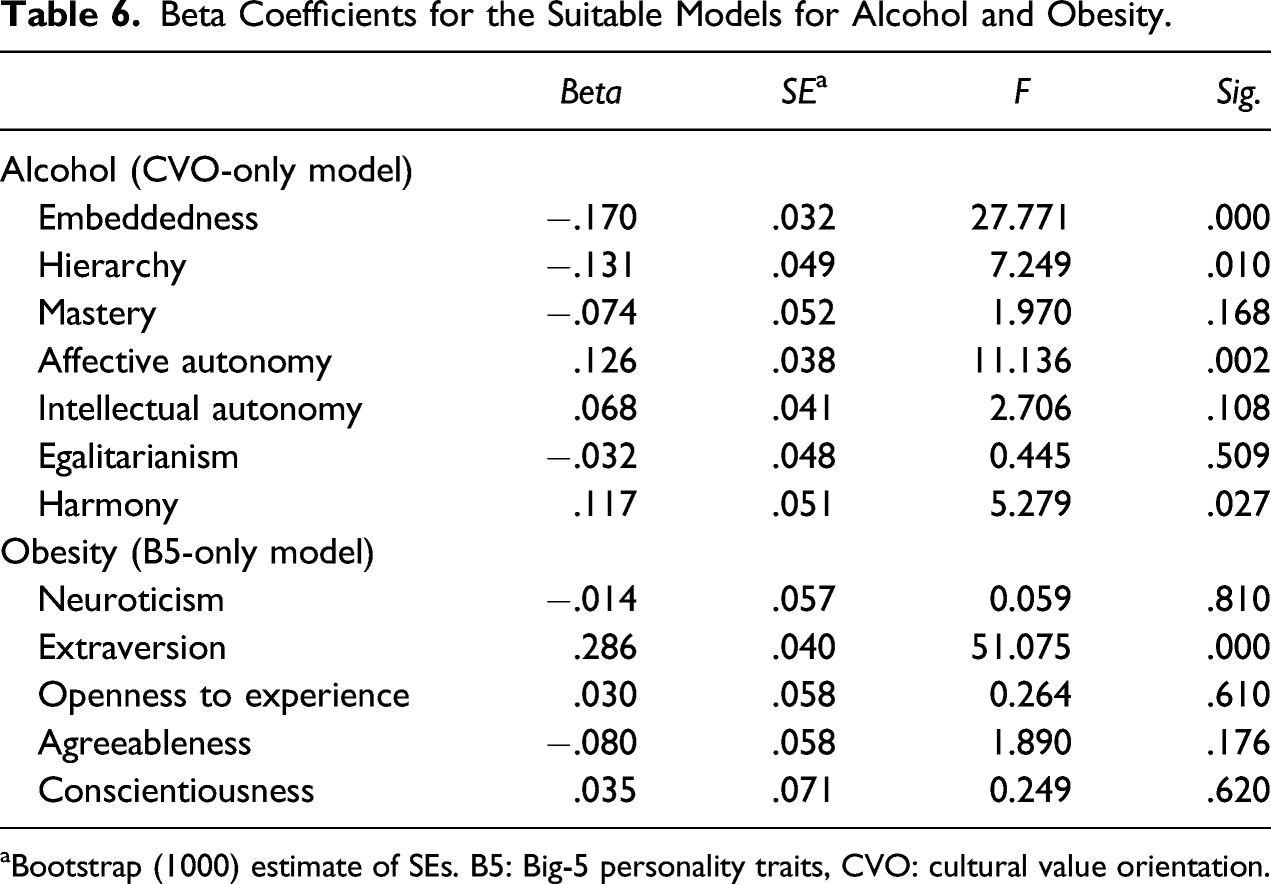
aBootstrap (1000) estimate of SEs. B5: Big-5 personality traits, CVO: cultural value orientation.
Discussion
Few studies have investigated the psychological predictors of risky health behaviors at an aggregated country level. The present study addressed this gap in the literature by obtaining reliable estimates of health and psychological variables from big publicly available datasets comprising millions of individuals, and using them to test theoretical predictions.
How Do Country-Level Values and Traits Relate to Risky Health Behaviors?
Cultural values: A recent study using similar datasets has demonstrated that cultural values show a particular pattern of association with alcohol consumption across countries (Inman et al., 2017). Specifically, alcohol consumption was greater in countries that value harmony and autonomy, and lower in countries that value embeddedness and hierarchy. Given that the present study used the same data for cultural values, it was unsurprising that the partial correlations in the present study replicated those of Inman et al. Specifically, significant correlations were observed for harmony (positive) and embeddedness (negative), although the effect sizes were small.
Beyond alcohol, the present study was interested in how values would be associated with smoking and obesity. The pattern of partial correlations for these health indicators suggested some similarity with alcohol consumption. For example, the direction of the associations between alcohol, smoking, and obesity were the same for hierarchy (negative) and mastery (negative). There were, however, some clear differences. Alcohol and smoking were positively correlated with harmony, but obesity appeared to be unrelated. Inman et al. (2017) explained that harmony may be positively correlated to alcohol consumption at the country level because cultures high in harmony regulate how their members relate to the social world via an emphasis on appreciation and “fitting in” (Schwartz, 2006). Such an emphasis may promote “having a good time” as a social motive and thus encourage individuals to engage in risky social behaviors such as drinking, smoking, and illicit drug use. In contrast, obesity may be unrelated to harmony values as its associated risky behaviors are less social in nature.
A second finding was that hierarchy was negatively associated with alcohol consumption. On the other hand, obesity appeared unrelated to embeddedness, and smoking had a positive correlation. Cultures that value hierarchy emphasize responsible behavior in line with rules assigned to their respective roles (Schwartz, 2006). Alcohol has long been considered a threat to public order (Mold, 2018), and contemporary evidence links alcohol consumption to socially undesirable behaviors and health problems (World Health Organization, 2014), both of which are threatening hierarchies. Smoking and obesity, on the other hand, are not linked to disinhibited social behaviors in the same manner as alcohol (e.g., intoxicated behavior) and thus may not be considered as threatening to authorities.
Finally, egalitarianism had a significant negative association with smoking but was unrelated to alcohol, and obesity. This can be understood by considering that egalitarian cultures socialize their populations to feel concern for everyone’s welfare and to act for the benefit of others (Schwartz, 2006). Smoking may be negatively related to egalitarianism because it is a behavior that presents a risk to others, via secondhand smoke, as well as the individual. Indeed, there are a wide range of risks associated with passive smoking including heart disease, stroke and cancer (U.S. Department of Health and Human Services, 2006), and studies within individual countries, such as the U.S.A, have shown that a large proportion of people perceive secondhand smoke as being harmful (Kruger et al., 2016). In short, egalitarian populations may be less likely to smoke because their members try and act in a manner that does not risk the health of others.
Big-5 traits: The study expands on Inman et al. (2017), Mackenbach (2014) and others by also considering country-level aggregates of personality traits. Firstly, it was evident that neither alcohol consumption nor smoking was linked to aggregate personality. Partial correlations did, however, hint that countries with high aggregated scores for openness to new experiences had increased alcohol consumption (although this correlation fell short of being statistically significant, p = .052).
Unlike smoking and alcohol, obesity did present a clear pattern of associations with aggregate personality traits. Specifically, obesity had a strong positive association with extraversion, and a moderate negative association with neuroticism. These findings add to a growing body of evidence that links extraversion to obesity at a country level (McCrae & Terracciano, 2008) and concur with those of several studies that have linked extraversion to increased BMI (Armon et al., 2013; Kakizaki et al., 2008). A clear question that emerges from these results is: why is a personality trait linked to descriptors such as “outgoing” and “energetic” linked to increased obesity? Indeed, some studies at the individual level have linked extraversion to healthier eating habits (Mõttus et al., 2012). To account for this, some authors have argued that the positive mood state linked to high extraversion leads individuals to perceive themselves as less vulnerable to negative health conditions and thus to engage in behaviors, such as overeating, that can lead to obesity (Grant & Schwartz, 2011).
Interestingly, our findings only partly replicate those on an individual level. For example, we found that harmony is positively associated with alcohol consumption, whereas Rudnev & Vauclair (2018) have not found a significant relation on an individual level; we found no association between conscientiousness and obesity, whereas a range of other studies found a negative association (e.g., Allen et al., 2015; Gerlach et al., 2015; Kim, 2016; cf. Table 1); we found a positive association between obesity and extraversion which is in line with the literature (e.g., Kim, 2016; Mõttus et al., 2012); however, we also found a negative association between neuroticism and obesity, whereas other studies either found no or positive associations (Kim, 2016; Mõttus et al., 2012).
We do not perceive a significant finding to be conflicting with a non-significant one because effect sizes can vary across studies: Assuming a statistical power of <1 (in many cases, the power is clearly below <.80; Brysbaert, 2019), a mix of significant and non-significant findings is expected (Lakens & Etz, 2017). Thus, our findings were mostly in line with the literature. However, the negative association between neuroticism and obesity requires further explanation because some previous research found positive associations between obesity and neuroticism (whereas some others found no association, cf. Table 1). This might indicate to an ecological fallacy: The pattern of association is reversed on the aggregated level as opposed to an individual level. Alternatively, neuroticism might have a different meaning on a country level than on an individual level. The effects of a neurotic person might be different than those of a neurotic large group of people (here: country). Future research is needed to explore this possibility. Importantly, since our findings are overall consistent with the literature, it is unlikely that the ecological fallacy is an issue.
Which Is a Better Predictor of Country-Level Risky Health Behaviors: Values or Traits?
The present study tested theoretical predictions regarding the relative importance of value and traits for understanding risky health behaviors. Our finding was that values and traits were differentially important for different behaviors. In line with our predictions, cultural values were a better predictor of alcohol consumption than traits. Alcohol consumption has always been rooted in a social context and in many societies (excluding “abstinent” societies that expressly forbid alcohol consumption for religious reasons; Room & Mäkelä, 2000) alcohol consumption is a common occurrence at social events (Galea et al., 2004). In other words, drinking alcohol is a social behavior. Because values are more important for guiding social interactions than traits (Boer et al., 2011), they were also the better predictors.
Also in line with our predictions, B5-traits were a better predictor of obesity than cultural values. Obesity can be a result of by poor eating habits and a lack of physical exercise (Prentice & Jebb, 1995). In other words, it is caused by behavior that lies in the past. Thus, obesity is conceptually closer to traits, which measure how a person is in the present (Saucier, 1994), in contrast to values, which are better able to capture future behavior (Eyal et al., 2009).
Finally, the results did not support our third hypothesis that values explain variance beyond traits in smoking. Initially, we predicted that values would be better at explaining smoking than traits because values are more relevant for social interactions (Boer et al., 2011). However, in retrospect, we believe that smoking might have a weaker social component than alcohol consumption. Indeed, the number of cigarettes daily smokers consume on average per hour varies little between 10 a.m. and midnight (Shiffman et al., 2014). If smoking was mostly social, it would be higher in the late afternoons and evenings when people are more likely to be in social situations. Note however that our data does not allow us to distinguish between social smokers and “full-time” smokers. We assume that values are better predictors for social smokers, a prediction that can be investigated by future research.
Limitations
One potential limitation pertains to differences in sample types across the measures. While smoking, obesity, and alcohol consumption were based on official representative data, not all of our traits and values data was based on representative samples. However, the value importance and structure remains mainly the same across sample types such as representative, student, or teacher samples (Hanel et al., 2018; Schwartz & Bardi, 2001), indicating that the sample type barely matters.
Another possible limitation pertains to the sample size of only 50 countries. However, the term “sample size” is misleading here: The numerical value of each country for each variable consists of hundreds to thousands of participants (traits and values) or even millions (smoking, obesity, and alcohol consumption), making our analysis very robust. Moreover, a sample of 50 countries is more representative of the total “population” of around 200 countries than, for example, a sample of even 1,000,000 Americans to the total US population of around 300, 000, 000. Finally, with 50 countries, we included more countries than many previous studies which often included 20–30 countries (see Introduction, for example). It is important to acknowledge, however, that countries from geographical regions other than Europe, and particularly the East Mediterranean and Africa regions, were underrepresented in our sample.
Finally, the trait data we used were measured with two different questionnaires, the NEO-PI-R (McCrae, 2001) and the BFI (Schmitt et al., 2007), which show on a country level relatively low convergence, rs ≤ .45 (Schmitt et al., 2007). However, both trait measures are reliable and valid, which makes it unlikely that the combination of trait measures impacted the results.
Implications
A current UN goal for sustainable development by 2030 includes ensuring healthy lives and well-being for all at all ages (United Nations General, 2015). This includes specifically, reducing by one-third premature mortality from noncommunicable diseases through prevention and treatment and promoting well-being. This study adds to a growing body of research that suggests information about cultural-level psychological characteristics, including dimensions and profiles of cultural values and aggregate personality, may be useful for informing policies and interventions aimed at meeting these goals. Campaigns promoting healthy behaviors, for example, may be differentially effective across populations with distinct cultural values or personality characteristics. Future research is, however, required to further understand the causal mechanisms between country-level psychological characteristics and risky health behaviors.
Many publicly available datasets, and particularly those including health-related variables, have data for most countries. Unfortunately, datasets including national indices of psychological variables typically have smaller samples. Moreover, while national health indicators are abundant and easily accessible, it is currently more difficult to find and obtain national indices of psychological variables. The present study demonstrates that public datasets can be useful to researchers who wish to test theoretical predictions about country-level psychological characteristics and their relations to indicators of health or well-being. Given that such research findings may have important implications for meeting international goals for sustainable development (e.g., the 2030 Agenda for Sustainable Development), a clear implication of our study is that an effort is required to construct public datasets that outline the psychological characteristics of all countries globally.
Footnotes
Author contributions
Conceptualization: PH SS RI; data curation: PH RI; formal analysis: RI; funding acquisition: NA; methodology: PH RI; validation: PH SS RI; visualization: PH RI; writing—original draft: PH SS RI; and writing—review and editing: PH RI.
Declaration of conflicting interests
The author(s) declared no potential conflicts of interest with respect to the research, authorship, and/or publication of this article.
Funding
The author(s) received no financial support for the research, authorship, and/or publication of this article.