
Abstract
Africa is a continent of considerable cultural diversity. This diversity does not necessarily run in parallel to the national boundaries that were created in Africa in the colonial period. However, decades of nation building in Africa must have made their mark. Is it possible nowadays to distinguish national cultures in Africa, or are the traditional ethnolinguistic distinctions more important? This article uses an approach developed in cross-cultural psychology to examine these questions. In 2012, Minkov and Hofstede published an article in this journal analyzing World Values Survey data from seven countries in Sub-Saharan Africa at the level of subnational administrative regions. They argued that national culture is also a meaningful concept in this region. This study reexamines the matter. It uses an innovative approach, looking at ethnolinguistic groups instead of at administrative regions and using the much more extensive Afrobarometer survey data set. It finds that although the Minkov/Hofstede study still has merit, the picture is more nuanced in several important ways. There is not one pattern that adequately describes the situation in the whole of Africa.1
Introduction
Knowledge about cultures and cultural differences is relevant from various points of view. The intercultural management literature shows the merit of preparing and training people for management roles in transnational corporations and other transnational settings (Samovar, Porter, & McDaniel, 2012). In international business, the literature on cultural distance (as reviewed, for example, in Drogendijk and Slangen 2006) uses information on cultural differences for explaining how multinational companies reach investment decisions. The literature on ethnic fragmentation (Michalopoulos & Papaioannou, 2016) uses data on ethnic differences to demonstrate a relationship between ethnic fragmentation and economic development as well as investment decisions. For Africa, however, there is a scarcity of data to work on. Generalizations are rife, and much of the knowledge dates back to unreliable and outdated sources from the colonial period. This study seeks to partially fill that gap.
It is common knowledge that the current nation states in Africa were formed by the colonial powers with little regard for the linguistic or cultural characteristics of Africans. This led to the splitting up of previously integrated economic, linguistic, and/or cultural units (Adebajo, 2010; Asiwaju, 1985) and to the loss of cultural autonomy (Vansina, 1990). It is clear that the massive change and upheaval in Africa in the colonial and postcolonial periods must have had its influence on African cultures. But how to describe and assess these effects? Have national cultures formed, based on the currently existing nation states, splitting up previous ethnolinguistic communities and instead creating new, “detribalized” cultural units centered on the nation state? If so, is this a uniform trend across Africa, or is the situation different for different countries and ethnolinguistic groups?
In 2012, Michael Minkov and Geert Hofstede published an article in this journal in which they argued that national culture is a meaningful concept, also in Africa. They developed their argument by using World Values Survey data from 299 in-country regions from 28 countries in East and Southeast Asia, Sub-Saharan Africa, Latin America, and the Anglo world.
Their hypothesis was that if national culture were important, then a cluster analysis by in-country region would lead to regions clustering together on a national basis; if, on the contrary, national culture were not important, then regions would not cluster together to form meaningful national clusters.
For Sub-Saharan Africa, Minkov and Hofstede examined seven countries, together representing 64 administrative regions. They found that 58 of the 64 African regions, or more than 90%, clustered together with the other regions of their nation, forming homogeneous national clusters.
This article starts by discussing the approach chosen by Minkov and Hofstede and its limitations and difficulties. It continues by suggesting an extended and complementary approach, based on ethnolinguistic groups (instead of administrative regions) and on a different, much more comprehensive data set (the Afrobarometer survey). The “Method” section presents how this is done. The study presents the results of a cluster analysis that is based on this alternative approach and contrasts the results with those obtained by Minkov and Hofstede. The article ends with a discussion and some recommendations for further research.
The Minkov/Hofstede Approach, Its Limitations and Difficulties
The basic reasoning used by Minkov and Hofstede is sound: If disaggregated data on subnational units coalesce at the national level, then clearly this national level must have some meaning. However, if disaggregated data does not show coherence at the national level, then the concept of national culture may be an artificial one. Hofstede, Garibaldi de Hilal, Malvezzi, Tanure, and Vinken (2010) have taken a similar approach by looking at the level of individual states in Brazil. There, they find that subnational differences in Brazil aggregate into five regional cultural clusters within Brazil.
However, from the methodological point of view, the approach Minkov and Hofstede have taken is not entirely convincing. My main doubt is about the validity of taking in-country regions as the basic unit of study. Administrative regions have been designated in historical and political processes in ways that are very different from country to country. Administrative regions may or may not conform to cultural or ethnolinguistic areas as they existed in precolonial times. Thus, Minkov and Hofstede use 12 regions for a small and homogeneous country like Rwanda, but five regions for a large and diverse country like Ethiopia. In some countries, regions may be formed in such a way as to split up, rather than unite ethnic groups. In those cases, it should come as no surprise that the regional averages are not very different from the national averages. If Country A has two ethnic groups that are spread equally over two administrative regions, then the score for each region will be the same as the national score, no matter how different the two ethnic groups may be in reality. In some countries, this way of forming regions may have been employed, in others not. This obviously has the potential of hiding real within-country cultural differences from sight.
Minkov and Hofstede find that three out of the 13 regions from Burkina Faso and three out of the nine regions from Zambia do not cluster neatly with the other regions from those countries. This therefore begs the following question: What picture would emerge if more countries were included and if one were to look at the ethnolinguistic level? This is what has been done in this study.
Method
A much larger data set is available on Africa in the Afrobarometer survey. 2 This is a representative survey that has been carried out at regular intervals since 1999. The research in this study is based on Round 6 of the survey, which was implemented in 2014 and 2015. It included 35 African countries, of which 30 are Sub-Saharan.
Using this data set obviously has the advantage of providing a much larger coverage than the seven African countries included in the World Values Survey. The disadvantage is that the Afrobarometer’s primary focus is on attitudes toward democracy and governance, not directly on the values that determine national culture. However, cultural differences “shine through” in just about any batch of questions asked in different countries. Furthermore, as demonstrated by Inglehart and Welzel (2005), political attitudes are related to culture. Therefore, between- and within-country differences in response to Afrobarometer questions also provide insights into cultural differences and similarities.
Using ethnolinguistic group data from the Afrobarometer survey is not entirely straightforward. This is because representativity cannot be assumed at the ethnolinguistic group level. The survey sampling protocol provides for national representativity in terms of gender and age, but not for ethnolinguistic representativity. In practice, in most cases, this problem will not make much difference: either because the answers to the questions are not significantly different for different gender or age groups or, when they are, because corrections in one or the other direction even out. However, cases are thinkable when this operation does make a difference. Hofstede (2001) has demonstrated the importance of matching samples by gender and age. To minimize this problem and to ensure that differences at the ethnolinguistic group level are not artifacts of sampling differences, I have split all ethnolinguistic group samples into four subgroups: men below 30 years, men 30 years and above, women below 30 years, and women 30 years and above. I have weighed the data from each subgroup in such a way that the averages correspond to the national average in the sample. This is illustrated in Appendix Table A1 for the Ga ethnolinguistic group of Ghana. Because of demographic differences within South Africa, weights were determined not based on the national sample but on the South African legacy categories of “Blacks,” “Whites,” and “Coloreds.” This leads to weighted average scores per question for all countries and ethnolinguistic groups.
Hofstede (2001) recommends a sample size of at least 20 and preferably 50 per group. I have taken a minimum sample size of 50 as the cut-off point for including ethnolinguistic groups in the analysis.
The question that was used to determine the ethnolinguistic group was in most cases Q87: “What is your ethnic community, cultural group or tribe?” However, in some cases, Q2 was (also) used: “Which language is your home language?” For Algeria and Morocco, most respondents say they feel a national identity only. The only separate group that was analyzed in those countries were the Berber speakers (based on Q2). For Burundi, Cape Verde, Egypt, Eswatini, São Tomé and Principé, Sudan, and Tunisia, it was not possible to make any ethnolinguistic split. For South Africa, Q102 (“racial” categories) was also taken into account. For the “Coloreds” and the “Whites” Q102 was combined with Q2, giving separate data for Afrikaans- and English-speaking “Whites” and “Coloreds.” For the Indians, Q87 was used. For the whole of Africa, this yielded 198 ethnolinguistic groups.
Minkov and Hofstede did not use all World Values Survey questions. Using a trial and error approach, they arrived at a set of 26 value-based questions. They contain a number of questions on what parents think children should be taught, questions derived from the theory of cultural dimensions as developed by Schwartz (2012) and six personal values. These questions are not asked or not asked in the same way in the Afrobarometer survey. However, in spite of the differences in survey questions, some questions do address underlying value orientations in different ways. To determine which questions would be the most relevant for my research, I made use of the recent cultural dimension scores that were published by Beugelsdijk and Welzel (2018). Beugelsdijk and Welzel have attempted to synthesize the Hofstede/Minkov dimensions and those of Inglehart and Welzel into a three-dimensional model. In their work, they publish scores on 13 African countries that have also been included in the Afrobarometer survey. Therefore, there are 13 common cases: Algeria, Burkina Faso, Egypt, Ghana, Mali, Morocco, Nigeria, South Africa, Tanzania, Tunisia, Uganda, Zambia, and Zimbabwe. In total, they have published scores for 16 African countries. Like Hofstede and Minkov, Beugelsdijk and Welzel work with a scale that runs from 0 to 100. They show greatest cultural similarity among the countries from Sub-Saharan Africa on their “collectivism-individualism” dimension: The range is 18 points. The range is considerably greater on their “duty-joy” dimension: 50 points. On their third dimension, “distrust-trust,” the range is 30 points. From their work, then, it seems that there is considerable cultural diversity within Sub-Saharan Africa, although the pattern is not the same for every dimension.
To arrive at a cluster analysis based on the Afrobarometer survey, the first step was to select a longlist of 43 questions that at face value seem they might be related to one of these three dimensions. Comparison of the scores led to a shorter list of 32 questions that show at least a weak correlation (Pearson r > |0.3|) with one or several of the Beugelsdijk/Welzel dimensions. These, then, are questions that have some relation to cultural differences. The list of questions is given in Table A2.
For a cluster analysis, all variables need to have a value. Missing values were estimated by taking values from countries assumed to be comparable (details are given in Table A3 of the appendix). A hierarchical clustering analysis was performed using the same method as that used by Minkov and Hofstede: the average linkage (between-groups) method using the Pearson correlation distance measure with z score standardization by variable.
Results
Minkov and Hofstede initially requested a number of solutions equal to their number of countries (seven). I did the same, requesting 35 clusters. In cases where regions of more than one nation appeared in one and the same cluster, Hofstede and Minkov relied on the dendrograms supplied by the cluster tool to identify subclusters that correspond to nations. I have followed the same strategy. (Because of its size, the full dendrogram has been included in the appendix.)
Some African countries are known to be almost or entirely monolingual, in spite of the ethnic differentiations that the Afrobarometer survey uses for these countries. One would expect that groups from these countries cluster together. They do:
Botswana has nine ethnolinguistic groups; together, they form one cluster, with no other members.
Lesotho has seven ethnolinguistic groups that together form one subcluster.
Madagascar has six ethnolinguistic groups that together form one subcluster.
Mauritius has four ethnolinguistic groups that together form one cluster, with no other members.
One would also expect to see some similarity among the Arab countries. Indeed, the analysis puts Algeria, Egypt, and Morocco in the same cluster. However, Tunisia and Sudan are in different clusters.
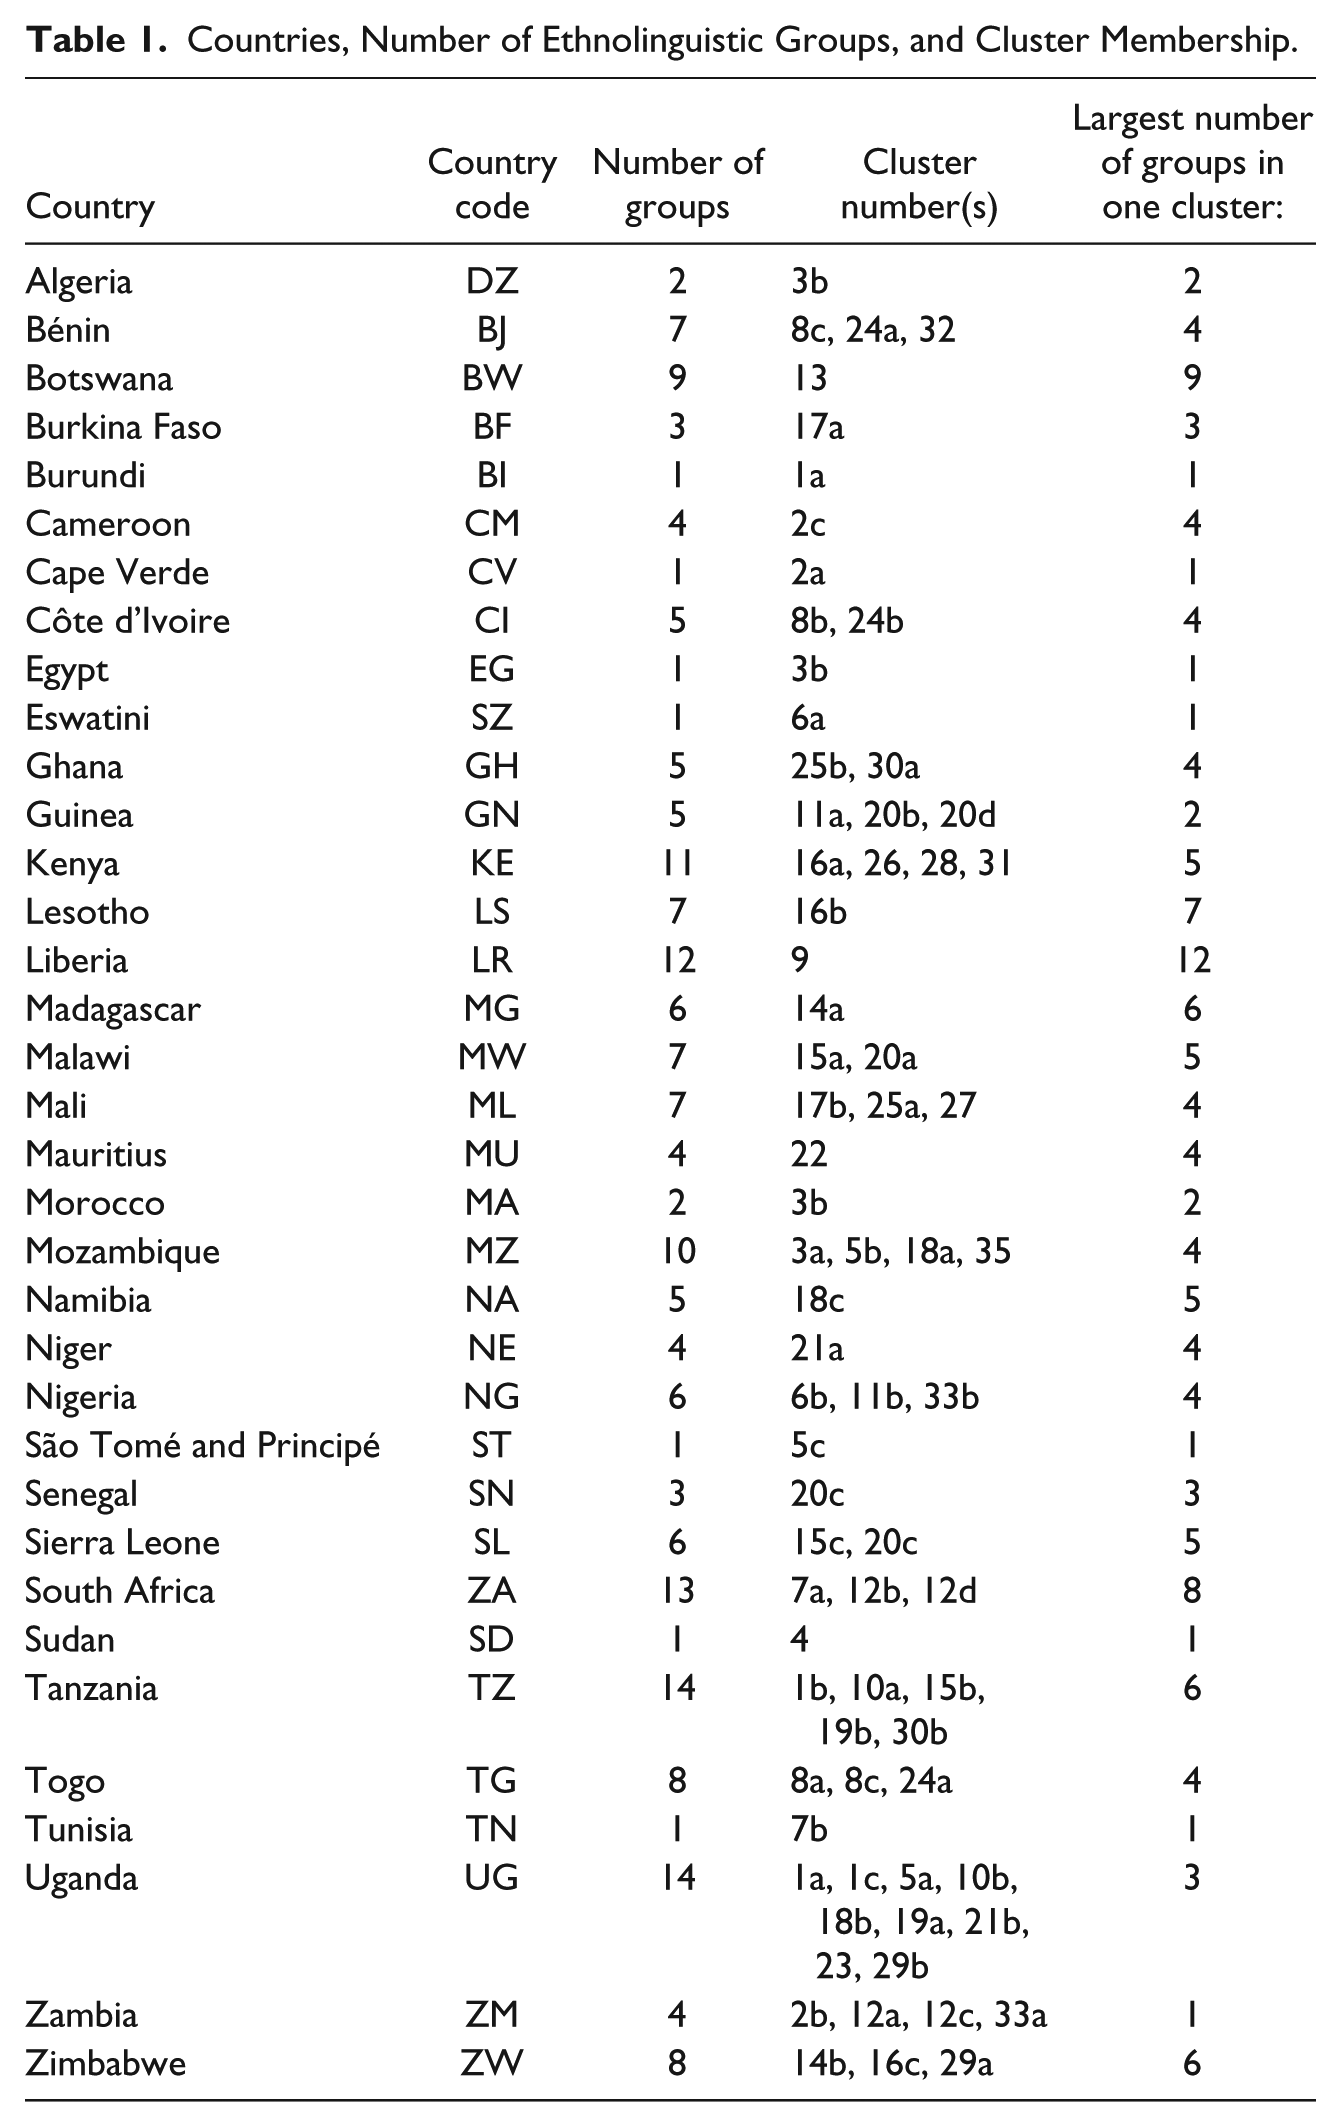
The situation for all 35 countries is summarized in Table 1.
Countries, Number of Ethnolinguistic Groups, and Cluster Membership.
By cluster, the situation is as in Table 2. The first two letters are the country code; they are followed by the designation of the ethnolinguistic group as given by the Afrobarometer. Note that the Afrobarometer group designations do not imply any judgment by the author on their appropriateness or otherwise.
Ethnolinguistic Group Clusters.
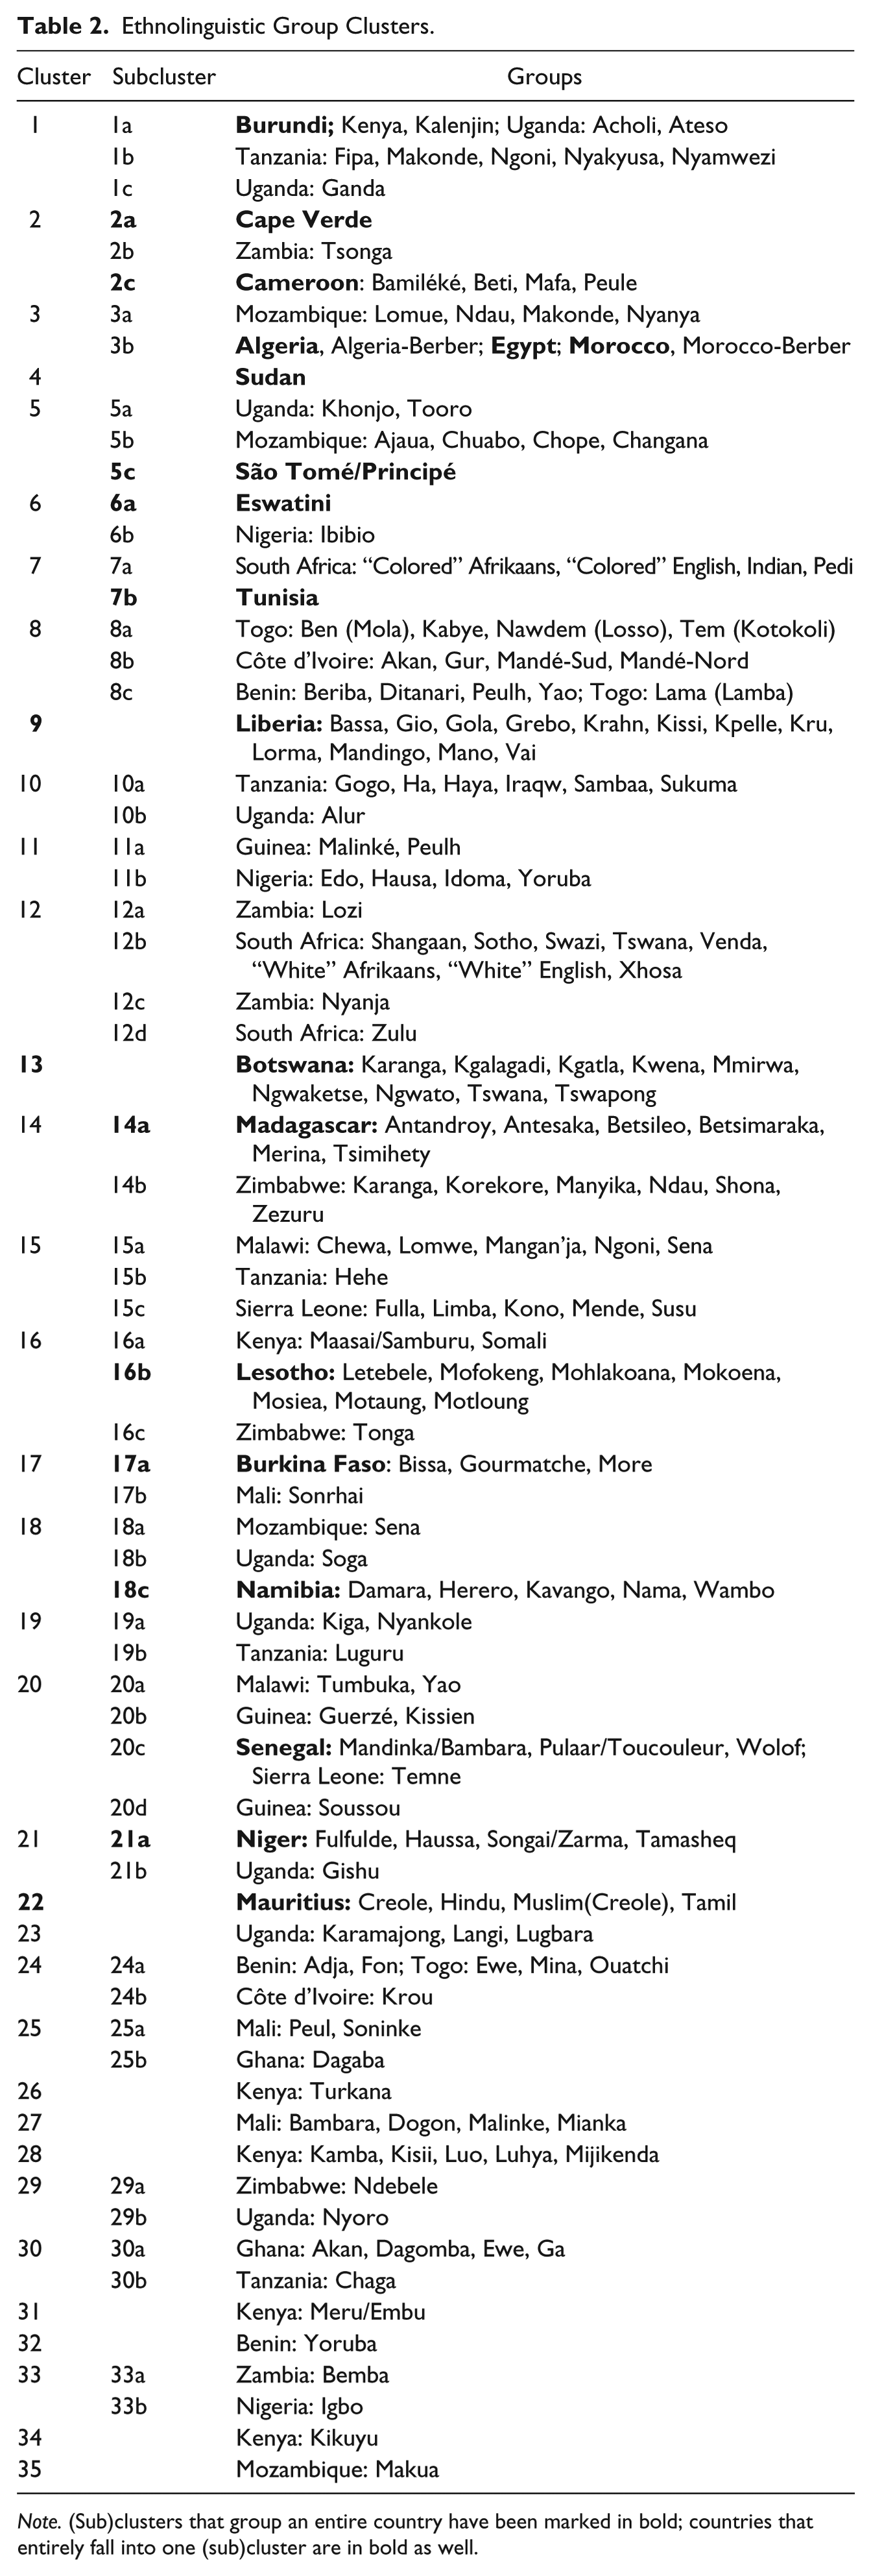
Note. (Sub)clusters that group an entire country have been marked in bold; countries that entirely fall into one (sub)cluster are in bold as well.
For a direct comparison of these results with those obtained by Minkov and Hofstede, I will concentrate on all countries in Sub-Saharan Africa for which I have data on more than one ethnolinguistic group. Minkov and Hofstede used seven countries, of which five are also in the Afrobarometer data set: Burkina Faso, Ghana, Mali, South Africa, and Zambia.
For Burkina Faso, they had 13 regions, of which 10 fell into one cluster. In my analysis, there are three ethnolinguistic groups, falling into one cluster. For Ghana, they had ten regions, all falling into one cluster. I have five ethnolinguistic groups; four of them fall into the same cluster. For Mali, they had six regions, all falling into one cluster. I have seven ethnolinguistic groups, of which four fall into one cluster. For Zambia, they had nine regions, of which six fell into one cluster. I have four groups, all in different clusters. For South Africa, they had nine regions, all falling into the same cluster. In my analysis, there are 13 ethnolinguistic groups, divided into three clusters. Of these, eight fall into one cluster and four into another.
The comparison is summarized in Table 3 below.
Comparing Administrative Region-Based Clusters With Ethnolinguistic Group-Based Clusters.
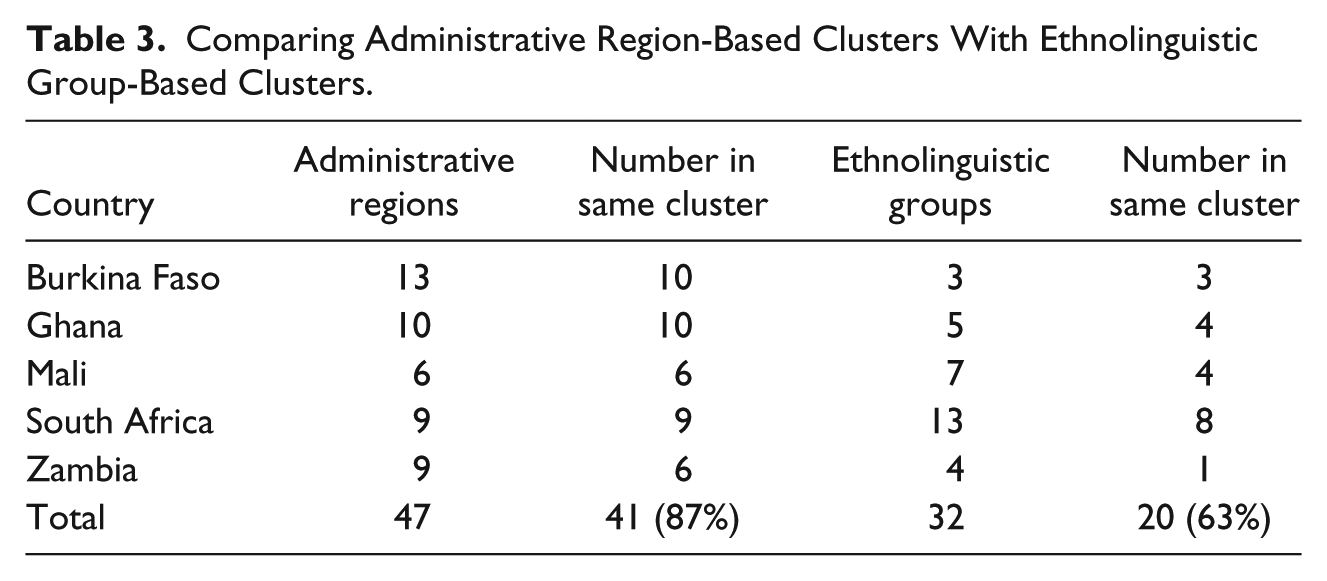
Looking only at these five countries, my results, using a different data set and a different unit of analysis, are roughly similar to those of Minkov and Hofstede, although they show a greater differentiation. This difference becomes more pronounced if we examine the extended set of countries that is in the Afrobarometer data set.
There are 26 countries in the Afrobarometer data set that are in Sub-Saharan Africa and for which data from different ethnolinguistic groups are available. There is data on 187 ethnolinguistic groups from these countries. Out of these, 126 or 67.4% cluster together with other ethnolinguistic groups of their country, forming homogeneous national clusters, as compared with a figure of 90.6% found by Minkov and Hofstede. Besides those countries that are dominated by one ethnolinguistic group (Botswana, Lesotho, Madagascar), there are seven other countries of which all ethnolinguistic groups fall into the same (sub)cluster: Burkina Faso, Cameroon, Liberia, Mauritius, Namibia Niger, and Senegal. Note that this might not be the whole story: In all of those countries, there could be smaller ethnolinguistic communities that show a different cultural profile but who have not been sufficiently sampled in the Afrobarometer survey.
This means that there are 16 countries from which not all ethnolinguistic groups cluster together at the national level. In five, the majority fall into one (sub)cluster, with only one or two ethnolinguistic groups that seem to be an exception: This concerns Côte d’Ivoire, Ghana, Malawi, Sierra Leone, and Zimbabwe. Cameroon has four ethnolinguistic groups divided over two clusters but three subclusters.
This leaves eleven countries with considerable in-country cultural diversity. They merit a separate discussion.
Guinea’s five ethnolinguistic groups fall into three clusters. Mali’s seven groups fall into three clusters, but four fall into the same cluster. Bénin and Togo are two small countries of considerable diversity, each with ethnolinguistic groups falling into three different clusters. However, two of these clusters overlap. Nigeria’s six groups fall into three clusters, of which four are in the same cluster. Mozambique’s 10 ethnolinguistic groups fall into four clusters. However, four are in one cluster, four more in another one. South Africa’s 13 groups fall into three clusters, but eight are in one cluster and four more in another one. Tanzania’s 14 groups fall into five clusters. However, one cluster contains six, another contains five groups. Zambia’s four groups are each in a separate cluster. Then there is Kenya and Uganda. Kenya’s 11 groups are spread out over four clusters, although five are in one cluster. Uganda’s 14 groups are spread out over nine clusters, with no more than three falling into the same cluster.
What this means is that there is not one common pattern that applies across Africa. There are not even regional patterns. For many countries, there is support in this study for the conclusion by Minkov and Hofstede that national culture is a relevant concept and worth studying, even in ethnolinguistically diverse countries such as those found in Africa. However, the present study also shows that there are a significant number of countries in which ethnolinguistic groups do not cluster at the national level. Examining these countries individually again shows different patterns for different countries: In some countries, ethnolinguistic groups fall into a limited number of clusters; in a minority of countries, there is no clearly distinguishable pattern at all.
This also means that statements about Africa in general are meaningless here. The subset of countries chosen for the Minkov/Hofstede study is not representative of Africa as a whole nor can this be assumed for the much larger Afrobarometer subset.
Our study has shown that for some countries in Africa, it is now possible to use data on national culture. In others, it is not. Every country and ethnolinguistic group will have to be examined on its own merits. However, the survey approach that is common in cross-cultural psychology does help to produce meaningful data on ethnolinguistic groups in Africa, just as it does in other parts of the world.
Discussion and Recommendations
Cluster analysis is a data reduction technique. It is a good tool for preparing broad estimates, but not for detailed analysis at the level of individual groups. It does not lead to full descriptions of cultures; those have to be obtained through other methods. But this approach can help to make sense of the cultural landscape of a larger area. In that sense, as pointed out by Minkov (2013), it can be a cognitive tool that helps to understand the complex world around us. That being said, it is important to realize that hierarchical clustering has its limitations and therefore does not represent the true diversity in ethnolinguistic groups that exists on the ground. Cross-cultural psychology offers a more precise approach through its various and well-known cultural dimension approaches (Minkov, 2013). There are a number of further steps that could be taken to lead to a more precise image.
One step that would make sense would be to include a survey instrument that is more specifically designed to measure cultural differences and similarities in the Afrobarometer survey. One such instrument is the Values Survey Module 3 as described by Hofstede and Minkov.
Another step would be to reexamine the ethnolinguistic categories used in the Afrobarometer survey. For some countries, such as Lesotho, one wonders what the value is of keeping in these questions. For others, it might be possible to reduce the number of ethnolinguistic groups. In all cases, it would be useful to take steps to ensure a better level of representativity at the ethnolinguistic group level.
A last step, easier said than done, would of course be to extend the coverage of the Afrobarometer survey to the maximum number of countries.
Prah (2008) has pointed to the two common tropes that exist about Africa: the one that claims that Africans have much in common and that there is really one common African culture, the other one that Africa is a continent of infinite cultural diversity. The first trope denies the real cultural differences that exist on the ground. The second one leads to the idea that because of its fragmentation, patrimonialism and parochialism are Africa’s only future.
The idea that somehow, in Africa, “tribes” will disappear and coherent “nations” will appear is partly based on how Europeans popularly perceive their own history: In pre-Christian times, in Europe there lived primitive, heathen tribes—who then (fast forward) morphed into the civilized nations we know today. The idea that somehow Africa is “behind” in this but that eventually it will catch up is counterproductive. It could be that in some countries, such developments do occur. But there is no way of generalizing. The Afrobarometer survey is possible only in those countries in Africa that have a minimum level of peace and security. What would the situation be like in countries that are not included in these surveys? It could well be that some of Africa’s “failed states” will never work within their present boundaries. Thus, Adebajo (2010) has called for a “New Berlin Conference” to address some of these problems.
In any case, important cultural differences in Africa remain and it is important to create new knowledge on what these differences are and on where the main distinctions lie. Without such knowledge, attempts to build stronger pan-African collaborations or stronger grassroots-based democratic structures will remain founded on quicksand.
Footnotes
Appendix
The dendrogram is split into a top and a bottom part, to facilitate reproduction. SPSS computes all relative distances on a 25-point scale, as shown at the top of the dendrogram.
Declaration of Conflicting Interests
The author(s) declared no potential conflicts of interest with respect to the research, authorship, and/or publication of this article.
Funding
The author(s) received no financial support for the research, authorship, and/or publication of this article.