
Abstract
Establishing measurement invariance has been emphasized as an important scale validation procedure for group comparisons. The 28-item Career Futures Inventory–Revised (CFI-R) is a widely used measure of career adaptability that has demonstrated initial validity with various samples. The purpose of the present study is to further examine the validity of the CFI-R by testing measurement invariance between a general university student sample and a client sample. First, a five-factor confirmatory factor analysis model was tested with each group. Then, measurement invariance tests were conducted through subsequently examining configural invariance, metric invariance, and scalar invariance. Test of invariance was achieved until partial scalar invariance, suggesting that the CFI-R is similarly applicable to both clinical and nonclinical samples. In addition, the comparisons of latent means between two groups revealed that clients showed significantly lower latent means than general students for four factors: Career Agency, Occupational Awareness, Support, and Work–Life Balance.
As a result of the ongoing Fourth Industrial Revolution (Schwab, 2016), the current world of work is marked by volatility and high demand for flexibility. Unlike in the past when employees typically remained in the same position for the majority of their lives, career transitions are now ubiquitous. In contemporary society, workers are required to be adaptable to survive and thrive in changing work contexts (Fugate, Kinicki, & Ashforth, 2004; Hill et al., 2008). They not only need to develop occupation-specific skills and knowledge but also trans-occupational competencies that can help them successfully navigate these changes. This shift in locus of control from the organization to the individual is marked by the model of protean career, which emphasizes the individual’s management and directing of his or her career (Hall, 1996). Hall (2004) suggested two meta-competencies are important to protean career: self-awareness and career adaptability.
Due to its importance and relevance in the modern society, career adaptability has become one of the key constructs in the vocational psychology literature (Creed & Hood, 2015). To facilitate research in this area, several quantitative measures have been developed, including the Career Adapt-Abilities Scale (CAAS; Savickas & Porfeli, 2012) and the Career Futures Inventory–Revised (CFI-R; Rottinghaus, Buelow, Matyja, & Schneider, 2012). Although both measures target career adaptability, they are distinguishable in the subcomponents of the career adaptability that they assess. More specifically, while CAAS focuses on the four inner resources of adaptability, concern, control, curiosity, and confidence (Savickas & Porfeli, 2012), the CFI-R adds in more contextual elements alongside individual factors, measuring Career Agency, Occupational Awareness, Negative Career Outlook, Support, and Work–Life Balance (Rottinghaus et al., 2012).
Previous research has found initial support for the structural and convergent validity of the CFI-R (Rottinghaus et al., 2012; Rottinghaus et al., 2017; Rottinghaus, Falk, & Eshelman, 2017). However, further examination of its psychometric qualities will provide additional support for its construct validity and utility with diverse groups. In particular, it is important to further investigate the structure of the CFI-R and its generalizability across samples. As an effort toward this end, the present study examined the measurement invariance of the CFI-R across general and clinical samples.
Career Adaptability
In his seminal work, Super (1955) proposed the concept of vocational maturity (later renamed career maturity) as the extent to which a person is ready to assume career-related tasks appropriate for his or her stage in career development. Super established five dimensions of vocational maturity: planfulness, exploration, decision-making, knowledge of the world-of-work, and preferred occupation. Planfulness and exploration are attitudinal dimensions that reflect dispositional inclinations toward foresight and curiosity. In contrast, decision-making and knowledge of work are cognitive dimensions related to information and rational decision-making.
However, one important limitation of career maturity involves the assumption of an orderly, sequential process of career development. Although it might have been applicable to previously stable work contexts, in which most people engaged in one vocation for the duration of their career, it does not reflect the volatile nature of today’s workplace. Also, although maturation is a core process in adolescents’ career development, it is less applicable to the career development of adults (Savickas, 1997).
Addressing these concerns and expanding upon previous work, the term career adaptability was introduced to address how adults adjust within a fluctuating economy (Creed & Hood, 2015; Super & Knasel, 1979). Career adaptability comprises components that are crucial to enhancing clients’ career readiness, including ability to prepare for work, adjust to unpredictable changes, and transition into new work roles (Rottinghaus, Day, & Borgen, 2005; Savickas, 2005). The four core dimensions of career adaptability, known as the four Cs, are concern, control, curiosity, and confidence (Savickas, 2005), which are conceptually linked to Super’s (1955) five dimensions of vocational maturity.
In order to develop or increase the fit between self-concept and situation, people strive to adapt to given circumstances. Adaptability enables a person to flexibly respond to the environment. Unlike how the maturity and stage model suggested, adaptation is an unending process and thus cannot be mastered. Rather, it is in a continual need of development. Conceptually, this suggests the need to shift the focus from the individual’s characteristics (i.e., traits) to the individual nested within the environment and his or her changing needs. This also places greater emphasis on the need for career counseling regardless of age and life roles (Savickas, 1997). In fact, scholars have noted the importance of career adaptability across life stages, including childhood (Hartung, Porfeli, & Vondracek, 2005), adolescence (Hirschi, 2009), young adulthood (Creed, Fallon, & Hood, 2009), and working adults (Ito & Brotheridge, 2005).
Assessments provide crucial information for both practitioners and researchers. Savickas (1997) suggested that the evaluation of career adaptability should include planfulness, exploration, self and situational knowledge, and decision-making skill. Some of the earlier measures include Career Development Inventory (Thompson, Lindeman, Super, Jordaan, & Myers, 1981), which measures career choice readiness and includes the subscales for Career Planning, Career Exploration, Decision-Making, World-of-Work Information, and Knowledge of Preferred Occupational Group. Similarly, the Career Maturity Inventory (Crites & Savickas, 1996) was developed to assess individuals’ developmental levels in career. More recently, the CAAS (Savickas & Porfeli, 2012) was proposed as a tool to assess four aspects of career adaptability: career development, including confidence, control, concern, and curiosity. The measure has been translated and validated across 13 countries (Savickas & Porfeli, 2012).
CFI-R
Among several quantitative measures of career adaptability, the CFI-R (Rottinghaus et al., 2012) is distinguishable in its comprehensiveness. The CFI-R expanded upon the original CFI (Rottinghaus et al., 2005), which incorporated insights from emerging scholarship of positive psychology and advances in career adaptability research (Savickas, 1997, 2005). The CFI comprises three factors: career adaptability, Career Optimism, and Perceived Knowledge of the Job Market. The scores on the CFI were significantly correlated with dispositional optimism, Big Five personality characteristics, and generalized problem-solving. Also, those with high CFI scores showed greater educational aspirations, vocational self-efficacy, and engagement in career exploration activities (Rottinghaus et al., 2005). The original 25-item CFI was later abbreviated to form a brief version called the CFI-9 (McIlveen, Burton, & Beccaria, 2012). As the brief version was developed with Australian university students, the study also suggested that the CFI is generalizable to other cultures (McIlveen et al., 2012). In addition, CFI has been translated and validated in Germany (Spurk & Volmer, 2013) and South Korea (Choi & Kim, 2006).
Although the CFI is a useful tool for both research and practice, it is restricted in the range of concepts it covered. Therefore, Rottinghaus, Buelow, Matyja, and Schneider (2012) revised and expanded the measure to more fully capture the various aspects of career adaptability. For example, Social Support and Work–Life Balance have been incorporated to acknowledge the contextual and situational aspects of career development. The researchers first established a pool of 165 new items from the relevant literature, and through content analysis by a team of experts, the list was shortened to 148 items including the original 25 items of the CFI. Factor analysis was then conducted to determine the final list of items.
The finalized CFI-R is composed of 28 items and five distinct, internally consistent subscales: Career Agency, Occupational Awareness, Negative Career Outlook, Support, and Work–Life Balance. Career Agency is the perceived capacity to reflect on and manage career transition, and Occupational Awareness reflects understanding of job market trends. Negative Career Outlook indicates negative thoughts or expectations regarding career, and Support is the level of perceived support from family and friends in career development. Lastly, Work–Life Balance is conceptualized as the ability to manage multiple life roles (Rottinghaus et al., 2012; Rottinghaus et al., 2017).
Several validation studies have demonstrated initial support for the factor structure and convergent validity with career-related characteristics, including career decision self-efficacy, vocational identity, and career decision difficulties (Creed & Hood, 2015; Rottinghaus et al., 2012; Rottinghaus et al., 2017). In addition, a Turkish language translation of the CFI-R has demonstrated validity (Hamedoğlu et al., 2014). Also, the CFI-R has been used in studies with diverse samples, including veterans (Gaiter, 2015) and technical and vocational students (Ebenehi, Rashid, & Bakar, 2016). While these studies suggest the measure’s usefulness in capturing career adaptability of diverse populations, relatively little research has focused on whether the CFI-R works similarly across different populations. It would be especially important to investigate the use of the CFI-R Scales in practice settings with career clients, as the scale was initially developed with general university students (Rottinghaus et al., 2012). Such evidence can be demonstrated through psychometric techniques, including measurement invariance testing.
Measurement Invariance
Measurement invariance ensures that a given test measures a construct equally across multiple populations. When a test is invariant, two people from different populations with the same standing on a particular construct will receive the same score on the test. In contrast, when a test is not invariant, these two people will get different test results, despite being at the same level on the latent construct (Schmitt, Golubovich, & Leong, 2011).
Understandably, measurement invariance is an important and pertinent topic for psychological measures. As there are numerous populations with potentially different characteristics (e.g., gender, cultural groups, clinical vs. nonclinical, age cohorts), it is important to ensure that a measure is applicable to these various groups of individuals. If a measure is found to be variant across certain populations, it warrants caution in generalizing its usage and comparing its results across these populations. Furthermore, the points at which measurement invariance fails can provide valuable insight into the between group differences.
One group difference that can be of special interest to psychometricians is clinical versus nonclinical groups. Studies suggest that clinical and nonclinical populations may show meaningful differences in psychological functioning. For example, one study with college population found that a clinical group (those who sought counseling) reported a wide array of psychological problems (academic concerns, relationships/adjustment issues, depression/romantic relationships, sexual issues, and eating concerns) that were more serious and lasted longer compared to a nonclinical group (those who did not seek counseling; Erdur-Baker, Aberson, Barrow, & Draper, 2006). These differences in psychological characteristics of the groups may lead them to respond to the same measure in different ways. For instance, a qualitative study found that individuals in clinical and nonclinical groups interpreted items on the Revised Hallucination Scale differently, which led the researchers to suggest that using this measure for nonclinical population may not be advisable (Stanghellini, Langer, Ambrosini, & Cangas, 2012). Measurement invariance testing can help clarify whether and how the two groups show differential scoring on a given measure.
Measurement invariance testing has been increasingly included as part of scale development, scale validation, and comparisons of groups on latent constructs (e.g., Frisby & Wang, 2016; Wang, Bergin, & Bergin, 2014). In general, measurement invariance testing procedures investigate models by sequentially adding equality constraints across groups on model parameters. It is recommended that the measurement invariance test be conducted through increasingly more restrictive steps, including an omnibus test of the equality of covariances across groups, a test of configural invariance, a test of metric invariance, and a test of scalar invariance (Vandenberg & Lance, 2000). A configural invariance model tests whether the same structural model holds for both samples, while a metric invariance model examines whether the factors have the same meanings across samples. The last model, scalar invariance model, constrains both factor loadings and thresholds to test whether the factor means can be compared across groups.
The Present Study
The present study further examines the factor structure and psychometric qualities of the CFI-R by testing measurement invariance between a general university student sample and a client sample. It was hypothesized that the previously identified five-factor structure would hold up in both samples and that the measure would pass the tests of configural invariance, metric invariance, and scalar invariance. However, the latent means of the subscales were expected to differ, given the difference in sample characteristics. That is, while the general sample represents the nonclinical population, the clinical sample represents those who seek professional help due to experiencing career-related problems. Therefore, it was expected that the clinical sample would report significantly lower latent means in Career Agency, Occupational Awareness, Support, and Work–Life Balance, as well as higher Negative Career Outlook.
Method
Samples
The present study used data from two independent samples: a general sample and a clinical sample. The first sample comprised 348 undergraduate students enrolled in an introductory psychology class in a Midwestern university. The gender distribution was mostly equal, with 178 (51.1%) women and 170 (48.9%) men. In terms of race/ethnicity, 189 (54.3%) were European American, 115 (33.0%) were African American, 24 (6.9%) were Hispanic/Latinx, 8 (2.3%) were Asian American, 2 (0.6%) were Native American, 1 (0.3%) was Hawaiian/Pacific Islander, and 9 (2.6%) identified as Other. The mean age was 18.90 (SD = 1.77). The sample was used in Study 2 of the validation study of the CFI-R (Rottinghaus et al., 2012), but its factor structure was not analyzed or examined.
The second included a clinical sample of 332 clients from a different Midwestern university career center who completed the CFI-R during intake. Among them, 212 (63.9%) were women, 117 (35.2%) were men, and 3 (0.9%) did not report their gender. In terms of race/ethnicity, 201 (60.5%) were European Americans, 85 (25.6%) were African Americans, 15 (4.5%) were Asian Americans, 15 (4.5%) were Hawaiian/Pacific Islanders, 10 (3.0%) were Hispanic/Latinx, 2 (0.6%) were Native American, and 19 (5.7%) identified as Other. Multiple selections were allowed. The mean age was 23.16 (SD = 6.27), which was higher than that of the general sample. The sample was used as a part of another study (Rottinghaus et al., 2017).
Measures
Demographic questionnaire
Both general and clinical samples reported their gender, race/ethnicity, age, and academic major.
Career adaptability
The CFI-R (Rottinghaus et al., 2012) consists of 28 items (see Appendix) with five factors: Career Agency (e.g., “I can perform a successful job search”), Occupational Awareness (e.g., “I understand how economic trends affect career opportunities available to me”), Negative Career Outlook (e.g., “I doubt my career will turn out well in the future”), Support (e.g., “Others in my life are very supportive of my career”), and Work–Life Balance (e.g., “I can easily manage my needs and those of other important people in my life”). The items were responded on a 5-point Likert-type scale, ranging from 1 = strongly disagree to 5 = strongly agree. The initial Cronbach’s αs ranged from .78 to .90 (Rottinghaus et al., 2012). Also, individual subscales showed correlations with career-related variables. For example, career decidedness was positively correlated with Career Agency, Occupational Awareness, Support, and Work–Life Balance and negatively correlated with Negative Career Outlook (Rottinghaus et al., 2012).
Data Analysis
Descriptive statistics, correlations between factors, and internal consistency of each sample were first computed using SPSS Version 18.0. Also, skewness and kurtosis were analyzed to ensure that the data did not violate multivariate normality. Skewness with an absolute value greater than 2 and kurtosis with an absolute value greater than 7 may indicate non-normality of the data (West, Finch, & Curran, 1995).
All items were treated as ordered categorical instead of as continuous variables because Likert-type responses, in many cases, cannot be assumed to have equidistant scale points (Muthén, 1984). That is, the difference between any two points (e.g., 1 and 2) cannot be assumed to be the same as the difference between other two points (e.g., 4 and 5). Given the ordered categorical nature of the items, the weighted least squares estimation with mean and variance correction (Muthén, du Toit, & Spisic, 1997) was used in the analysis. Missing data were handled with a pairwise present analysis method (Asparouhov & Muthén, 2010).
Before measurement invariance was tested, the factor structures of the two samples were examined using confirmatory factor analyses (CFAs) with Mplus Version 6.0. The equivalence of the model between two samples can be tested only after the factor structures of the two samples are confirmed. If the CFA for a sample shows poor fit, the model would be revised to find a better model for subsequent analyses.
The model fit was evaluated based on root mean square error of approximation (RMSEA), confirmatory fit index (CFI), and Tucker–Lewis Index (TLI). More specifically, RMSEA values less than .08 were considered fair fit and values less than .05 acceptable fit (Browne & Cudeck, 1993). As for CFI and TLI, values larger than .90 were considered acceptable fit, and values greater than .95 were considered good fit (Hu & Bentler, 1999).
Measurement invariance testing was conducted in three, increasingly restrictive steps. In the first step, the configural invariance model was tested. In this test, the same structural model was applied to both samples. There was no cross-group constraint, and thus loadings and thresholds were allowed to vary. This type of invariance shows that the same indicators measure the latent variables in both groups. However, it does not ensure that the relationships between items and the latent variables are the same across groups. To account for this, more restrictive forms of invariance need to be examined.
As the second step, metric invariance, or weak invariance, was tested. In this model, factor loadings were constrained to be equal across samples. Therefore, establishment of this second type of invariance would suggest that the relationships between each indicator and latent variable are consistent across the two groups. In the last step, the scalar invariance, also known as strict invariance, model was fitted. In this model, both factor loadings and thresholds were constrained to be equal across groups. The establishment of this level of invariance ensures that when two individuals from each group get the same score on the measure, they both can be assumed to have the same level of latent variable. When scalar invariance is achieved, structural parameters such as factor means can be validly compared between groups (Vandenberg & Lance, 2000).
As measurement invariance models were nested models, they were compared using a χ2 difference test. In addition, the changes in RMSEA, CFI, and TLI were examined for each step of measurement invariance testing. With a more constrained model, if the RMSEA increased by more than .015, the CFI decreased by more than .01, or if the TLI decreased by more than 0.02 (Chen, 2007; Cheung & Rensvold, 2002; Vandenberg & Lance, 2000), the more constrained model should be rejected.
Establishment of scalar invariance allows for comparison of latent means between groups. The critical ratio (CR), which is the parameter estimate divided by its standard error, was calculated for latent mean comparisons. A CR value greater than 1.96 was considered an indication of statistically significant difference of latent means at the .05 level (Byrne, 2013).
Results
First, correlations between factors and descriptive statistics of each sample were calculated. These results are summarized in Tables 1 and 2. As shown in the tables, all factors were significantly correlated with each other in both client and general samples.
Correlations and Descriptive Statistics of the General Sample.
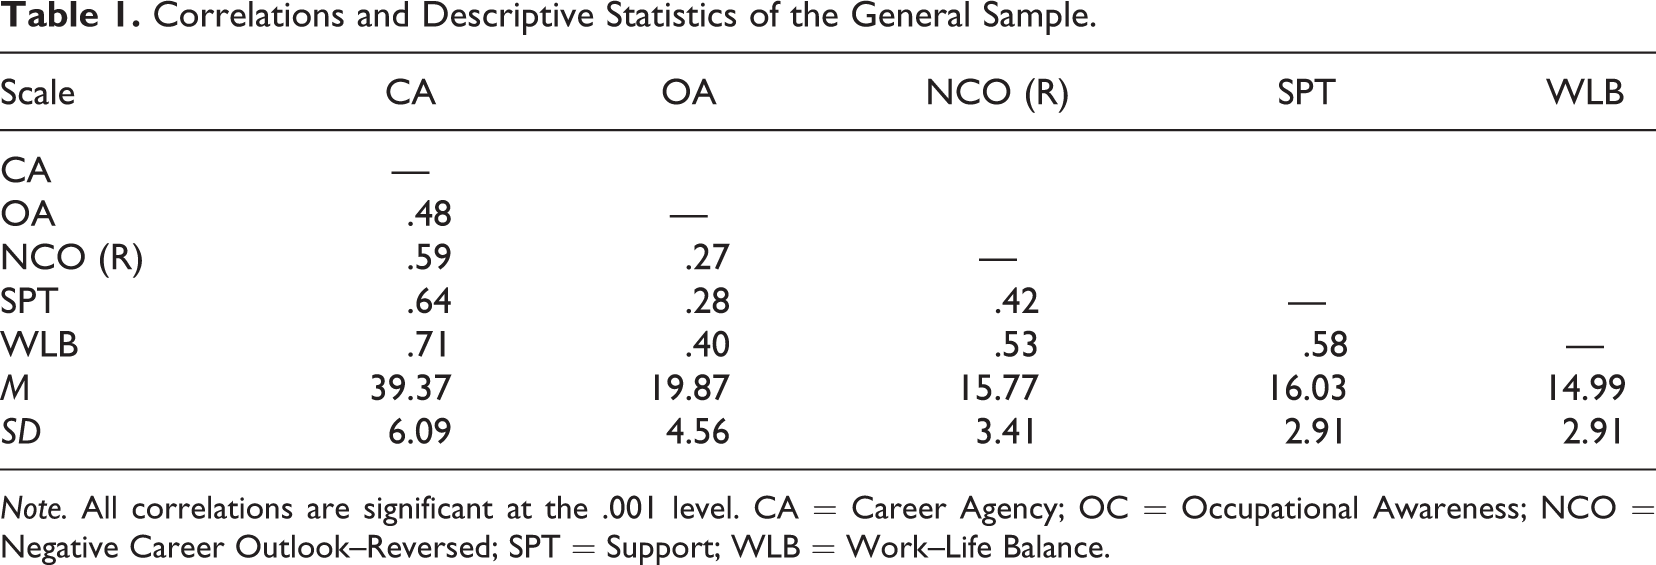
Note. All correlations are significant at the .001 level. CA = Career Agency; OC = Occupational Awareness; NCO = Negative Career Outlook–Reversed; SPT = Support; WLB = Work–Life Balance.
Correlations and Descriptive Statistics of the Clinical Sample.
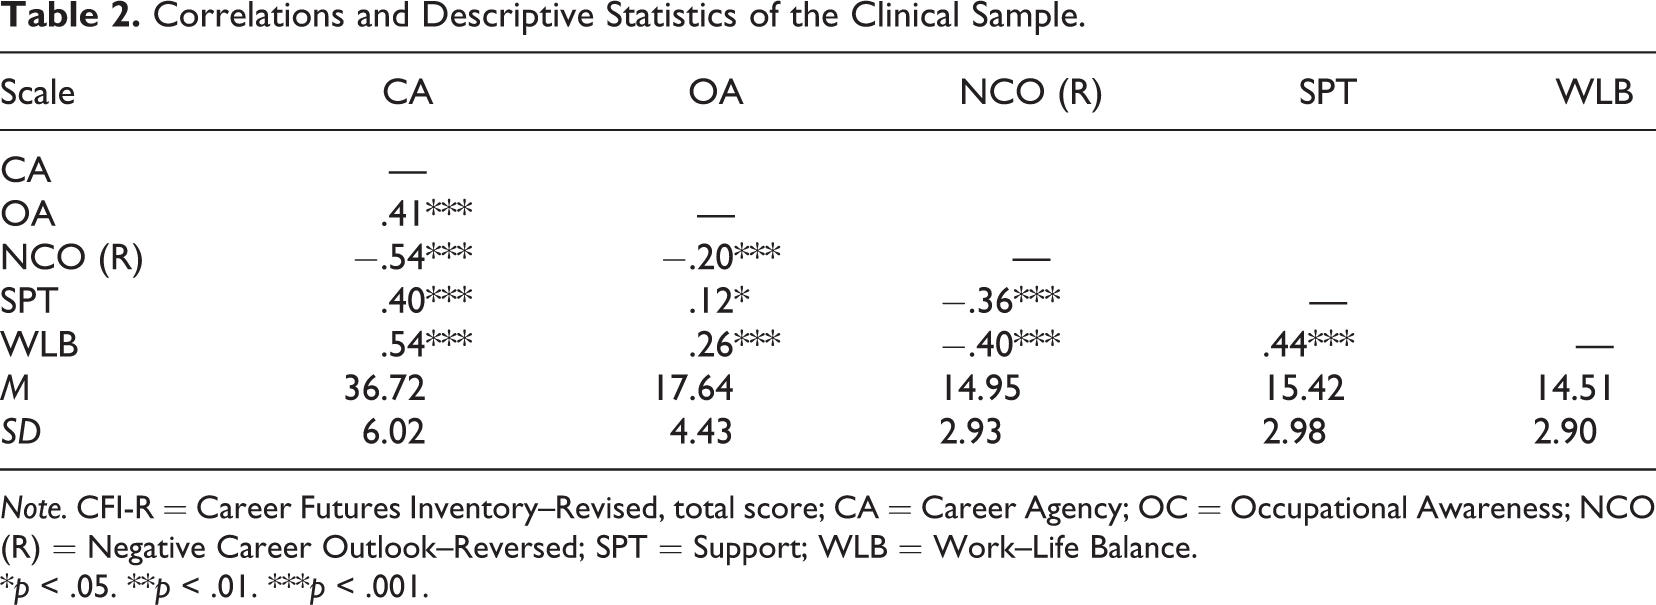
Note. CFI-R = Career Futures Inventory–Revised, total score; CA = Career Agency; OC = Occupational Awareness; NCO (R) = Negative Career Outlook–Reversed; SPT = Support; WLB = Work–Life Balance.
*p < .05. **p < .01. ***p < .001.
Before measurement invariance was tested, a CFA was conducted with each sample separately. Although the CFA for the general sample showed acceptable fit, χ2(340) = 737.405, p < .001, RMSEA = .058, 90% CI [.052, .064], CFI = .949, TLI = .944, its initial fit for the client sample was not adequate, χ2(340) = 869.516, p < .001, RMSEA = .068, 90% CI [.063, .074], CFI = .909, TLI = .899. Subsequent examination of modification indices revealed that residuals of several items loading onto the same factor may covary. More specifically, in Career Agency, residuals of Items 1, 3, and 28 covaried with each other, the residual of Item 6 covaried with the residual of Item 22, the residual of Item 10 covaried with the residual of Item 14, and the residual of Item 19 covaried with the residuals of Items 16 and 22. In Occupational Awareness, the residual of Item 15 covaried with the residual of Item 7, and the residual of Item 17 covaried with the residual of Item 21.
Therefore, the model was modified to allow covariation among residuals of these items. The modified model showed better fit with the client sample, χ2(331) = 684.898, p < .001, RMSEA = .057, 90% CI [.051, .063], CFI = .939, TLI = .931, as well as with the general sample, χ2(331) = 649.807, p < .001, RMSEA = .053, 90% CI [.047, .059], CFI = .959, TLI = .954. The factor loadings and correlations are shown in Figure 1. This revised model was used in the subsequent analyses.
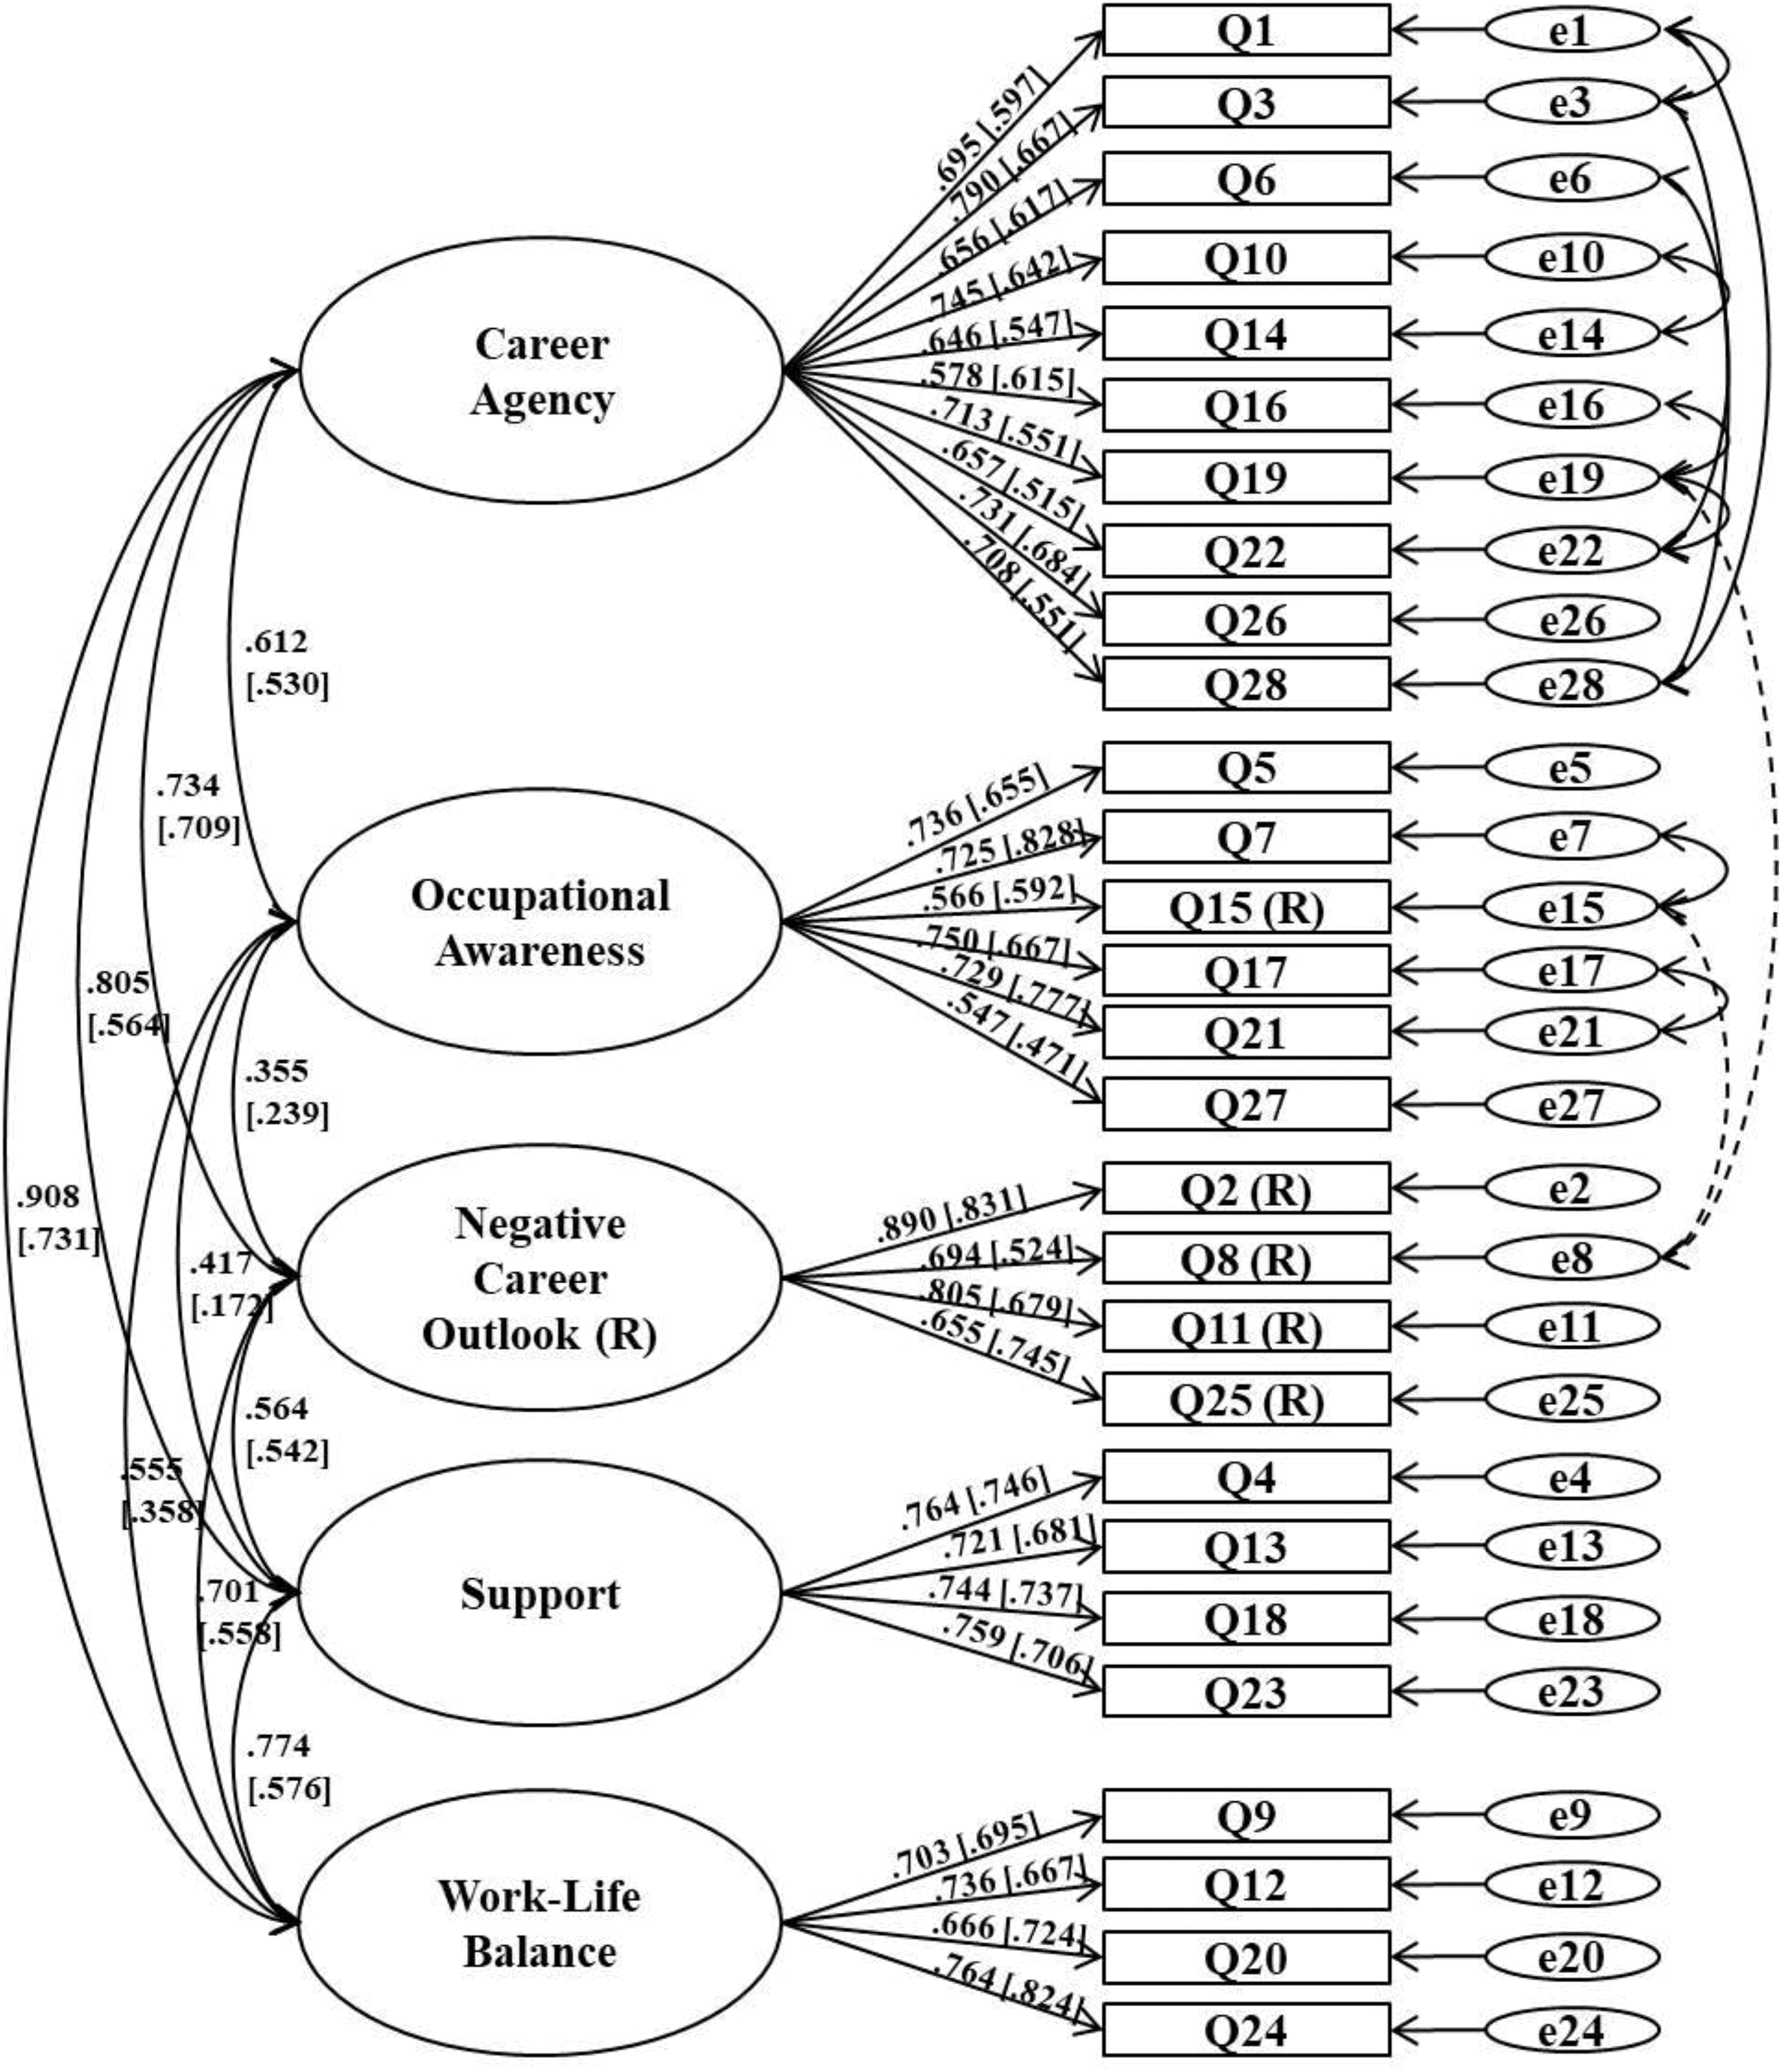
Confirmatory factor analyses of general and client samples (shown in square brackets). Dotted lines apply only to the client sample. All standardized factor loadings and correlations are significant at p < .001. (R) = reverse-coded.
Next, measurement invariance tests were conducted, following the procedure described in the previous section. First, the configural invariance tested by fitting the same structural model to both the general sample and clinical sample. As expected, the model held up with a fair fit, χ2(662) = 1,335.567, p < .001, RMSEA = .055, 90% CI [.050, .059], CFI = .951, TLI = .944.
Having achieved configural invariance, metric invariance was examined next by constraining the factor loadings. The results showed that the metric invariance model also had a good fit, χ2(685) = 1,352.828, p < .001, RMSEA = .054, 90% CI [.049, .058], CFI = .952, TLI = .947. Also, the metric invariance model did not fit statistically significantly worse than the configural invariance model, Δχ2(23) = 17.261, p = .796. The changes in fit indices were also smaller than the cutoff points, with ΔRMSEA = −.001, ΔCFI = .001, and ΔTLI = .013. Therefore, the metric invariance model was retained.
Lastly, scalar invariance was tested by constraining both factor loadings and thresholds. The initial scalar invariance model showed acceptable yet slightly poor fit, χ2(764) = 1,623.512, p < .001, RMSEA = .058, 90% CI [.054, .061], CFI = .938, TLI = .938. The χ2 difference test against the configural invariance model was also significant, Δχ2(79) = 270.684, p < .001. Examination of modification indices showed that Item 8 (“Thinking about my career frustrates me”) acted differently across groups. Therefore, the constraints on the thresholds of Item 8 were released. In addition, based on further consideration of modification indices, the residual of Item 8 was allowed to covary with the residuals of Items 15 and 19 in the client group.
The partial scalar model showed good fit, χ2(759) = 1,454.964, p < .001, RMSEA = .052, 90% CI [.048, .056], CFI = .950, TLI = .950. Although the χ2 difference test was still significant, Δχ2(74) = 102.136, p = .017, this could be attributable to the relatively large sample size. Also, the fit indices showed only small changes, ΔRMSEA = −.002, ΔCFI = −.002, ΔTLI = −.007, less than the cutoffs suggested by Cheung and Rensvold (2002) and Vandenberg and Lance (2000). Given that the scalar invariance model was more parsimonious, it was chosen as the final model. The factor loadings of this final partial scalar invariance model are shown in Table 3.
Factor Loadings and Standardized Errors for Scalar Invariance Model.
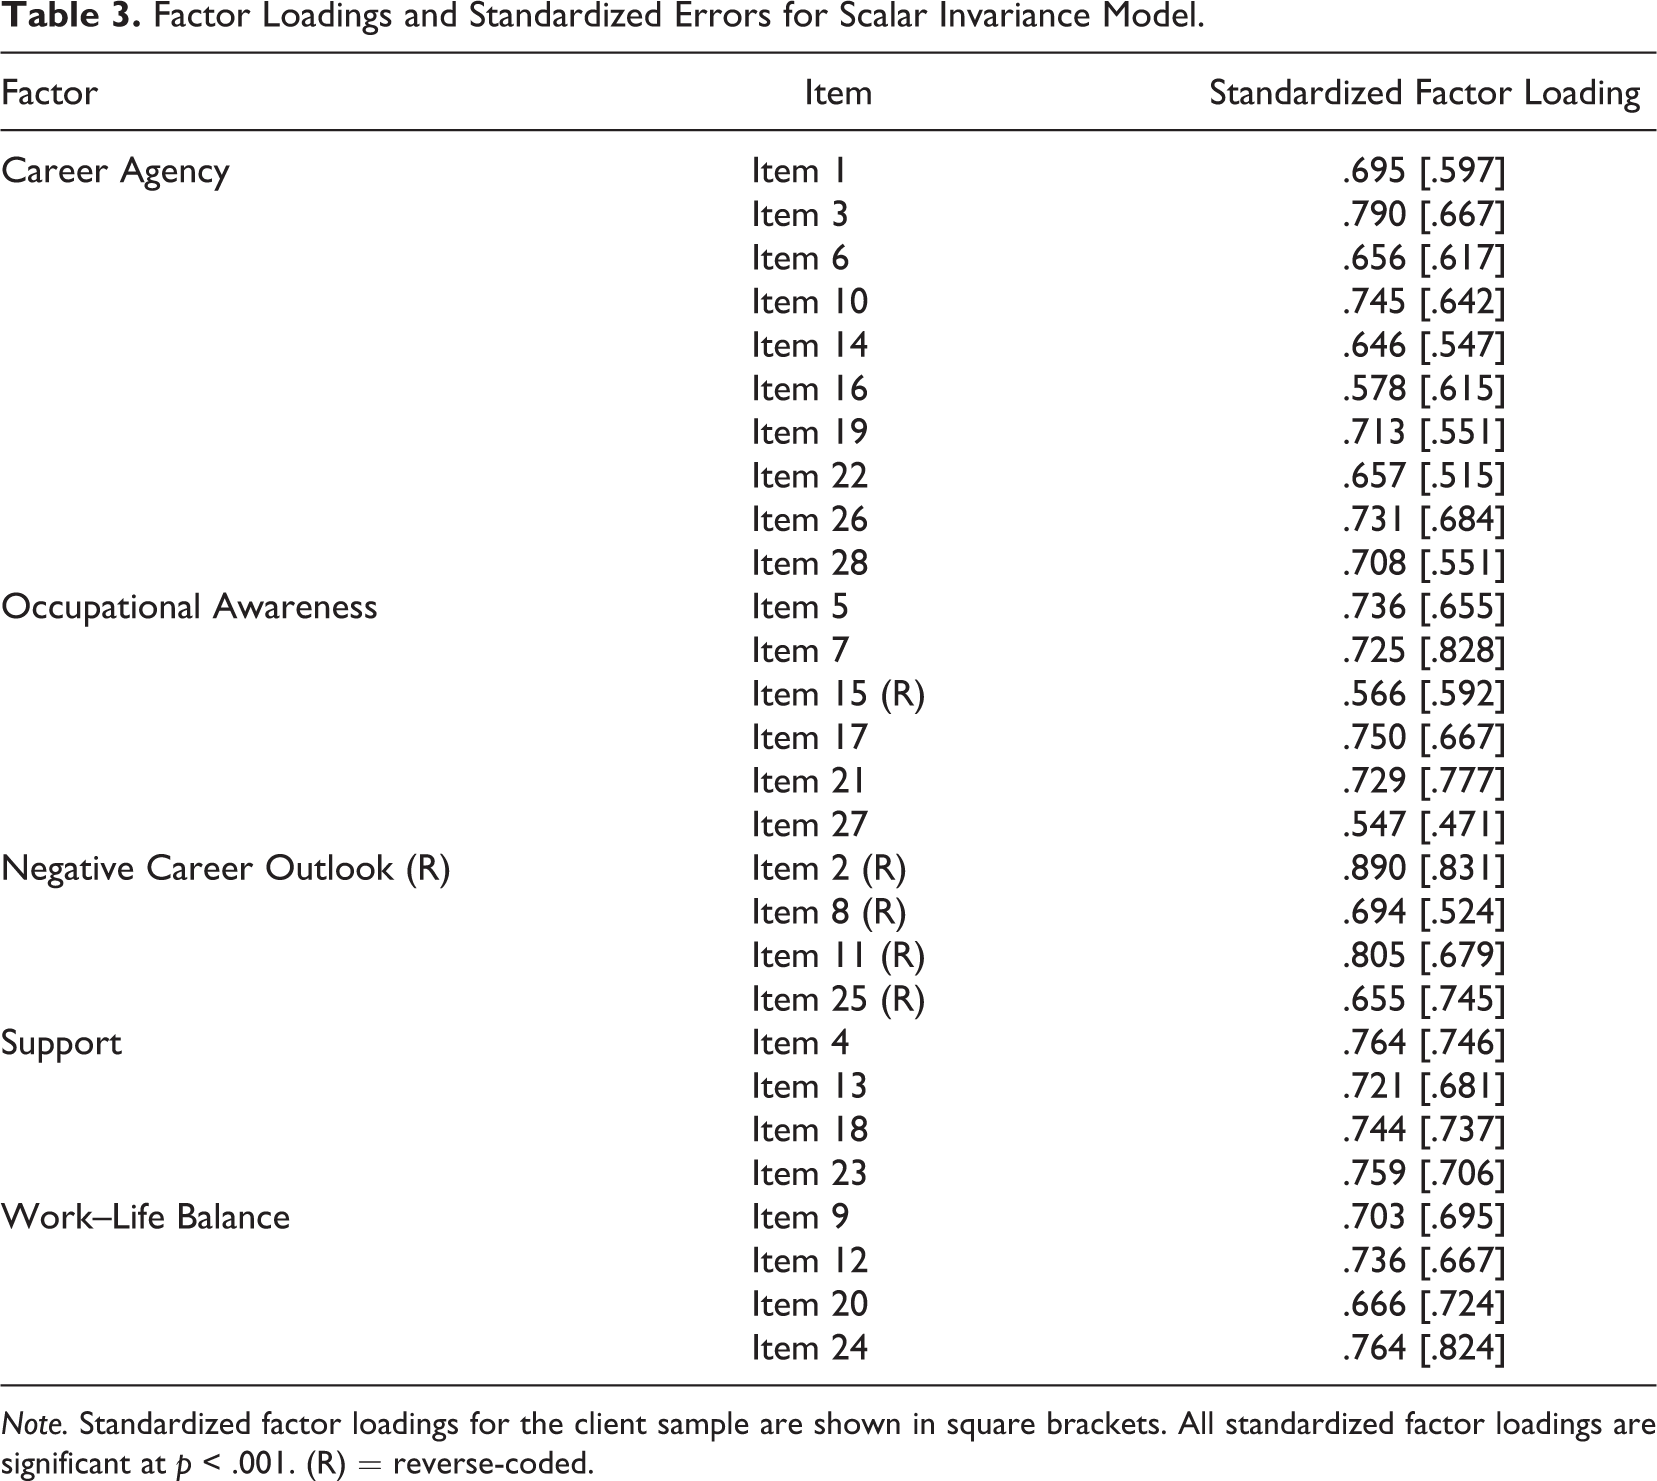
Note. Standardized factor loadings for the client sample are shown in square brackets. All standardized factor loadings are significant at p < .001. (R) = reverse-coded.
The establishment of partial scalar invariance allowed for the comparison between latent means across the two samples. As summarized in Table 4, the clients showed significantly lower latent means than the general students for Career Agency (CR = −5.321, p < .001), Occupational Awareness (CR = −5.968, p < .001), Support (CR = −2.862, p = .004), and Work–Life Balance (CR = −2.417, p = .016). However, there was no significant difference in the latent means for Negative Career Outlook (CR = −0.753, p = .446).
Latent Mean Differences Between General Students and Clients.
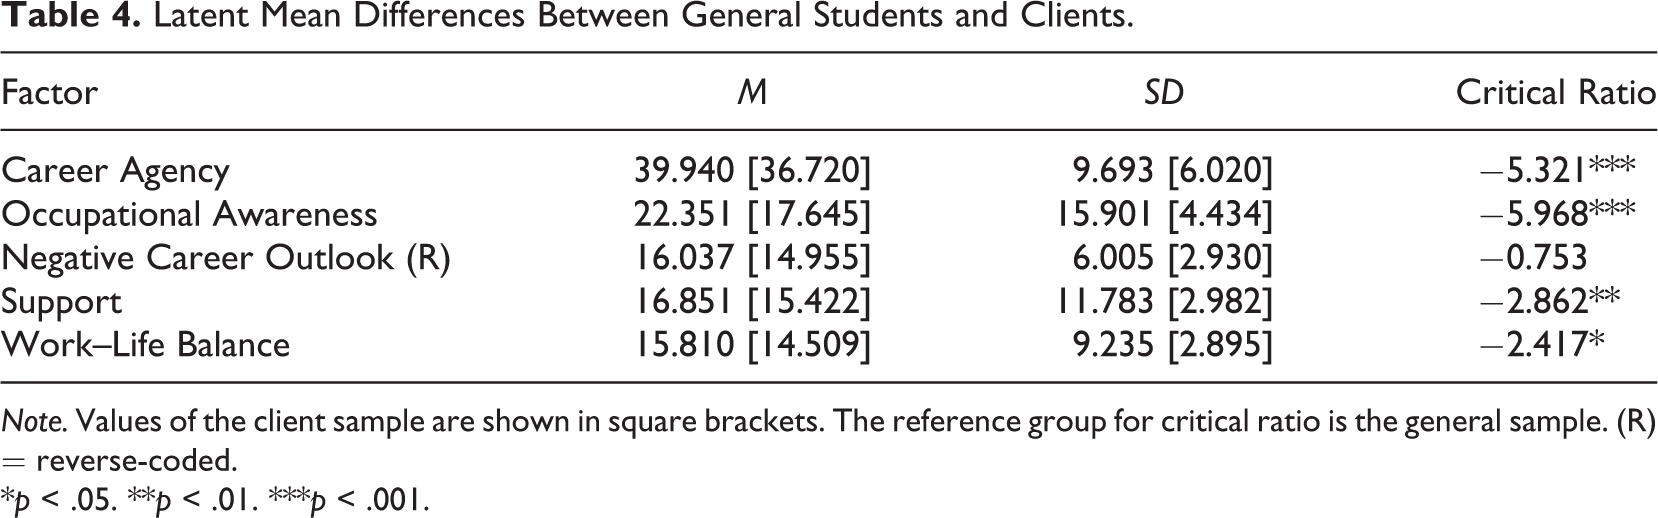
Note. Values of the client sample are shown in square brackets. The reference group for critical ratio is the general sample. (R) = reverse-coded.
*p < .05. **p < .01. ***p < .001.
Discussion
The tests of measurement invariance found that the CFI-R held up for configural invariance, measurement invariance, and partial scalar invariance. The establishment of these increasingly restrictive invariances provides strong additional support for the five-factor structure of CFI-R. The five factors, Career Agency, Occupational Awareness, Negative Career Outlook, Support, and Work–Life Balance, seem to capture important components of career adaptability. Also, the CFI-R items functioned similarly across client and general student groups.
The results suggest that a score on the CFI-R can be regarded as indicating the same level of career adaptability, regardless of whether the person is a client or from the general student population. This means that the CFI-R is equally applicable to both clinical and nonclinical samples, thus allowing for comparison of career adaptability between general and clinical samples. More specifically, the CFI-R could be used as a measure of career outcomes in both research and practice. Career counselors may also consider using this measure to track clients’ progress in various areas of career adaptability. There has been an increasing call within the field of vocational psychology for strengthening and revitalizing the links among theory, research, and practice, especially in order to better meet the demands of the shifting world of work. Increased communication between practitioners and researchers can be a key to this endeavor (Sampson, Bullock-Yowell, Dozier, Osborn, & Lenz, 2017). Shared measures such as the CFI-R can facilitate communication and collaboration between these two groups and bridge the gap between practice and research.
The latent means of clients’ scores were lower than those of the general student sample across four subscales of the CFI-R, Career Agency, Occupational Awareness, Support, and Work–Life Balance. These differences were expected and are evidence of construct validity of CFI-R, given the clients’ indicated need for counseling. Clients, who completed the CFI-R during intake, appear to have generally lower levels of career agency, knowledge of the world of work, social support, and work–life balance. These results suggest that counselors need to examine these four areas and provide appropriate interventions for each concern. For instance, exploration of market trends and general outlook of different occupations can help with increasing occupational awareness, while cognitive reappraisal and evaluation of irrational beliefs may help with developing a higher sense of agency.
In contrast, there was no significant between-groups difference in Negative Career Outlook, which suggests that negative thoughts about future are not a unique concern to the client population. This finding appears to align well with the literature on future perception, which emphasizes the importance of future-oriented beliefs and expectations in career development, especially among adolescents and young adults (e.g., Nurmi, 1991). Therefore, targeting maladaptive and possibly irrational perceptions about the future can be especially important to address with career counseling clients.
The modification process to achieve partial scalar invariance suggests that Item 8, “Thinking about my career frustrates me,” may gauge not only Negative Career Outlook but also Career Agency (Item 19: “I understand my work-related interests”) and Occupational Awareness (Item 15: “I do not understand job market trends”), among clients seeking career counseling. This suggests that feelings of career-related hopelessness could be tied to a sense of not knowing oneself or the world of work. At this point, it is unclear why general students and clients seem to respond to this item differently. It could be that for career counseling clients, these three covarying items could be affected by some underlying factor. For example, different types of goal orientations (e.g., learning, performance-prove, and performance-avoid) were found to have varying relationships with aspects of career adaptability (Creed et al., 2009). Therefore, differences in orientation toward future career goals could have had an effect on how the individuals view these items. Also, as the clinical population tended to report a greater level of psychological concerns such as depression (Erdur-Baker et al., 2006), the clinical group’s general low mood may affect their responses to these items. Further research on differential item functioning, as well as qualitative study of individuals’ interpretations of items (e.g., Stanghellini et al., 2012), may help enlighten how certain populations may respond to certain items differently.
The present study is limited in that both samples were young adults recruited from Midwestern universities. Although such similarity between the samples has the advantage of minimizing other confounding variables other than their client status, it limits the generalizability of the results. Further research with more diverse populations (e.g., employees, adolescents, diverse cultural groups) is needed to ensure the measurement’s applicability to other populations.
In future research, it will be useful to administer the CFI-R to a large sample to create normative data. As the CFI-R is found to be largely invariant across clinical and nonclinical samples, such normative data can provide cutoff scores at which the person is at risk of having low career adaptability. This will enable the CFI-R to be used in various settings, such as university counseling centers, as a screening tool to see whether potential clients may benefit from career counseling. As stated earlier, such effort to link research to practice is much needed in the current field of vocational psychology (Sampson et al., 2017).
A measure with sound psychometric properties can facilitate the advancement of research in a given field. Over the years, many measures have been developed in the field of vocational psychology and then subsequently applied to studies with diverse populations. However, it is dangerous to blindly assume that a measure developed with a sample will be generalizable to another sample with different characteristics. Therefore, a test of measurement invariance is needed to ensure that the measure holds up equally across multiple groups (Vandenberg & Lance, 2000). A particularly significant aspect of the present study is that it tested this property of the CFI-R, a widely used measure of career adaptability, with client and general samples. Career adaptability is an integral part of people’s ability to navigate the changing world of work. It is our hope that the present study will prompt further research on this important aspect of career development and also establishment of measurement invariance across populations.
Footnotes
Appendix
Declaration of Conflicting Interests
The author(s) declared no potential conflicts of interest with respect to the research, authorship, and/or publication of this article.
Funding
The author(s) received no financial support for the research, authorship, and/or publication of this article.