
Abstract
Background
Accurate assessment of tumor proliferation is vital for grading breast cancers, which impacts prognosis. Phosphohistone H3 (PHH3) is a mitotic figure-specific immunohistochemical (IHC) marker. This study aims to evaluate the utility of PHH3 in detecting mitotic figures in invasive breast carcinoma in comparison to the conventional counting on hematoxylin and eosin (H&E) slides and its correlation with Ki-67 index, histological grade, and other clinicopathological parameters.
Materials and methods
The study was conducted on 100 mastectomy specimens with breast cancers. Tumors were graded using the Nottingham grading system. IHC staining was performed for PHH3 and Ki-67.
Results
In 40% of specimens, the PHH3 score was elevated (>13 mitotic figures per 10 HPF). PHH3 identified significantly higher mitotic figures than conventional H&E (14 vs 7/10 HPF) and this led to a shift toward higher grades. By H&E, 41% of tumors were grade 2, 40% grade 1, and 19% grade 3. After the PHH3 reassessment, grade 1 dropped to 34%, while grade 3 rose to 31%. PHH3 score significantly correlated with mitotic score on H&E (p < 0.001), nuclear pleomorphism (p = 0.008), tumor grade (p < 0.001), and Ki-67 index (r = 0.534, p < 0.001). Cohen's kappa value was 0.194 for H&E (poor agreement) and 0.463 for PHH3 (moderate agreement), indicating improved inter-observer concordance with PHH3.
Conclusion
By highlighting the mitotic figures, PHH3 identified increased mitotic figures resulting in the upgrading of tumors. Its incorporation into routine practice may aid in accurate tumor grading and precise prognostic stratification.
Introduction
Worldwide, breast cancer is the most common cancer, accounting for approximately 11.7% of total malignancies. The number is steadily increasing. It forms 13.5% of cancers in women and about 10.6% of cancer-related fatalities in women are attributed to breast cancer. Survival outcomes are significantly poorer in patients who present with advanced-stage disease. 1 Precise histopathological grading of breast carcinoma plays a key role in predicting prognosis and informing treatment strategies. The Nottingham histologic grading system which evaluates tubule formation, nuclear pleomorphism, and mitotic activity remains the most widely used method for assessing invasive breast carcinoma. 2
During the M phase of the cell cycle, mitotic figures occur as a highly regulated mechanism, and mitotic figures are visualized in histological sections using hematoxylin and eosin (H&E) with light microscopy. 3 However the conventional approach is limited by interpretational variability, microscope field size discrepancies, and technical inconsistencies, all of which affect reproducibility and diagnostic precision. 4 Ki-67 marks the nuclei of cells that are in the active stages of the cell cycle namely G1, S, G2, and M phases serving as an indicator of tumor proliferative activity and is widely recognized as prognostic and predictive marker. 5 However, Ki-67 is prone to technical and interpretive inconsistencies due to lack of standardized scoring protocols, especially in tumors with heterogeneous staining. 6 Phosphohistone H3 (PHH3) is a mitotic figures specific immunohistochemical marker which highlights phosphorylated histone H3 during late G2 to M phase, peaking in metaphase and fading by telophase. This selectivity makes PHH3 a reliable tool for detecting mitotic figures in tumor cells. 7
PHH3-based studies are limited in literature, and many are focussed on various other organ malignancies. Its comparative evaluation in mitotic figure counting with conventional H&E, Ki-67 and their correlation with clinicopathological parameters in breast cancers are seldom reported. So, our study aims to study the utility of PHH3 in the evaluation of mitotic figures in breast carcinoma, in comparison with conventional counting on H&E along with its impact on grading of the tumors and established prognostic indicators.
Materials and Methods
Study Design and Specimen Selection
This study included collection of 100 tumors (January 2022–October 2024) of invasive breast carcinoma diagnosed on mastectomy specimens. Institutional Ethics Committee (number IEC KMC MLR 05/2023/224) approval was obtained. Informed consent was not required. The study was conducted in compliance with the principles of the Declaration of Helsinki (2008).
A total of 120 mastectomy specimens diagnosed with invasive breast carcinoma were initially identified for inclusion in the study. Specimens from patients who had received neoadjuvant chemotherapy and exhibited no residual tumor (n = 10) were excluded. Specimens lacking available tissue blocks for immunohistochemistry analysis (n = 8) were also excluded. Additionally, specimens with suboptimal fixation that compromised histologic or immunohistochemical quality (n = 2) were removed from consideration. Following the application of these criteria, 100 specimens remained for further analysis.
Histopathologic Evaluation
Archived formalin fixed, paraffin embedded tissue blocks and H&E slides were retrieved. Faded slides were restained as needed. All slides were independently reviewed by two pathologists. Slides were assessed for tumor architecture, invasion pattern, and grade. Mitotic figure counting was done in 10 consecutive high-power fields, approximating in an area of 2 mm2
The histopathologic parameters were documented following the College of American Pathologists protocol. 8 Tumor grading was performed according to the Nottingham grading system. This includes tubule formation, nuclear pleomorphism, and mitotic activity. Pathologic staging was done using the American Joint Committee on Cancer/Tumor, Node, Metastasis classification staging system. 8 The Nottingham prognostic index was calculated using the formula: Nottingham prognostic index = (0.2 × Tumor size in cm) + lymph node score + grade score. Patients were categorized into the following prognostic groups based on Nottingham prognostic index score: group 1: excellent prognosis (≤2.4); group 2: good prognosis (2.41-3.4); group 3: moderate prognosis (3.41-5.4); group 4: poor prognosis (>5.4). 9
Immunohistochemistry
Immunohistochemistry was performed for PHH3 and Ki-67 on representative tumor blocks. Sections of 3 to 4 µm thickness were cut and mounted on poly-
The Ki-67 index was calculated as percentage of positively stained nuclei among total tumor nuclei in the hotspots. Tumors were stratified into low (Ki-67 < 14%) and high (Ki-67 ≥ 14%) proliferation categories to distinguish luminal A like from luminal B like breast cancers, based on the recommendations from 2011 St. Gallen International Consensus. 10 For PHH3 analysis the most mitotically active areas were selected, and positively stained mitotic figures were counted in 10 high-power fields (HPF) (2 mm2). Cells showing faint or granular nuclear staining were excluded.
The scoring criteria for mitotic counts on H&E-stained sections were based on the Nottingham histologic grading system, as recommended by the College of American Pathologists protocol guidelines for reporting breast cancers. PHH3, as a mitotic marker, was scored using similar criteria. 8 This is described in Table 1. PHH3 expression was further classified as low PHH3 expression (≤13 mitotic figures/10 HPF) and high PHH3 expression (>13 mitotic figures/10 HPF) based on the recommendations from the previous studies.9,11
Scoring Criteria for Mitotic Activity, PHH3 Expression, and Ki-67 index.
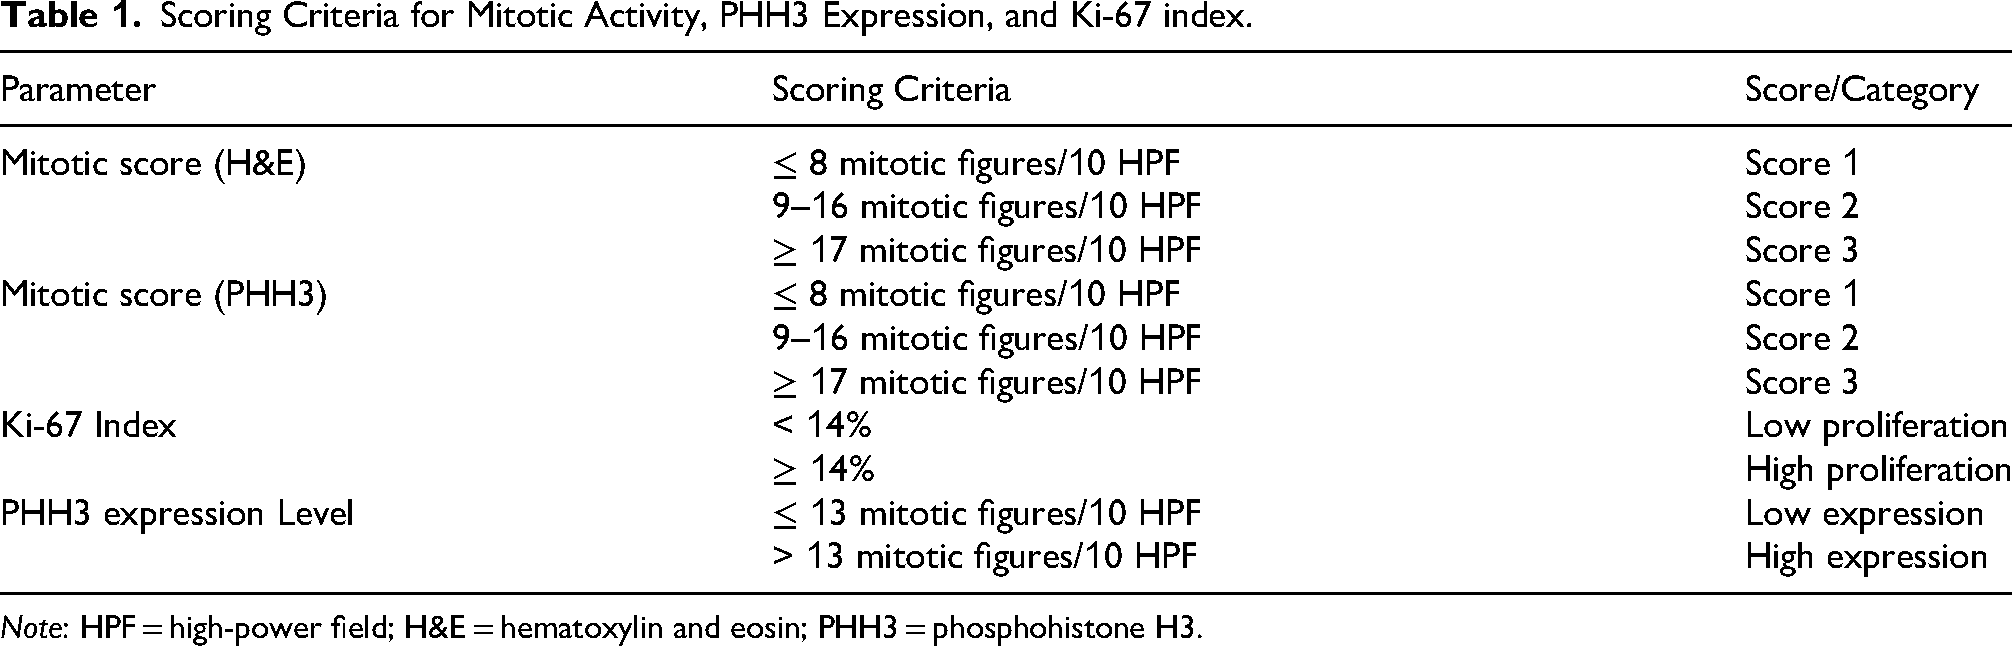
Note: HPF = high-power field; H&E = hematoxylin and eosin; PHH3 = phosphohistone H3.
Statistical Analysis
For categorical data frequency and percentage was calculated. Median and inter quartile range were calculated for quantitative data. Comparison of categorical variables was performed by Chi-squared test and Fisher's exact test. Karl Pearson correlation coefficient analysis was performed to determine the correlation between the variables. SPSS23 software was used for analysing the data. A p value of <0.05 was considered statistically significant. The inter-observer variability between the two pathologists was assessed by comparing independent mitotic counts on H&E and PHH3 scoring results. Cohen's kappa statistic was calculated to determine the level of agreement. Kappa values were interpreted as follows: <0.20 = poor, 0.21–0.40 = fair, 0.41–0.60 = moderate, 0.61–0.80 = substantial, and >0.80 = almost perfect agreement. 12
Results
Among 100 patients, age range was between 23 and 76 years, and mean age was 53 years. Based on tumor size (T stage), most patients were categorized as T2 stage, (59 patients, 59%), followed by T3 stage (29 patients, 29%) and T1 stage (12 patients, 12%). The predominant histological type was invasive ductal carcinoma, no special type observed in 95 patients (95%).
Association of Clinicopathologic Parameters With PHH3 Expression
Out of the 100 specimens analyzed, 40 specimens (40%) exhibited high PHH3 expression (more than 13 mitotic figures per 10 HPF), while 60 specimens (60%) had low PHH3 expression (less than 13 mitotic figures per 10 HPF). No statistically significant association was observed between PHH3 expression and various parameters such as age, type of surgery, tumor size, tumor focality, T stage, nodal stage, lymphovascular invasion, or histologic subtype. However, PHH3 expression showed a significant correlation with nuclear pleomorphism (p = 0.008) and tubule formation (p = 0.019) (Table 2).
Association of PHH3 Expression With Clinicopathologic Parameters in Breast Carcinoma (n = 100).
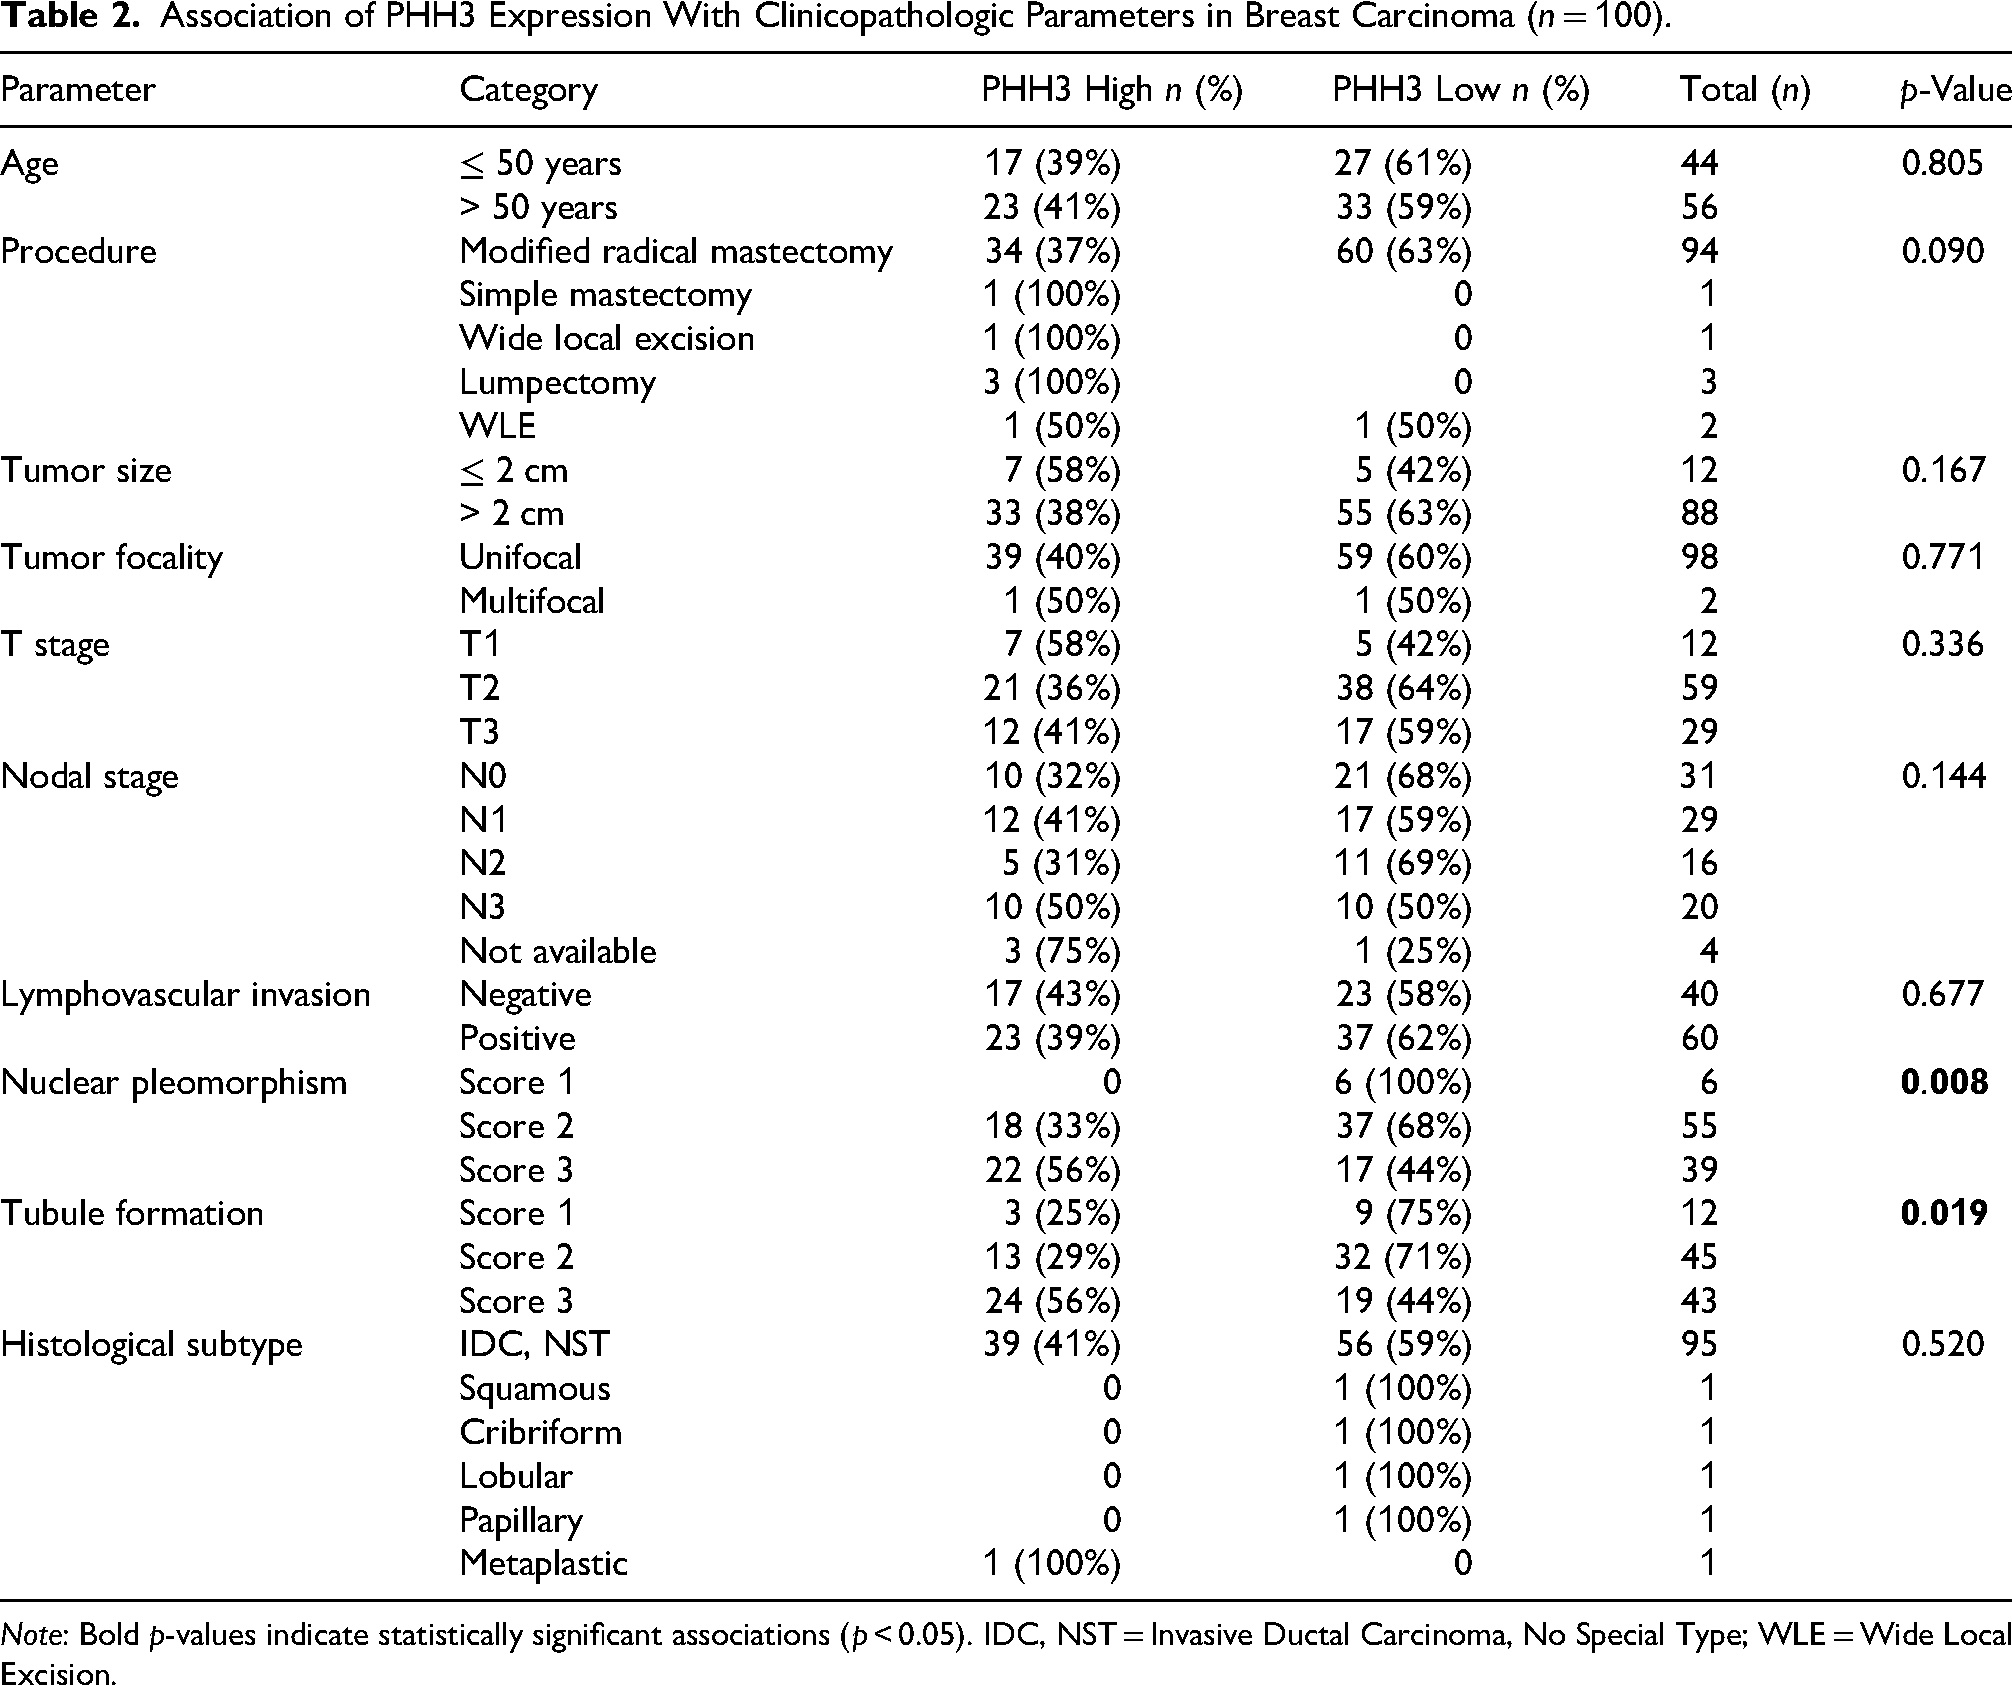
Note: Bold p-values indicate statistically significant associations (p < 0.05). IDC, NST = Invasive Ductal Carcinoma, No Special Type; WLE = Wide Local Excision.
Association of Mitotic Scores (H&E, PHH3), Tumor Grades, Ki-67 Index, and Prognostic Index
Among the 100 specimens analyzed, the mitotic score assessed on H&E-stained sections revealed that most tumors (70%) had a score of 1. Using the Nottingham histologic grading system, most tumors were grade 2 (41%); grade 1 accounted for 40%, and grade 3 tumors accounted for 19% of the cohort. In contrast, the mitotic score assessed by PHH3 showed a higher proportion of tumors with elevated mitotic activity: Score 3 in 27% of specimens compared to 13% with H&E. Correspondingly, tumor grading based on PHH3-derived mitotic scores showed a shift toward higher grades, with grade 1 tumors comprising 34%, grade 2 tumors 35%, and grade 3 tumors 31% (Figures 1 and 2). PHH3 expression was categorized as high in 40% (>13 mitotic figures per 10 HPF) and low in 60% (<13 mitotic figures per 10 HPF) of the breast carcinoma specimens. The mean mitotic figure count using PHH3 was 14 per 10 HPF, notably higher than that observed with H&E staining (7 per 10 HPF) (Table 3).
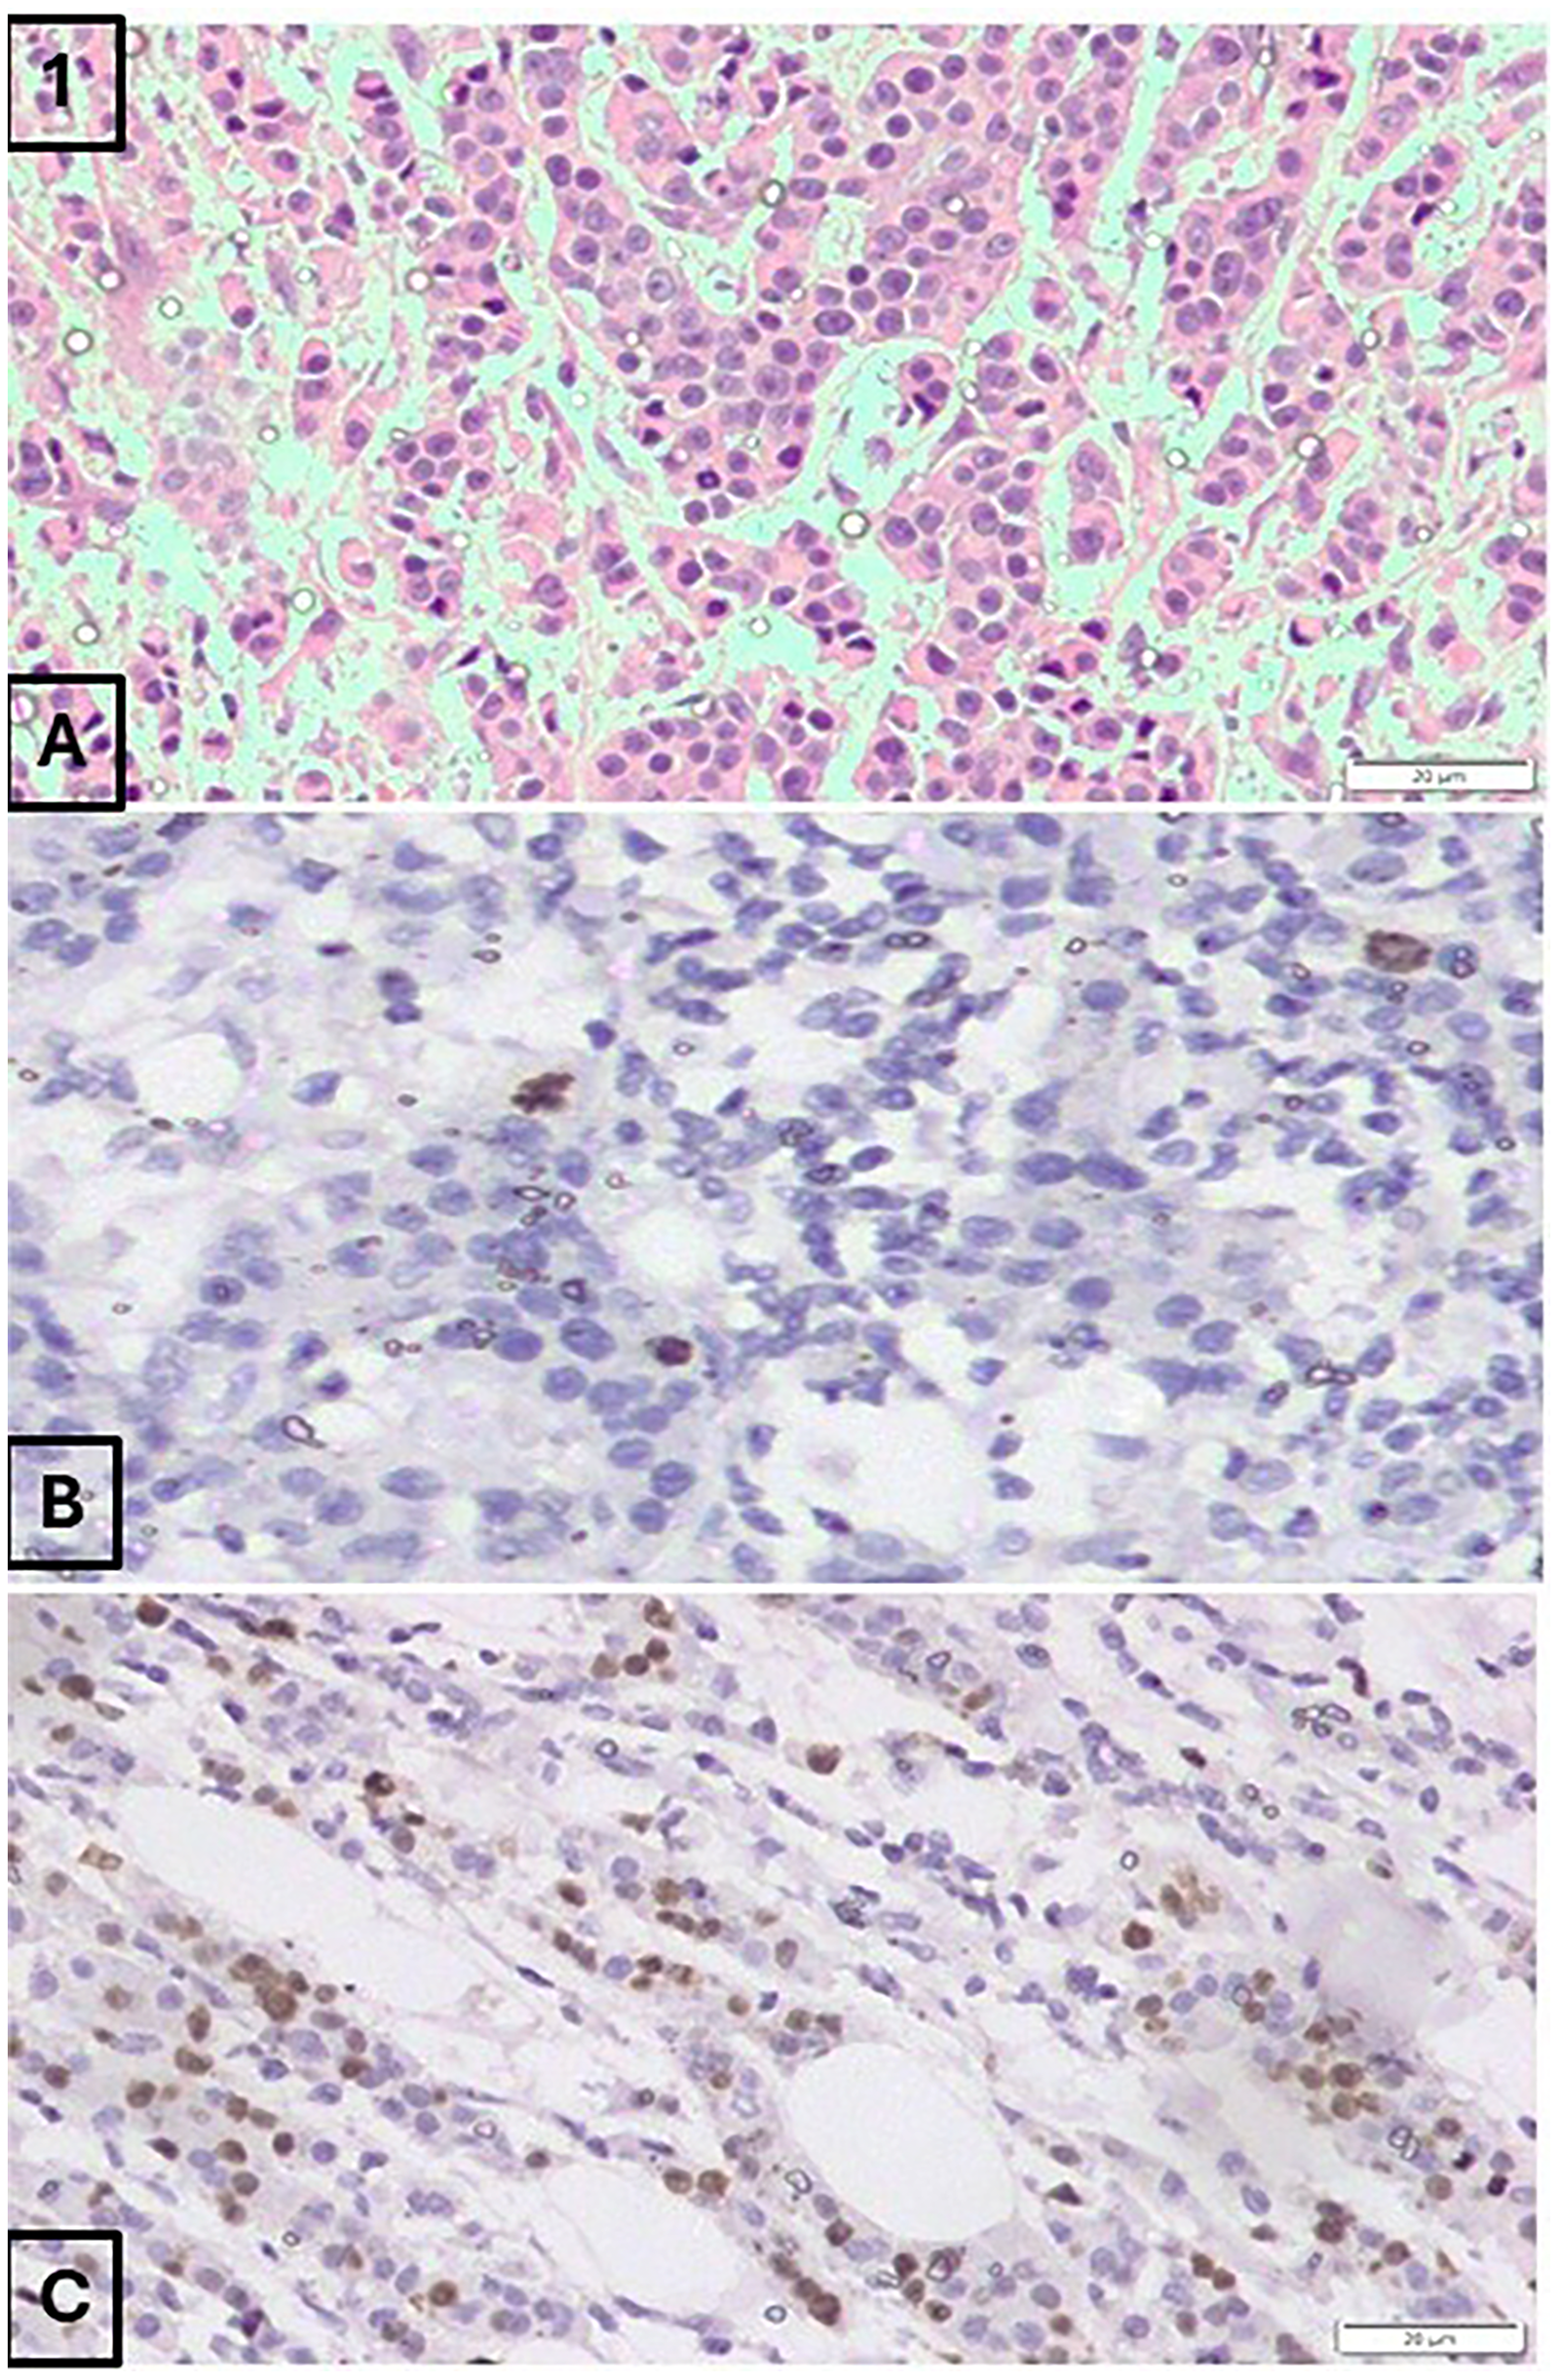
(A) Invasive ductal carcinoma specimen displaying a mitotic score of 1 (5 mitotic figures per 10 high-power fields) on H&E staining (200×). (B) The same specimen stained with PHH3 reveals a higher mitotic count, corresponding to a mitotic score of 2 (14 mitotic figures per 10 high-power fields) (200×). (C) Ki-67 immunostaining of the same tumor shows a proliferative index of 30% (200×). This tumor was upgraded from histologic grade 1 to grade 2 based on the PHH3 findings.
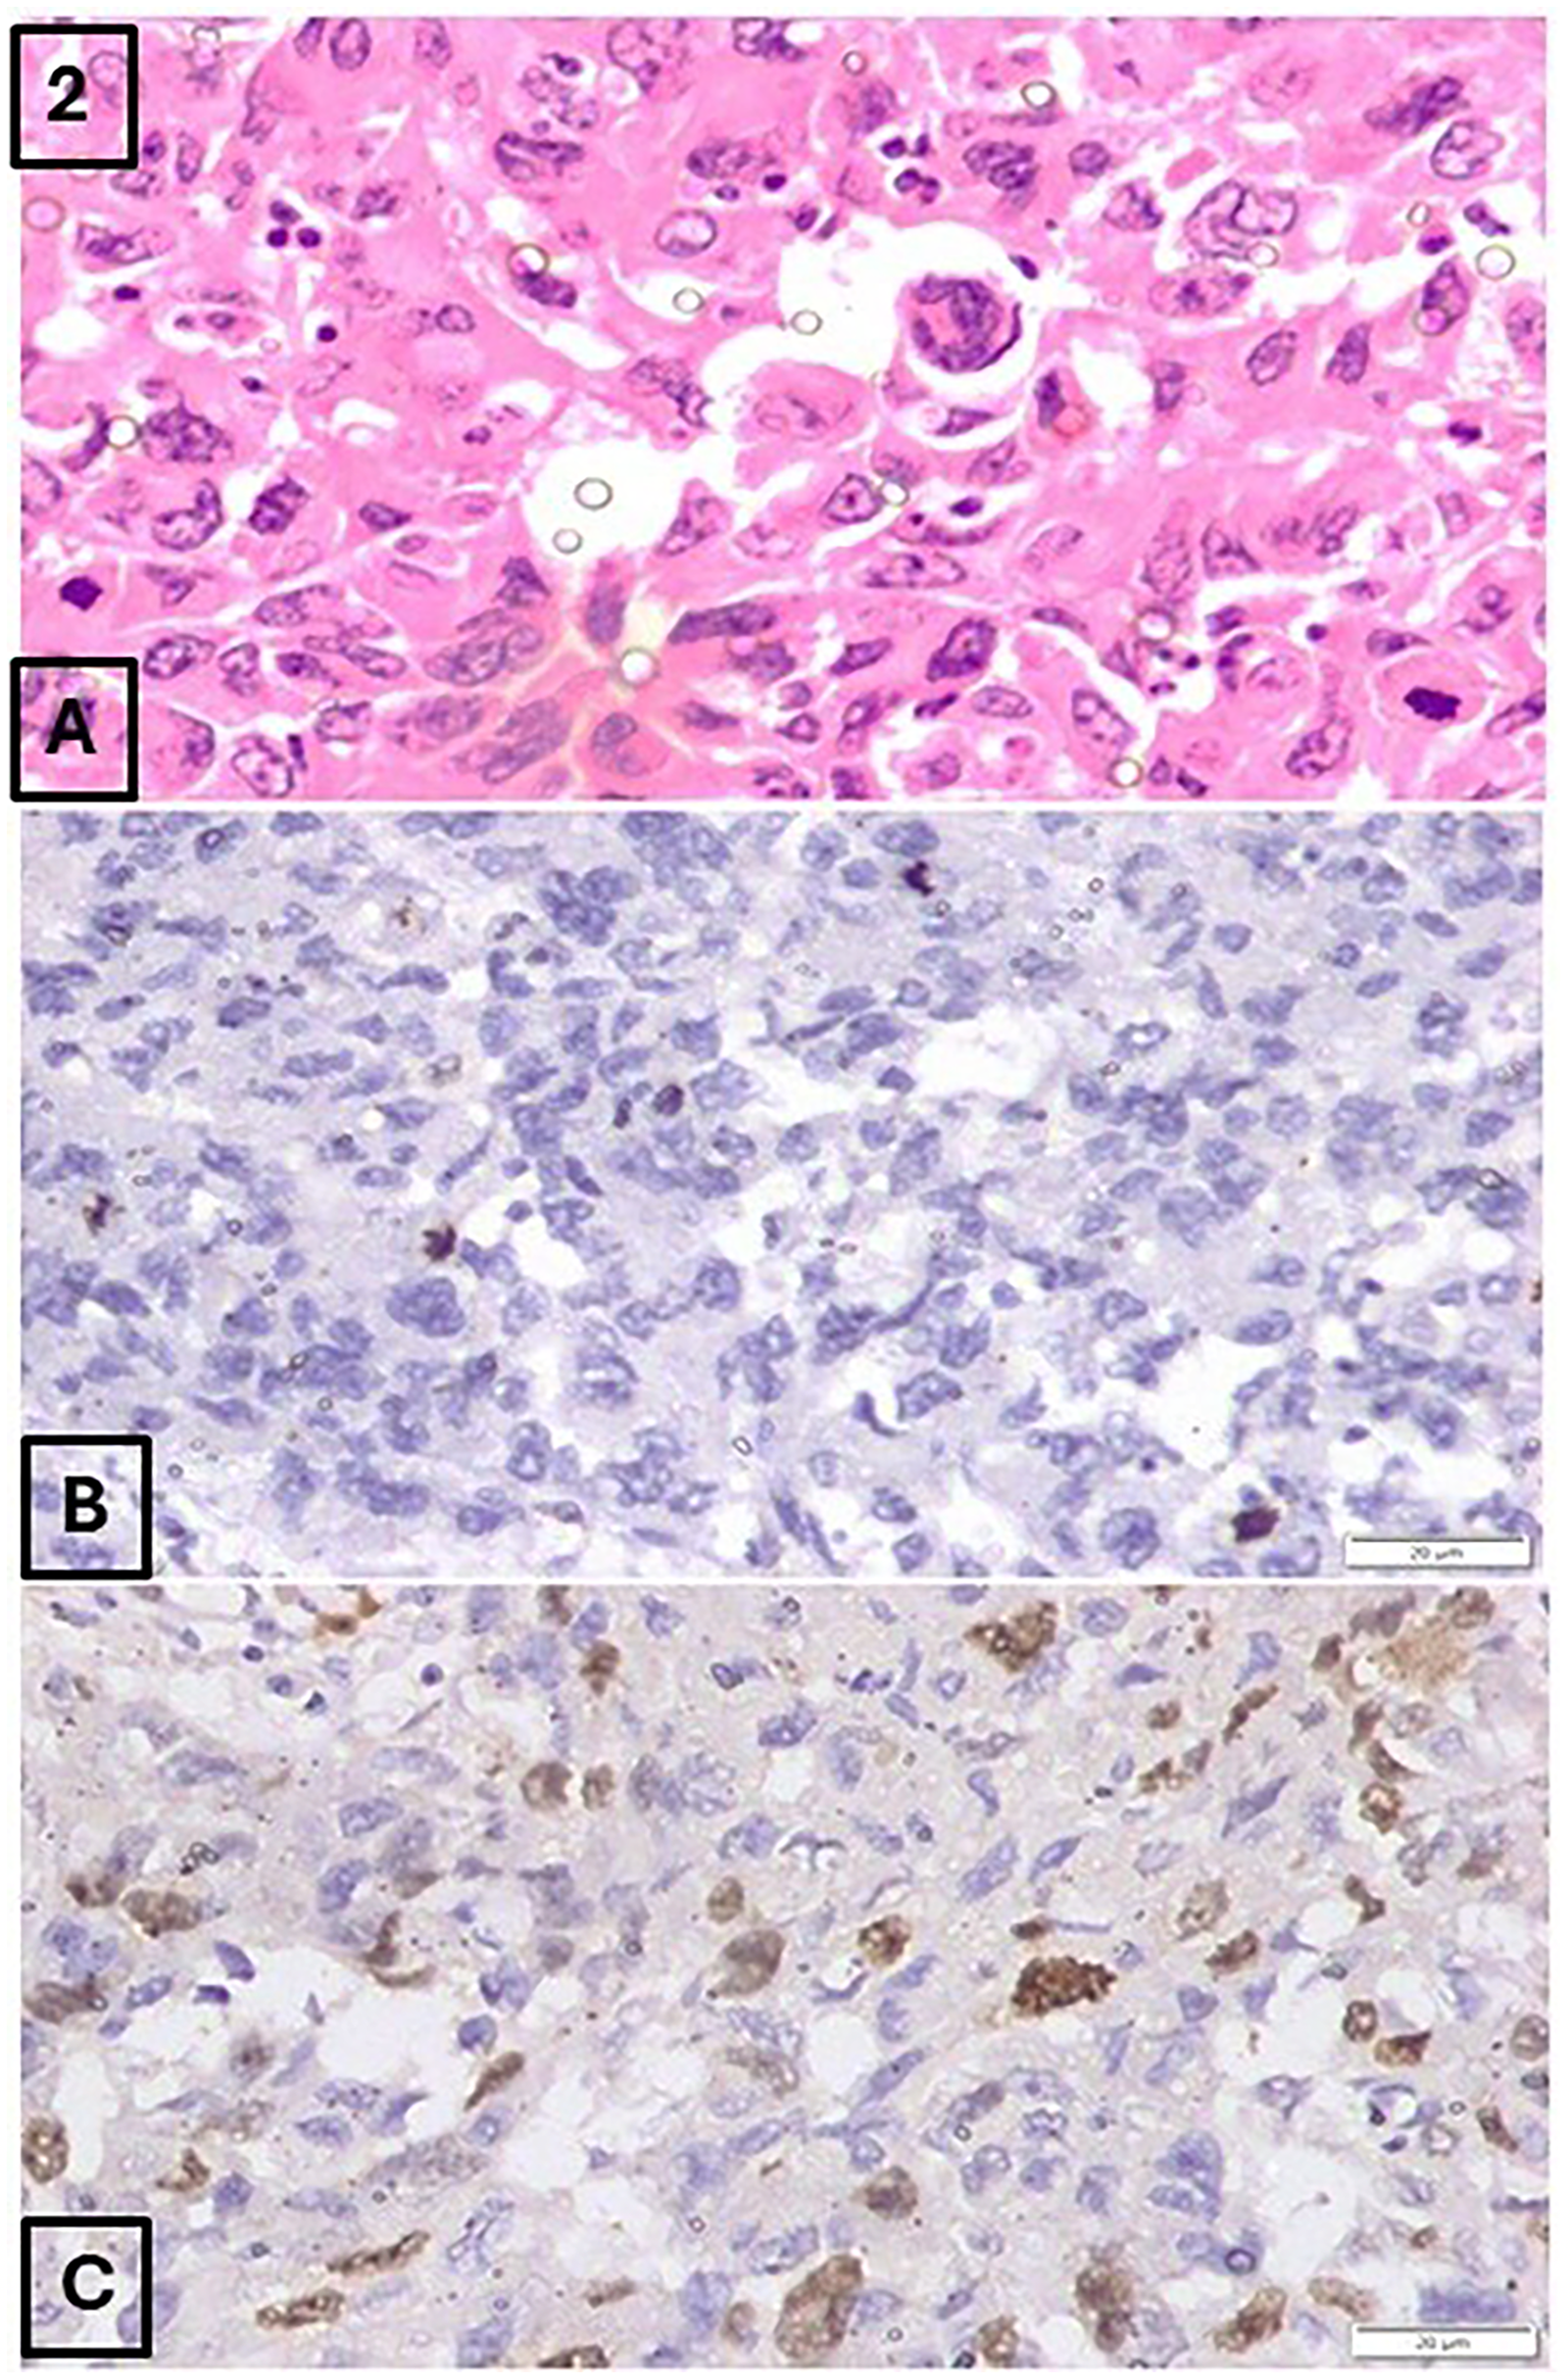
(A) Invasive ductal carcinoma specimen exhibiting a mitotic score of 2 (11 mitotic figures per 10 high-power fields) on H&E staining (200×). (B) PHH3 staining of the same specimen revealed an increased mitotic count, corresponding to a mitotic score of 3 (18 mitotic figures per 10 high-power fields) (200×). (C) Ki-67 immunostaining demonstrated a proliferation index of 46% (200×). This tumor was upgraded from histologic grade 2 (based on H&E) to grade 3 following PHH3 assessment.
Distribution of Mitotic Scores (H&E, PHH3), Tumor Grades, Ki-67 Index, and Prognostic Index (n = 100).
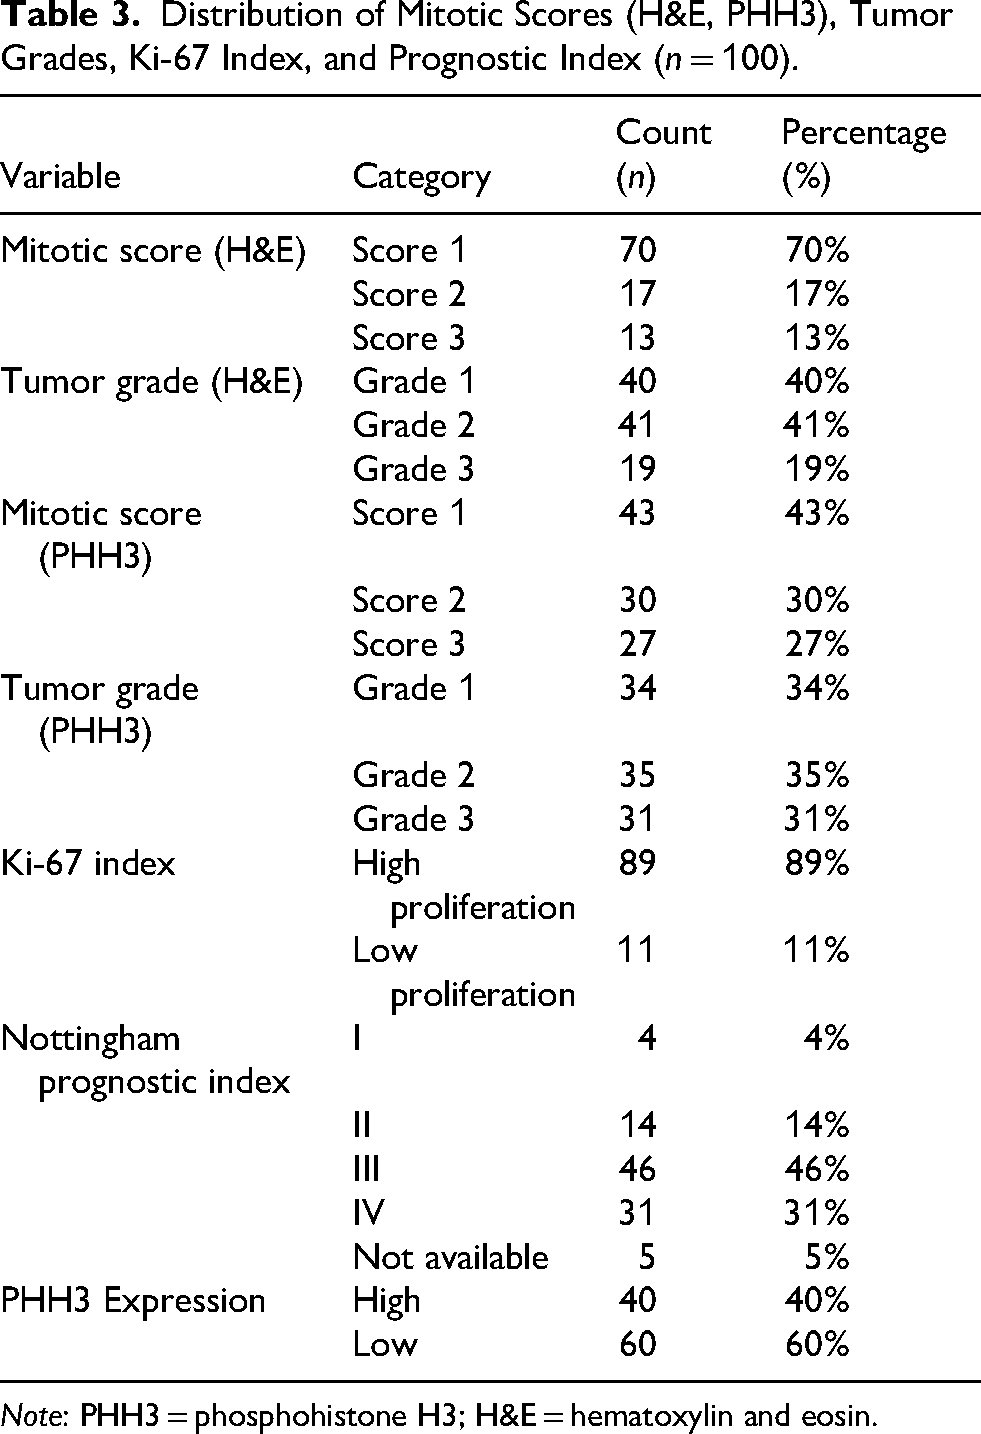
Note: PHH3 = phosphohistone H3; H&E = hematoxylin and eosin.
Ki-67 proliferation index revealed high proliferation (≥14%) in 89% of specimens, and only 11% were categorized as low proliferative tumors (Table 3). According to the Nottingham prognostic index, the largest subset of tumors was classified as group III (46%) (Table 3).
Among specimens with a low mitotic score on H&E (Score 1), the majority (73%) exhibited low PHH3 expression, whereas 92% of specimens with a high mitotic score (Score 3) showed high PHH3 expression (p < 0.001). On H&E grading, high PHH3 expression was observed in only 15% of grade 1 tumors, compared to 79% in grade 3 tumors (p < 0.001). In PHH3-based tumor grading, higher PHH3 was observed in 87% of grade 3 tumors, compared to only 6% in grade 1 tumors (p < 0.001) (Table 4).
Association of PHH3 Expression With Histologic Grade, Mitotic Score, Ki-67 Index, and Prognostic Index (n = 100).
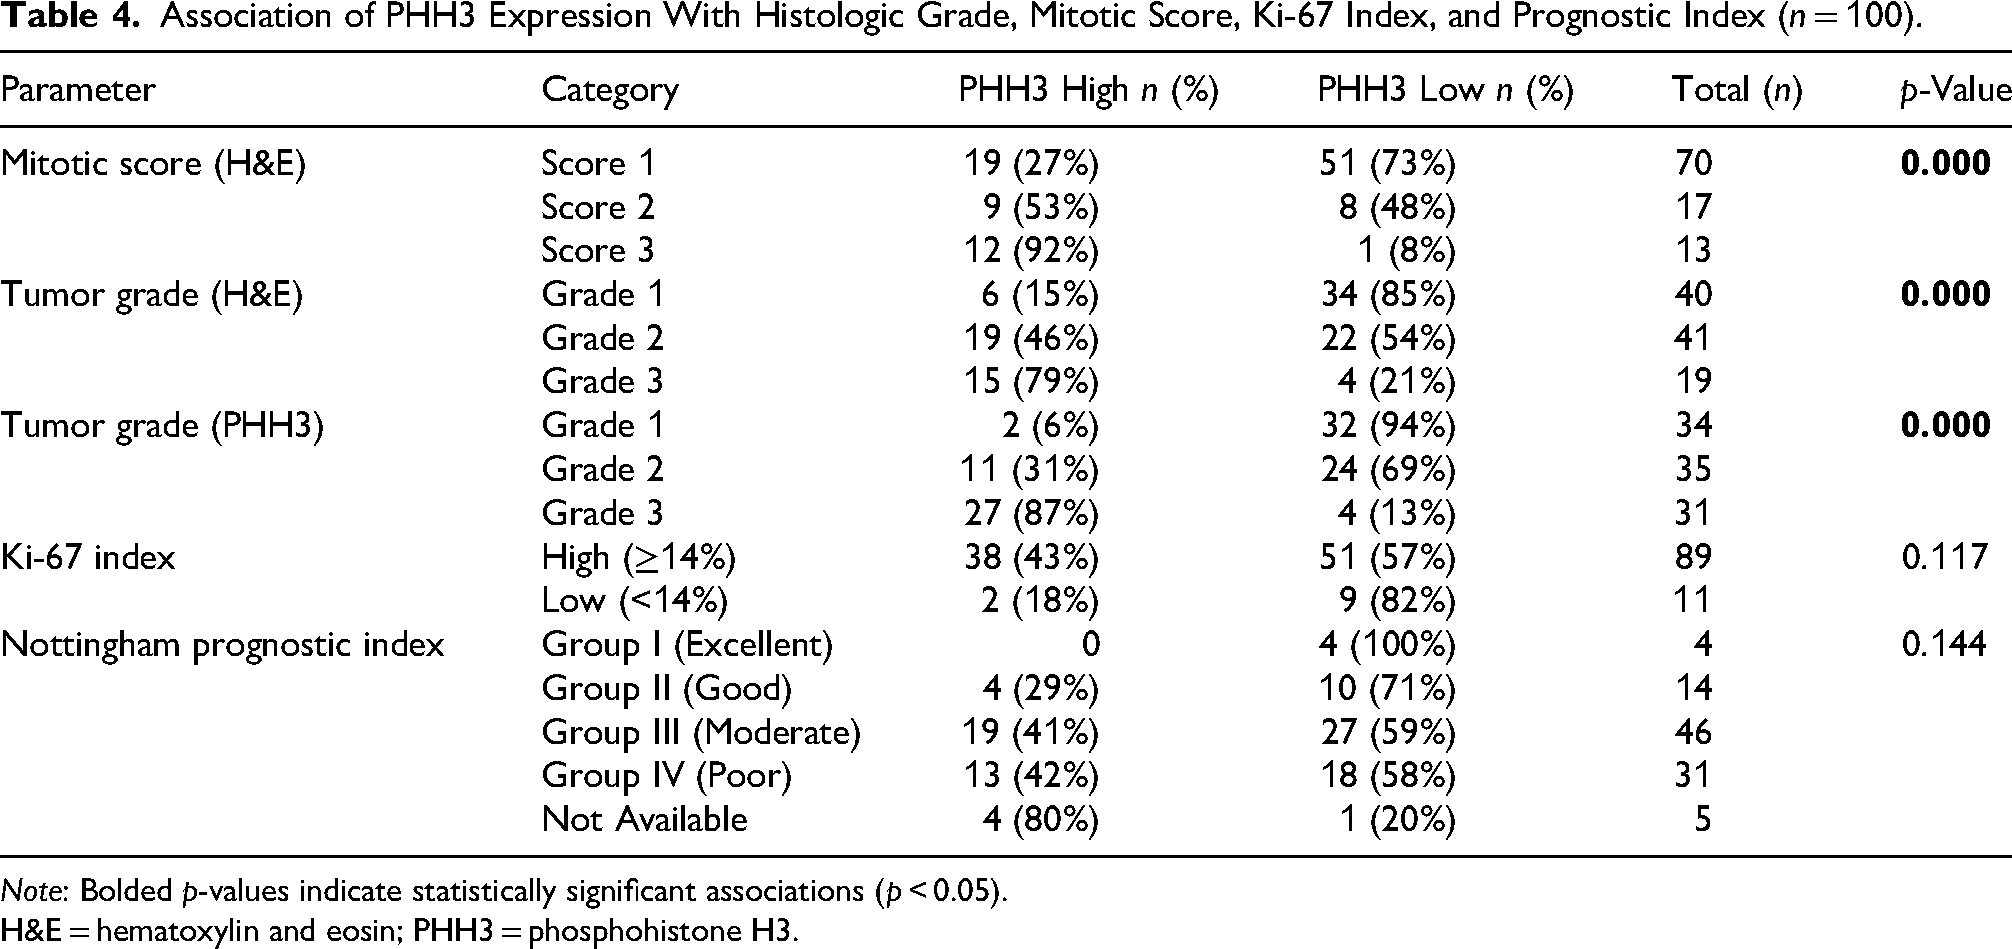
Note: Bolded p-values indicate statistically significant associations (p < 0.05).
H&E = hematoxylin and eosin; PHH3 = phosphohistone H3.
The Ki-67 proliferation index did not show a statistically significant association with PHH3 expression (p = 0.117), although a trend was noted with 43% of high Ki-67 index tumors showing high PHH3 positivity versus 18% in the low Ki-67 group. Pearson correlation analysis showed a significant positive correlation between Ki-67 index and PHH3 mitotic count (r = 0.525, p < 0.001), indicating that tumors with higher mitotic activity, as detected by PHH3, also had higher proliferative activity as assessed by Ki-67. PHH3-based tumor grade also correlated well with Ki-67 index (r = 0.533, p < 0.001) (Table 5).
Correlation Between PHH3, Mitotic Score, Nuclear Pleomorphism, Histological Grade, and Ki-67 index.
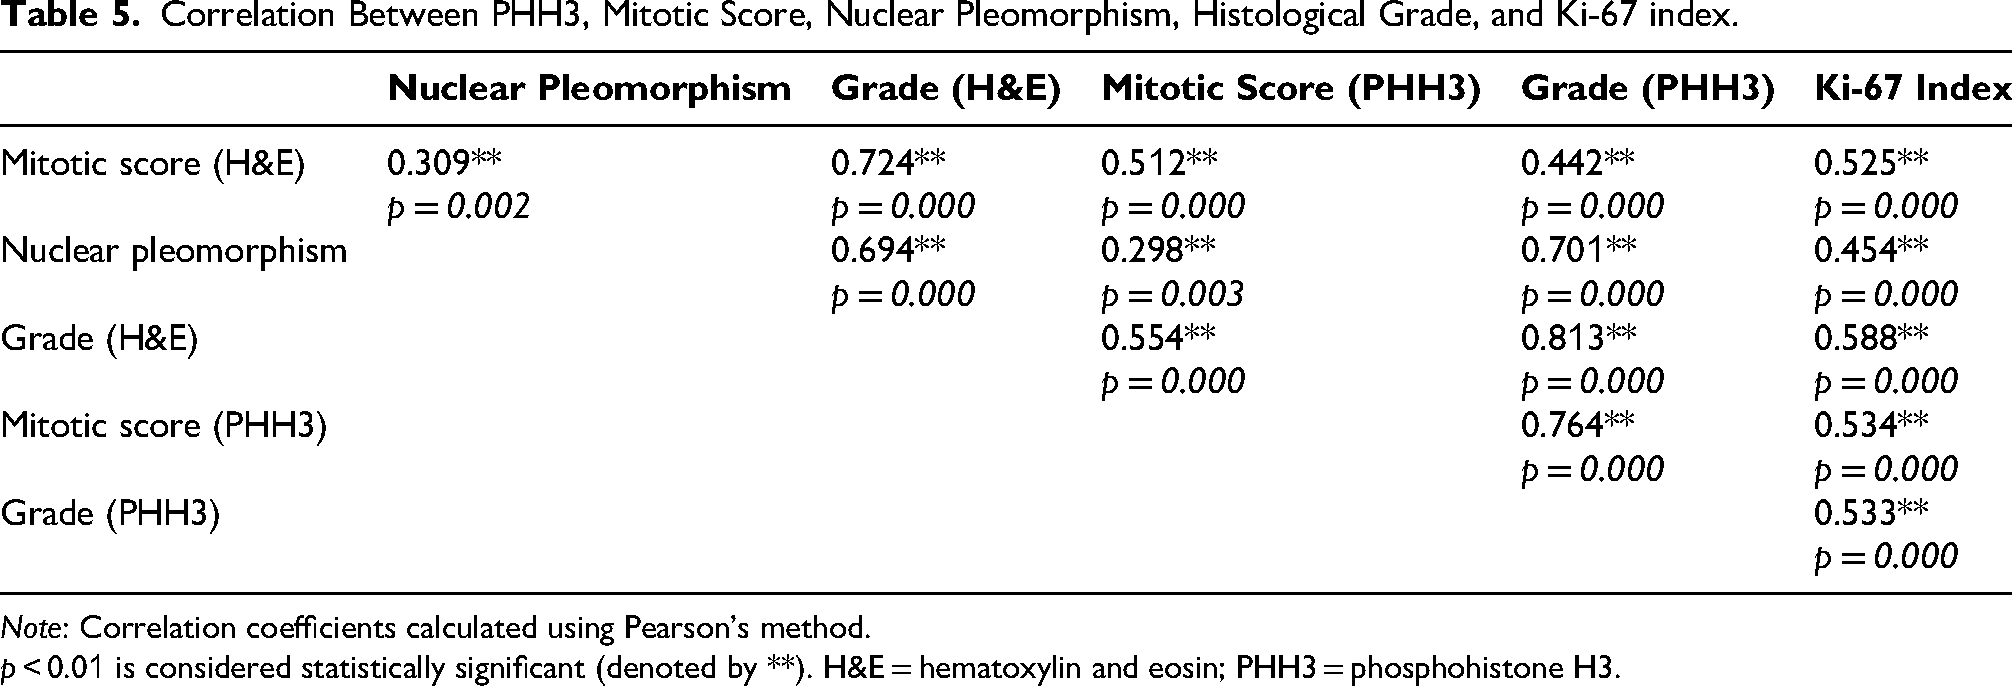
Note: Correlation coefficients calculated using Pearson's method.
p < 0.01 is considered statistically significant (denoted by **). H&E = hematoxylin and eosin; PHH3 = phosphohistone H3.
Analysis of the Nottingham prognostic index showed no statistically significant correlation with PHH3 expression (p = 0.144), although high PHH3 expression was more common in moderate and poor prognosis groups (41% and 42%, respectively) compared to the excellent prognosis group (0%). Overall, PHH3 expression demonstrated a strong and statistically significant association with mitotic score on H&E and tumor grade.
Correlation of PHH3 With ER, PR, HER2 Status, Molecular Subtyping, and Triple-Negative Status
Out of 100 specimens, stains for ER, PR and HER2 were not done for 7 specimens. The remaining 93 specimens were analyzed for ER, PR and HER2 expression in correlation with PHH3 (Table 6). No statistically significant correlation was found between PHH3 expression and ER status (p = 0.354) or PR status (p = 0.435). Similarly, there was no significant association between HER2 status and PHH3 expression (p = 0.356) (Table 6).
Correlation of PHH3 Expression With Estrogen Receptor, Progesterone Receptor and Human Epidermal Growth Factor Receptor 2 Status, Triple Negative Status, and Molecular Subtypes.
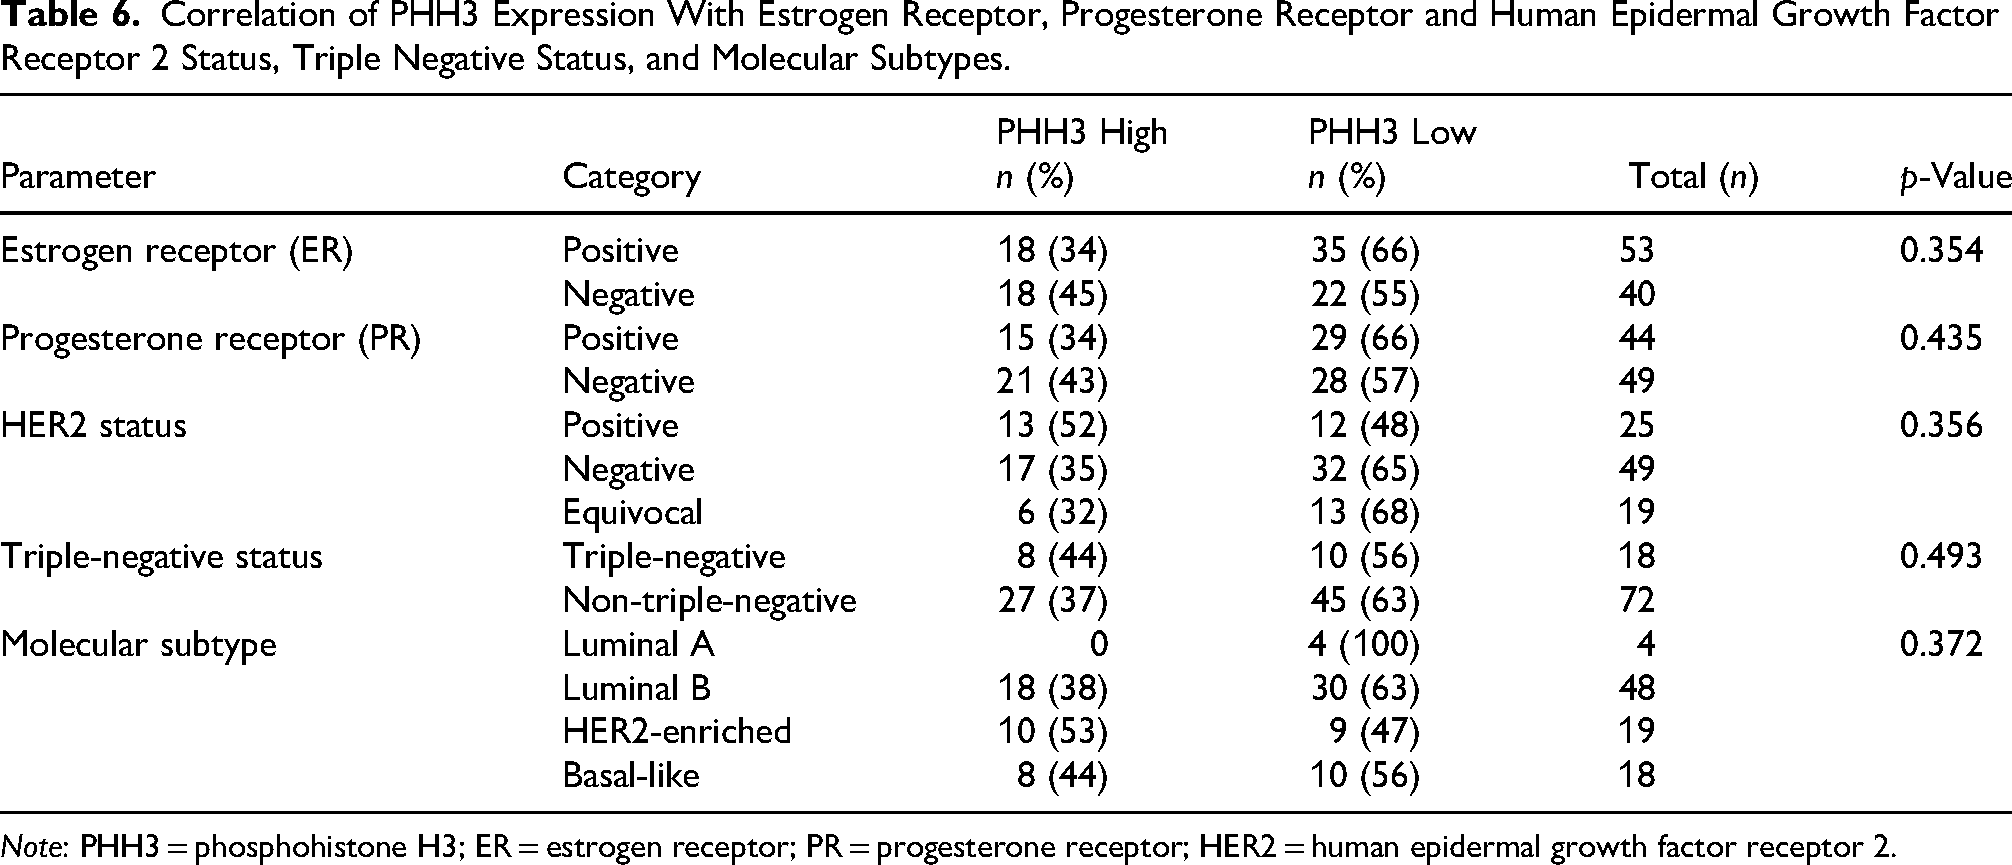
Note: PHH3 = phosphohistone H3; ER = estrogen receptor; PR = progesterone receptor; HER2 = human epidermal growth factor receptor 2.
There were 18 specimens which were triple negative. However, there was no statistically significant correlation observed between triple-negative and non-triple-negative tumors (p value = 0.493). All luminal A tumors had low PHH3 (100%) expression. Luminal B, HER2-enriched and basal-like subtypes showed 18 (38%), 10 (53%), and 8 (44%) of tumors with high PHH3 expression. Association between molecular subtypes and PHH3 expression was statistically not significant (p = 0.372).
Assessment of Inter-Observer Variability in Mitotic Counting Using H&E and PHH3 Staining
On analysis for inter-observer variability, Cohen's kappa value for H&E staining was 0.194, indicating poor agreement, whereas for PHH3 it was 0.463, reflecting moderate agreement and suggesting improved inter-observer concordance. The correlation coefficient for mitotic figure counting was higher with PHH3 (r = 0.699) than with H&E (r = 0.285), indicating better consistency between observers and suggesting that PHH3 improves reproducibility in mitotic figure assessment.
Discussion
Correlation of PHH3 Score With Clinicopathological Parameters
In our study, no statistically significant association was found between patient age and PHH3 expression (p = 0.085). This is consistent with the findings of Skaland et al, who investigated PHH3 as a prognostic marker in patients under 55 years of age and reported that PHH3 was a strong independent prognostic indicator, without a significant correlation with age. 11 Similarly, studies by Van Steenhoven et al, 13 Mirzaiian et al, 14 Hao et al, 15 and Gudlaugsson et al 16 did not demonstrate a direct statistical association between age and PHH3 expression. This suggests that proliferative activity in breast tumors is influenced more by tumor biology than by patient demographics.
In our study, T stage distribution showed a predominance of T2 tumors (59%), followed by T3 (29%) and T1 (12%), reflecting a majority of intermediate to advanced tumors. When analyzed against PHH3 expression, no significant association was observed (p = 0.336), indicating that PHH3 levels were not influenced by tumor size in this cohort. Similar findings were observed in the study by Van Steenhoven et al 13 and Kim et al 7 which included only early-stage luminal breast cancers. Conversely, in the study by Ibrahim et al 17 PHH3 expression was significantly associated with higher T stage (p = 0.01) with elevated PHH3 levels correlating with more advanced tumor stages. The study by Mirzaiian et al 14 also confirmed that PHH3-positive mitotic counts were higher in larger tumors, indicating a positive relationship between PHH3 activity and tumor growth.
In our study, no significant association was found between nodal status and PHH3 expression (p = 0.382). Higher PHH3 expression was present across N0 to N3 stages without a clear trend. Kim et al 7 and Ibrahim et al 17 both observed in their respective studies that PHH3 expression was not significantly associated with nodal metastasis. In contrast, the study by Mirzaiian et al 14 found a significant correlation between PHH3 expression and lymph node involvement (p = 0.01). Skaland et al suggested that higher mitotic indices including PHH3 were indirectly associated with more aggressive tumors that had a greater likelihood of nodal metastasis. 11
PHH3 Score Versus Mitotic Count on H&E and Ki-67 index
In our study, mitotic figure scoring by PHH3 immunohistochemistry demonstrated a clear shift toward higher proliferation categorization when compared to traditional H&E assessment. While 70% of specimens showed a mitotic score of 1 on H&E, only 43% fell into this low proliferation category by PHH3. Conversely, mitotic score 3 increased from 13% on H&E to 27% on PHH3, indicating that PHH3 consistently identified more mitotic figures. This shift resulted in an overall higher mean mitotic count per 10 high-power fields (14 with PHH3 vs 7 with H&E). Similar trends have been reported by Mirzaiian et al where the mean mitotic count was higher by PHH3 (8.6 vs 6.4/10 HPF), and 5.5% of tumors were upstaged in grade based on PHH3 scoring. 14 Skaland et al also reported that PHH3 had significantly stronger prognostic power than mitotic activity index, Ki-67, and other classical parameters in node negative breast carcinoma under age 55. 11 Kim et al conducted a comparative study of PHH3 and Ki-67. They found that PHH3 staining provided more consistent identification of mitotic figures and this was significantly correlated with disease free survival (p = 0.043), whereas Ki-67 was not (p = 0.356). 7 Gudlaugsson et al 16 reinforced these observations in a similar population, confirming PHH3 as a more reliable prognostic marker than Ki-67 and mitotic activity index in early stage breast cancer.
Pearson's correlation analysis revealed positive relationship between the Ki-67 index and the PHH3 mitotic score (r = 0.534, p < 0.001). Both proliferation markers also showed significant correlations with tumor grade and mitotic count assessed on H&E sections, highlighting their effectiveness in evaluating proliferative activity in tumors. Ki-67 detects cells in all the active phases of the cell cycle, whereas PHH3 selectively marks cells in late G2 and mitotic phases, making it a more specific indicator of mitotic figures. 18 Ki-67 positive cells may not necessarily complete cell division, as some may undergo apoptosis or cell cycle arrest, reducing its specificity for true mitotic activity. 5 However, in our study, no significant association was observed when comparing PHH3 expression with categorical Ki-67 index values (p = 0.117), reinforcing the notion that these markers are related but not interchangeable.
It is well known that prolonged cold ischemia time with delay in fixation, can negatively affect the staining intensity and evaluation of Ki-67 results. 19 PHH3 may also be similarly affected by cold ischemia timings resulting in false low scoring. However further studies are required to establish the impact of preanalytical factors in the utility of both these markers. 20
PHH3 Expression Correlation With Nottingham Grading System
PHH3 expression showed statistically significant correlation with and tubule formation (p = 0.019), nuclear pleomorphism (r = 0.701, p < 0.001). This reflects its concordance with indicators of tumor aggressiveness and histological grade. On PHH3 grading, 31% of tumors were found to be grade 3, which was limited to 19% on conventional H&E-based grading. PHH3 score showed a stronger correlation with final tumor grade (r = 0.813, p < 0.001) and nuclear pleomorphism (r = 0.701), compared to that on mitotic score on H&E (r = 0.724 and 0.309, respectively).
This suggests that PHH3, by more accurately detecting mitotic activity, may lead to more reliable grading and better prognostic stratification. PHH3-based grading can lead to reclassification of tumor grade in a significant proportion of patients with potential implications for treatment decisions, including the escalation to adjuvant chemotherapy.11,16,17 Furthermore, PHH3 expression has been associated with long-term outcomes, with one study reporting a 20-year recurrence-free survival of 96% in patients with low PHH3 expression versus 58% in those with high expression. 11
In our study, PHH3 demonstrated better inter-observer reliability than H&E, with moderate agreement (κ = 0.463) versus poor agreement (κ = 0.194) and a higher correlation coefficient (r = 0.699 vs. 0.285). These findings suggest that PHH3 improves reproducibility and reduces subjectivity in mitotic figure assessment. Similar findings have been reported by Van Steenhoven et al, 13 Jamshia et al, 21 Ibrahim et al, 17 and Kim et al, 7 who demonstrated that PHH3 reduces inter-observer variability and enhances consistency and efficiency in mitotic counting compared to conventional H&E staining.
Given its compatibility with routine pathology workflows and its potential to improve diagnostic precision, PHH3 could be integrated into standard grading protocols. However, further large-scale, prospective studies with follow-up data are warranted to establish standardized thresholds and confirm its prognostic value and utility in routine clinical practice.
PHH3 Expression Correlation With Hormone Receptor Status and Molecular Subtypes of Breast Carcinoma
PHH3 expression showed no statistically significant association with ER (p = 0.354), PR (p = 0.435), or HER2 status (p = 0.356), indicating that PHH3, as a mitotic figure-specific proliferation marker, operates independently of receptor-mediated tumor biology. Our study noted numerically higher PHH3 expression in HER2-enriched and triple-negative subtypes; however, this was not statistically significant (p = 0.372). These aggressive subtypes are known to have higher mitotic activity, aligning with our PHH3 trends. These findings are consistent with other studies who reported no significant relationship between PHH3 expression and hormonal receptors.11,16,17
The absence of a significant association between PHH3 expression and hormone receptor status, HER2 status, molecular subtype, or Nottingham prognostic index in our study aligns with the known biological role of PHH3 as a specific marker of mitotic activity, rather than a broader indicator of tumor phenotype or molecular classification. This implies that PHH3 can serve as a distinct prognostic marker, independent of hormone receptor status or molecular types.
PHH3 could potentially refine risk stratification in patients where conventional markers yield ambiguous results or in tumors with discordant proliferation indices. Future studies should investigate whether integrating PHH3 into existing prognostic models could enhance their predictive accuracy, particularly in borderline or intermediate-grade tumors.
Although PHH3 immunostaining enhanced the identification of mitotic figures, its value in predicting patient outcomes such as survival or recurrence could not be determined due to the unavailability of long-term follow-up data. The true prognostic value of PHH3-based grading remains to be validated in future prospective studies with long-term patient follow-up.
While our study provides valuable insights based on 100 consecutive mastectomy specimens, we acknowledge that its retrospective, single center design and relatively small sample size may limit the generalizability of the findings. These factors may introduce selection bias and restrict the applicability of our results to broader or more diverse populations. Future research involving multi center, prospective studies with larger and more heterogeneous cohorts is essential to validate our observations and enhance external validity.
There is currently no universally accepted gold standard for assessing proliferative activity. Whether mitotic figures identified on H&E, Ki-67 immunoreactivity, or PHH3-based mitotic counts most accurately reflect patient outcomes remains unresolved. While prospective validation studies would be ideal, investigating this question in a large retrospective multicenter cohort could be an efficient strategy to provide valuable insights into the relative prognostic accuracy of these markers.
PHH3 immunostaining requires specific antibodies which add costs to routine reporting, potentially limiting its use in resource-constrained settings. Successful application of PHH3 requires optimized protocols for antigen retrieval, antibody dilution, and counterstaining. Variability in these steps can affect staining quality and diagnostic reliability. Differences in equipment, reagents, and personnel expertise across laboratories can lead to inconsistent results. This variability underscores the need for standardized procedures and external quality assurance programs.
Conclusion
In the present study, PHH3 expression showed a significant correlation with H&E mitotic score, tumor grade, and nuclear pleomorphism, underscoring its strong association with tumor aggressiveness. There was no significant correlation observed between PHH3 expression and other prognostic parameters such as hormonal receptor status, HER2, molecular subtypes, triple-negative status, lymph node status, or Nottingham Prognostic Index.
By enhancing objectivity in mitotic figures detection, PHH3 identified more mitotic figures compared to conventional counting on H&E. Its inclusion in routine grading protocols may enhance grading accuracy and more accurately reflect tumor biology. PHH3 thus holds promise as a reliable adjunct proliferation marker in the histopathological reporting of breast carcinoma.
Footnotes
Ethical Approval
Institutional Ethics Committee (number IEC KMC MLR 05/2023/224) approval was obtained.
Informed Consent
Informed consent was waived.
Author Contributions
Priyamvada Priyadarshini did conceptualization, data curation, formal analysis, funding acquisition, validation, writing – original draft, writing – review & editing.
Ranjitha Rao performed conceptualization, data curation, formal analysis, funding acquisition, validation, writing – original draft, writing – review & editing
Chaithra G V, Jyoti Kini, and Mounika RN did data curation, formal analysis, review.
Rakshatha Nayak and Sunita Hegde did data curation, writing – review & editing.
Sneha Rao AR did data curation and formal analysis.
Funding
The authors received no financial support for the research, authorship, and/or publication of this article.
Declaration of Conflicting Interests
The authors declared no potential conflicts of interest with respect to the research, authorship, and/or publication of this article.
Data Availability
The datasets generated during and/or analyzed during the current study are available from the corresponding author on request.