
Abstract
Differential rejection rates of vote-by-mail (VBM) ballots by race and ethnicity are often attributed to voter-side factors—such as cultural or linguistic barriers—rather than to discretionary decisions by signature evaluators. We assess this claim with a two-part research design. In Study 1, an audit of Washington State ballot status reports revealed that ballots cast by voters with Hispanic surnames are substantially more likely to be rejected for signature mismatch than those cast by non-Hispanic White surnames, and that the disparity between mismatch and late-submission rejections is markedly greater for Hispanic voters, implicating administrative discretion. In Study 2, 1,797 Washingtonians evaluated 24 pairs of valid signatures—each bearing a Hispanic- or White-coded name—produced by volunteers from diverse racial and ethnic backgrounds who were randomly assigned to each name, thereby neutralizing systematic voter-side factors. Evaluators rejected Hispanic-named signatures at higher rates than White-named ones. Supplementary analysis reported in the appendix shows that an explicit pro-White/anti-immigrant bias measure predicted lower acceptance of Hispanic-named signatures but had no effect on White-named signature acceptance. Overall, the accumulated evidence implicates evaluator bias as the primary driver of racial disparities in VBM signature verification and calls for reforms that can mitigate such bias to ensure equitable election administration.
Introduction
While voting eligibility has evolved throughout American history, a consistent pattern remains: White 1 voters have often received preferential treatment from lawmakers and election administrators. During the Jim Crow era, for example, White voters were shielded from voting restrictions through mechanisms like White primaries and grandfather clauses, which exempted them from literacy tests, poll taxes, and understanding requirements. These barriers—commonly referred to as “administrative burdens” (Herd et al. 2023; Moynihan et al. 2015)—were systematically imposed on marginalized groups to suppress their political participation. Central to this process were local election administrators exercising tremendous discretion in their enforcement of voting laws and applying them along racial lines, essentially determining voter eligibility on a case-by-case basis with race being the determining factor. This racial profiling was crucial to the maintenance of White political dominance in the South (Keele et al. 2021; Key 1984; Kousser 1974). After the passage of the Voting Rights Act, blatantly discriminatory policies were phased out, but a certain degree of racialized bureaucratic discretion in elections has persisted and is making a resurgence in some states, especially in areas with localized racial resentment (Morris and Shapiro 2025). The controversial SAVE Act, if signed into law, would unleash local election administrations to make even more discretionary decisions on citizenship (Bedekovics and Bryant 2025). Many of these decisions will come down to determinations of the authenticity of signatures in registration forms, USPS-delivered mail ballots, and citizenship through the verification of passports/birth certificates.
In the current vote-by-mail process, a voter’s identity must be verified as a safeguard against fraud, and in most states, this is accomplished through signature verification (National Conference of State Legislatures 2024). The justification for using signatures is that they function as a behavioral biometric—believed to be unique to each individual—thereby making large-scale fraud more difficult to execute (Hameed et al. 2021). However, a core concern with this method is that the individuals tasked with verifying signatures are granted substantial discretion, often making subjective, case-by-case judgments with limited oversight. These decisions are frequently made under pressure and, in many cases, without formal training (Page and Pitts 2009). The process has been described as “witchcraft” (Graham 2020), and “ripe for error” (Lau and Nelson 2020), though artificial intelligence is rapidly changing the landscape with many counties embracing more efficient, though perhaps more problematic computer vision AI tools, like those often used for facial recognition (Grother et al. 2019). Each year, tens of thousands of eligible voters have their mail ballots rejected due to perceived signature mismatches. In some states, these voters are not notified and are given no opportunity to correct—or “cure”—their ballots, resulting in their effective disenfranchisement without notice (Meredith and Kronenberg 2023). Moreover, research suggests that more than 80 percent of rejected ballot signatures are mistakenly deemed invalid (Street 2024). In Washington State alone, which conducts its elections entirely via mail, this error rate translates to over 100,000 wrongly rejected ballots between 2019 and 2024.
The implications of these errors are especially significant in close elections, where the number of rejected ballots can easily exceed the margin of victory. For example, the 2004 Washington gubernatorial election was decided by just 133 votes. When the ballot rejection process is uneven or biased, it means that thousands of voters face systemic barriers to participation. Such disparities not only undermine core democratic values of political equality (Dahl 2007) but may also violate the Equal Protection Clause of the Constitution and provisions of the Voting Rights Act.
A growing body of evidence demonstrates that signature rejection disproportionately affects racial minorities, young voters, and newly registered voters (Asian Americans Advancing Justice 2017; Baringer et al. 2020; Cottrell et al. 2021; Shino et al. 2022). While previous studies have identified unequal rejection patterns, few have been able to test the underlying drivers of this inequality. In practice, jurisdictions often deflect responsibility by attributing rejection disparities to voter-side factors—such as language proficiency or cultural barriers—rather than scrutinizing the subjectivity of their own verification processes. These explanations are frequently offered without compelling empirical evidence. For example, in its 2022 audit of ballot rejection, the Washington State Auditor attributed racial disparities to “...language or cultural barriers that increase the likelihood of ballot rejections” (Office of the Washington State Auditor 2022, 20), even while acknowledging that signature verification is “inherently subjective… [and that] even experienced reviewers can come to different conclusions” (p 16).
The subjectivity of signature verification has led some researchers to propose an alternative explanation: administrative bias. For example, Baringer et al. (2020) suggest that “the discretion of local election officials or county canvassing boards may result in unequal treatment of VBM ballots due to implicit biases (p 295),” pointing to evidence of such bias in other administrative realms. This perspective aligns with the broader literature on street-level bureaucrats (Lipsky 2010; Maynard-Moody and Musheno 2000), which emphasizes that frontline public servants often bring their own social identities and cognitive predispositions to their work. These predispositions can shape decision-making—particularly when tasks involve subjectivity and discretion, as is the case with signature verification—making them vulnerable to bias-motivated reasoning (Fazio 1990; Payne 2005; Sherman et al. 2008). In this study, we present a research design that allows us to more precisely test the two dominant explanations for racial and ethnic disparities in ballot rejection: voter-side factors versus administrative bias.
Given the United States’ long-standing and ongoing history of racialized bureaucratic discretion adversely affecting minority communities, we argue that biased decision-making, whether implicit or explicit, by election workers is the most convincing explanation for the racial disparities observed in vote-by-mail (VBM) signature rejection. We evaluate this claim through two complementary studies conducted in the state of Washington focusing on Latino and White signatures (for replication materials, visit https://dataverse.harvard.edu/dataverse/vbm/). Additional discussion of why Washington state provides a theoretically and practically important case is included in the online appendix (Appendix C1).
In Study 1, we conducted a statewide audit of rejected ballots with special attention to each of the nine central Washington counties with sizable Latino populations: Adams, Benton, Chelan, Douglas, Franklin, Grant, Okanogan, Walla Walla, and Yakima. Our audit focused on two distinct reasons for ballot rejection: (1) signature mismatch and (2) late ballot submission. If Hispanic 2 voters were simply more prone to errors or lacked knowledge about vote-by-mail (VBM) procedures—a common voter-side explanation—we would expect to see similar rejection disparities across both categories. However, if the disparity or gap between late submission and signature mismatch rejection rates is larger for Hispanic voters than for non-Hispanic White voters, it suggests that administrative discretion—rather than voter behavior—is the most plausible reason behind signature mismatch disparities between Hispanic and White voters.
This analytic approach aligns with prior research. For example, Baringer et al. (2020), in their study of Florida, distinguished between ballots rejected for being submitted too late and those rejected due to signature-related reasons. They found no statistically significant differences between Hispanic and non-Hispanic voters in late ballot rejections but did observe significantly higher rejection rates for Hispanic voters in the signature mismatch category. The authors attribute this pattern, in part, to potential bias in the discretionary judgments of election officials. Our analysis of Washington yields a similar pattern: minimal differences in rejection rates for late ballots, but large and statistically significant disparities in rejections due to signature mismatch. These findings suggest that it is not a lack of voter knowledge or care that drives rejection disparities. Rather, Hispanic voters appear to face heightened scrutiny during the signature verification process, consistent with the presence of bias among election officials.
In Study 2, we extend our analysis with an online survey designed to neutralize any voter-related explanations for differential ballot rejection. We recruited a sample of 1,797 Washingtonians and asked them to evaluate 24 signature pairs—each consisting of a handwritten and digital signature—and decide whether to “accept” or “reject” each pair due to potential signature mismatch. Unbeknownst to them, however, all signature pairs were valid in that both signatures in a pair were produced by the same individual. The 24 pairs were also created by 24 different, randomly selected volunteers.
Crucially, volunteers were randomly assigned to sign either a Latino-coded or White-coded name, ensuring that the racialized name associated with each signature pair was not systematically linked to the actual racial or ethnic background of the signer. This eliminates the possibility that cultural, linguistic, or demographic differences in handwriting could explain any observed disparities in rejection rates. Overall, all signature pairs were comparable in quality, validity, and background—differing only by the Latino- or White-coded name printed above them. As such, any systematic difference in rejection rates can be attributed to evaluator bias.
The reminder of this article is organized as follows. We begin with a discussion of ballot rejection. We then argue that racialized bureaucratic discretion plays a central role in the signature verification process and offers the most compelling explanation for the observed racial disparities in ballot rejection. In Study 1, we conduct an audit of signature mismatch and late ballot rejection rates in Washington. In Study 2, we introduce a research design that neutralizes “cultural” or voter-side factors, effectively isolating evaluator bias as the primary explanation for racial differences in signature rejection. We conclude with a discussion of potential reforms and directions for future research.
Overview of VBM Ballot Rejection
Biased ballot rejection patterns have only recently emerged as a focus of scholarly inquiry, largely spurred by the widespread adoption of VBM during the 2020 election in response to the COVID-19 pandemic (see online Appendix C2 for a broader discussion of VBM procedures and political context). As a result, research remains limited to a small number of states, though the findings are consistent: racial disparities in ballot rejection are well-documented. In Georgia, for example, Asian, Latino, and Black voters were significantly more likely than White voters to have their on-time ballots rejected in the 2018 general election (Shino et al. 2022). Similar racial disparities have been documented in Florida between 2016 and 2020, even after controlling for individual-level differences in voting experience (Cottrell et al. 2021).
These studies offer important insights and have laid the groundwork for further inquiry into the causes of unequal ballot rejection. Building on their contributions, we aim to advance research designs that help further isolate the underlying factors contributing to these disparities. For instance, Shino et al. (2022) call for future research that can “more directly explore possible causal mechanisms that explain the disproportionate likelihood of rejection of VBM ballots” (p. 240). Similarly, Allard et al. (2023) recommend that “greater attention should be paid to process-based and structural causes of race and ethnic disparities in ballot rejections” (p. 31). Our study builds on prior research by focusing on the role of racialized bureaucratic discretion in the signature verification process.
A Theory of Racialized Bureaucratic Discretion
Bureaucratic discretion and racial bias have been extensively studied across various levels of government and international contexts (Brierley et al. 2023). However, local election administration in the United States has received relatively limited attention (but see Alvarez and Hall 2006; Ferrer et al. 2024), and individual election workers have been studied even less. As Kimball and Kropf (2006) observed nearly two decades ago, “We are at the beginning stages of our understanding of the behavior of local election officials” (p. 1263). Presently, the key mechanisms underlying local election work—such as VBM ballot rejection—remain insufficiently scrutinized.
Research in public administration has long recognized that bureaucrats often base decisions on normative judgments rather than formal rules, procedures, or policies (Maynard-Moody and Musheno 2000). Even in the context of elections and constituent services, prior research finds evidence of elected officials engaging in racially discriminatory behavior. For instance, studies have shown that constituent requests for information receive different responses depending on the racial, ethnic, or religious identity of the constituent (Butler and Broockman 2011; Lajevardi 2020; White et al. 2014). Similarly, a growing body of work suggests that the enforcement of voter ID requirements by frontline poll workers may also be racially biased (Atkeson et al. 2010, 2014; Smith 2017; Suttmann-Lea 2020).
We argue that election workers responsible for signature verification are particularly susceptible to bias for at least three reasons. First, the process itself is inherently subjective, as acknowledged by administrative officials (e.g., the Washington State Auditor’s Office) and previous studies. In the absence of clear, rule-based criteria, election workers may rely on personal judgment that is shaped by implicit or explicit assumptions or stereotypes about handwriting, identity, or voter legitimacy. These subjective assessments can systematically disadvantage certain groups—particularly Asian and Latino voters—who are often stereotyped as foreigners (Masuoka and Junn 2013). This bias is partly rooted in the pervasive association of “Whiteness” with “Americanness” (Devos and Banaji 2005; Lajevardi and Oskooii 2024) which can result in heightened scrutiny of ballots linked to non-White or non-Anglo names.
Second, in addition to the subjective nature of signature verification, the task is often performed under pressure, which limits the opportunity for careful, deliberate processing (Fazio 1990). Reports indicate that in many states, election workers are expected to evaluate each signature in as little as 5 seconds (Lau and Nelson 2020). Under these constraints, workers are more likely to rely on automatic, intuitive judgments—what Kahneman (2013) refers to as “System 1” thinking—driven by emotions, implicit biases, and heuristics rather than reasoned analysis. These cognitive shortcuts can further increase the likelihood of biased decision-making, especially in contexts where racial or ethnic cues are present.
Third, the demographic composition of election administrators may also contribute to biased decision-making. One study found that 95 percent of local election officials—such as county clerks and commissioners—identify as White (Adona et al. 2019). According to representative bureaucracy theory, the demographic characteristics of public officials can influence their decisions in ways that reflect the interests and perspectives of their own social group (Selden 2015). In the context of signature verification, a predominantly White election workforce may bring a shared set of cognitive biases that disproportionately affect non-White voters. Research across various areas of public administration supports this claim, showing that unrepresentative bureaucracies are more likely to create discriminatory barriers and engage in disparate treatment of racial and ethnic minorities (Keiser et al. 2004). Taken together—the subjectivity of the task, the time constraints under which it is performed, and the demographic homogeneity of those performing it—there is a strong reason to believe that both implicit and explicit biases can shape how signatures are evaluated. In the following section, we explain how racialized names can further activate these biases and provide fertile ground for discriminatory decision-making.
Discrimination Based on Names
Election workers often have access to voters’ names when reviewing ballot signatures. In Washington specifically, printed names appear on the ballot declaration, within the voter information section reviewed by the Canvassing Review Board, and in the VoteWA system used by evaluators. Even if election workers do not intentionally focus on voter names, many signatures are legible enough to make the voter’s identity readily apparent. This presents a significant concern, as names serve as powerful heuristics for inferring a person’s race, ethnicity, gender, class, and other demographic characteristics (Crabtree et al. 2023). Because names carry such strong racial and ethnic signals, a large body of audit and correspondence studies have demonstrated that names alone are sufficient to elicit racial profiling and discriminatory responses from bureaucrats (Bertrand and Mullainathan 2004; Gaddis and Ghoshal 2015; Hanson and Hawley 2011).
This dynamic has already been documented among election observers. In their analysis of signature verification procedures in California, Janover and Westphal (2020) reported that election observers appeared to challenge ballots based on factors such as surname and party affiliation. While empirical evidence that election workers explicitly engage in this behavior is lacking, we contend that they may implicitly or explicitly respond to the racial and ethnic cues embedded in voters’ names and signatures—particularly in light of the structural shortcomings of the signature verification process outlined earlier.
If cultural or informational barriers—such as lower familiarity with voting procedures, language access issues, or organizational challenges—drive racial disparities in ballot rejection, one would expect elevated rejection rates for Latino voters at every stage of the vote-by-mail process. In particular, Latino voters would be more likely than White voters to have their ballots rejected both for signature mismatch (which involves discretionary judgment) and for late submission (a purely procedural check). Crucially, under this scenario, the gap between signature mismatch and late rejection rates would be comparable between White and Hispanic voters.
By contrast, if the difference between late-submission and signature-mismatch rejections is significantly larger for Hispanic voters, it would point squarely to factors internal to the administrative review process—namely, implicit or/and explicit bias in how signatures are evaluated.
Based on our theoretical priors, we propose the following hypotheses:
Ballots cast by voters with Hispanic surnames are more likely to be rejected for signature mismatch than those cast by voters with non-Hispanic White surnames.
The difference in ballot rejection rates between signature mismatch and late submission is significantly greater for voters with Hispanic surnames than for voters with non-Hispanic White surnames.
To test these hypotheses, we compare rejection rates for signature mismatch and late submission across Hispanic- and White-named ballots. Specifically, we examine whether Hispanic-named ballots, relative to their White counterparts, are disproportionately rejected when discretion is highest (signature mismatch) versus when it is absent (late submission). This design allows us to distinguish disparities arising from voter-side factors from those reflecting evaluator behavior.
In Study 2, we extend our analysis by using a design that neutralizes voter-side factors, allowing us to directly assess whether racialized cues influence signature verification outcomes. If evaluator bias is at play, we would observe systematic differences in how participants assess signatures based solely on the racial/ethnic cues embedded in voters’ names.
Signature evaluators are more likely to reject Hispanic-named signature pairs relative to White-named signature pairs.
Study 1: Audit of Nine Central Washington Counties
In Faces of Inequality (1998), Rodney Hero emphasizes that regions marked by significant ethnic diversity and economic stratification often experience unequal social and political outcomes. Similarly, research on racial threat theory suggests that the growth of Latino populations can generate racial resentment, potentially contributing to more restrictive voting practices (Morris 2023). These dynamics make central Washington well-suited for examining disparities in ballot rejections. Located east of the Cascade Mountains—a physical and cultural boundary dividing Washington—Adams, Benton, Chelan, Douglas, Franklin, Grant, Okanogan, Walla Walla, and Yakima counties are each more than 20 percent Hispanic and are the nine most Hispanic counties in the state according to the 2020 U.S. Census.
Our data consists of publicly available ballot status reports from six general elections held between November 2019 and November 2024. 3 For each election, the ballot status reports include information on ballots received, accepted, and rejected, along with individual-level voter data. Our primary focus is on ballots rejected due to signature mismatches. Specifically, we aim to identify potential disparities in rejection rates based on observable characteristics—most notably, voters’ race/ethnicity as inferred from their names.
While Washington requires counties to notify voters and offer an opportunity to cure signature mismatches, 4 our data captures only the final status of each ballot (i.e., accepted or rejected), not whether a cure process was initiated or completed. As a result, we are unable to assess whether there were racial or ethnic disparities in who was contacted to fix a mismatched signature or in cure success rates. Future research should examine whether access to and completion of the cure process varies across groups, as disparities in this step could also contribute to unequal ballot rejection outcomes.
To classify voters by race and ethnicity, we relied on surname-based methods consistent with established approaches in political science. Full details on the classification procedure, data sources, and robustness checks are provided in the online appendix (Appendix C3).
After classifying voters as Hispanic or White, we filtered the dataset to include only voters whose ballots were rejected due to a signature mismatch or late submission. For each voter category—Hispanic and White—we examined the rates of ballot rejection by aggregating the following statewide, by region (central Washington), and by county: • The number of ballots cast. • The number of total rejected ballots. • The number of ballots rejected due to signature mismatch. • The number of ballots rejected due to submission past the election date.
Results
Signature rejection rates, statewide and grouped by county (2019–2024 general elections).
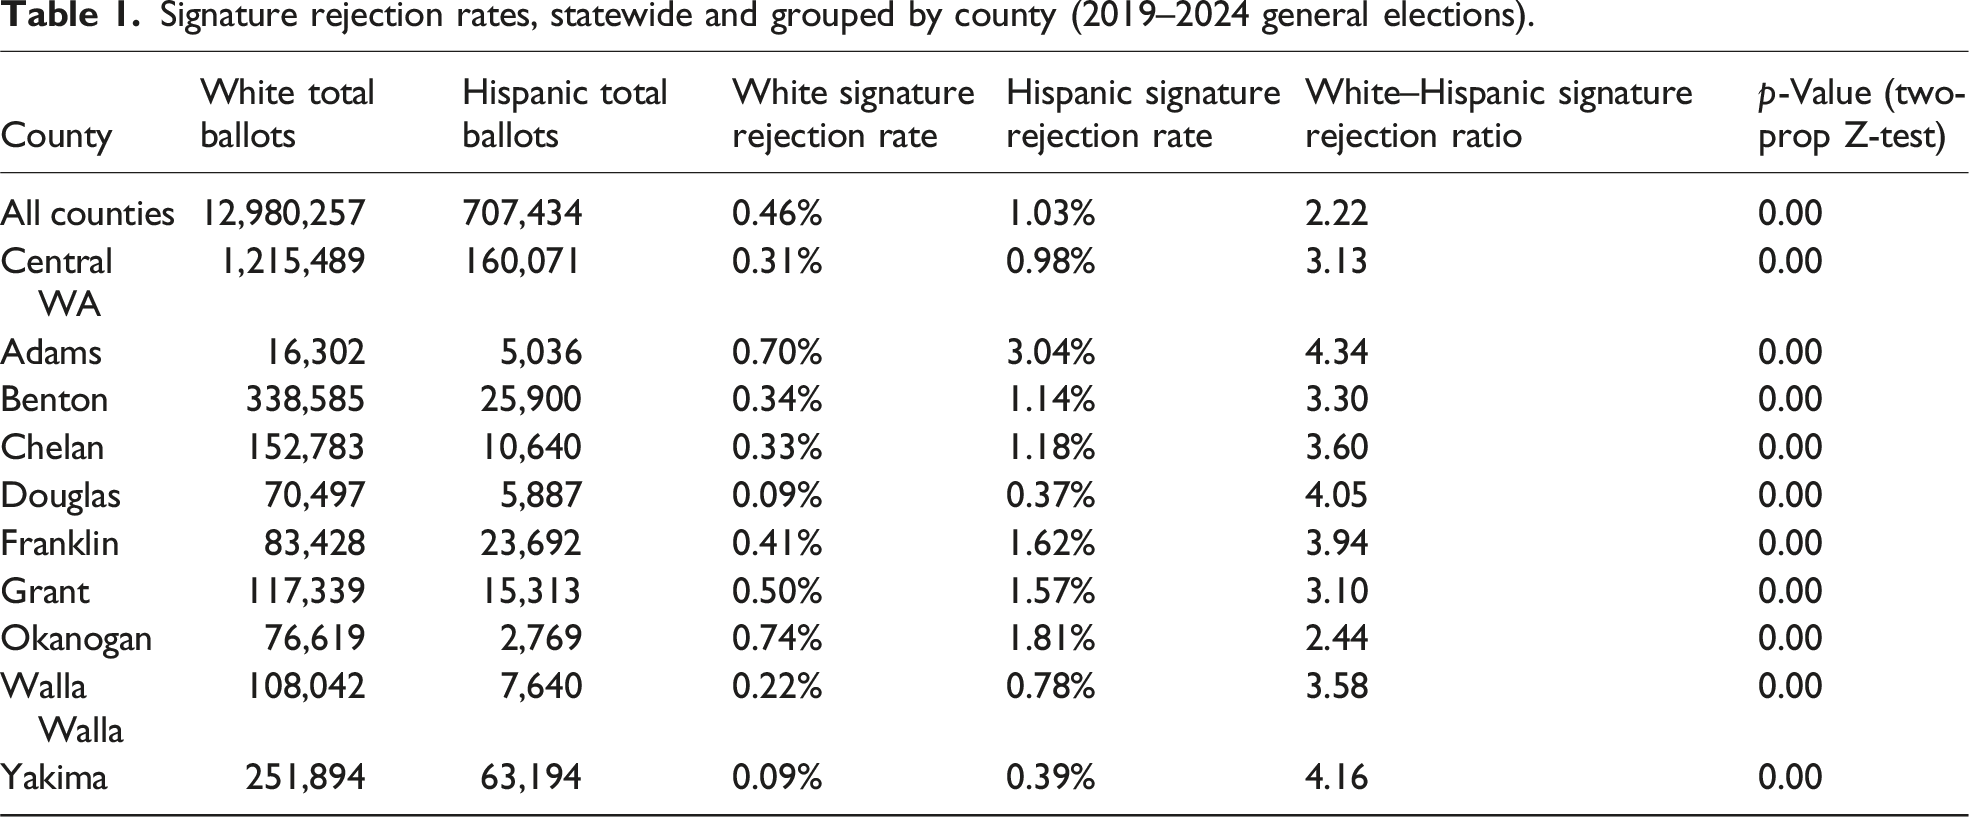
In the first row of Table 1, which aggregates data across all counties in Washington State, White voters had a signature rejection rate of 0.46 percent, compared to 1.03 percent for Hispanic voters—yielding a rejection ratio of 2.22. This disparity becomes even more pronounced when focusing on the nine central Washington counties, where the rejection ratio rises to 3.13. At the individual county level, each jurisdiction was at least twice as likely to reject the signatures of Hispanic voters compared to White voters. In Adams, Douglas, and Yakima counties, the disparity exceeds a four-fold difference.
Central Washington signature rejection rates, grouped by election (2019–2024 general elections).
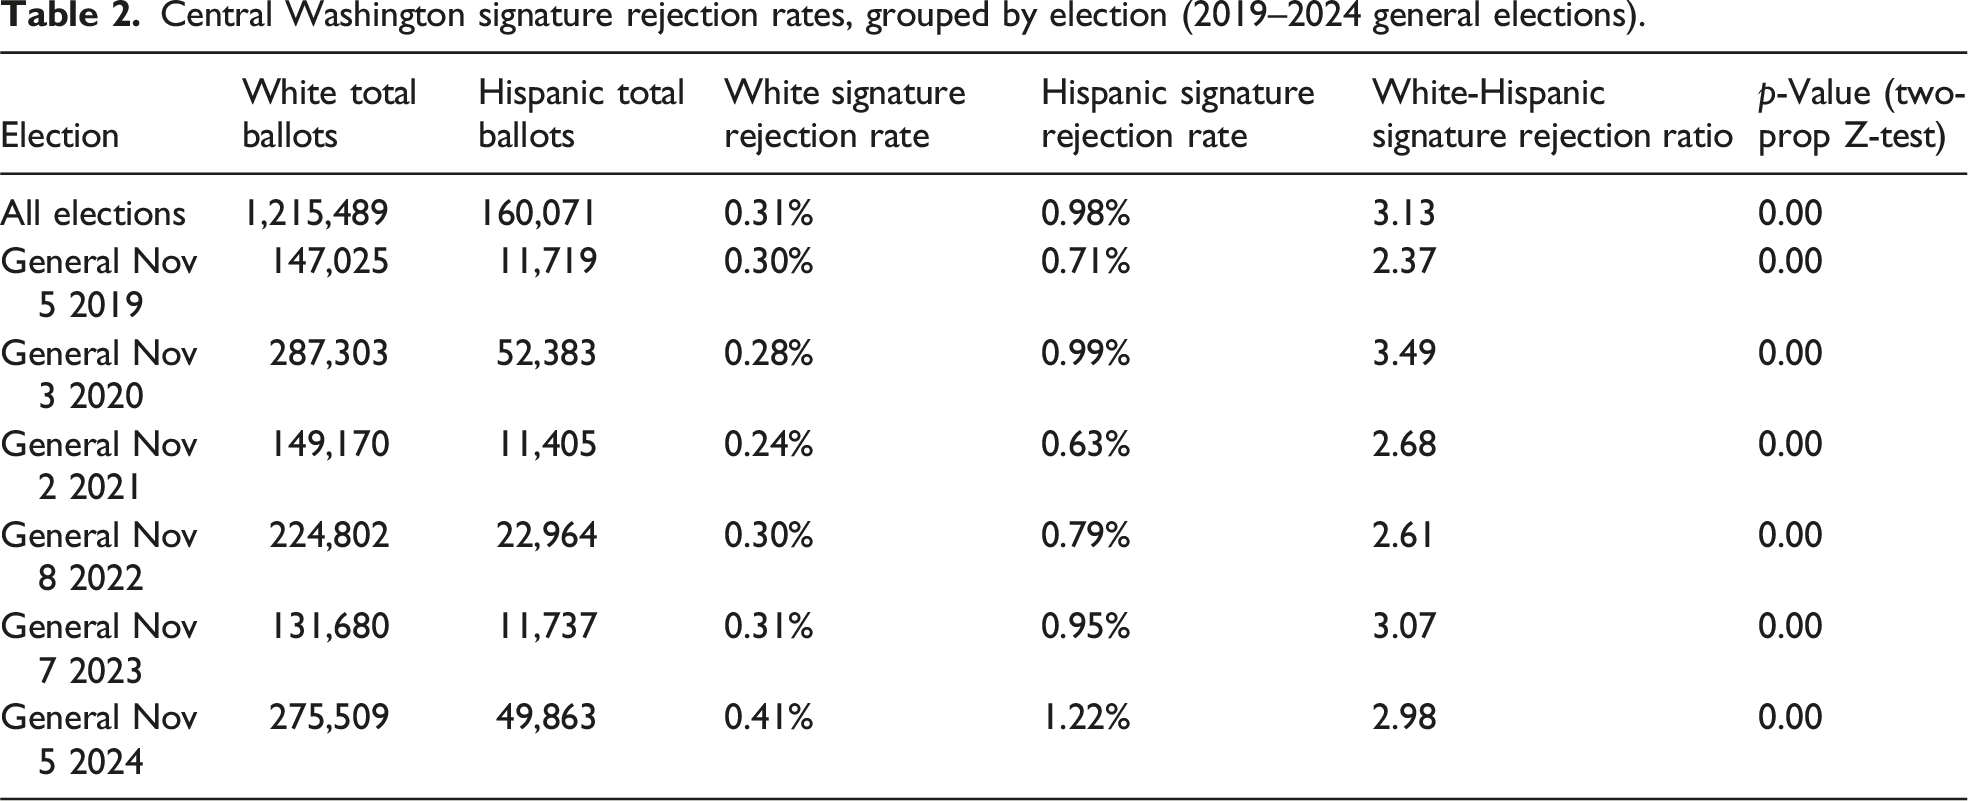
Figure 1 visualizes the difference in signature rejection rates between White and Hispanic voters over time, including 95 percent confidence intervals for each observed rate. The results reveal a clear and consistent pattern: Hispanic voters in central Washington experience significantly higher rejection rates due to signature mismatch in every election and county analyzed. In each case, voters with Hispanic surnames are rejected at statistically higher rates than those with non-Hispanic White surnames. These findings support Hypothesis 1. Central Washington White and Hispanic signature rejection rates, 2019–2024.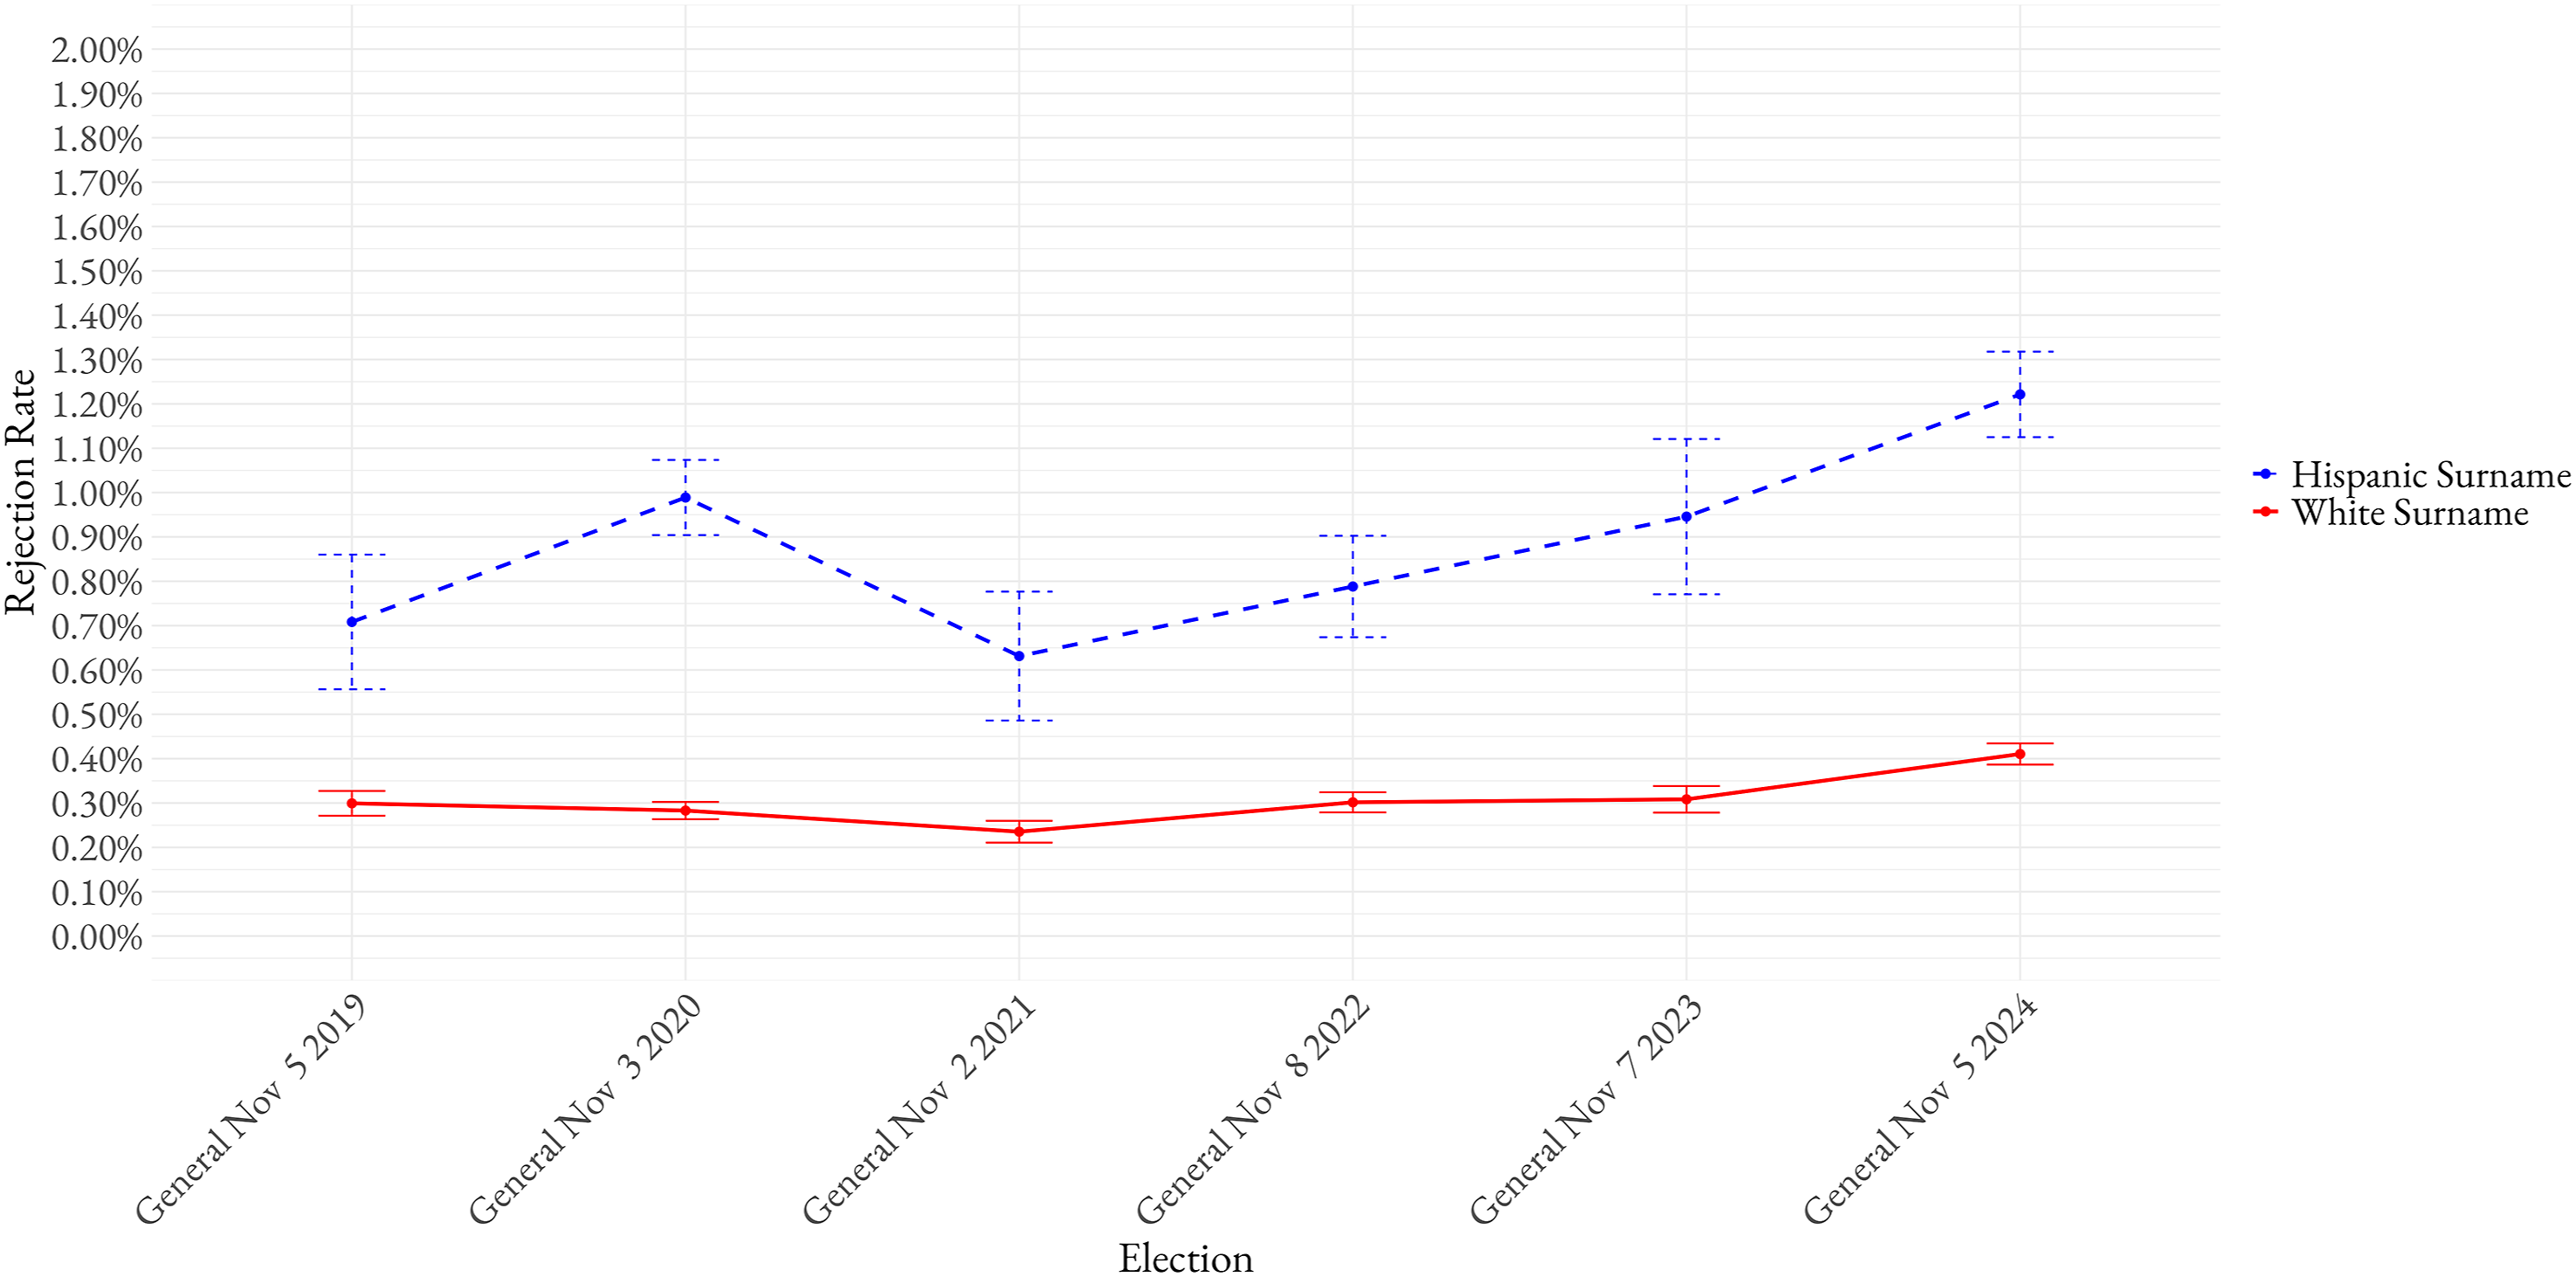
Comparing Signature Mismatch to Other Reasons for Rejected Ballots
Electoral jurisdictions such as the State of Washington often attribute racial disparities in ballot rejection rates to voter-side factors, downplaying or dismissing the role of bias by election officials. If voters are to blame, we would expect to see comparable racial disparities in ballots rejected for late submission, which also reflect factors like voter experience or familiarity with vote-by-mail procedures. However, if the disparity is greater in signature mismatch rejections—where administrative discretion is highest—it would instead implicate systemic bias in the evaluation process.
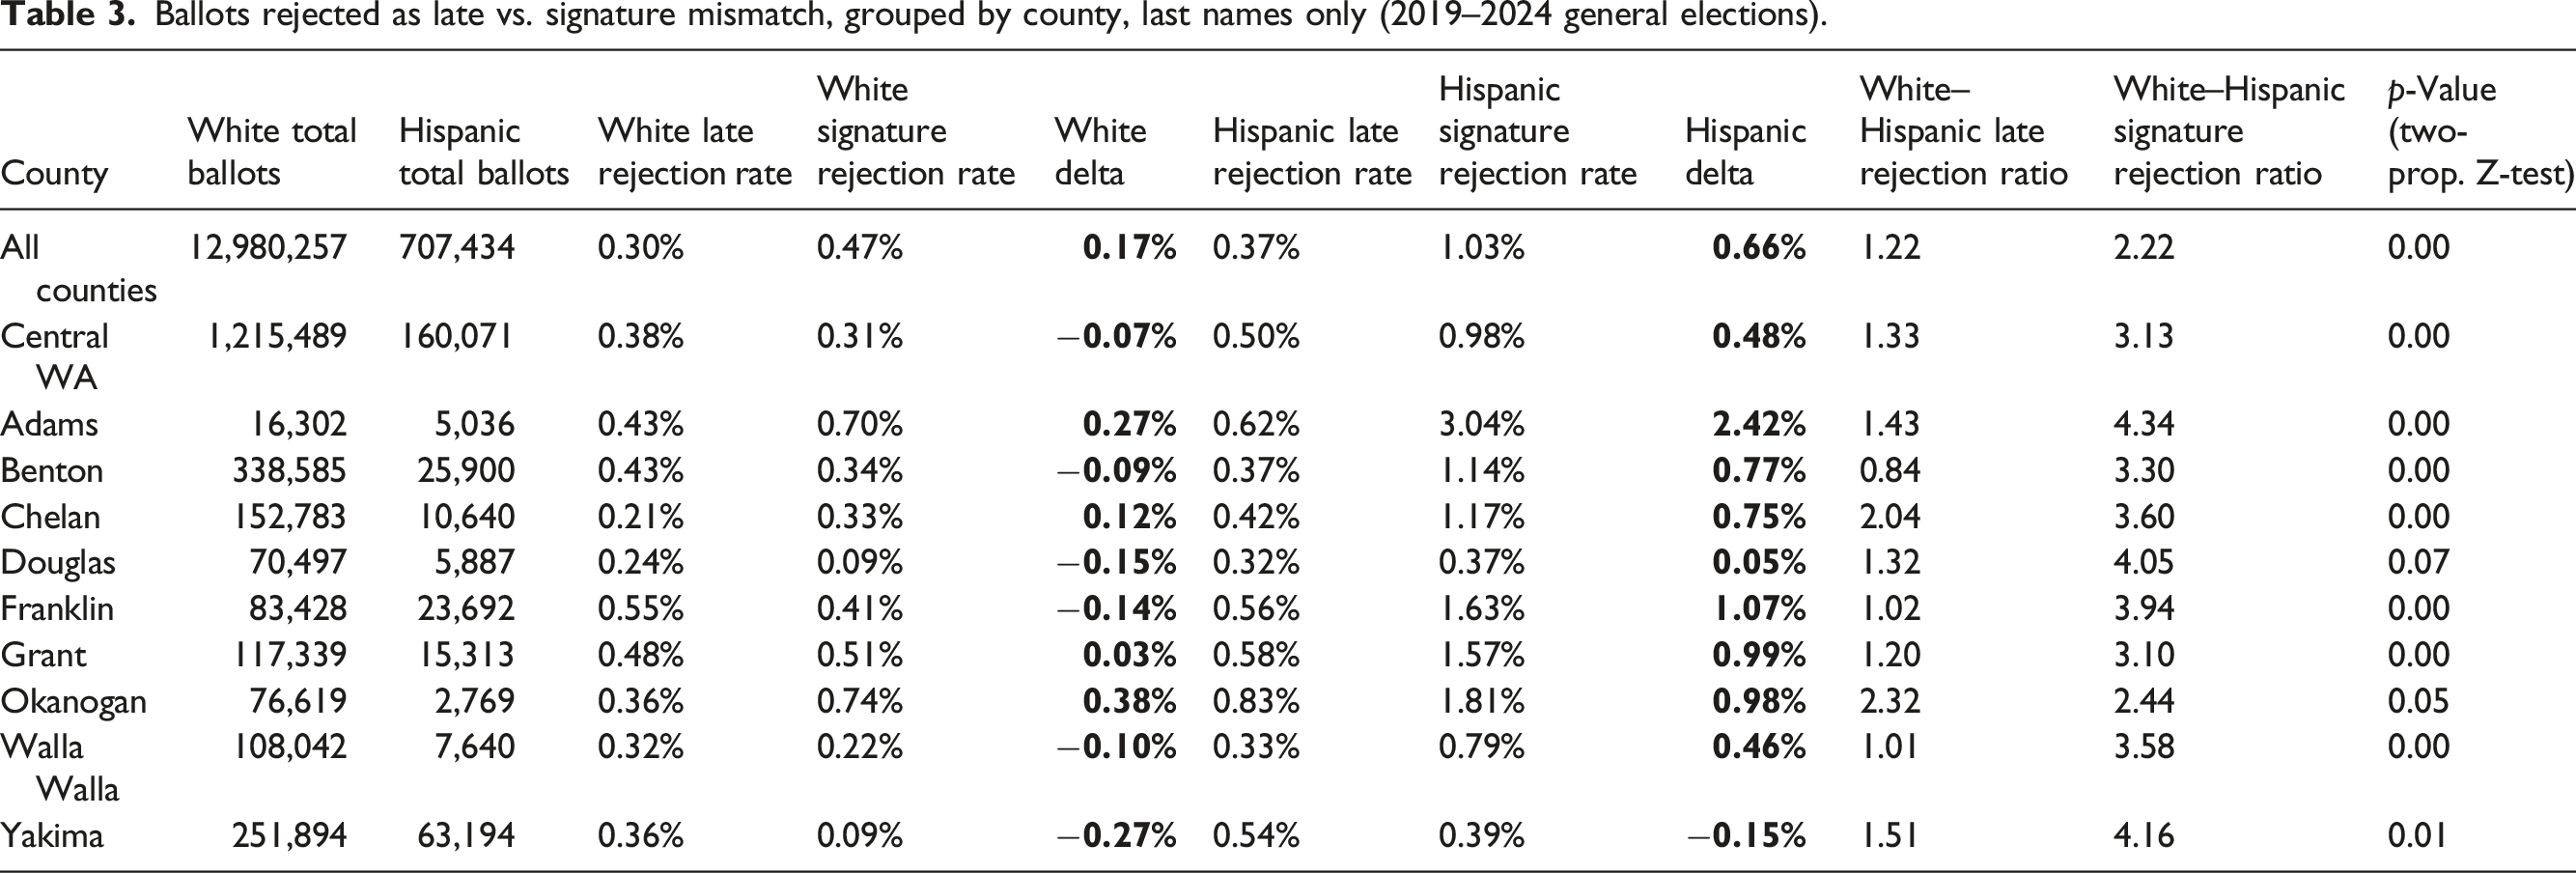
Ballots rejected as late vs. signature mismatch, grouped by county, last names only (2019–2024 general elections).
Ballots rejected as late vs. signature mismatch, grouped by county, first and last names (2019–2024 general elections).
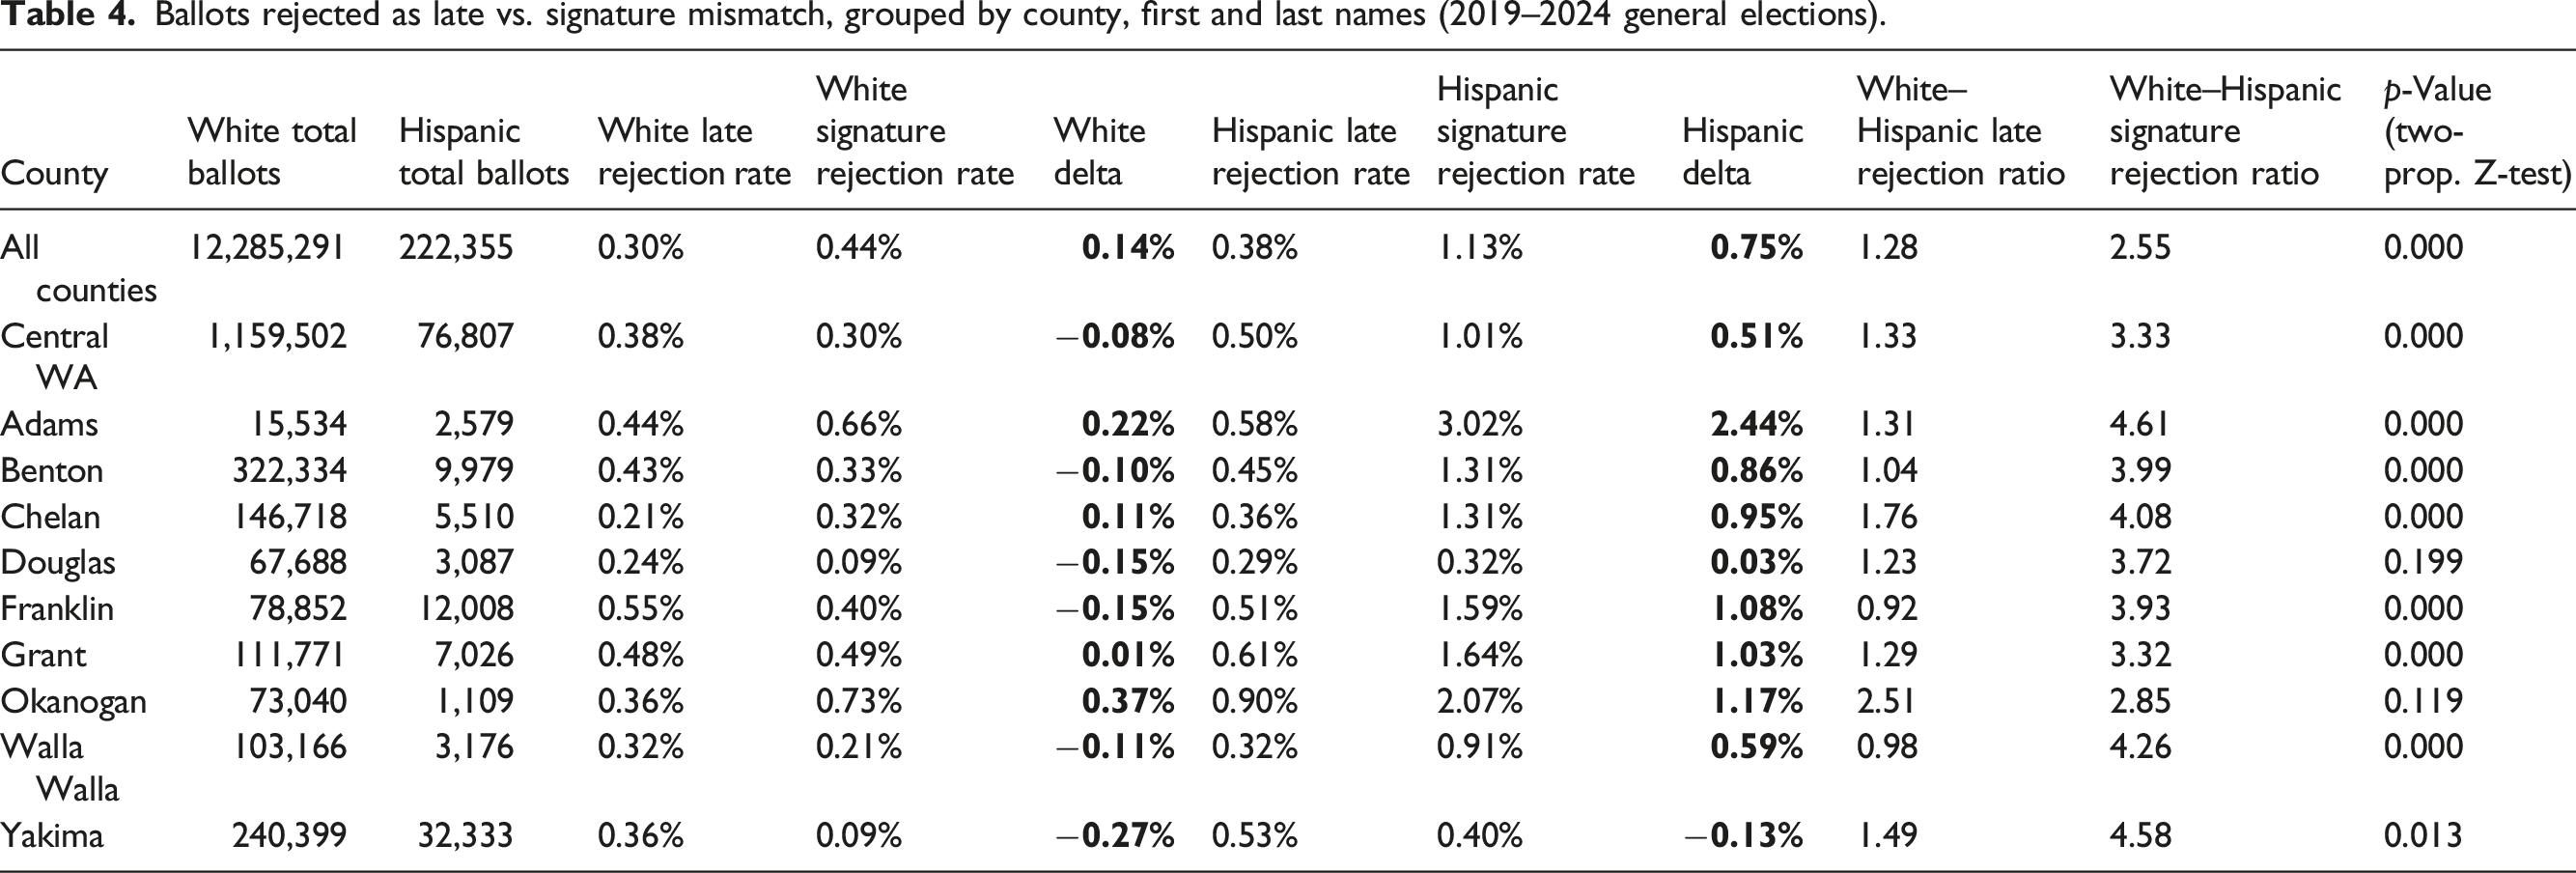
Results in Tables 3 and 4 show that the White–Hispanic differences in late ballot rejection rates are negligible compared to disparities in signature mismatch rejection rates. For example, Table 3 shows that in Benton County, voters with a Hispanic surname had their ballots rejected for signature mismatch at a rate 3.3 times higher than White voters. In contrast, Hispanic voters were rejected for late submission at lower rates than their White counterparts across the same elections (ratio of 0.84). In other counties—and when aggregating data for central Washington or the state as a whole—the White–Hispanic late submission rejection ratio ranges from 1.00 to 2.32. This stands in sharp contrast to signature mismatch rejections, where voters with a Hispanic surname were three to four times more likely to have their ballots rejected than voters with a White surname. The results using both first and last names are substantively consistent with those based on surnames alone. These patterns suggest that while voter-side factors may play some role, the weight of the evidence points to discretionary decisions by election officials as the key driver of the racial disparities observed in signature mismatch rejections.
To further assess whether the gap between signature mismatch and late rejection rates differs significantly between White and Hispanic voters, we calculated a delta for each group, defined as the difference between the signature rejection rate and the late rejection rate. For both groups, we computed the standard error of the delta, treating the signature mismatch and late submission rejection rates as independent proportions: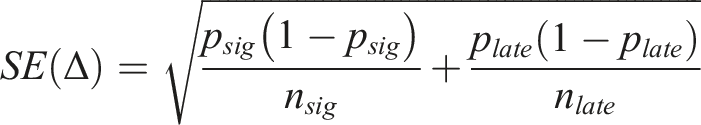
We then used a two-sample Z-test for independent estimates to assess whether the deltas differed significantly between the two groups. This approach treats the deltas as independent and approximately normally distributed and does not pool the variances. The Z-score is calculated by dividing the difference between the group deltas by the square root of the sum of their squared standard errors: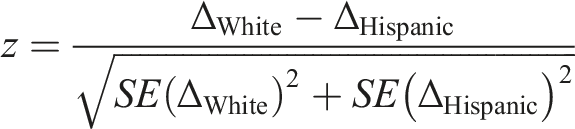
As shown in Table 3, the delta between late submission and signature mismatch rejection rates is consistently larger for voters with Hispanic surnames than for those with White surnames, and this difference is statistically significant at the p < .05 level. For example, at the statewide level, 0.37 percent of ballots cast by voters with Hispanic surnames were rejected for late submission, compared to 1.03 percent rejected for signature mismatch—a delta of 0.66 percentage points. In contrast, 0.30 percent of White surname ballots were rejected for late submission, while 0.47 percent were rejected due to signature mismatch, yielding a delta of just 0.17 percentage points. The evidence shows that the difference between signature mismatch and late submission rejection rates is significantly greater for Hispanic voters than for non-Hispanic White voters. In some cases—such as in the aggregate of all central Washington counties—the delta for White surname voters is negative, meaning that their ballots were rejected more frequently for late submission than for signature mismatch.
We observe substantively similar results when restricting the sample to voters whose first and last names are both classified as either Hispanic or White, as shown in Table 4. In Table A1 and A2 of the online appendix, we further disaggregate the results by election year for both the surname-only and combined first-and-last-name classifications. Except for odd-year, off-cycle elections—which have substantially lower turnout, particularly among Hispanic voters—we find that the difference between signature mismatch and late submission rejection rates remains significantly greater for Hispanic voters than for non-Hispanic White voters. Moreover, across all elections analyzed, the White–Hispanic odds ratio for signature mismatch rejection is always higher than the corresponding odds ratio for late ballot rejection.
Taken together, the weight of the evidence from Study 1 leads us to adopt Hypothesis 2, which suggests that administrative bias—rather than voter-side factors such as experience or familiarity with VBM procedures—is the most likely explanation for the disproportionately high signature mismatch rejection rates among Hispanic voters compared to their White counterparts. To further examine the role of evaluator bias, we turn to Study 2, which uses a design that neutralizes any voter-related factors to isolate the relationship between racial cues embedded in names and signature verification decisions.
Study 2: Signature Evaluation Task
In Study 2, we conducted an online signature evaluation task designed to eliminate voter-related factors and isolate potential bias in the signature verification process. We recruited an online panel of Washington residents and asked participants to evaluate 24 pairs of valid signatures, each paired with either a putatively White- or Hispanic-sounding name. The signature pairs were collected from volunteers in the Los Angeles metropolitan area, allowing us to ensure consistency in handwriting quality while testing whether perceived racial or ethnic identity—signaled through names—affects rejection rates.
The online signature evaluation study was conducted between October 24 and November 14, 2022, and included 1,797 participants from Washington State. 5 Each participant evaluated 24 pairs of valid signatures, each associated with either a putatively White- or Hispanic-sounding name. A key strength of the design is that each signature pair was signed by a single volunteer, ensuring that all differences in rejection rates stem from name-based cues rather than variations in handwriting. Importantly, the assignment of White- or Hispanic-coded names to signature pairs was randomized, decoupling signatory identity from racial cues. This design allows us to rule out voter-side explanations and to isolate the role of evaluator bias in any observed disparities by race or ethnicity.
The survey began with a standard informed consent form, followed by a screener to limit participation to Washington State residents. Respondents were asked to select their state of residence, and those who did not select Washington were screened out and thanked for their time. 6 Our decision to recruit Washington residents as evaluators in the online signature study is both reasonable and, to a meaningful extent, externally valid. Like the signature evaluators in Washington’s elections, participants in our study do not possess formal expertise in handwriting analysis and rely on personal judgment when evaluating signatures. In Washington, election staff responsible for verifying ballot signatures were not required to receive training until a 2023 legal settlement mandated it for select counties (Cohen 2024). As a result, our participant pool does a reasonable job of reflecting the real-world conditions under which many ballot signatures are reviewed: by individuals who rely on subjective assessments without standardized training.
To guide participants through the signature evaluation process, the following prompt was presented:
“Now imagine that you are an election worker reviewing signatures on mailed ballot envelopes for the upcoming election. For each handwritten signature printed on the mailed envelope, make a comparison against that voter's official registration signature. If you believe the signatures were written by two different people, select ‘Reject’. Otherwise, select ‘Accept’. Signature pairs will be given to you in sets of 8, beginning with three sets. Please take this exercise seriously.”
Following the prompt, respondents evaluated 24 signature pairs, presented in sets of eight with short breaks between each set. Each pair consisted of one handwritten signature and one digital signature, similar to the type produced on a digital pad at a driver’s licensing office when registering to vote. The order of the signature pairs was randomized, and the voter’s printed name was displayed above each signature pair (see Figure 2 for an example). Digital and handwritten signature exemplar.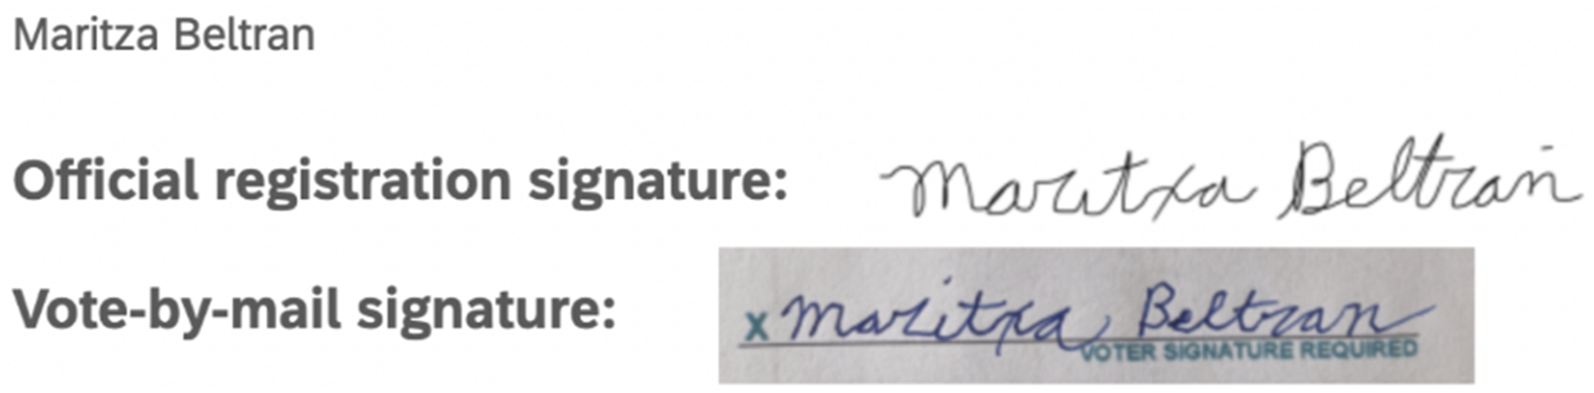
We included the printed name alongside the signatures to closely replicate real-world conditions. In Washington State, printed names are part of the voter information section on ballot signature pages reviewed by the Canvassing Review Board and are also visible on the mailed ballot declaration and within the VoteWA system used by election workers.
To ensure the study reflected the demographic composition of Washington’s electorate—where White voters outnumber Hispanic voters, even in central Washington counties—we included fifteen White-coded names and nine Hispanic-coded names. Although this ratio does not fully mirror the population distribution, we intentionally oversampled Hispanic-coded names to ensure a sufficient number of observations for detecting potential differences in rejection rates between White and Hispanic-coded signatures.
Hispanic names.

White names.
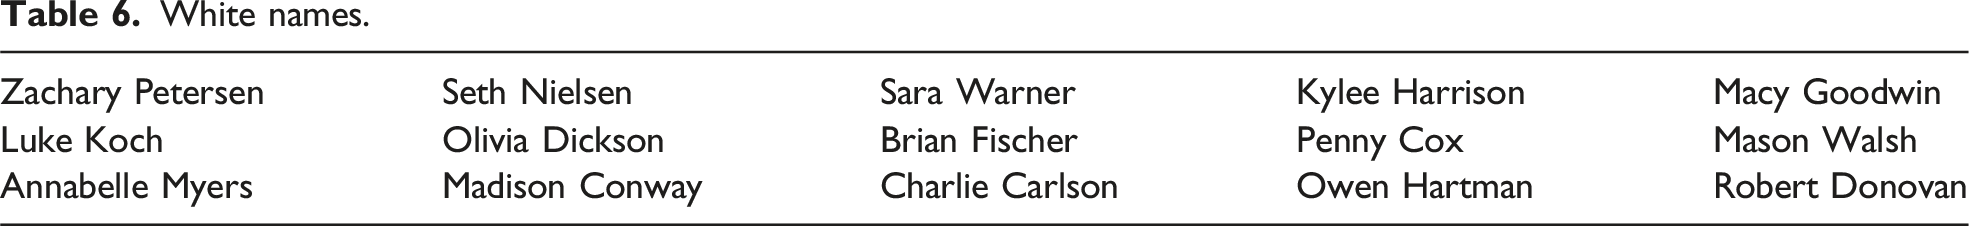
After finalizing the list of Hispanic and White names, we recruited volunteers from diverse racial and ethnic backgrounds to provide both a handwritten and a digital signature for one of the assigned names. The handwritten signature was designed to replicate the type of signature a voter would provide on a physical ballot, while the digital signature mirrored the style typically captured on electronic pads at driver’s licensing offices during voter registration. Appendix B in the online supplemental material provides images of each signature pair and more details about the signature curing process.
To account for potential confounding variables related to the signer’s identity, names were randomly assigned to volunteers from diverse racial and ethnic backgrounds. As a result, Hispanic-coded names were not exclusively signed by Hispanic volunteers, nor were White-coded names signed solely by White volunteers. This ensured that each signature pair was produced by a single individual, decoupling the racial or ethnic background of the signer from the name assigned to the signature. This design choice rules out the possibility that inherent differences in handwriting styles across racial or ethnic groups could explain disparities in rejection rates. By isolating the name cue from the signer’s identity, we are therefore able to attribute any observed differences in rejection rates to how evaluators perceive the racial or ethnic signals embedded in the names—rather than to differences in handwriting quality or style.
To analyze participants’ responses, we coded whether each signature pair was accepted or rejected. Accepted signatures were coded as 1 and rejected signatures as 0. To calculate each respondent’s Hispanic signature acceptance rate, the scores for the nine Hispanic-coded signature pairs were summed and divided by nine. The same method was applied to the fifteen White-coded signature pairs, yielding a White signature acceptance rate. This resulted in two acceptance rates per participant—one for Hispanic-coded names and one for White-coded names—allowing for a direct comparison of how each respondent evaluated signatures associated with different racial or ethnic name cues.
Main Analyses and Findings
We begin by examining whether participants, on average, evaluated ballot signatures with Hispanic- and White-coded names differently. Statistically significant differences in acceptance rates are attributed to bias for several reasons. First, all signature pairs were signed by the same individual, ruling out actual mismatches. Second, signatories from diverse racial and ethnic backgrounds were randomly assigned to either Hispanic- or White-coded names, ensuring that signature characteristics were not systematically linked to racial identity. Third, all signers followed a standardized process—producing one handwritten and one digital signature—ensuring consistency across pairs. Fourth, the order of signatures presented to survey participants was randomized to avoid ordering effects.
Paired t test of Hispanic and White signature acceptance rates.
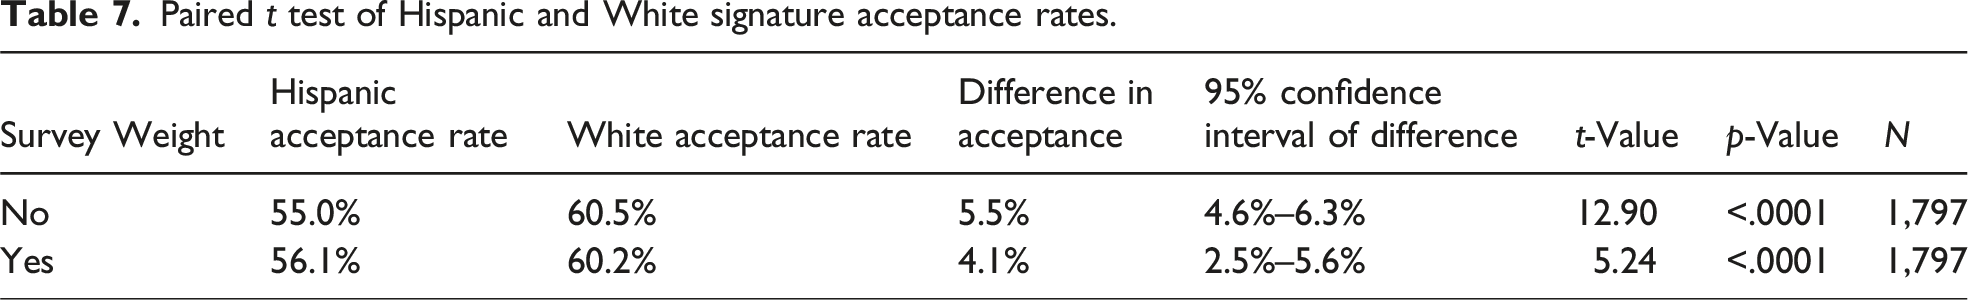
As shown in the second and third columns of Table 7, study participants accepted about 55–60 percent of the signature pairs they reviewed—well below the acceptance rate we observed in the administrative records from Study 1. We attribute this gap to natural differences in evaluation context. Real-world election workers handle hundreds or thousands of ballots under a presumption of validity and their decisions can be reviewed or overturned by a canvassing board. In contrast, our participants reviewed a small, isolated set of signature pairs without an explicit instruction to presume validity and made decisions unilaterally. These factors—higher stakes, volume, and procedural safeguards—likely drive the higher acceptance rates seen in practice.
Importantly, despite this lower baseline, the results of the paired t test provide strong evidence against the null hypothesis of no difference in mean acceptance rates between Hispanic- and White-coded signatures. Without using survey weights, Hispanic-coded signatures were accepted at a mean rate of 5.5 percentage points lower than White-coded signatures. This difference is statistically significant, with a t-value of 12.91 and a p-value of < .0001. The 95 percent confidence interval for this difference ranges from 4.6 to 6.3 percentage points. In other words, signatures associated with Hispanic names were, on average, rejected 5.5 percent more often than those associated with White names.
This pattern holds when using survey weights to better reflect Washington’s electorate. Under the weighted analysis, the mean acceptance rate for Hispanic-coded signatures was 4.1 percentage points lower than for White-coded signatures, with a 95 percent confidence interval ranging from 2.5 to 5.6 percentage points.
These findings provide strong evidence that racial cues embedded in names influence how evaluators assess signature validity. Despite all signature pairs being objectively valid, participants were significantly more likely to reject ballots associated with Hispanic-coded names. This disparity persists even when adjusting for the demographic composition of Washington’s electorate, reinforcing the conclusion that evaluator bias—rather than voter-side factors—plays the central role in the disproportionate rejection of Hispanic ballot signatures.
Additional Analysis
We also conducted supplementary analyses to examine whether individual differences in explicitly reported attitudes explain variations in differential acceptance rates. Since our survey cannot disentangle implicit from explicit bias, this analysis offers an initial, exploratory investigation of whether consciously held views relate to rejection patterns as opposed to only implicit biases driving discriminatory behavior. More specifically, we constructed a measure of explicit bias from feeling-thermometer ratings of Whites and Immigrants and used it to predict participants’ acceptance rates for Hispanic- and White-named signatures. Results indicate that explicit anti-immigrant sentiment is significantly associated with lower acceptance of Hispanic-coded signatures, even after controlling for sociodemographic and political factors. By contrast, explicit bias had no significant effect on the evaluation of White-coded signatures. These findings suggest that consciously held anti-immigrant attitudes may contribute to the disparate rejection of Hispanic-named signatures, although implicit bias remains the most significant driver of overall disparities. Full details of this analysis, including model specifications, robustness checks, and figures, are provided in the online supplementary material (Appendix C5).
Conclusion
Consistent with a growing body of research on vote-by-mail ballot rejection, our statewide and county-level audit shows that ballots bearing Hispanic-sounding names are significantly more likely to be rejected for signature mismatch than those bearing White-sounding names. Importantly, this Hispanic–White gap virtually disappears or was not nearly as pronounced for late-submission rejections—when voter-side factors would be most salient—suggesting that the signature-mismatch disparity arises primarily from discretionary judgment rather than “cultural” or procedural factors related to voters. Our online signature evaluation study, which held all voter-related characteristics constant, reproduced a similar outcome: participants were far more likely to reject valid signature pairs with Hispanic names. Regression analyses further revealed that individuals with stronger pro-White/anti-immigrant sentiments were significantly more prone to reject Hispanic-named signatures but showed no corresponding increase in rejecting White-named ones.
These findings point squarely to evaluator bias as a key driver of racial disparities in VBM signature verification. When administrative discretion produces such disparate rejection rates, it undermines the promise of equal participation and erodes trust in electoral institutions. Even well-intentioned bureaucratic procedures, when unchecked, can perpetuate racial inequities in access to the ballot. However, we are not suggesting that signature verification or VBM elections should be discarded. On the contrary, we agree with existing research showing that VBM expands access and increases turnout among historically underrepresented groups compared to in-person elections (Bonica et al. 2021). We simply suggest that even inclusive electoral reforms like universal VBM can contain procedural elements that require scrutiny and improvement. Such improvements can include enhanced training, technology-assisted checks, and expanded curing options to uphold core democratic principles of fairness, accountability, and inclusion. This view is consistent with the recent Vet Voice Foundation v. Hobbs decision, in which the Washington Supreme Court upheld the constitutionality of the state’s signature verification system (Washington Supreme Court 2025). While the Court affirmed that signature matching is a valid election security measure, it also acknowledged the real impact of ballot rejections and emphasized the importance of procedural safeguards—such as expanded cure opportunities—to protect voters from disenfranchisement.
In light of our findings, jurisdictions may consider adopting automatic signature verification (ASV) technology to reduce the role of human subjectivity. Indeed, Washington explicitly allows for counties to employ ASV so long as the software is approved by the Secretary of State’s Office (RCW 29A.40.110), though Pierce County, to our knowledge, is the only jurisdiction that actively uses an ASV system for its signature verification process (Pierce County Elections 2024).
Outside of Washington, several counties across the country have partnered with ASV vendors like BlueCrest and ParaScript to process their mailed ballots more efficiently. However, because of the proprietary nature of ASV tools, little is known about how they are trained and how accurate they are. We therefore caution against viewing ASV as a cure-all. If adopted, ASV systems must be subject to rigorous public auditing similar to that of facial recognition systems (Grother et al. 2019), representativeness testing, and mechanisms to override by trained human reviewers. This is a clear area for future research and is especially important given that ASV technologies “fall outside the scope of federal and state regulations for electronic voting systems” (Janover and Westphal 2020, 332).
Building on insights from public administration and social psychology, future research should examine interventions that could mitigate or curb biased decision-making. For example, studies of police misconduct show that procedural reforms and increased managerial oversight can meaningfully alter behavior (Mummolo 2018). These same strategies could be adapted for signature evaluators, testing whether standardized workflows, supervisor review, or audit trails reduce disparate outcomes.
Likewise, experiments that manipulate evaluators’ cognitive resources—by adjusting review time, task load, or decision aids—could reveal how pressure and limited deliberation exacerbate bias (Fazio 1990). In the VBM context, increasing time allowances or providing decision-support tools may improve accuracy and equity, but these possibilities remain to be rigorously tested in field settings and across different jurisdictions.
Supplemental Material
Appendix A. Supplemental Material - Bureaucratic Bias or Voter-Side Factors? Testing Competing Explanations for Racial Gaps in Vote-By-Mail Ballot Signature Rejections
Appendix A. Supplemental Material for Bureaucratic Bias or Voter-Side Factors? Testing Competing Explanations for Racial Gaps in Vote-By-Mail Ballot Signature Rejections by Michael Herndon, Kassra A. R. Oskooii, and Michael Rios in Political Research Quarterly.
Supplemental Material
Appendix B. Supplemental Material - Bureaucratic Bias or Voter-Side Factors? Testing Competing Explanations for Racial Gaps in Vote-By-Mail Ballot Signature Rejections
Appendix B. Supplemental Material for Bureaucratic Bias or Voter-Side Factors? Testing Competing Explanations for Racial Gaps in Vote-By-Mail Ballot Signature Rejections by Michael Herndon, Kassra A. R. Oskooii, and Michael Rios in Political Research Quarterly.
Supplemental Material
Appendix C. Supplemental Material - Bureaucratic Bias or Voter-Side Factors? Testing Competing Explanations for Racial Gaps in Vote-By-Mail Ballot Signature Rejections
Appendix C. Supplemental Material for Bureaucratic Bias or Voter-Side Factors? Testing Competing Explanations for Racial Gaps in Vote-By-Mail Ballot Signature Rejections by Michael Herndon, Kassra A. R. Oskooii, and Michael Rios in Political Research Quarterly.
Footnotes
Funding
The authors received no financial support for the research, authorship, and/or publication of this article.
Declaration of Conflicting Interests
The authors declared no potential conflicts of interest with respect to the research, authorship, and/or publication of this article.
Supplemental Material
Supplemental material for this article is available online.
Notes
References
Supplementary Material
Please find the following supplemental material available below.
For Open Access articles published under a Creative Commons License, all supplemental material carries the same license as the article it is associated with.
For non-Open Access articles published, all supplemental material carries a non-exclusive license, and permission requests for re-use of supplemental material or any part of supplemental material shall be sent directly to the copyright owner as specified in the copyright notice associated with the article.