
Abstract
Understanding social media’s role in political communication is crucial in the evolving media landscape. Motivated by the transformative impact of social media on political engagement and discourse, this research fills an under-explored academic gap, studying the effects of geographic focus—local versus national—in candidates’ tweets on U.S. Senate election outcomes. It reveals a modest but significant correlation between the nature of political discourse and election competitiveness. Interestingly, strict adherence to party-centric topics did not significantly influence electoral success. The study assessed the performance of regression and classification models in forecasting election outcomes, with classification models demonstrating superior results. Both models provide a new benchmark for future studies in political communication on social media. These findings bear considerable implications for political practitioners, indicating that election success is not merely guaranteed by echoing party-centric issues or predominantly adopting a national communication scope.
Keywords
Introduction
The advent of social media has dramatically transformed political engagement and discourse, creating an environment where political actors and constituents interact continuously and publicly (Effing, Van Hillegersberg, and Huibers 2011; Loader and Mercea 2011). While this constant engagement gives politics an air of ephemerality, it also enables the convergence of individuals with similar viewpoints, amplifying their collective political messages. Motivated by a desire to comprehend how such synchronous communication impacts election outcomes, this study asks: Does the content and scope of social media political discourse indeed influence voter behavior and, consequently, election results?
Considerable research has been dedicated to disentangling the intricate dynamics between politics and citizens in the online sphere (Brito, Filho, and Adeodato 2021; Gayo-Avello 2013). It is recognized that platforms such as Twitter offer an essential channel for candidates and political parties to communicate with voters, mobilize supporters, and shape public opinion (Das et al. 2022).
Existing studies in this field generally fall into two categories. The first type investigates citizens’ behavior, exploring their sentiments toward candidates (Grover et al. 2019; Liu et al. 2021) and how they connect and discuss political topics with one another (Barberá et al. 2015; Hanna et al. 2011; Jungherr 2016). The second category scrutinizes the conduct of political candidates, precisely their focus topics (Ausubel 2019; Feezell 2018; Granberg-Rademacker and Parsneau 2021) and the geographic scope of their discourse (Das et al. 2022; Schürmann 2023).
Despite these extensive efforts, there is a significant gap in understanding the influence of geographic scope (local vs. national) and the topical focus of candidates’ tweets on election outcomes. This study aims to fill this gap by taking a cue from Schürmann’s work highlighting this dynamic during the 2017 and 2021 Federal German Elections. Schürmann (2023) found that candidates from highly competitive districts referenced their districts almost five times more often than those in non-competitive communities, indicating the potential impact of local-national dynamics in political communication.
Our research targets the 2022 Midterm Elections in the United States, chosen due to the recentness of the data and the relatively untapped nature of this event for such a study. As Americans reportedly spend over 7 hours online daily, with nearly 2 hours on social media platforms (Data Reportal 2022), Twitter, a preferred source for current events (Odabaş 2022a, 2022b), is selected as the study platform for its potential to mirror and influence real-world political events.
Given the ongoing trend of election nationalization (Alemán and Kellam 2008; Carson and Sievert 2018; Hopkins 2018) and the concerted communication strategies of political parties (Barberá et al. 2015; Iyengar and Westwood 2015), we aim to discern whether national and party-wide discussion topics can explain Senate election results. Additionally, we examine whether each race, especially tightly contested ones, has unique topical dynamics. Given this context, the research’s question is, “Can we predict who will win the Senate race based on their Twitter content?”
The study begins with a review of the literature on the interplay between Twitter and politics, followed by an explanation of the research methodology, a presentation of results, and a discussion of the findings. The study aims to enrich the understanding of political communication on social media and its influence on election outcomes.
Literature Review
Twitter and Politics
Social Media platforms have risen since the early 2010s, becoming an integrated part of everyone’s life, with 59.3 percent of the world population using these platforms daily, which means 94 percent of internet users use social media. In the United States, 75 percent of its population actively uses Social Media, spending around 2 hours daily on these platforms (Data Reportal 2022).
Twitter is the favorite social media platform for getting the news and keeping up with trending topics, and this is a new channel that politicians are trying to explore to convey their agenda. Accounting that 97 percent of the created content in the United States is produced by only 25 percent of its users (Odabaş 2022b), Twitter is a place where most users come to read and reply rather than create (Mitchell 2022; Odabaş 2022a), with 4 out of 10 American adults saying that Twitter increased their understanding of current events (Odabaş 2022a, 2022b). In the aftermath of major societal events, political activity on Twitter can get 14 times the volume of tweets and retweets than an average day (Shah and Bestvater 2022). Participation in political discussions on social media and using these platforms for political purposes is one of the strongest indications of political participation (Dimitrova et al. 2014; Rita, António, and Afonso 2023).
With a central role in the spread of information from citizens and candidates during campaigns, Twitter has become a source of information for contemporary political communication studies, primarily focusing on one of two aspects: (1) How politicians behave on these platforms to influence citizens and their participation, particularly during campaigns (Ausubel 2019; Feezell 2018; Granberg-Rademacker and Parsneau 2021); (2) How citizens engage in political conversation and share their views (Barberá et al. 2015; Grover et al. 2019; Hanna et al. 2011; Jungherr 2016; Liu et al. 2021). These research areas ultimately try to explain how these actors’ dynamics can explain or predict election outcomes.
Midterm Elections Candidates and Twitter
First, the scope (local or national) of political discourse differs according to the type of election or political affiliation. According to Das et al. (2022), congresspeople and governors have a more nationalized focus than mayors, which is congruent with the increasing nationalization of American elections (Alemán and Kellam 2008; Carson and Sievert 2018; Hopkins 2018), especially given how polarized the American political environment is (Zingher and Richman 2019).
Despite this increasing nationalization, there is still some concern with local issues, with candidates discussing local issues such as infrastructure projects in their districts (Bode and Dalrymple 2016, 140). Schürmann (2023) found that in both the 2017 and 2021 Federal German Elections, candidates in highly competitive districts, with a marginality between winners and top-runners under 5 percent, referred “almost five times more often to their districts than candidates in non-competitive districts” (Schürmann 2023). Although German Federal Elections have similar dynamics to American Midterm Elections, several national parties in Germany might explain the contradiction with the nationalization of elections in the United States, in which Republican and Democratic parties mostly dominate.
Election winners tend to focus more on national issues when running in loose races.
Election winners tend to focus more on local issues when running in tight races.
Regarding spoken topics, there is also a difference between parties, with Republicans and Democrats speaking about different issues or giving different emphases to the same problem. According to Ausubel (2019), in a study regarding U.S. House of Representative candidates’ tweets during the 2018 midterm elections, Democrats focused on gun violence and healthcare, while Republican candidates focused more on Illegal Immigration.
When the topics referred to are the same, candidates from different parties use different diction or emphasis to refer to those topics (Ausubel 2019). For example, regarding Donald Trump’s Tax Policy, while Democratic candidates tend to use the expression “Tax Cut,” Republican candidates use “Tax Reform.” The same happened with healthcare, more specifically, the Affordable Care Act. While Republican candidates refer to “Obamacare,” Democratic candidates refer to the “Affordable Care Act.” This tendency to prioritize various topics according to party identification (Goggin, Henderson, and Theodoridis 2016) is consistent with more significant trends in political communication and voting behavior (Abramowitz and Saunders 1998).
This relationship between partisanship and topic ownership can also explain the increasing nationalization of elections, with Americans caring “less about the specific person who represents them and more about the partisan balance of power in Congress” (Das et al. 2022).
Election winners tend to Tweet in line with their party counterparts.
Citizens and Twitter
Research indicates that Twitter plays a pivotal role in political discussions and public opinion formation. It acts as a venue for political conversation and mobilization (Barberá et al. 2015; Dimitrova et al. 2014; Hanna et al. 2011). It can facilitate political participation but also magnify political divisiveness and misinformation.
Studies have confirmed an increased tendency towards homophily on Twitter, where users connect with those sharing similar habits, lifestyles, or moral views (Hong and Kim 2016; Vaisey and Lizardo 2010). This tendency fosters an “us vs. them” posture, leading to echo chambers of polarized ideas (Benton 2022; Gruzd and Roy 2014; Lee 2007; Yardi and boyd, 2010). This bias is more pronounced among Republicans (Iyengar and Westwood 2015; Jost et al. 2018), who often share negative content about left-leaning ideologies (Barberá et al. 2015; Shah and Bestvater 2022).
Despite the echo chamber effect, Twitter also fosters cross-ideological communication, primarily through hashtags and mentions (Conover et al. 2011; Jungherr 2016; Stieglitz and Dang-Xuan 2013). However, this exposure to differing views does not appear to diminish polarization (Bail et al. 2018). Left and right-leaning users form separate clusters but often discuss the same topics using different terms (Shah and Bestvater 2022).
The rise of social media has also facilitated the spread of fake news and the use of bot accounts to propagate misinformation, potentially impacting political involvement and election outcomes (Allcott and Gentzkow 2017; Del Vicario et al. 2016; Guess, Nyhan, and Reifler 2020; Howard, Woolley, and Ryan 2018). While this might impede bipartisan conversations and agreements (Sunstein 2017), it can also reinforce the nationalization of elections and the division of topics between dominant parties.
Why Politicians Use Social Media
Several studies have explored why politicians increasingly use social media platforms like Twitter. Hong, Choi, and Kim (2019) found that extremists, underdogs, and opposing parties are more likely to use Twitter due to its ability to reach a wider audience without the gatekeeping barriers of traditional media. This particularly benefits those who need more visibility or want to challenge the mainstream narrative.
Moreover, politicians use social media to engage directly with their constituents, bypassing traditional media channels and providing real-time updates and responses. This direct engagement can foster a sense of connection and immediacy, which is particularly valuable in modern political campaigns (Hong, Choi, and Kim 2019).
While extensive research has been conducted on the role of social media in political communication, several limitations persist. Many studies focus on a single platform, primarily Twitter, which may need to fully capture the complexity of political communication across different social media channels. Additionally, longitudinal data is often needed, making it difficult to assess the long-term impact of social media on political outcomes (Kubin & von Sikorski 2021).
Methodology
Knowing that there is evidence showing that elections in the United States are getting more nationalized (Alemán and Kellam 2008; Carson and Sievert 2018; Hopkins 2018), and both Democratic and Republican parties tend to focus on different issues (Goggin, Henderson, and Theodoridis 2016), this study sought to prove that candidates who follow their party’s topics win the election, being it the H2 Hypothesis. We believe that loose races have a more nationalized speech than tight ones, following the findings of Schürmann (2023), and formulated both H1a and H1b. The following study design framework was developed based on the three hypotheses, as demonstrated in Figure 1. It will guide the hypotheses testing and answer our main goal of creating a model to predict election outcomes based on candidates’ tweets during the campaign. Study design framework.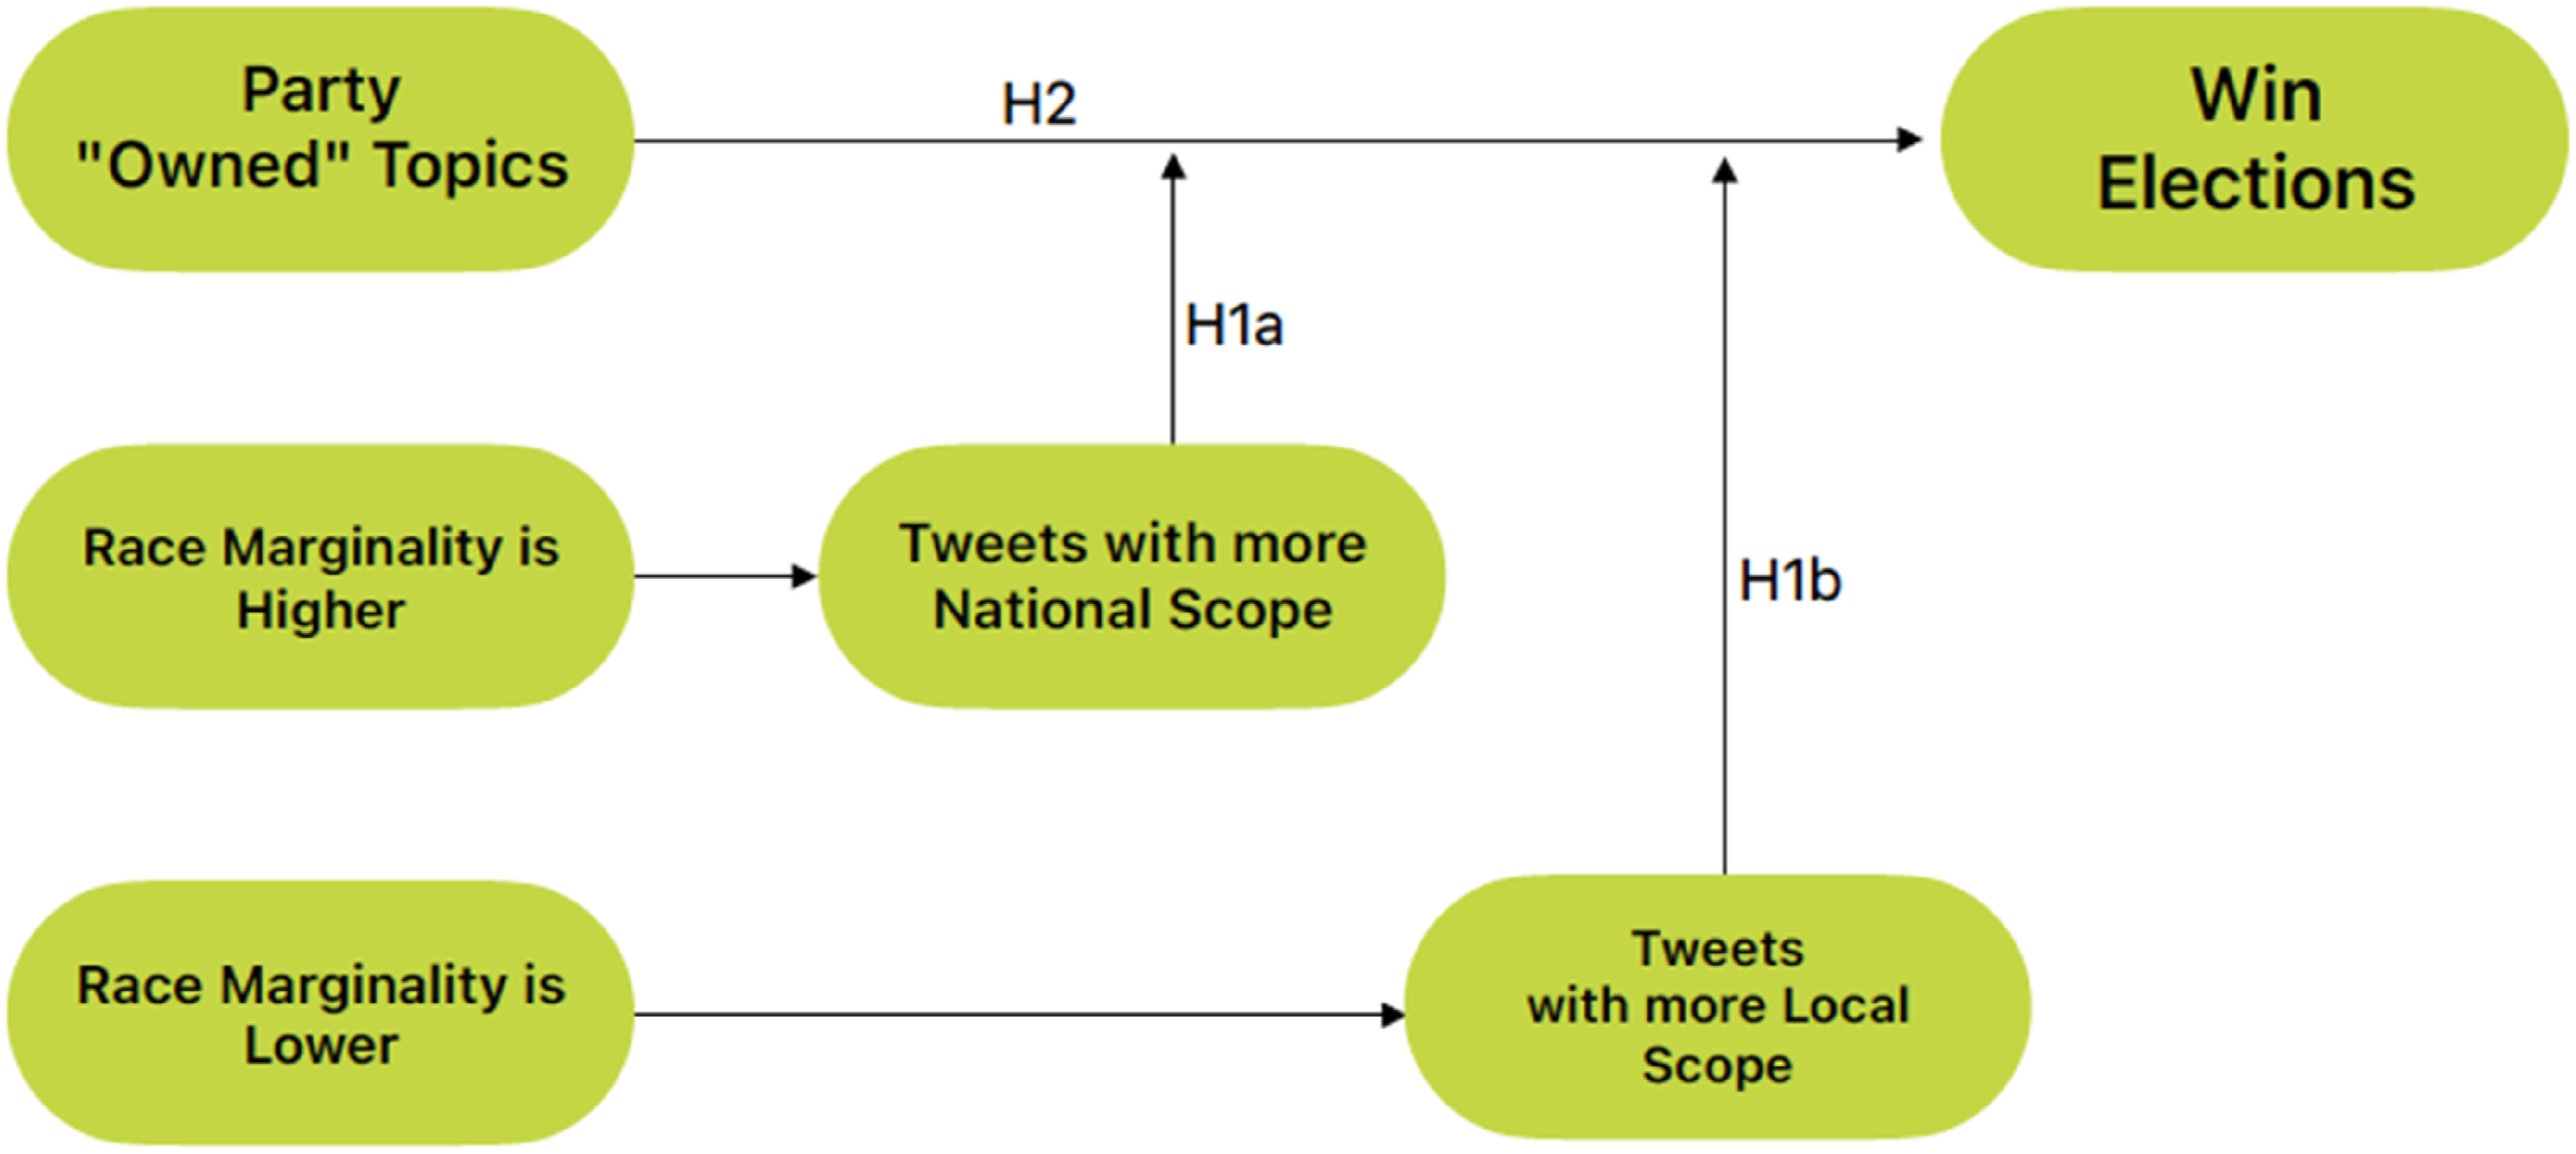
This research followed the Cross-Industry Standard Process for Data Mining (CRISP-DM) framework (Chapman et al. 2000), a well-known and proven methodology for text mining and machine learning projects. The CRISP-DM framework consists of six steps that guide professionals and researchers through the whole project, keeping in mind that this kind of work follows an iteration approach, not a linear one.
This study uses secondary data from Twitter’s public application programming interface (API) and other election-related sources. To study if candidates’ tweets topics and scope can predict the 2022 midterm election result, three data sources were collected and constructed, as explained in the data understanding and data preparation parts of the methodology: one with candidates’ tweets from March 1, 2022, till November 7, 2022, the date of the first primary election for this run (“2022 Midterm Election Calendar - 270toWin” 2022) and the day before of the polls, respectively. For example, although the elections for senator in the State of Georgia had a second round, only the tweets until November 7, 2022, were considered, not to introduce bias into the topic discovery; the second data source has election results, with name, state, percentage of votes, affiliated party and if the candidate won the election; the third data source is made of an extensive list of counties, cities and other places across all states, so it can be checked if a candidate makes tweets related with her State.
After data had been collected, it was pre-processed, and then different topic modeling models were applied, splitting this analysis between tweets containing local references and those not. Each candidate’s average distribution of topics was calculated, and these variables were considered independent. Several classification and regression models were run to test the hypotheses and evaluate the results.
In analyzing the dependent variable, we focused on the distribution proportion of tweets across topics rather than the sheer number of tweets. This approach allows us to capture candidates’ relative emphasis on different issues within their overall social media strategy. A candidate might tweet frequently about local or party-owned issues, but these could still constitute a smaller proportion of their tweets. By examining the proportion of tweets, we can better understand the strategic allocation of attention across various topics.
We also categorized tweets as “national” if they were not explicitly coded as “local,” ensuring a clear distinction between the two categories. This method provides a consistent framework for analyzing the focus of candidates’ social media content.
Project Understanding
The U.S. Congress comprises two chambers: The House of Representatives, composed of 435 congresspeople, and the Senate, composed of 100 Senators, two from each state (“U.S. Senate” 2023). Federal elections happen every 2 years, and all the 435 seats of the House of Representatives are up for election. In contrast, 33 or 34 of the Senate seats are generally disputed since some Senators serve a 6-year mandate, split into three different classes of seats, making up about a third of the Senate ballot every 2 years. In the 2022 Federal elections, due to the resignment of Oklahoma’s senator Jim Inhofe (Ballotpedia 2023b) and the election of California’s senator Kamala Harris as Vice President of the United States (Ballotpedia 2023a), there were 35 Senate seats up for election. Due to election rules, a second round took place in the Georgia state senate election, which was held on the 6th of December.
Since there was one seat for election in each state for the Senate, this race can be seen as a direct dispute between candidates instead of multiple open seats for the House of Representatives in each state. For this reason, was studied the senate election where direct winners and losers for each race can be identified. An overview of all candidates’ results can be seen in Appendix A.
Data Understanding
Twitter Data
Utilizing the advanced capabilities of Twitter’s public API, data was extracted via a research account, allowing access to tweets from any period. Specific queries were designed to retrieve data based on the date range and the tweet author’s handle, with a clear focus on original content generated by campaign pages.
Campaign Twitter handles were located on Ballotpedia, providing 81 valid accounts out of 98 candidates participating in 35 elections. Without a campaign account, personal or official Twitter accounts were utilized. Unfortunately, no Twitter account could be found for 17 candidates, often affiliated with parties other than Democrats or Republicans.
Description of Data Extracted Through Twitter’s API
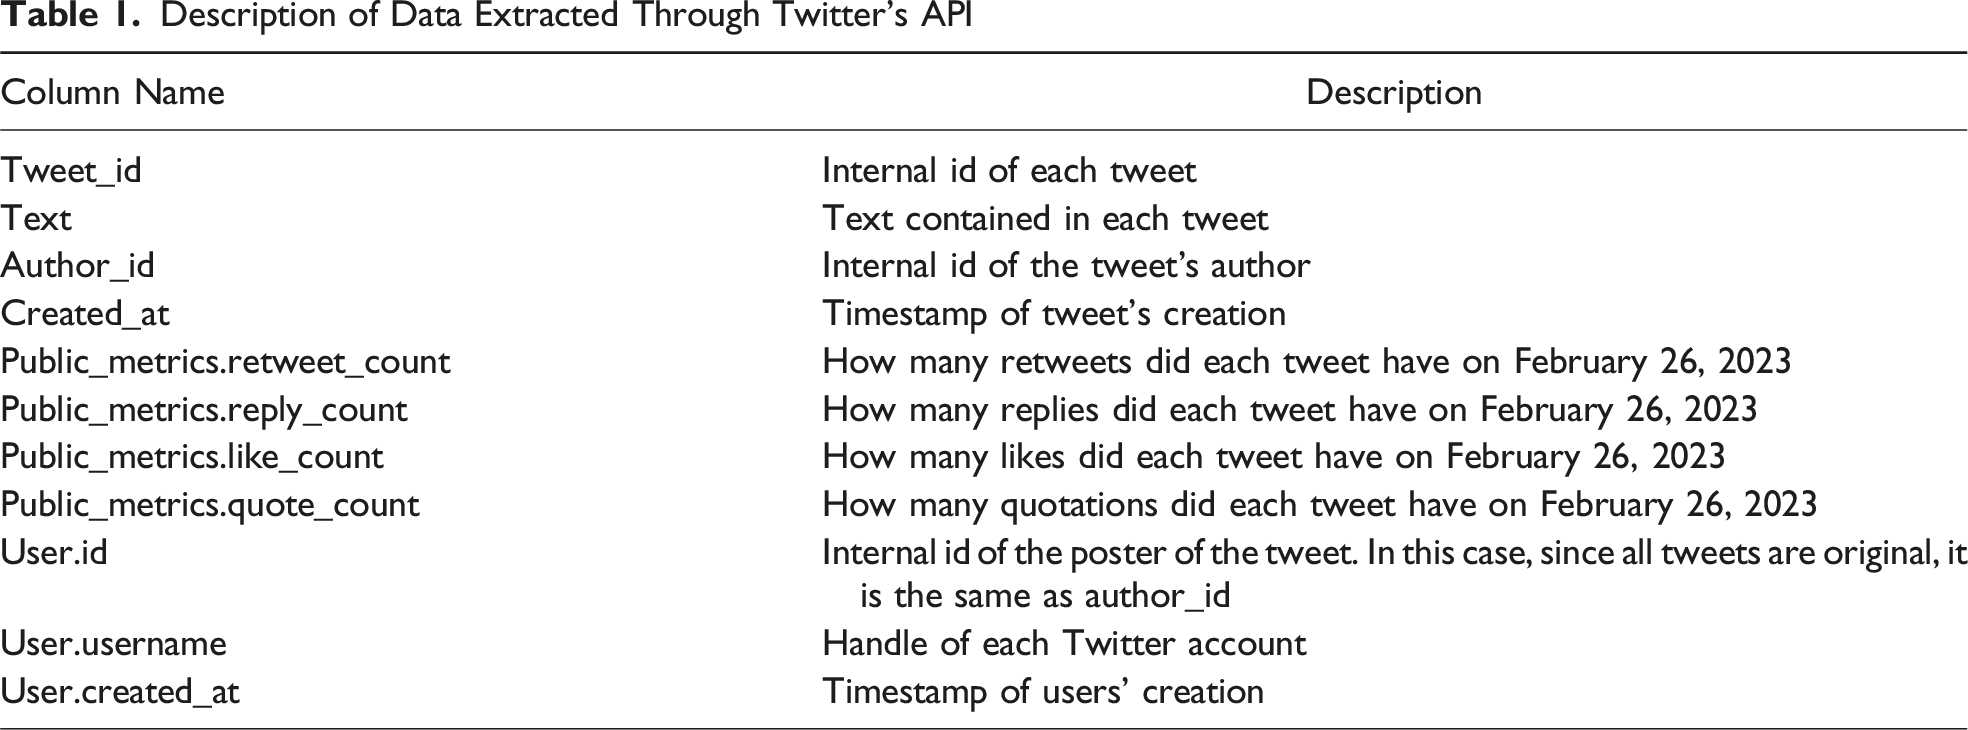
This data revealed some interesting findings. First, most accounts were created before 2022, so they were already used as personal accounts or for previous campaigns with an existing follower base. The same trend can be seen in Figure 2, with many accounts having a more significant share of tweets before March 2022, revealing they had activity before the campaign. Distribution of tweets before and during campaign.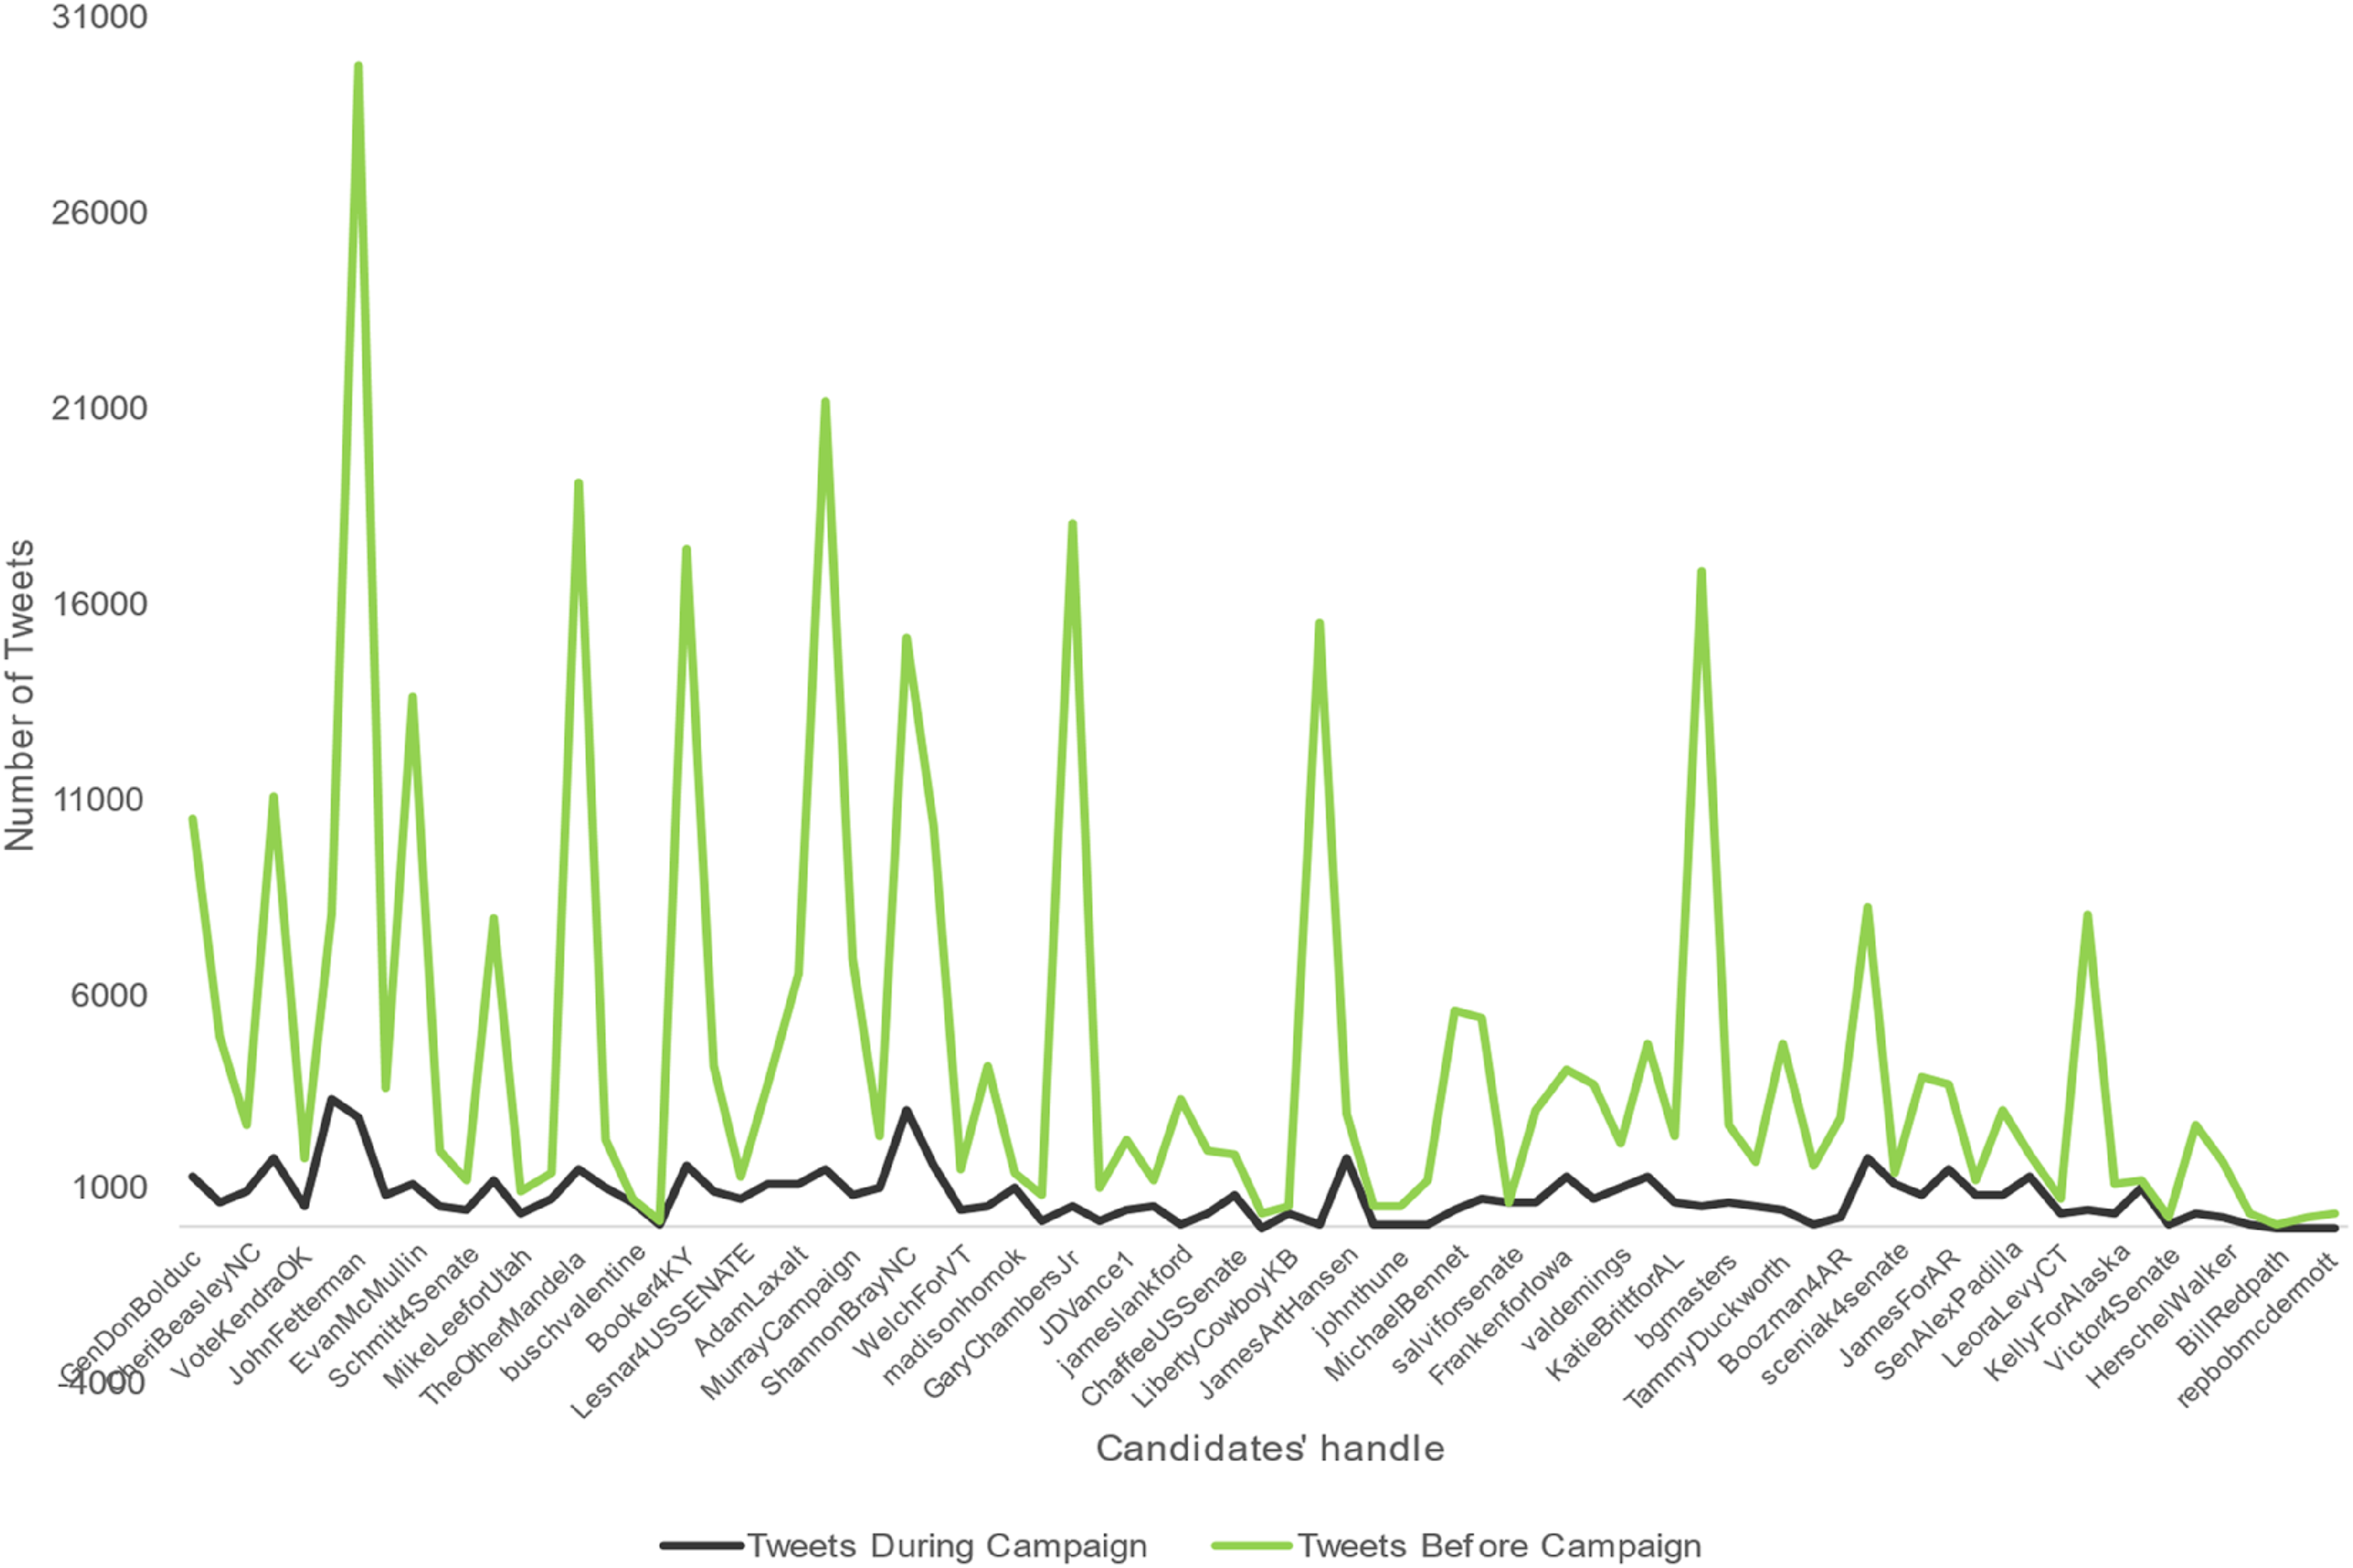
Focusing on the campaign timeframe, as is seen in Figure 3, of the 81 candidates with an existing Twitter account, 31 generated at most 530 tweets, and 30 generated between 530 and 1,060 tweets. There are also differences in the number of tweets generated by party, with the Democratic party generating 28,198 (46 percent) Tweets, the Republican party 19,751 (32 percent), the Liberal party 9,101 (15 percent), and independent candidates generating the rest 7 percent of tweets. This difference in Tweets generated by democrats is consistent with findings that the Twitter user base is left-leaned (Brito, Silva Filho, and Adeodato 2022), giving more incentives to Democrat candidates to share content. Finally, Figure 4 shows us that with the evolution of the campaign, candidates slowly increased communication volume, with the week before the election seeing a considerable increase in this volume. Generated tweets by candidate. Evolution of Tweets on the 36 weeks of the campaign.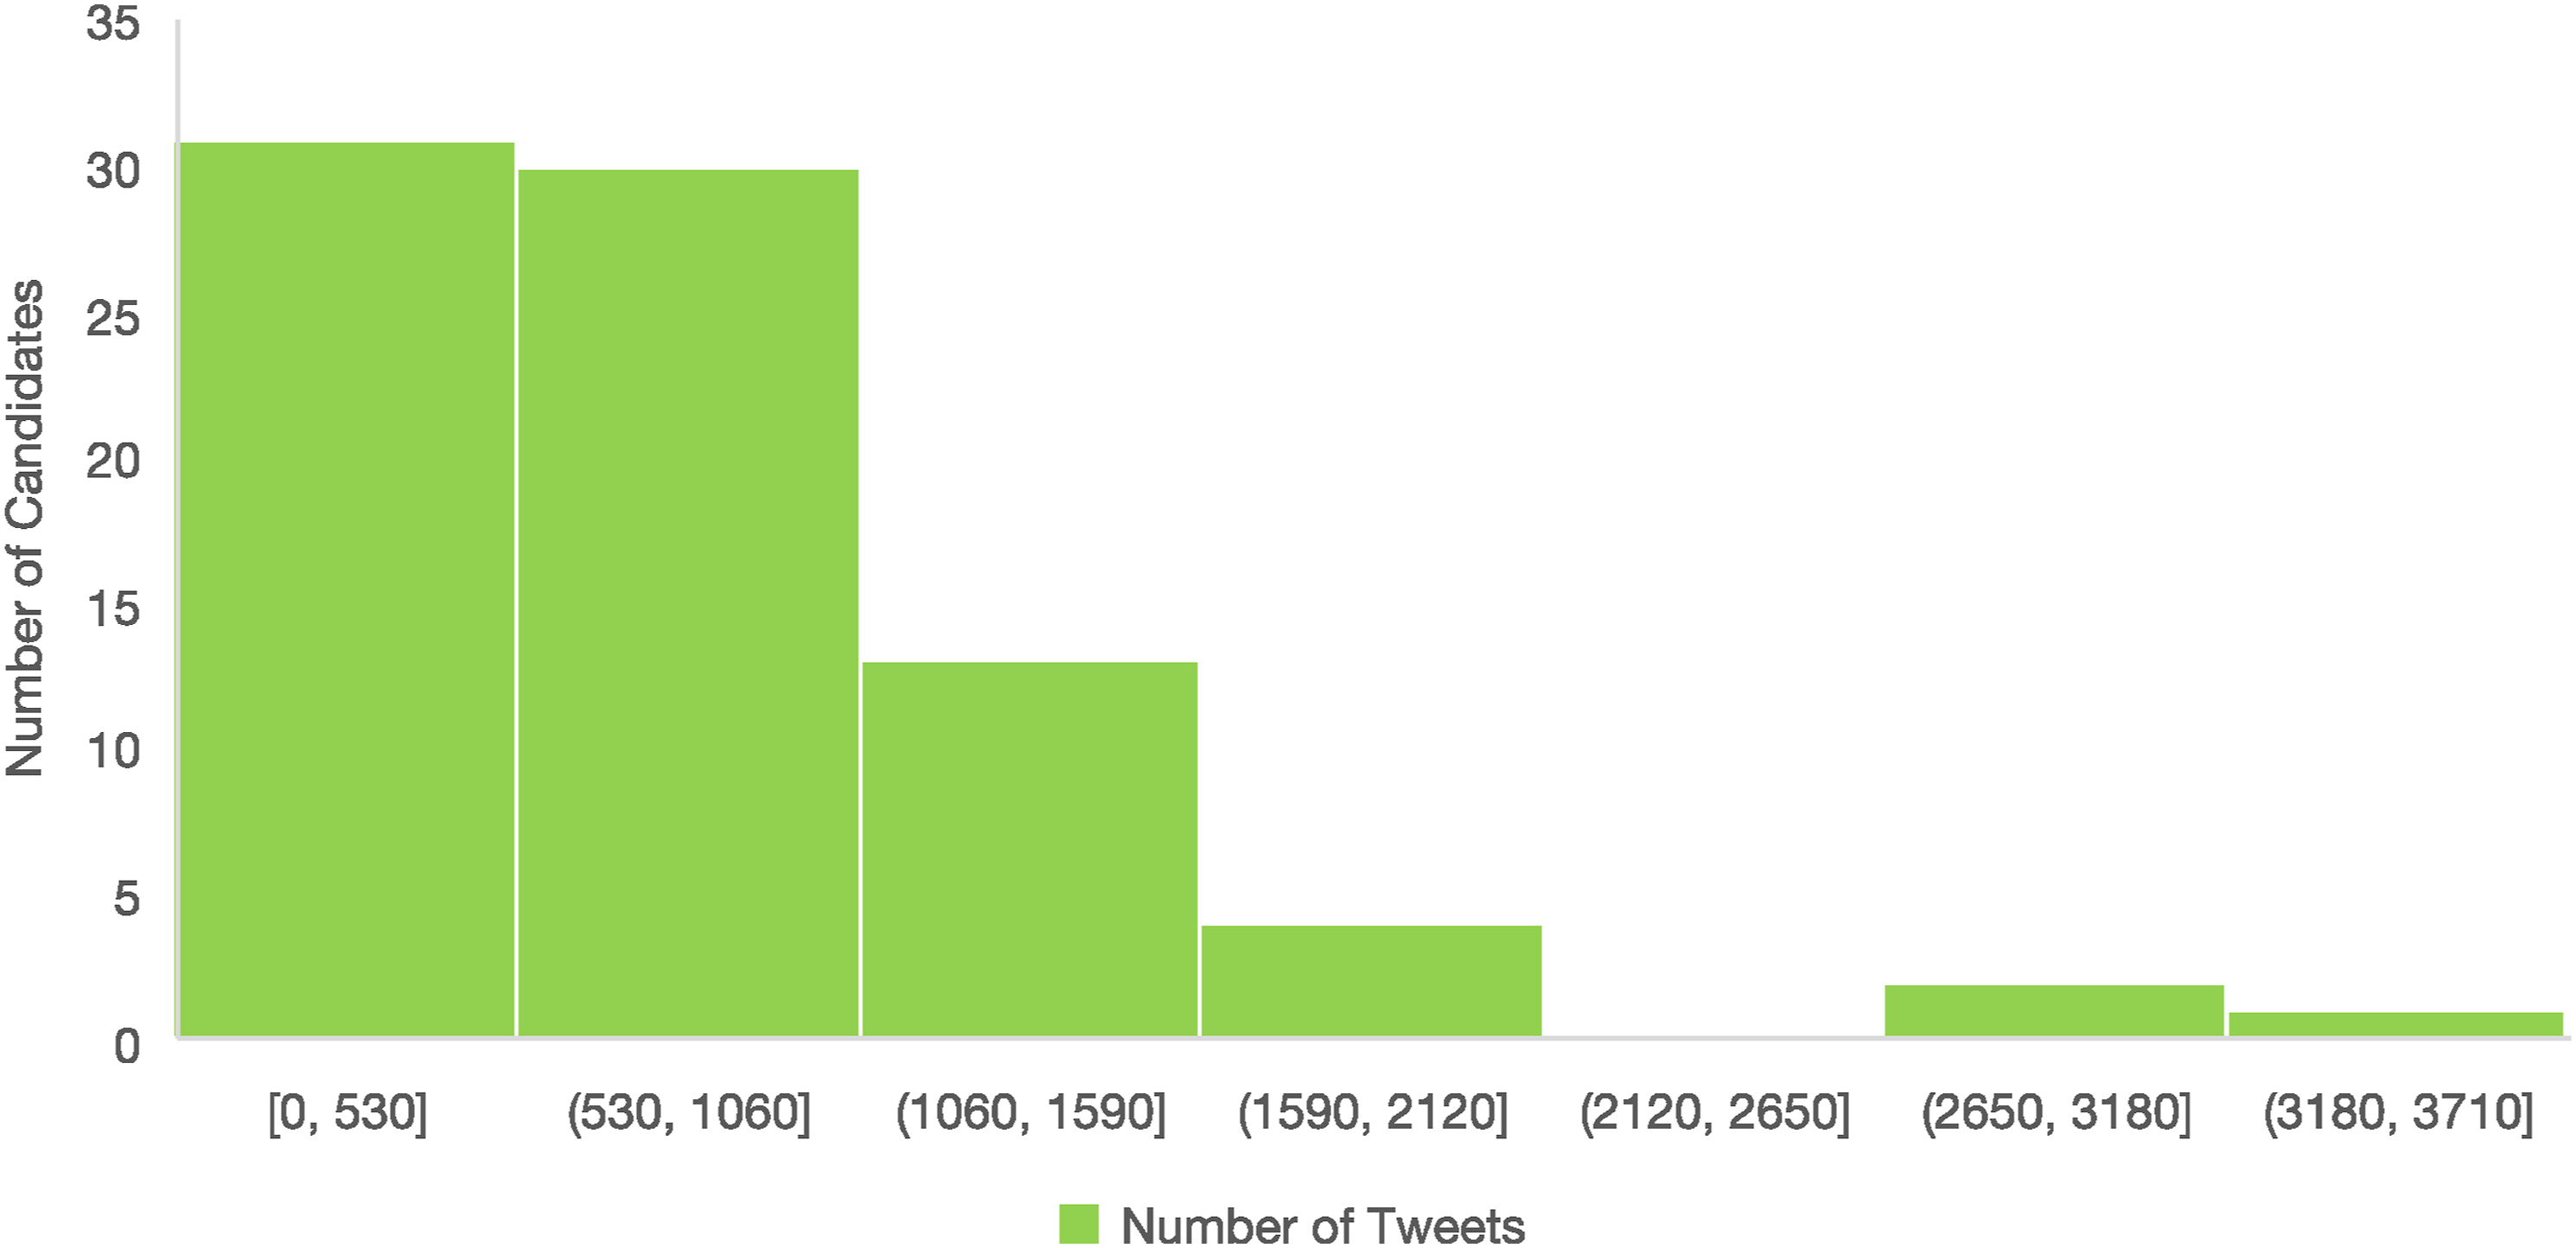
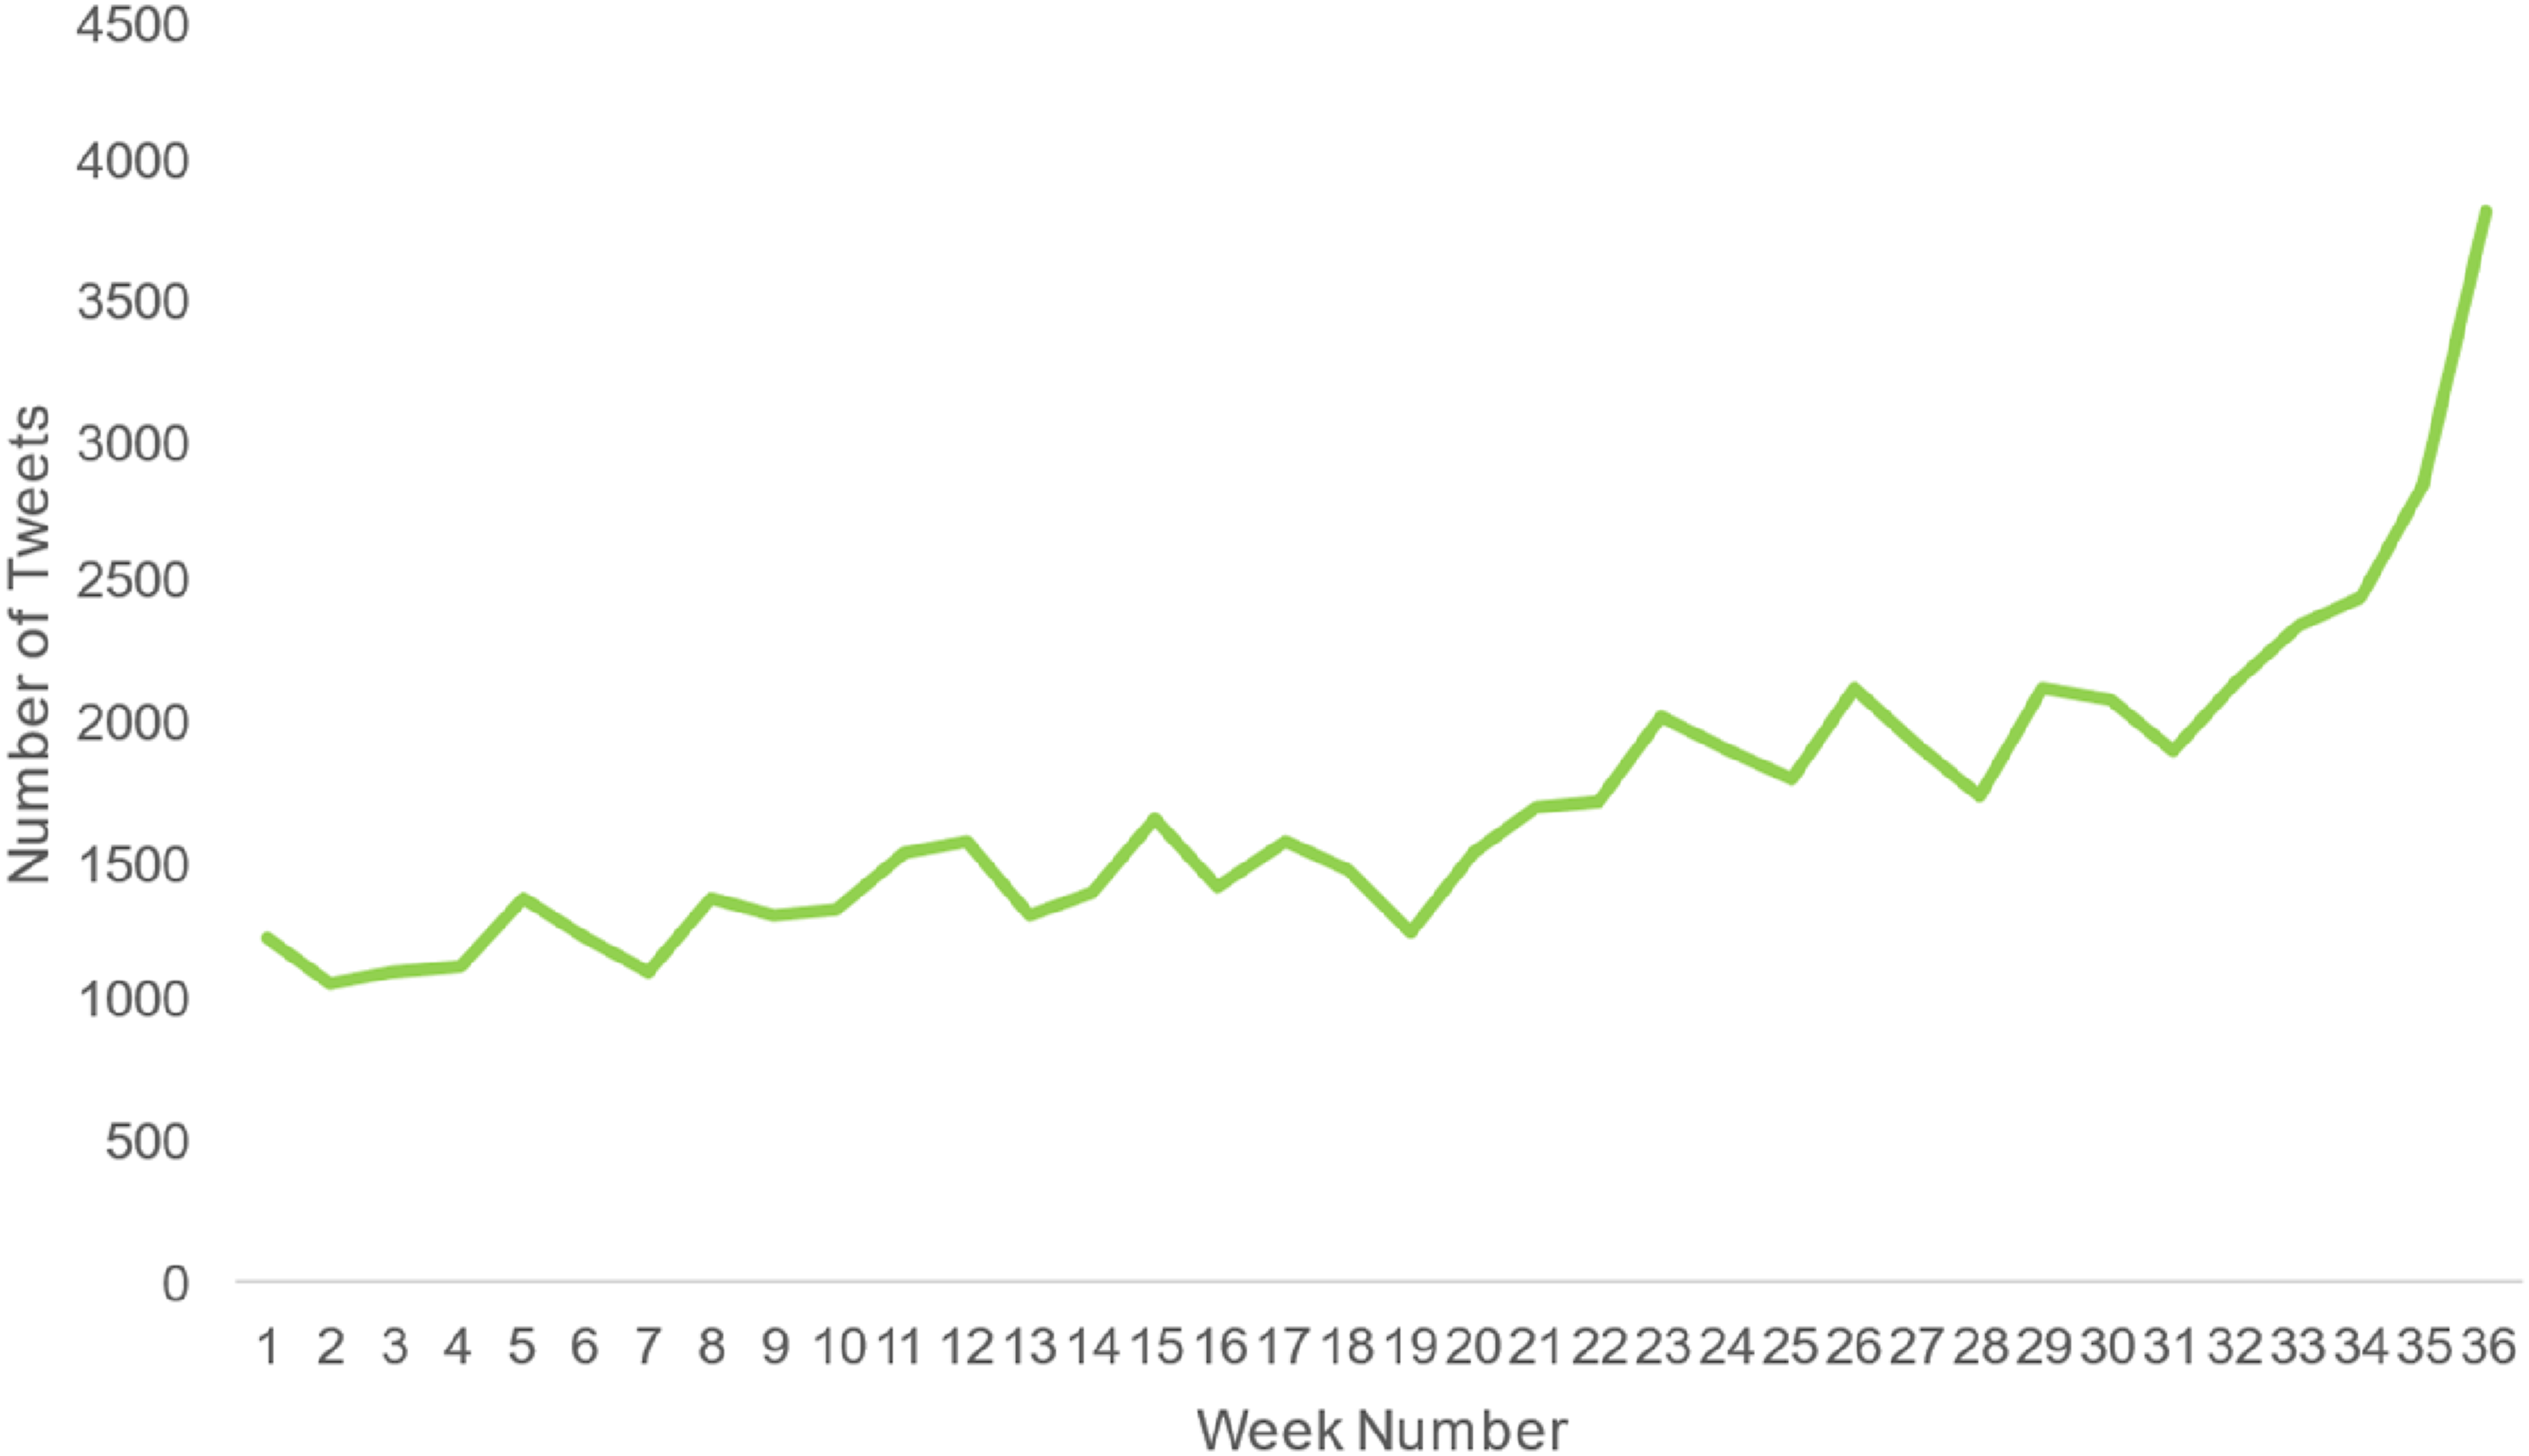
The data retrieved from Twitter shows that candidates already used Twitter as a communication channel and that the communication volume increases when the campaign nears the end. This reflects that candidates use Twitter strategically to complement other online and offline communication channels (Grover et al. 2019). This data might be a good source to generalize candidates’ behavior and policy concerns.
Election Results and United States Cities List
A data source of election results must be assembled to validate whether this Twitter data can predict election outcomes. To do this, Ballotpedia was consulted on February 21, 2023, and an Excel file with two different sheets was developed: “Results by State” and “Results by Candidate.” “Results by State” comprises 35 rows, one for each senate election, as seen in Appendix B. “Results by Candidate” has 98 rows, one for each candidate with at least 1 percent of the voting share. Only the candidates and results from the last round for rank-choice voting systems with several rounds were considered.
Besides the results, there is a need for an extensive list of cities and counties in the United States. A list with 63,210 city aliases was available on GitHub, 1 which is comprehensive enough for the task. This data source comprises 63,210 rows, one for each “city alias,” and five columns, with the State Name and Code, the County, City, and its alias.
Data Preparation – Original Tweets
Data preparation, modeling, and evaluation phases can be split into two parts: First, data preparation to model the topics and evaluate the resultant topics, and then the preparation of the consequent topics to model and test the hypotheses and research question and check those test results.
The data preparation step for the original Tweets dataset starts with Data Cleaning and then Data preprocessing.
Data Cleaning and Preprocessing
Each tweet was thoroughly cleaned, removing URLs, mentions, emojis, punctuation, numbers, line breaks, and other special characters. Tweets with less than two words were eliminated to reduce the noise in the dataset.
A specific tool from the polyglot.detect package (Al-Rfou 2015) was deployed to filter tweets by language, explicitly retaining those in English. However, the tool could not determine the language of a certain number of tweets (1,234 out of 58,447).
The next phase involved consolidating several data files, using common attributes to merge them into a comprehensive dataset. Ambiguity in city names within the tweets necessitated additional disambiguation, which was accomplished using Named Entity Recognition (NER), a feature of the Spacy package (Honnibal and Montani 2021). This ensured that city names were indeed references to geographic locations.
Further refinements were conducted through manual checks to ensure accurate language labels and city classifications. This process uncovered several mislabeling, leading to a review and correction process. This included removing irrelevant words and refining city mentions. Lastly, the dataset underwent tokenization, lemmatization, and stop word removal using the NLTK Python package (Bird, Klein, and Loper 2009).
Topic Modeling – Original Tweets
Topic modeling, a machine learning technique, uncovers hidden thematic structures in document collections. Latent Dirichlet Allocation (LDA) and Correlated Topic Model (CTM) are common algorithms used for this task.
LDA is the most widely used, assuming each document is a mixture of latent topics with a particular word distribution (Blei, Ng, and Jordan 2003). For instance, Karami et al. (2022) and Das et al. (2022) employed LDA in their studies to analyze Twitter data related to political discussions.
CTM is a variant of LDA that captures topic correlations. It presupposes that each document is a blend of latent issues and that each word within a document is generated based on a specific probability distribution (Blei and Lafferty 2007). Dybowski and Adämmer (2018) used this model to analyze data on U.S. Presidential speeches. According to Blei and Lafferty (2007), CTM has better predictability than LDA due to its probabilistic correlation between topics.
LDA
The LDA topic model, implemented via Python’s gensim package (Řehůřek and Sojka 2010), was executed with varying numbers of expected topics to determine the optimal model. The Coherence Score metric, applicable to both LDA and CTM models, and a subjective evaluation of the resulting topics were used to assess outcomes. With the prerequisites met, an algorithm was executed to evaluate five to 16 subjects and their respective Coherence Scores, as illustrated in Figure 5. Coherence score for LDA, using 5 to 16 topics.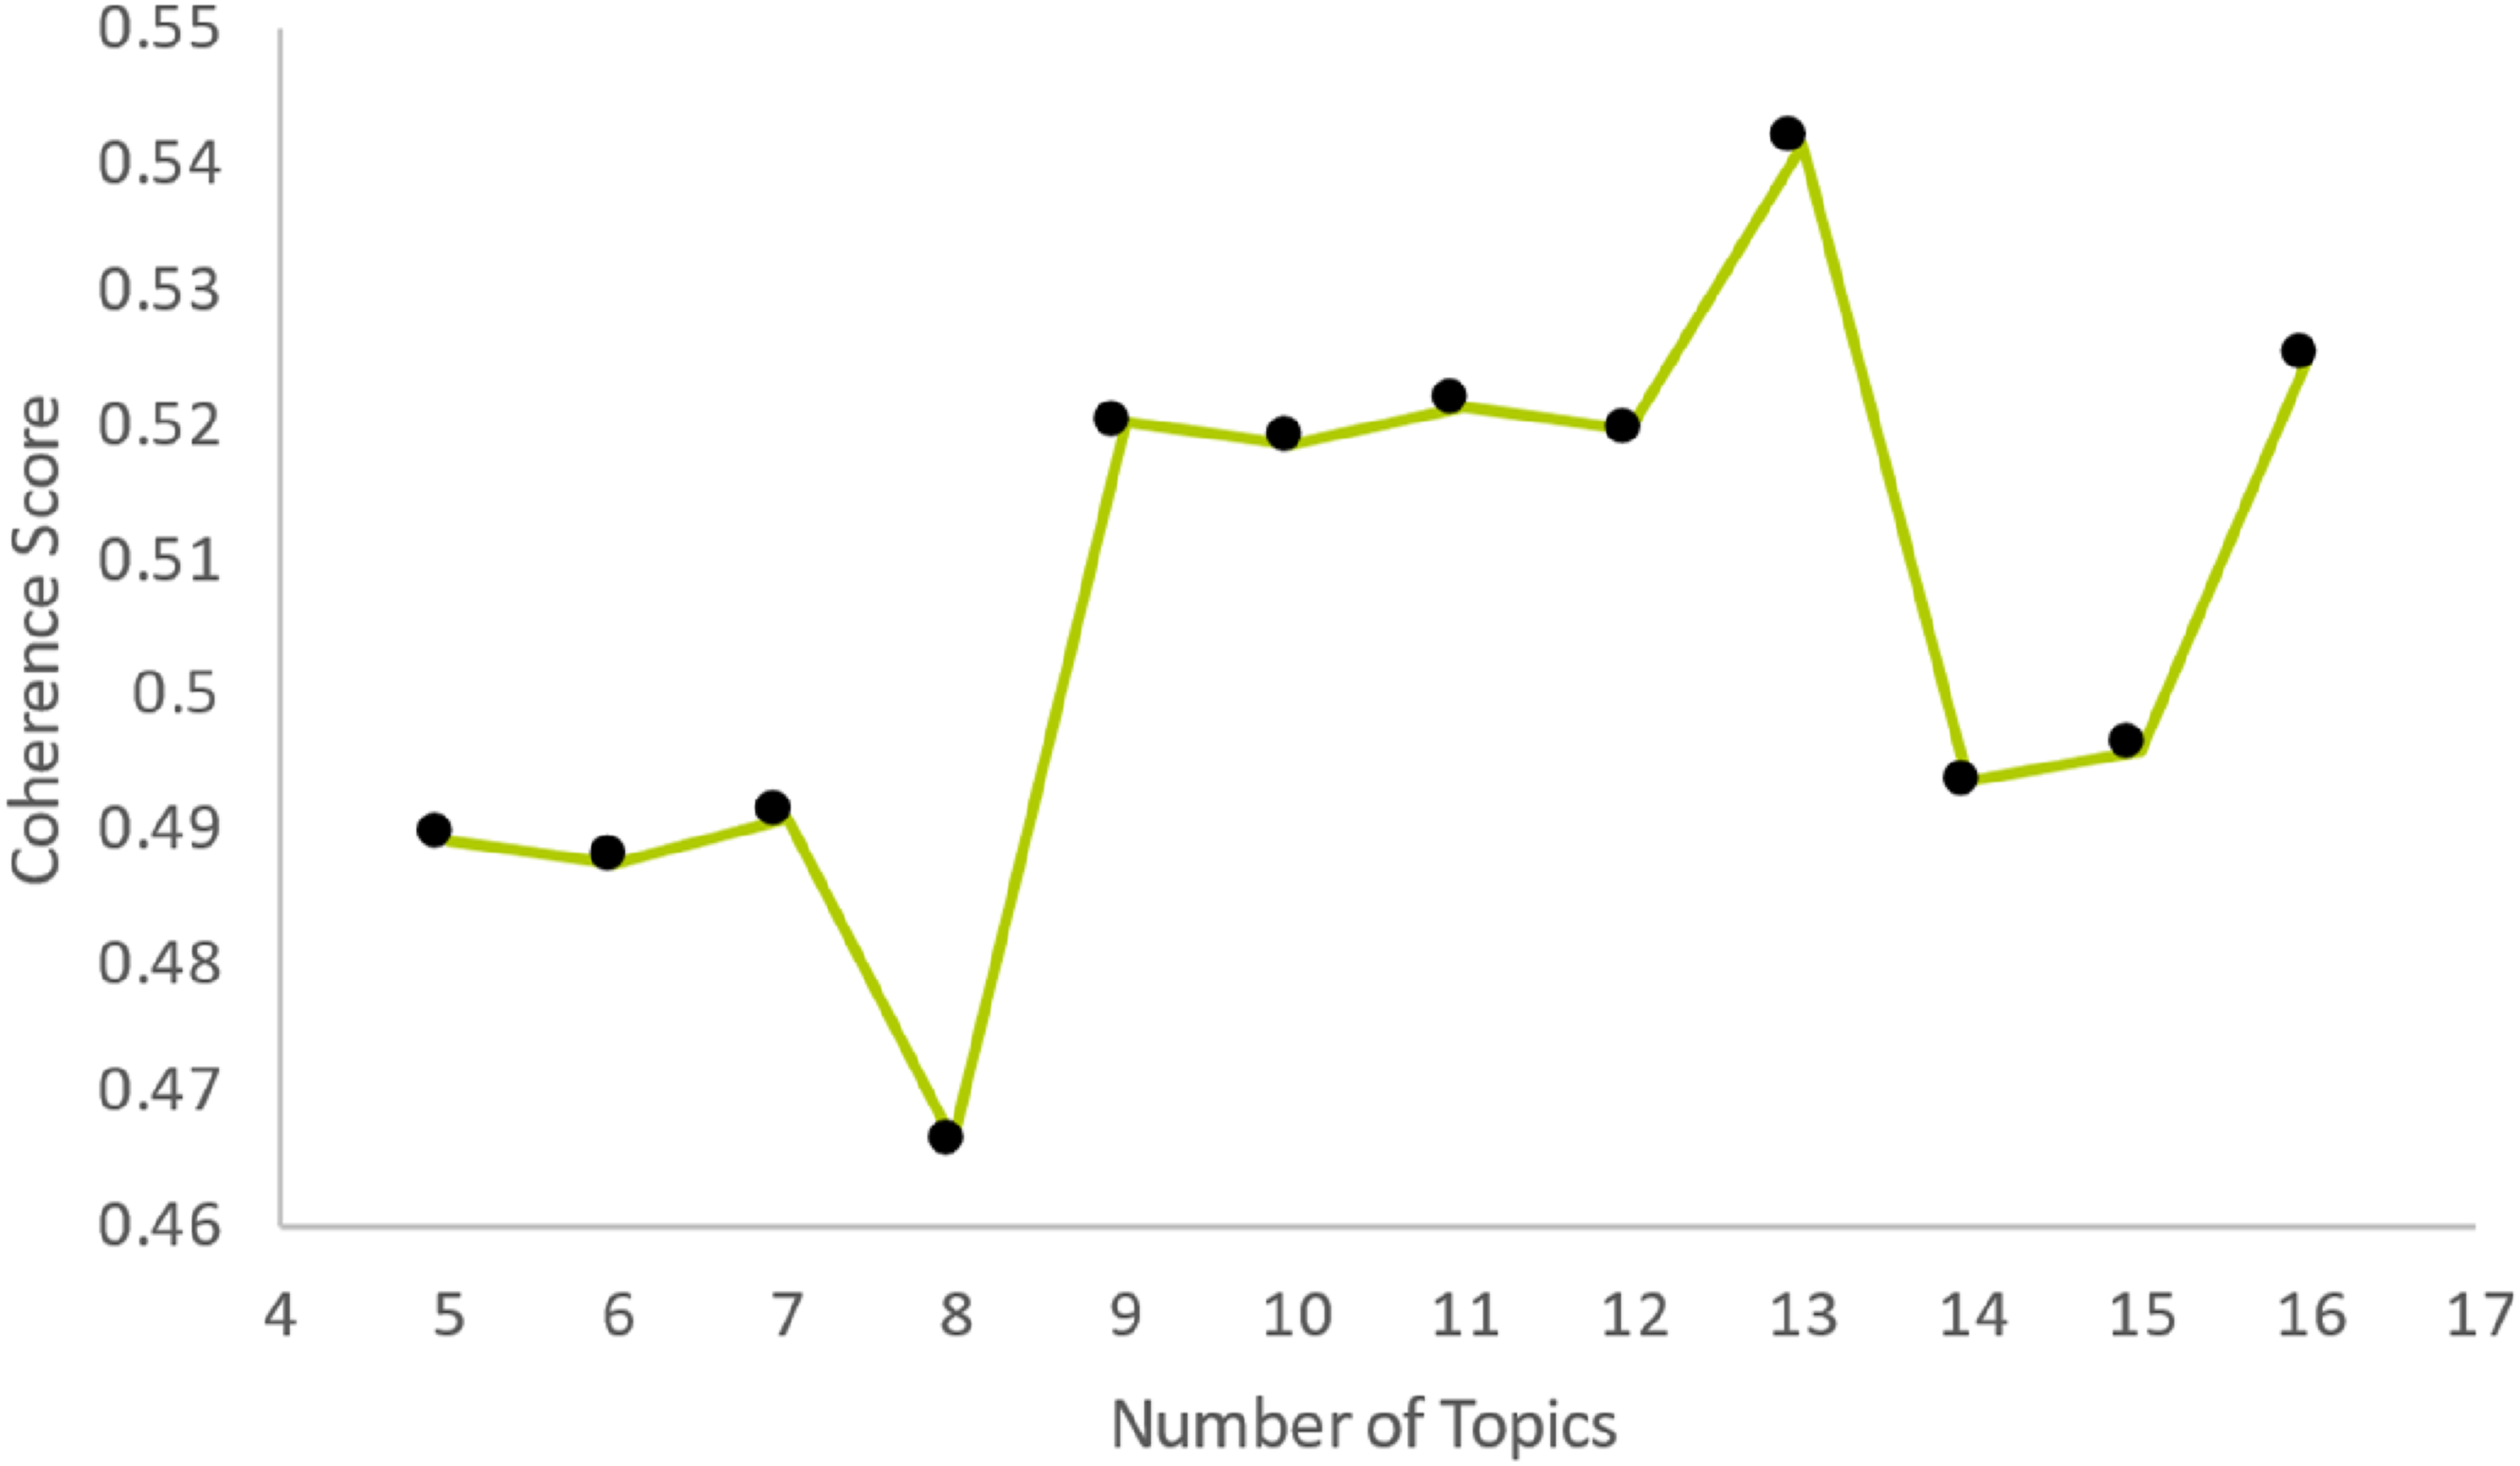
The outcomes presented five coherence scores around 0.52, with the peak result slightly exceeding 0.54. Since nine topics represented the initial significant increase, and 13 topics produced the highest coherence score, further refinement was undertaken through hyper-tuning the algorithm for these topics. This process involved adjusting the alpha and beta values, two hyperparameters of the LDA model, to enhance the coherence score. The optimization yielded the top Coherence Score of 0.5639 for 13 topics, representing an advancement from the initial coherence score of 0.5412.
CTM
The CTM algorithm was developed using the tomotopy package (Heewon 2020), a resource gensim does not provide. This initial model used 13 topics, drawing from the optimal result of the LDA model.
To enable comparison with the LDA model, the topics produced by the CTM model were reconfigured into a format compatible with the gensim.CoherenceModel (Řehůřek and Sojka 2010). This allowed for the calculation of the Coherence Score for each topic cluster. This baseline model yielded a Coherence Score of 0.5978, surpassing the highest LDA result.
Further testing was conducted to find the optimal number of topics, exploring a range from five to 16. The results are presented in Figure 6. Like the LDA test, the best number of topics emerged as 13, with a coherence score of 0.5978. Coherence score for CTM, using 5 to 16 topics.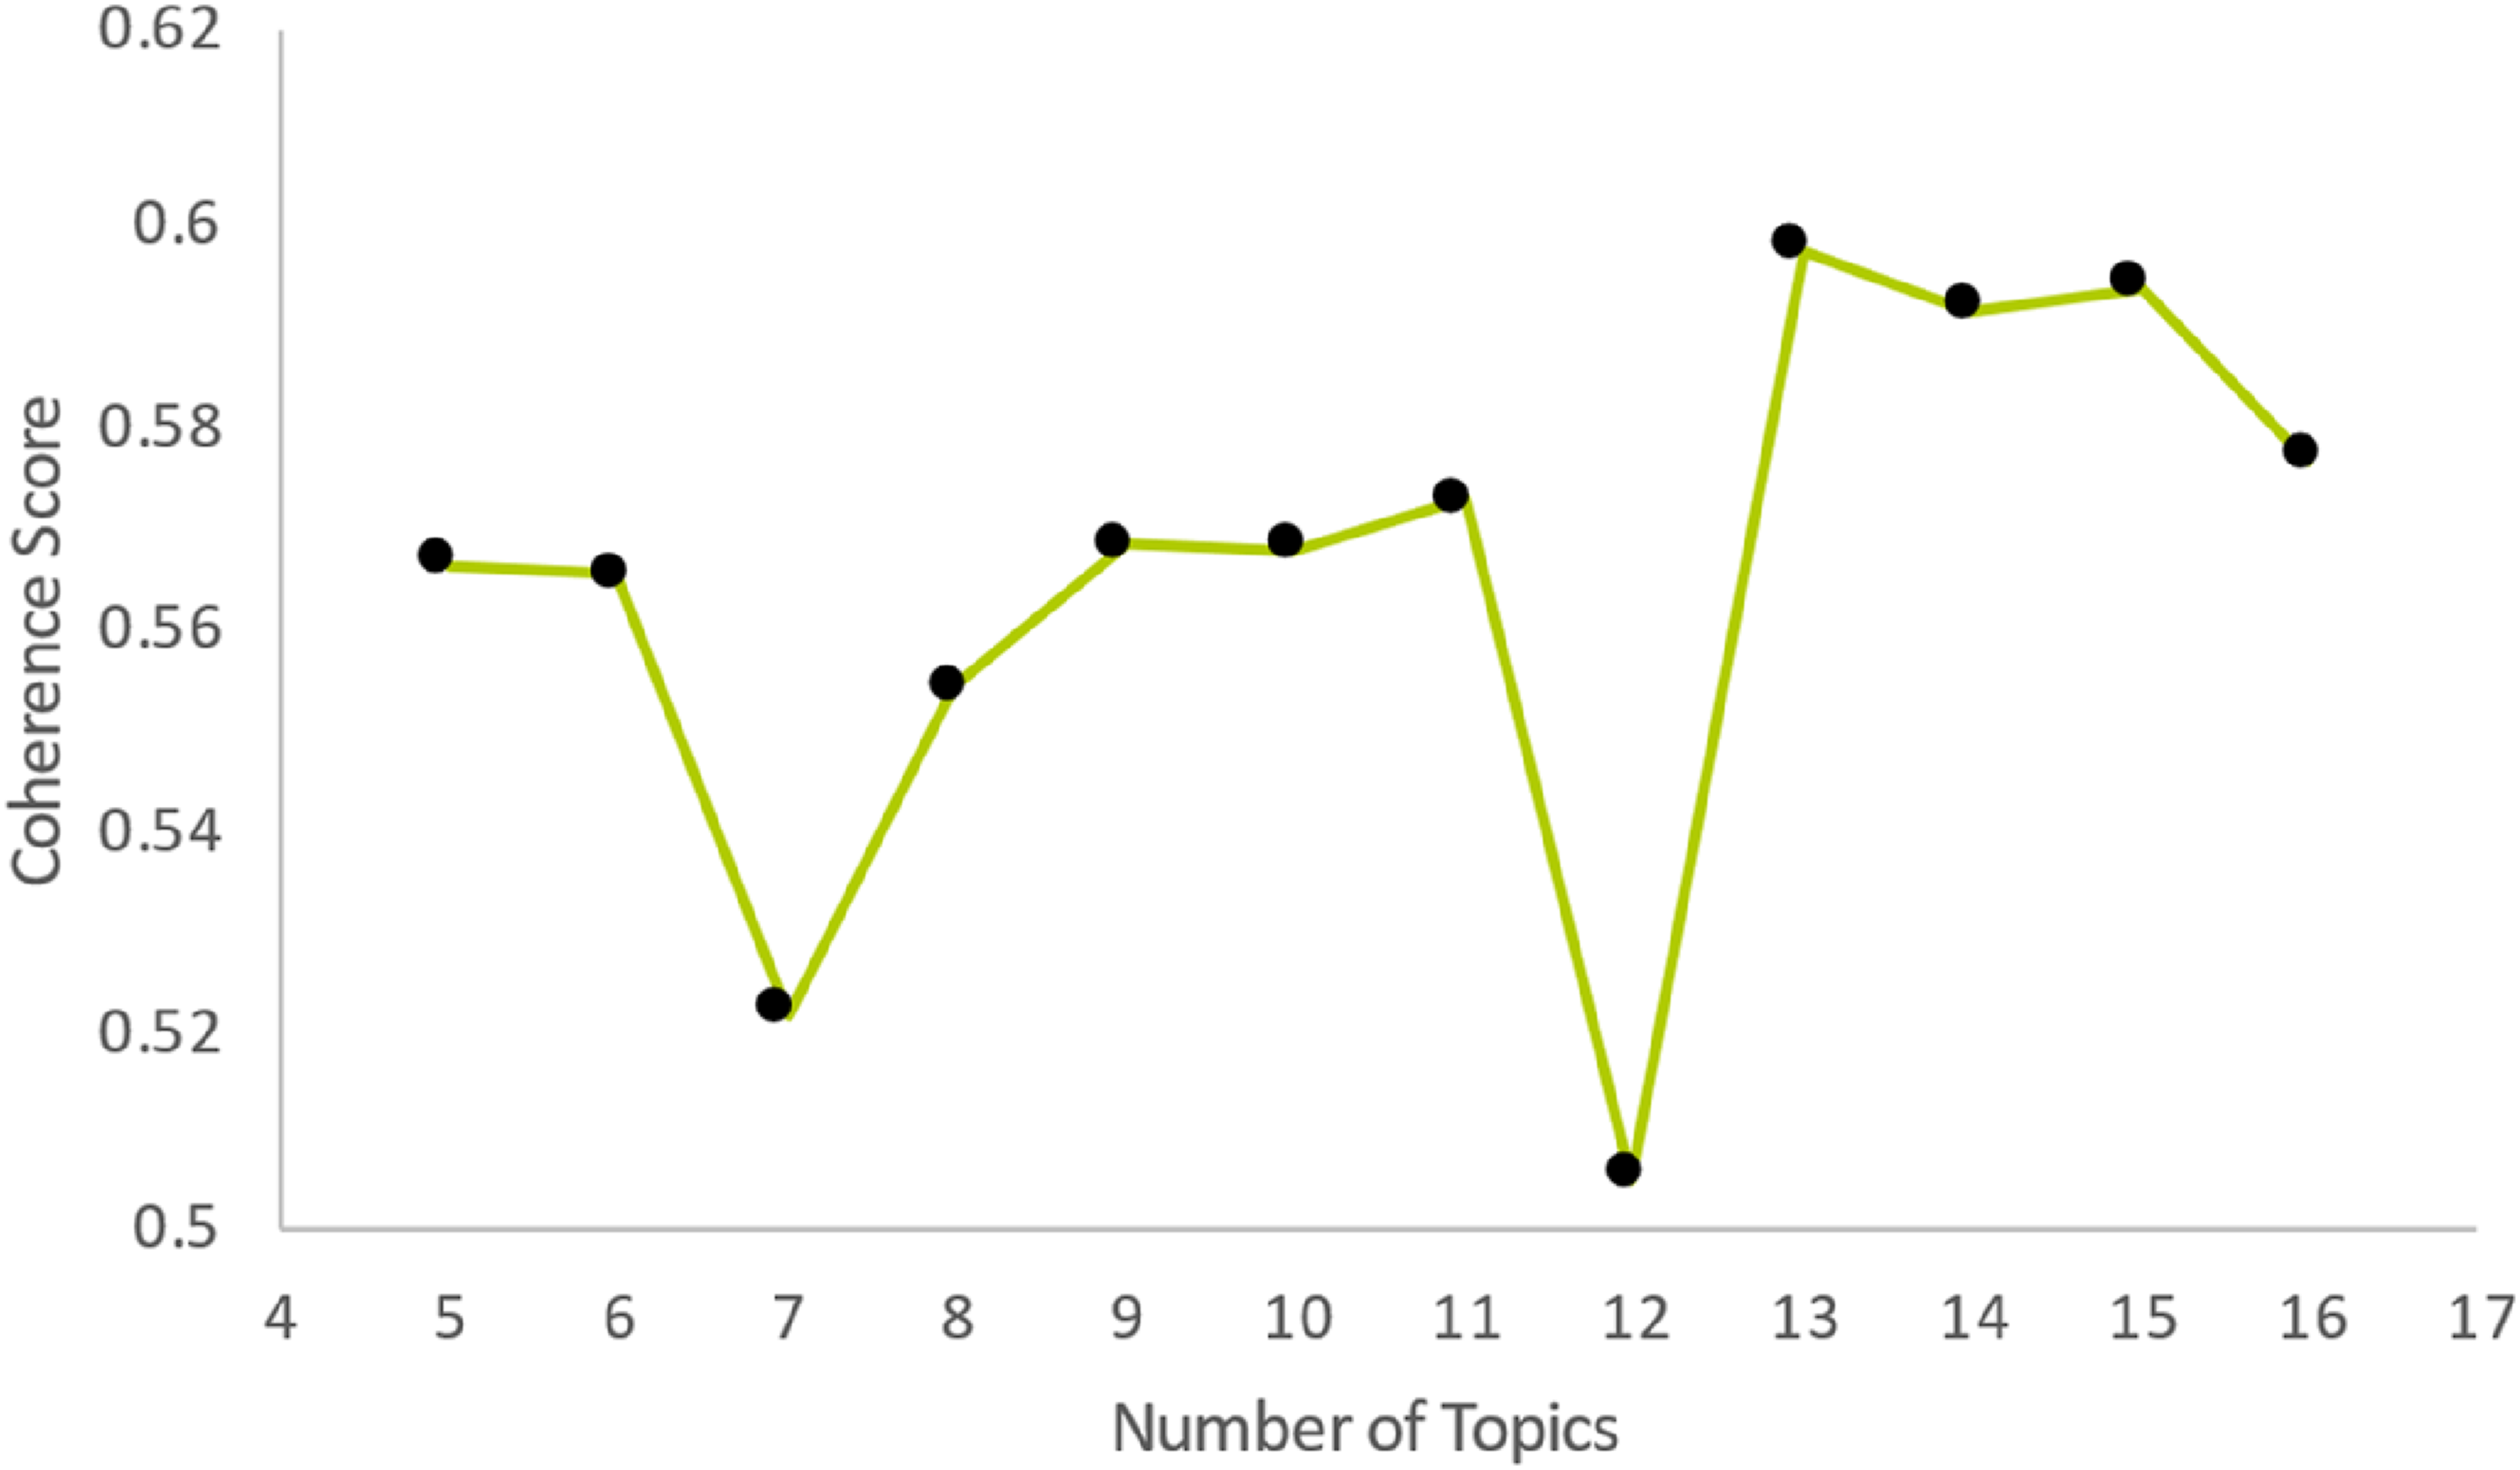
Topic Modeling Evaluation
As illustrated in Figures 5 and 6, the CTM had the best results overall, and the optimal number of topics was 13. The 10 top words from each topic and the tweets with more weight from each topic were revised. Upon evaluation, it was determined that 13 topics resulted in excessive granularity, causing overlapping topics and words.
Given the research’s focus on identifying similarities among candidates, this level of detail could lead to divergent, sparse topics. Consequently, the focus shifted to the topics derived from the nine-topic models. The CTM model did yield superior performance; however, the marginal coherence score difference of 0.0139 between the two models for nine topics, combined with the lower computational demand of the LDA model, suggested a minimal practical difference, with benefits in speed becoming a factor for choosing LDA.
The LDA model was run using the optimal hyperparameters identified for the nine-topic model. As expected, the resulting topics are like some of the 13 topics from the previous iteration but lost some granularity, with just two topics overlapping and space between most of them, as seen in Figure 7. Intertopic distance map for the nine topics, generated by pyLDAvis.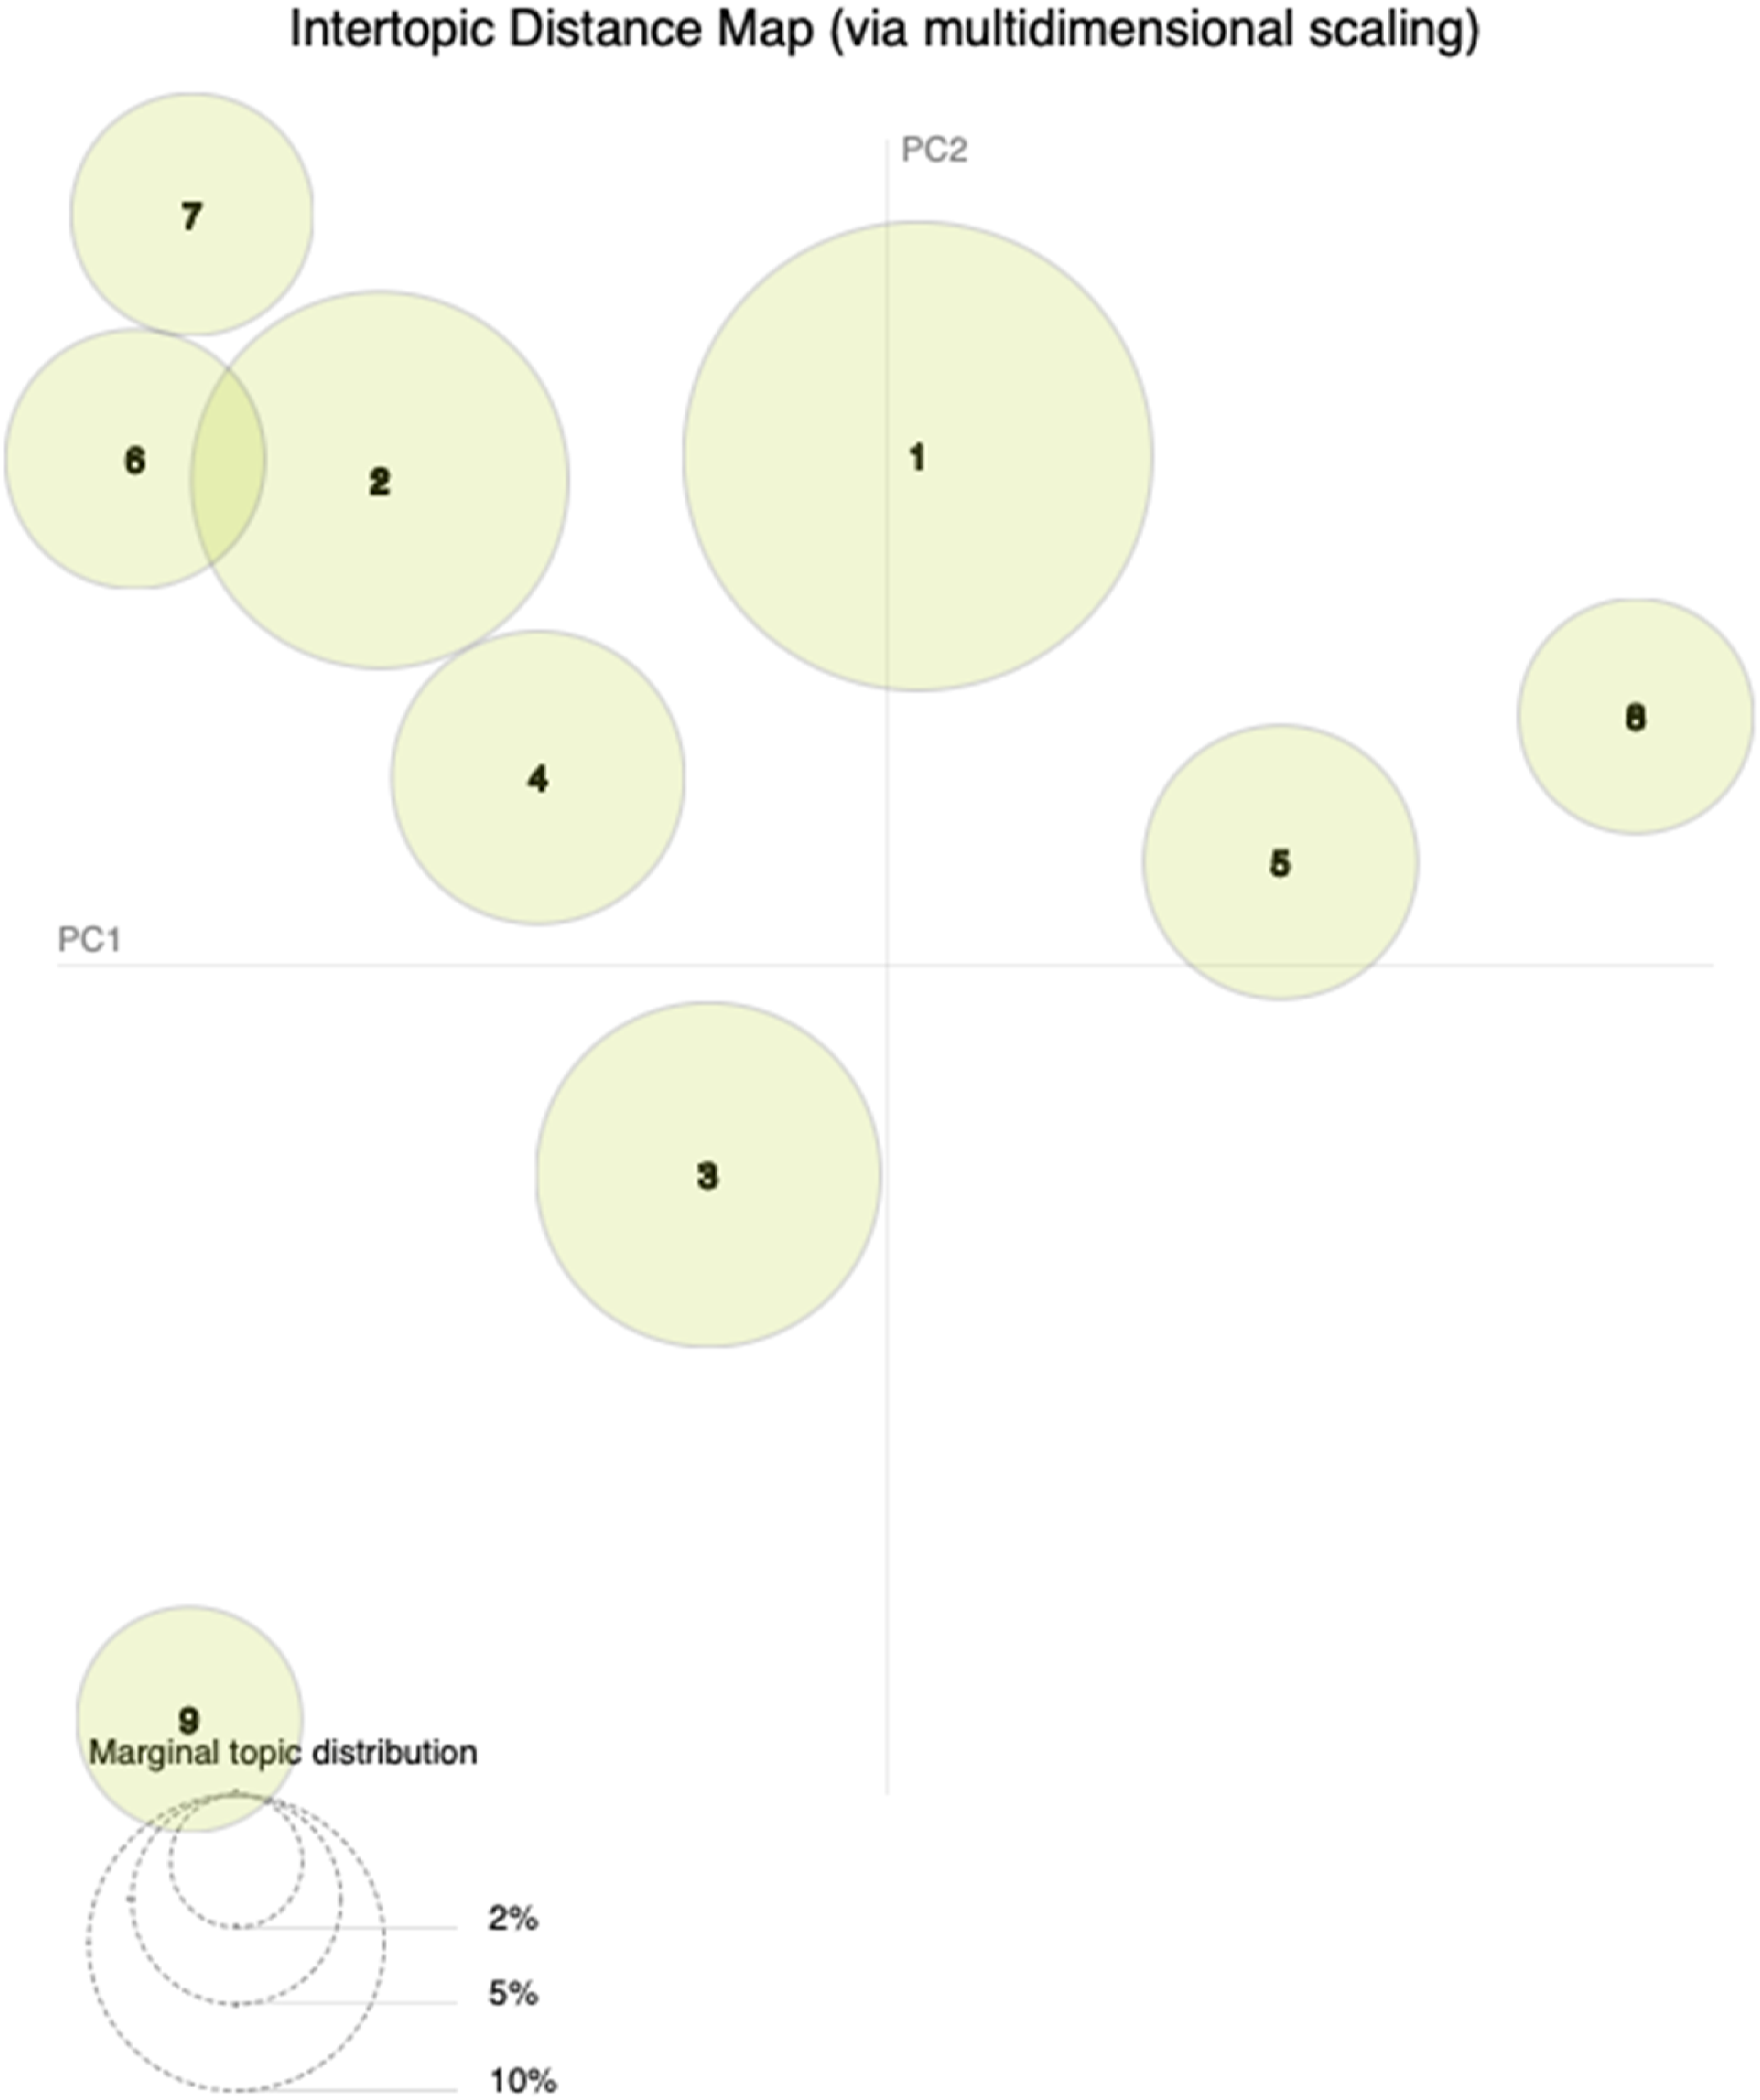
Data Preparation and Modeling – Identified Topics
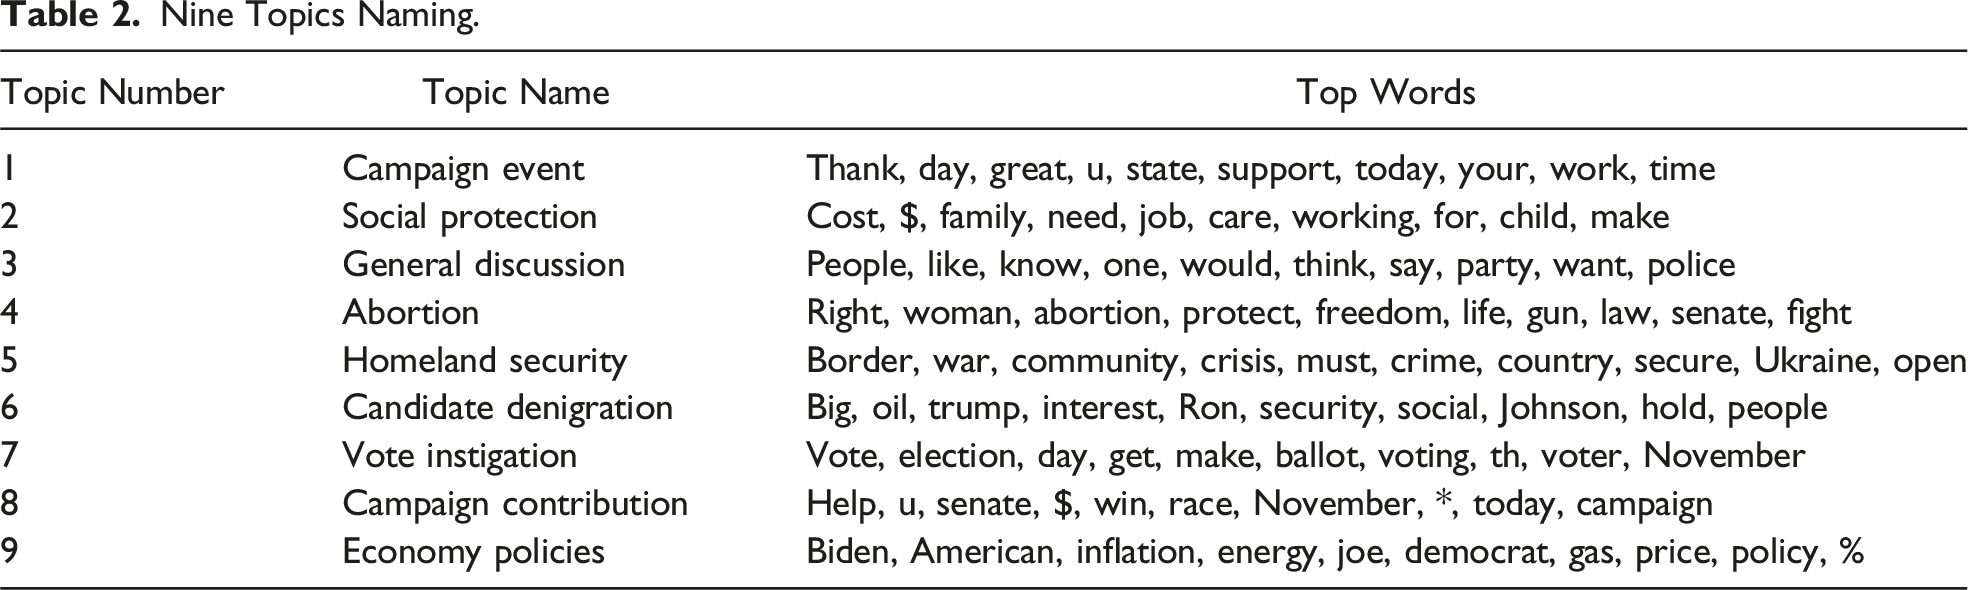
Nine Topics Naming.
Hypotheses H1a and H1b
The study examined hypotheses H1a and H1b using linear regression (LinR), aiming to understand if winners in tightly contested races emphasized more local issues while those winning by larger margins focused on national topics. Candidate-specific data was aggregated, with all local or national tweets summed and the average winning margin computed. The dataset included only race winners and the proportion of local and national tweets per candidate. It incorporated 34 races, except for candidate Brian Schatz, who had no tweets during the period.
In addition, another dataset was created to scrutinize whether the winning margin influences the focus on national and local issues for winners and losers. This set aggregated the data by state, reflecting each race’s normalized distribution of local and national tweets. The dataset contained 35 rows, encompassing all races under consideration.
Hypothesis H2
Hypothesis H2 posits that election winners tend to align their Twitter sentiments with those of their party peers. To validate this claim, the Kruskal–Wallis test was chosen over a one-way analysis of variance (ANOVA) as the data distribution was not normal. This non-parametric test is preferred when the underlying assumptions of the ANOVA, especially normality, are not met.
This hypothesis was tested in two parts. The first part considered the original nine topics and their local or national scope. The second part disregarded the scope and concentrated solely on the nine topics. The testing involved creating topic-weighted columns concerning each tweet’s local or national scope. The values were then aggregated by candidate names, calculating the average weight of each topic across their tweets, which would differentiate the winners from the rest.
Three specific Kruskal–Wallis tests were then implemented. The first test sought to identify statistical significance between the topic averages of winners and non-winners, considering the 18 scoped topics. This process was restricted to the Democrat and Republican parties, the only ones having election winners. The second test paralleled the first but focused only on the nine original topics, again considering just the Democrat and Republican parties due to their winners.
Lastly, a third test was conducted to determine whether the mean topic weights for Democratic and Republican winners were statistically significantly different. This analysis concentrated solely on the winners from both major parties, scrutinizing the mean topic weights for each group.
Research Question
Two distinct approaches were explored to answer the Research Question. The first approach involved predicting the percentage of votes each candidate received, a task treated as a regression problem. The second approach aimed to identify the election winner, viewed as a classification task.
The dataset was divided into two distinct categories. One category encapsulated the 18 composed topics, nine with a national scope and nine with a local scope. The other category consisted of the nine original topics without scope considerations. This differentiation was made to probe whether the local or national coverage affected the predictive models.
Each candidate’s average weight across their tweets was calculated for all topics in both categories. The party variable underwent a process known as “dummyfication” through one-hot encoding, which converted the categorical variable into a binary format, effectively creating a new binary variable for each category class. This transformation enables machine learning algorithms to process and understand categorical data efficiently. Finally, all numeric variables in the dataset were normalized.
Various models were utilized to address regression and classification problems, each with advantages and potential limitations (Kursuncu et al. 2019). For regression problems, the target variable was the percentage of votes each candidate received. Initially, the Spearman correlation test was conducted to identify strong correlations between the 18 variables. As no such correlations were identified, all variables were retained. Regression models implemented included linear regression (LinR), decision trees (DT), and neural networks (NN). These models were evaluated based on metrics such as Mean Absolute Error (MAE), Root Mean Squared Error (RMSE), Coefficient of Determination (R2), and Max Error. The dataset was split throughout this process, with a 75 percent allocation for training and 25 percent for testing. Wherever possible, hyperparameter tuning methods were applied to seek optimal model performance.
In the case of the classification problem, the target variable was the winner of the election. Only the nine original topics were used here due to dimensionality concerns when applying the 18 composed topics. A range of models, including Logistic Regression (LogR), Decision Trees, Support Vector Machines (SVM), K-Nearest Neighbor (K-NN), Neural Networks, and Naïve Bayes (NB), were trained, tested, and evaluated. To balance the number of observations for the binary target variable, the Synthetic Minority Over-sampling Technique (SMOTE) algorithm was applied to tackle the imbalance issue in the dataset. The performance of these models was assessed based on Accuracy, Precision, Recall, F1 Score, and Area Under the Curve (AUC).
Despite a lack of detailed algorithmic disclosure in most election prediction studies using Twitter data (Gayo-Avello 2013), Liu et al.’s (2021) study served as a helpful benchmark. They tested numerous regression and classification models against Twitter data, reflecting Georgia state counties’ support of Hillary Clinton in the 2016 Presidential election. Their work highlighted the variable performance of models and the impact of data processing and variable selection. Their classification models, excluding Linear SVC, achieved accuracy rates between 78.72 percent and 82.88 percent. Decision Trees stood out with a higher precision rate. Regarding regression models, K-NN displayed the best RMSE (0.1526), while other models presented comparable outcomes. However, these results can vary depending on the data processing and chosen variables, underscoring the models as benchmarks rather than universally superior solutions.
Results and Discussion
This research divided tests and models based on the hypotheses or research questions, presenting results accordingly.
Regression Results for Impact of Tight Races on Local or National Focus From Winners.
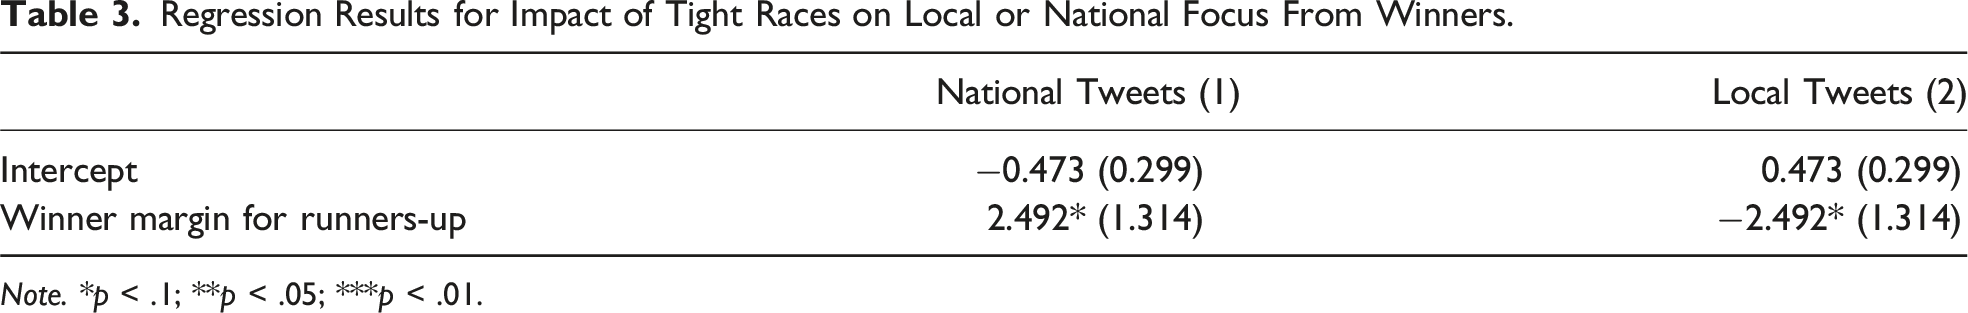
Note. *p < .1; **p < .05; ***p < .01.
This analysis hints that the shifts in race margin values only capture about 10.1 percent of the changes in tweet focus from local to national and vice versa. Essentially, the tweet’s scope seems influenced by other significant factors not considered in this model.
Regression Results for the Impact of Tight Races on Local or National Focus From Every Candidate.
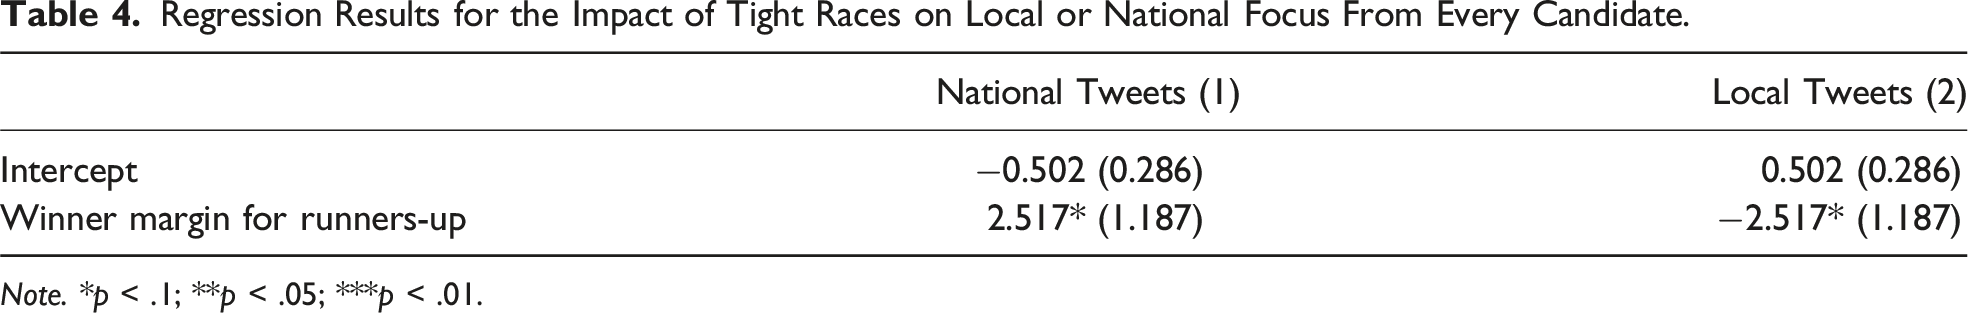
Note. *p < .1; **p < .05; ***p < .01.
The results suggest that as races tighten, candidates focus more on local issues in their Twitter communication. This aligns with Schürmann’s (2023) research and better explains the dynamics between electoral competitiveness and campaign messaging strategies.
Based on the nationalization trend noted by Das et al. (2022), the second hypothesis proposed was that election winners’ tweets would align with those of their party counterparts. Three Kruskal–Wallis tests examined this, which revealed various outcomes.
The first test investigated the variance in tweets across 18 topics. When local tweets were included, both parties showed significant results on Candidate Denigration and Economy Policies. Excluding local tweets, significance remained only on Economic Policies for both parties. The Democratic party showed significance in more topics, including Abortion, Economic Policies, General Discussion, Social Protection, and Homeland Security. The Republicans showed significance only in the Campaign Event and Vote Instigation topics.
The second Kruskal–Wallis test examined variances within the nine original topics. Differences were evident between both parties on various topics, but no significant disparities were observed in the Campaign Contribution topic for either party.
Kruskal–Wallis Results for Democrats and Republican Winners for the Nine Original Topics.
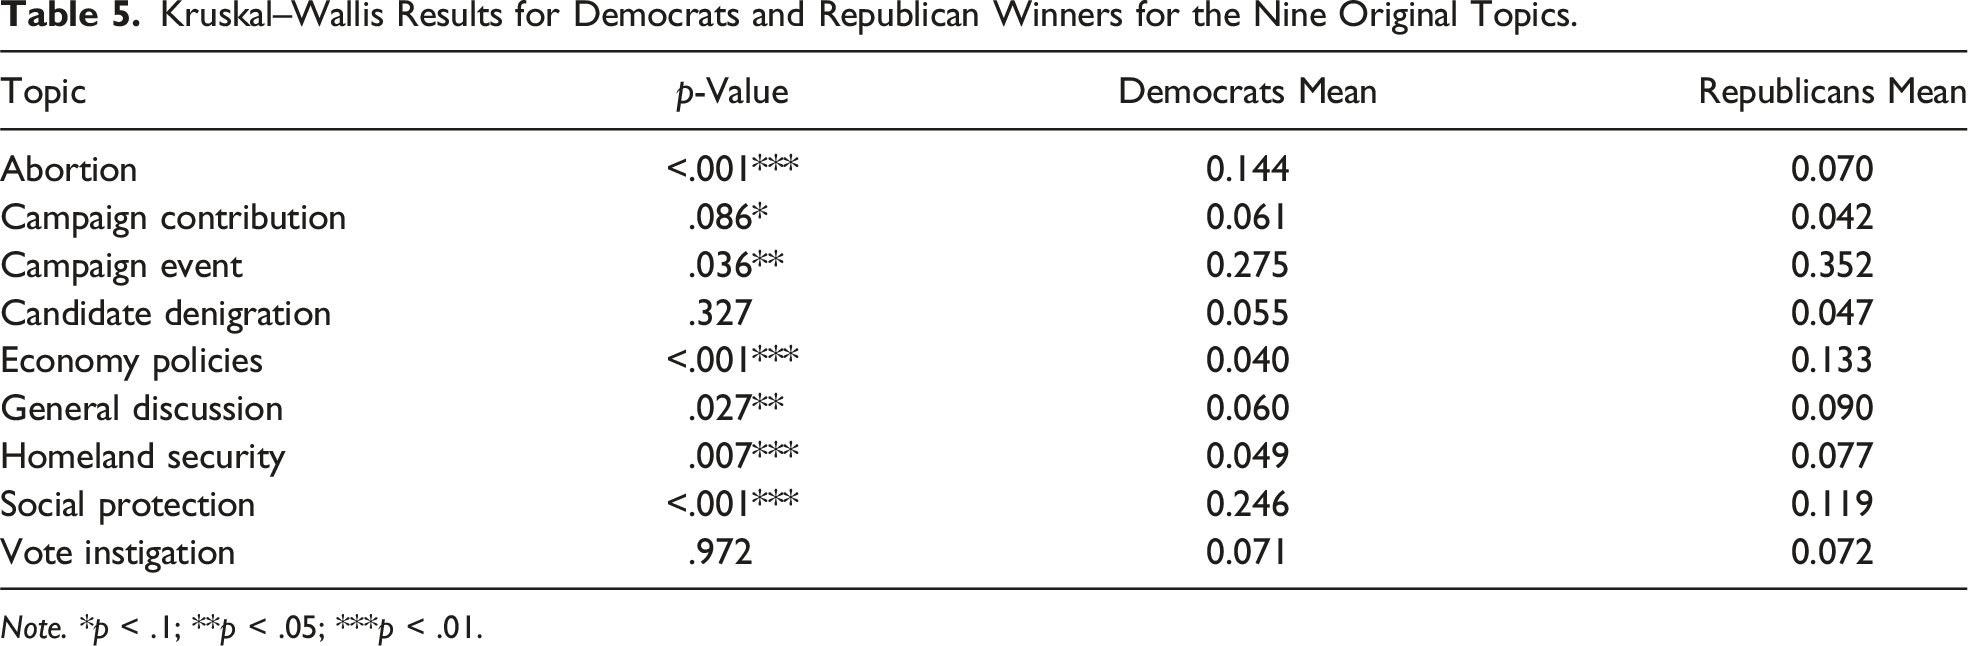
Note. *p < .1; **p < .05; ***p < .01.
Results for Regression With 18 Topics.
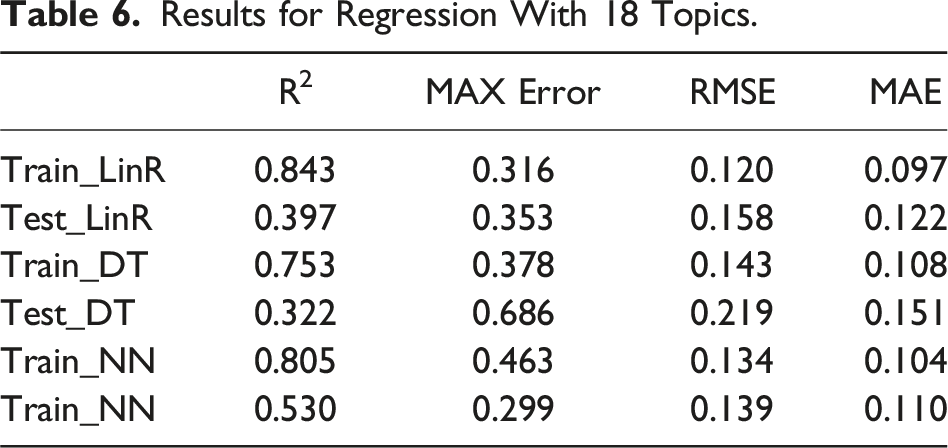
The R2 values in Table 6 suggest the predictive potential of all models on training data, with Linear Regression achieving the highest value. However, lower R2 values on test data indicate overfitting. Error metrics reveal a pattern of higher training errors that significantly reduce test data for both Linear Regression and Decision Tree models. Although showing high training errors, Neural Network displays better prediction accuracy on unseen data, demonstrating the most consistent performance despite signs of overfitting.
Results for Regression With Nine Topics.
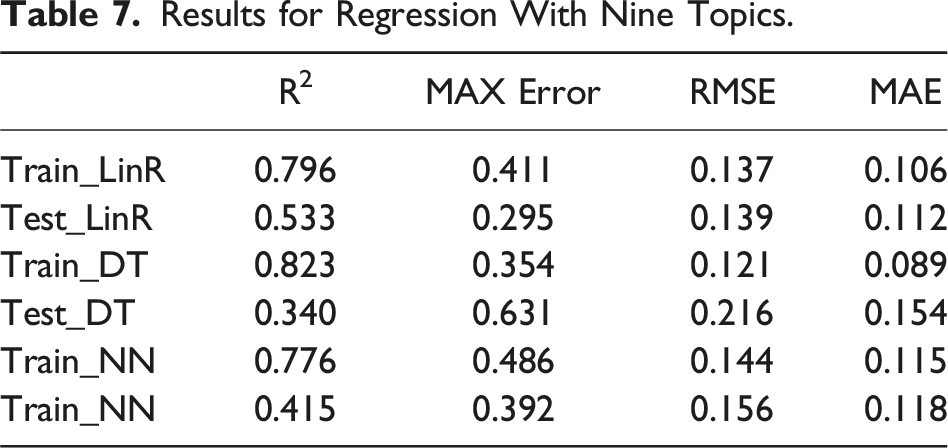
Compared with Liu et al. (2021), these models performed similarly but showed more overfitting. The best model (LinR with nine topics) displayed slightly better RMSE in training, yet it fell short in the testing set, revealing an inability to generalize to new data.
Results for Classification With Nine Topics.
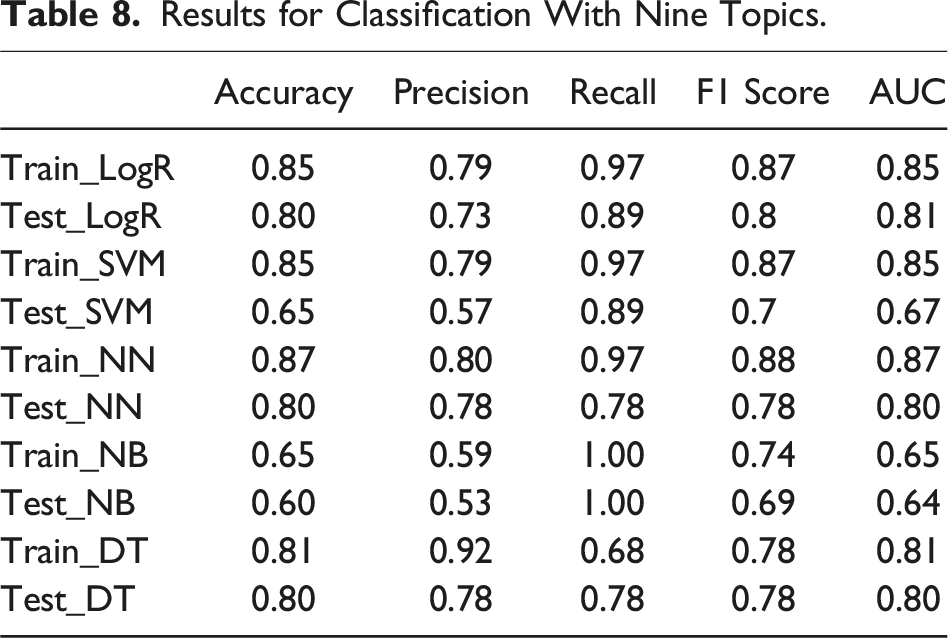
The models perform robustly when pitted against Liu et al.’s research benchmarks. Liu et al.’s study yielded an accuracy of 58.53 for the Linear SVC, and their other classification models registered accuracy values ranging between 78.72 and 82.88. The accuracy rates for LR, NN, and DT models on the testing set fall comfortably within this range.
The study’s findings indicate that the predictive power of local versus national tweets is modest, reflecting the complexity of voter behavior and the multifaceted nature of electoral decisions. Voter behavior is influenced by various factors beyond social media content, including personal beliefs, economic conditions, historical voting patterns, and offline campaign activities. While tweets provide a snapshot of candidates’ communication strategies, they only capture part of the spectrum of voter considerations, which may explain the limited predictive power observed.
Campaigns are keenly aware of their initial standing—whether they are underdogs, favorites, or in tight races—and they tailor their messaging accordingly. This pre-existing knowledge influences the content and tone of their Twitter feeds, creating a bidirectional relationship between social media strategy and electoral outcomes. For instance, campaigns that start as underdogs might adopt more aggressive or innovative social media strategies to gain traction and visibility. At the same time, favorites might focus on maintaining their lead and reinforcing their core messages. This correlation between prior electoral performance and current strategies underscores the complexity of causality in political communication.
Another factor contributing to the modest predictive power is the presence of echo chambers and filter bubbles on social media platforms like Twitter. These platforms often expose users to content that reinforces their pre-existing views, potentially diluting the impact of national or local issues discussed in tweets. As individuals within these echo chambers are likely to have entrenched opinions, the predictive power of tweets may be constrained by the homogeneous nature of the audience engaging with them.
Furthermore, the interaction effects between local and national issues are likely more complex than a simple dichotomy. Candidates often discuss national issues within a local context or vice versa, and understanding these interaction effects and their resonance with different voter segments could provide deeper insights into the predictive power of tweets.
Conclusions and Future Work
This research explored the predictive potential of U.S. Senate race outcomes based on the scope and content of candidates’ tweets, guided by three core hypotheses: H1a and H1b postulated a correlation between the local versus national nature of political speech and the competitiveness of the election, and H2 proposed that candidates focusing on their party’s primary issues had increased chances of winning.
Partial support was found for H1a and H1b, as the scope of political speech explained approximately 11 percent of the variance in election outcomes. However, H2, suggesting a candidate’s alignment with the party’s primary issues as a key predictor, did not find significant backing.
Further exploration of the predictive power of regression and classification models applied to the content extracted from candidates’ local and national tweets yielded intriguing results. While the models showed considerable predictive capabilities on training data, their performance faced challenges on unseen test data due to overfitting. A similar pattern was seen when models were built on the original nine topics, though with a less pronounced performance drop, especially in the Linear Regression model.
The comparison with previous research, such as Liu et al. (2021), revealed comparable performance with regression models but a higher propensity for overfitting. Despite their substantial predictive potential on training data, these models’ effectiveness on new, unseen data could have been more robust.
In contrast, classification models demonstrated stronger resilience, displaying a superior ability to generalize from training to test data, thus amplifying their potential to discern election winners based on party and topic weights. Notably, the Neural Network model exhibited consistent, strong performance across training and testing datasets, affirming its capability to identify a candidate’s winning potential, even if it did not predict precise vote percentages.
Surprisingly, no additional predictive power was discerned from segmenting tweets into local and national scopes. These findings contribute new perspectives to academic discourse by incorporating topical analysis in local and national contexts, enriching previous research primarily on sentiment analysis and relational aspects.
Research Contributions and Managerial Implications
This study contributes to the existing body of literature by addressing several unexplored aspects. While previous research has delved into the role of sentiments and relationships in election predictions, this work broadens this by incorporating topic analysis within local and national contexts. Significantly, the findings unveiled that the scope of topics did not substantially sway the predictive capacity of the models, be it national or local, contrary to the initial expectations. Moreover, it serves as a valuable benchmark for future investigations into the predictive power of social media content in political elections, especially given the scarcity of existing benchmarks. By demonstrating the ability of topical analysis in classification models and debunking the assumed importance of discourse scope in predicting election outcomes, this study paves the way for further innovative research at the intersection of social media and electoral politics.
The findings from this study carry important practical implications, providing critical insights for candidates and campaign managers. They indicate that a strategy solely focused on party-based issues or centered predominantly around national topics does not necessarily secure electoral victory. These results illuminate the complex role social media platforms play within political dialogues, illustrating the intricacies of the digital political landscape. For future research, the interpretability of complex models, such as the Neural Network, could be a focal point. Understanding how these models function and make predictions may help practitioners formulate more effective communication strategies, further optimizing the role of social media in political campaigns.
Limitations and Future Research
Despite its contributions, this research was met with some limitations. A key aspect is the volume of tweet data: most users generated fewer than 1,060 tweets during the 36-week campaign period. Given the continuous nature of discourse in today’s digital world, more granularities may be needed to create robust topics for analysis. Thus, future studies might benefit from access to larger or more diverse data sets.
One other limitation of our study is the exclusion of incumbency as an independent variable. Incumbency can significantly influence campaign strategies and electoral outcomes, as incumbents often possess greater visibility, resources, and a stronger focus on national issues. Future research should incorporate incumbency to provide a more nuanced understanding of how it impacts social media strategies and election results. By considering incumbency, subsequent studies can better capture the dynamics between established candidates and challengers, enriching the analysis of partisan issue ownership and campaign communication strategies.
The timing of tweets and the temporal dynamics of topics discussed can significantly impact their influence on voter behavior. For instance, tweets about local issues might gain traction closer to election day, while national issues could dominate earlier in the campaign. Future studies could benefit from incorporating temporal analysis to understand how the timing of tweets influences their predictive power and voter engagement.
Enhancing the predictive accuracy of models analyzing social media data by integrating additional data sources, such as campaign finance records, media coverage, public opinion polls, and offline campaign activities, could provide a more comprehensive understanding of electoral dynamics. Combining these data sources with social media data could lead to more accurate predictions.
Employing more other machine learning techniques, such as deep learning models, and transformers, could also improve predictive accuracy. These models could capture complex patterns and interactions within the data, potentially leading to better performance. Incorporating sentiment analysis and emotion detection in tweets could provide additional layers of information about the electorate’s response to candidates’ messages, refining predictions further.
Geospatial analysis, which analyzes the geographic distribution of tweet engagement and sentiment, could reveal regional variations in voter behavior, helping tailor predictive models to account for local dynamics more accurately. Conducting longitudinal studies that track social media activity and electoral outcomes over multiple election cycles could provide deeper insights into the evolving role of social media in politics, helping identify trends and changes in voter behavior over time.
While our analysis primarily identifies correlations between social media content and electoral outcomes, it is essential to acknowledge the potential for reciprocal causality. The high correlation between dependent and independent variables suggests that past election outcomes could significantly influence current social media strategies. This dynamic complicates the analysis but cannot be overlooked. To better understand this, future research should examine how previous election results, especially those of candidates from the same party, predict social media content. This approach can provide insights into how campaigns assess their environment, develop strategies, and ultimately succeed or fail. Incorporating this perspective will enrich our understanding of the interplay between social media strategies and electoral performance.
The current research only considered Senate races, typically involving fewer candidates and less tweet volume than House of Representatives races. This limitation inherently introduces complexities due to the distinct structure of Senate races, where clear winners and losers emerge. A broader approach incorporating different race types could offer a richer perspective on the predictive power of social media discourse. Data limitations due to the lack of some Twitter handles for candidates from parties other than Republicans and Democrats may have impacted topic generation and, thus, the depth of analysis.
In terms of the modeling process, employing different topic modeling algorithms, such as the Structural Topic Model (STM), could provide a more nuanced understanding of discourse. Exploring a wider variety of regression algorithms might enhance prediction models, and a mix of variables like socio-economic or demographic attributes could contribute to a more holistic view of political dynamics.
Moreover, the scope of topics deserves further investigation. This study primarily examined the difference between local and national scope. Future work might delve into whether specific issues within these scopes have a more significant impact on election outcomes. Furthermore, integrating network analysis with topic modeling could provide unique insights. Studying how the electorate interacts with each topic and how these interactions shape their voting behavior may predict electoral success.
On a similar note, although this study contributes to establishing a benchmark for future research, the scarcity of comparative benchmarks still needs to be improved. Consequently, future studies should continue to expand this field, perhaps focusing on incorporating data from platforms beyond Twitter, especially those featuring visual content like images or videos.
Finally, improving the interpretability of complex models is a critical step for future work. It would facilitate a better understanding of model predictions and provide more actionable insights for practitioners, aiding them in developing effective communication strategies.
Supplemental Material
Supplemental Material - Using Candidates’ Tweets to Predict an Election Outcome
Supplemental Material for Using Candidates’ Tweets to Predict an Election Outcome by Francisco Afonso, Paulo Rita, and Nuno António in Political Research Quarterly
Footnotes
Declaration of Conflicting Interests
The author(s) declared no potential conflicts of interest with respect to the research, authorship, and/or publication of this article.
Funding
The author(s) disclosed receipt of the following financial support for the research, authorship, and/or publication of this article: This work was supported by national funds through FCT (Fundação para a Ciência e a Tecnologia), under the project - UIDB/04152/2020 (DOI: 10.54499/UIDB/04152/2020) - Centro de Investigação em Gestão de Informação (MagIC)/NOVA IMS).
Data Availability Statement
The data and code supporting the findings of this study are publicly available in Zenodo at https://doi.org/10.5281/zenodo.13738284.
Supplemental Material
Supplemental material for this article is available online.
Note
References
Supplementary Material
Please find the following supplemental material available below.
For Open Access articles published under a Creative Commons License, all supplemental material carries the same license as the article it is associated with.
For non-Open Access articles published, all supplemental material carries a non-exclusive license, and permission requests for re-use of supplemental material or any part of supplemental material shall be sent directly to the copyright owner as specified in the copyright notice associated with the article.