
Abstract
This article chronicles and analyzes the changing state of party affiliation in the American South from the 1990s to the present. Party identification (PID) is examined with data from three survey sources: the American National Election Study (ANES), Cooperative Election Study (CES), and Exit Polls (national and state-level). Emphasis is placed on the changing PID patterns of white, Black, and Hispanic voters South-wide and in individual states. The findings strongly suggest that the current position of Republican electoral dominance will persist for some time to come, though there are multiple reasons why, in certain parts of the South, Democratic affiliation will likely increase.
In his mid-twentieth-century masterpiece, Key (1949) set aside one chapter (out of 31) in Southern Politics in State and Nation for the Republican Party (chapter 13), fittingly titled, “A Note on the Republican Party.” Key goes into some detail as to how the southern GOP in his time was principally a patronage party concerned with distributing federal largesse in presidential politics, which actually carried the disincentive to make Republicans more electorally viable (more spoils from the patronage pie for the select Republican few). Also mentioned is the historic African American allegiance to the GOP, a vestige and tribute to the Great Emancipator Abraham Lincoln. To be sure, factions within the Republican Party were prevalent throughout the South and pitted the so-called Black-and-Tans (minority GOP affiliates) against the racist Lily-Whites (see Heersink and Jenkins 2020). These race-based intraparty Republican disputes centered upon which group would be the beneficiary of presidential patronage rather than a keen interest in growing the GOP grassroots. Yes, the Republican Party had real (though localized) electoral prowess in the anti-secession mountainous sections of North Carolina, Tennessee, and Virginia, but beyond this, Key’s characterization of the mid-twentieth-century southern GOP was unflattering, facetious, and true: One never knows who is and who is not a Republican. The party places no imperative obligation of constancy on its communicants. It scarcely deserves the name of party. It wavers somewhat between an esoteric cult on the order of a lodge and a conspiracy for plunder in accord with the accepted customs of our politics. (Key 1949, 277)
Today, erstwhile enclaves of southern Republicanism (Heard 1952) have expanded to engulf most of the region (Black and Black 2002, 2007; Hood, Kidd, and Morris 2012; McKee 2019). In short, GOP electoral dominance has come to fruition (Bullock 2022a). But how sustainable is it? The more racially diverse urban South is growing the most in a rapid-growth region (Bullock et al. 2019), and it is literally moving Democratic (Morris 2021). However, South-wide, population growth is uneven, and hence, some scholars have taken to classifying the 11 ex-Confederate states as either growth (Florida, Georgia, North Carolina, South Carolina, Texas, and Virginia) or stagnant (Alabama, Arkansas, Louisiana, Mississippi, and Tennessee) (Bullock 2022b; Bullock et al. 2019). 1 The more rural stagnant states are now the most Republican in terms of representation and party identification (PID) (Hood and McKee 2022b). Nevertheless, despite relatively greater partisan competitiveness in the growth states, except for Virginia, 2 they also comfortably favor Republicans.
Generally, population change and particularly population growth, advantages Democrats in the modern South (Bullock 2022b), but it has not reversed Republican electoral dominance, which has been decades in the making (Black and Black 2002; Bullock 2022a; Maxwell and Shields 2019). GOP hegemony in officeholding is of course inextricably linked to political affiliation (Campbell et al. 1960) and therefore this study undertakes an in-depth examination of PID in the southern electorate. Drawing upon multiple large-N survey data sources (the ANES, CES, and Exit Polls), there are four primary reasons why it is too soon to usher in a Democratic comeback in southern politics: (1) white voters continue moving in favor of the GOP; (2) Black and Hispanic 3 movement to the Democratic Party has either slowed or, in some cases, tilted toward the GOP (e.g., Hispanics in Florida and Texas); (3) the white rural Republican realignment persists; and (4) white voters have the highest turnout, which furthers a Republican participation advantage. These findings should not be interpreted as a corrective to the extant literature, but rather constitute heretofore unexamined evidence that, despite an impressively growing and increasingly diverse American South, most of its citizens remain under one-party Republican rule.
The article proceeds as follows. First, southern party affiliation is sketched from the 1990s to the present. The 1990s marks GOP ascendance in southern politics from this decade forward. With larger samples from the Cooperative Election Study (CES), party affiliation in the contemporary southern electorate (2012–2020) is displayed by state for white and Black voters. Hispanics are the second largest minority population in the South, but they substantially trail African Americans regarding their share of the electorate. Hence, given sample limitations, PID patterns for Hispanic voters are only shown for residents in Florida and Texas. Next, multivariate analysis of white voters from 2012 to 2020 shows the effects of four factors on the likelihood of identifying as a Republican. Exit Poll data (2008 and 2020) are then analyzed to highlight the growing geographic disparity in white Republicanism, with rural white voters now more aligned with the GOP than their urban white neighbors. Then, a participation bias favoring the GOP is noted because southern white voters turn out at a greater rate than Black and Hispanic voters. The penultimate section illustrates the electoral byproduct of party affiliation, and the article concludes with some admittedly speculative thoughts on the future state of PID in the southern electorate.
The Distribution of Party Affiliation in the American South, 1992–2020
For decades, scholars have investigated and debated the concept of PID in the American electorate (Bartels 2002; Campbell et al. 1960; Fiorina 1981; Green, Palmquist, and Schickler 2002; MacKuen, Erickson, and Stimson 1989). Most of the disagreement over PID is with respect to its dynamism; that is, how stable is it in response to actual events impacting politics (Fiorina 1981; MacKuen, Erickson, and Stimson 1989)? In The American Voter, Campbell et al. (1960) offer an accounting of PID that generally views it as a stable, enduring, psychological attachment to a political party that filters (and thus biases, see Bartels 2002) almost all political information. Succinctly, for Campbell et al. (1960), PID is the overriding factor shaping political behavior and typically functions as the “unmoved mover,” affecting political opinions and attitudes but rarely being influenced in turn by these other predispositions. Nevertheless, the tremendous changes in the American South warrant placing a caveat on the classic view of PID; it is the unmoved mover, except when alterations to the political environment are great enough to move PID. 4
Warren E. Miller, a coauthor of The American Voter (Campbell et al. 1960), published an article in 1991 that launched a defense in favor of a conceptualization of PID that categorized Independent leaners as Independents because, more than anything else, these ANES survey respondents did not claim to be partisans. But a year later, Keith et al.’s (1992) landmark study The Myth of the Independent Voter made a more compelling case for why scholars were on firm ground in treating Independent leaners as partisans: the bulk of leaners were indistinguishable from weak (not-so-strong) partisans with respect to vote choice. So, although it may be the case that there is some differentiation among weak partisans and leaners regarding candidate preferences and related attitudes (Fiorina 2012, 6–7), pure Independents exhibit the kind of volatility in their voting behavior, which indeed reflects the fact that they are not aligned with a major party. Additionally, as Klar and Krupnikov (2016) discovered, a substantial segment of Independent identifiers really are undercover/closet partisans and the motivation for this is social desirability—in an age of increasingly polarized partisan politics—claiming political independence appears the most acceptable (and least adversarial/controversial) public-facing affiliation to profess holding.
Thankfully, for empirical purposes, it actually does not matter whether the seven-point PID scale is subsequently parceled into three categories so that leaners are treated as partisans or instead as Independents. For a lengthy time series, either classification scheme yields similar longitudinal patterns. For the sake of consistency though, with the ANES and CES data, which both include the original seven-point PID branching questions, leaners are classified as partisans. This decision is grounded in the fact that the voter preferences of weak partisans and leaners are more similar than those of leaners and pure Independents. And from the vantage of a political campaign, there is much more confidence in how the outcome is likely to play out if the share of leaners is much higher than the percentage of constituents who are pure Independents. Hence, treating pure Independents as a separate category or even excluding them from an analysis, offers a clearer picture of the partisan balance of electoral competition in a given context.
Miller (1991) presented ANES data from 1952 to 1988 (presidential years), which he parceled into Non-South/South and by gender (men/women). He also showed the national time series for African Americans (not split into Non-South/South) because the samples were too small outside the South. Miller (1991) reported data for respondents claiming voting and used the validated voter data for the ANES studies including it (1964, 1976, 1980, 1984, and 1988). 5 Miller (1991) displayed differences in the distribution of PID, for the aforementioned groups by subtracting the percentage of Republican (strong plus weak) affiliates from Democratic (strong plus weak) identifiers, and Independents (pure and leaners) were excluded from the analysis. From 1952 to 1988, Miller (1991) concluded that partisan realignment among white voters was concentrated in the South and was fueled by white men, who had become markedly more Republican than white women. As for Black voters, Miller (1991) documented the surge in Democratic ID from 1960 to 1964, which then leveled off but remained overwhelmingly in favor of Democratic allegiance thereafter.
Partisan Balance of Identification Among White, Black, and Hispanic Voters in the South, 1992–2020.
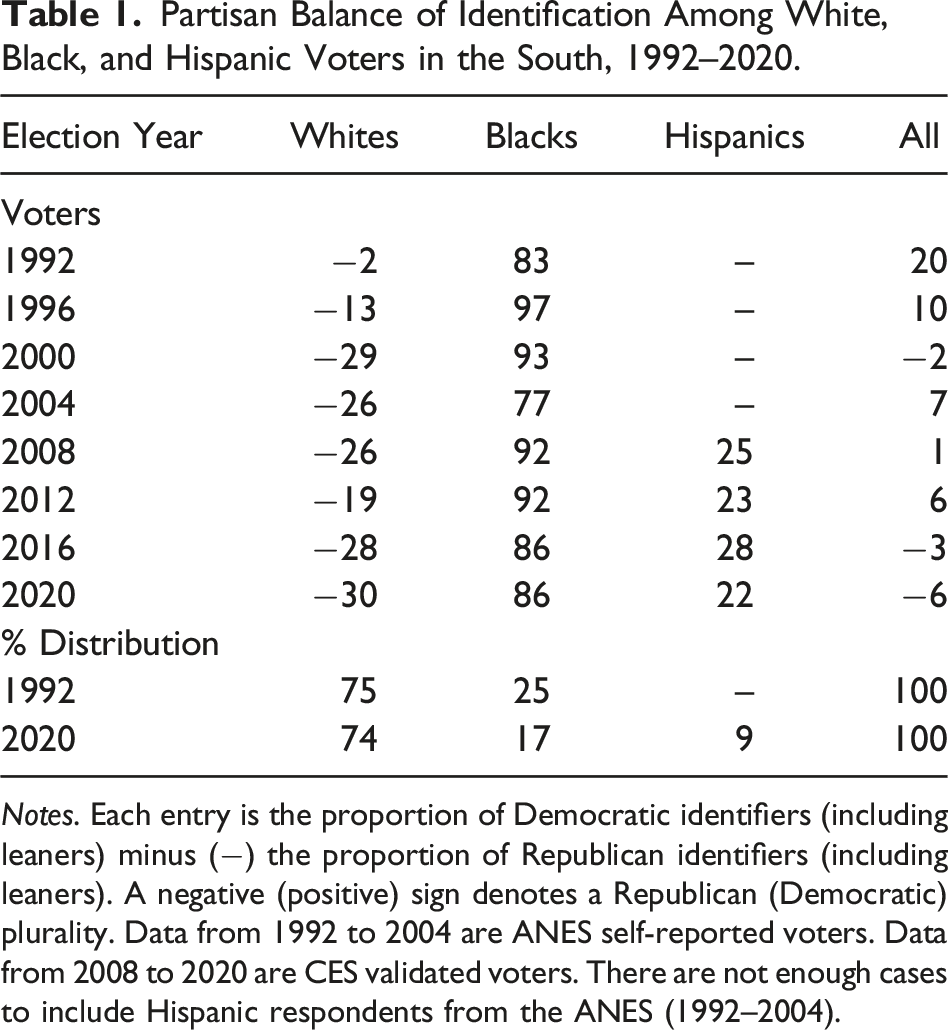
Notes. Each entry is the proportion of Democratic identifiers (including leaners) minus (−) the proportion of Republican identifiers (including leaners). A negative (positive) sign denotes a Republican (Democratic) plurality. Data from 1992 to 2004 are ANES self-reported voters. Data from 2008 to 2020 are CES validated voters. There are not enough cases to include Hispanic respondents from the ANES (1992–2004).
With its smaller samples, ANES data on Hispanic voters is not shown, and therefore, the partisan balance of PID is confined to white and Black southern voters from 1992 to 2004. Given the close split in PID among southern whites in 1992 (−2), and the one-sided Democratic ID advantage among southern Blacks (83), the overall PID distribution favors Democrats by 20 percentage points in 1992. What is perhaps most compelling from the findings is that the white southern Republican realignment was still in its infancy in 1992. Among white voters, the GOP ID advantage balloons from −2 in 1992 to −30 in 2020 (65.2 percent Republicans minus 34.8 percent Democrats), its highest point.
With the inclusion of Hispanic voters from 2008 forward, they clearly favor the Democratic Party in affiliation but not nearly to the extent that African Americans do. Notably, for Hispanic voters, the Democratic ID advantage is greatest in 2016 (28) and then recedes to its lowest mark in 2020 (22). Combining all three groups of voters, the Republican ID advantage, at −6, reaches its apex in 2020. Finally, it is interesting to note that the distribution of the electorate by racial/ethnic group hardly changes among white voters from 1992 (75 percent) to 2020 (74 percent), and thus, the reduction in the size of the Black electorate (25 percent in 1992 to 17 percent in 2020) comes mainly from the growing Hispanic electorate (9 percent in 2020).
Party Affiliation of White, Black, and Hispanic Voters by State
The South’s shift in favor of GOP affiliation, found among white voters and overall, from 1992 to 2020 is illuminating, but rising Republicanism exhibits considerable variance depending on the state. Therefore, this section highlights state-level party affiliation for white, Black, and Hispanic voters in the most recent presidential years. These data are from the CES and limited to validated voters. Data on white and Black voters are for 2012–2020. The 2008 CES asked respondents “What racial or ethnic group best describes you?” and categories for the three groups of interest (white, Black, and Hispanic) were listed as distinct response options. Unfortunately, it was not until 2010 that the CES asked a follow-up question for respondents who did not report being Hispanic on the initial question, which said “Are you of Spanish, Latino, or Hispanic origin or descent?” The inclusion of this question makes it possible to determine which respondents are non-Hispanic white and non-Hispanic Black.
The proceeding figures show Republican ID by state for southern white voters (2012–2020); Democratic ID for southern Black voters (2012–2020); differences in Republican ID among white versus Black voters in 2020; and the distribution of Latino Democrats and Latino Republicans in Florida and Texas (2008–2020), the two southern states with large enough Hispanic electorates to show these PID data. 6
Republican Identification of White Southern Voters, 2012–2020.
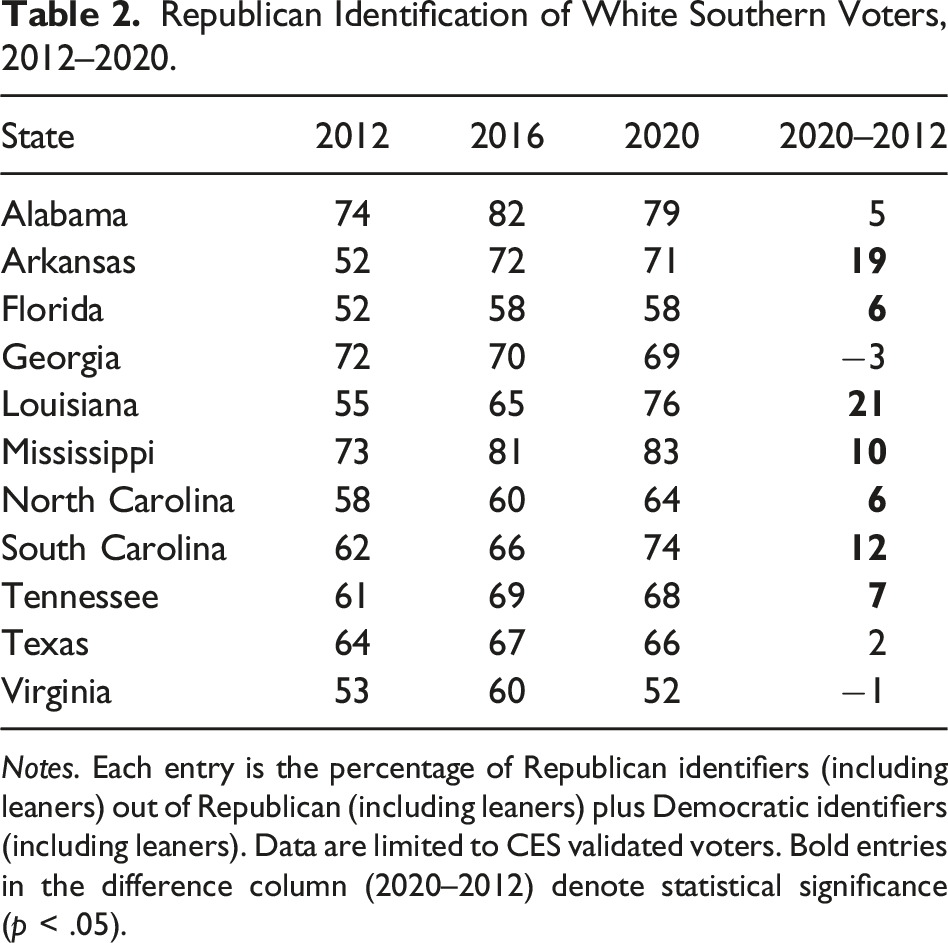
Notes. Each entry is the percentage of Republican identifiers (including leaners) out of Republican (including leaners) plus Democratic identifiers (including leaners). Data are limited to CES validated voters. Bold entries in the difference column (2020–2012) denote statistical significance (p < .05).
Democratic Identification of Black Southern Voters, 2012–2020.
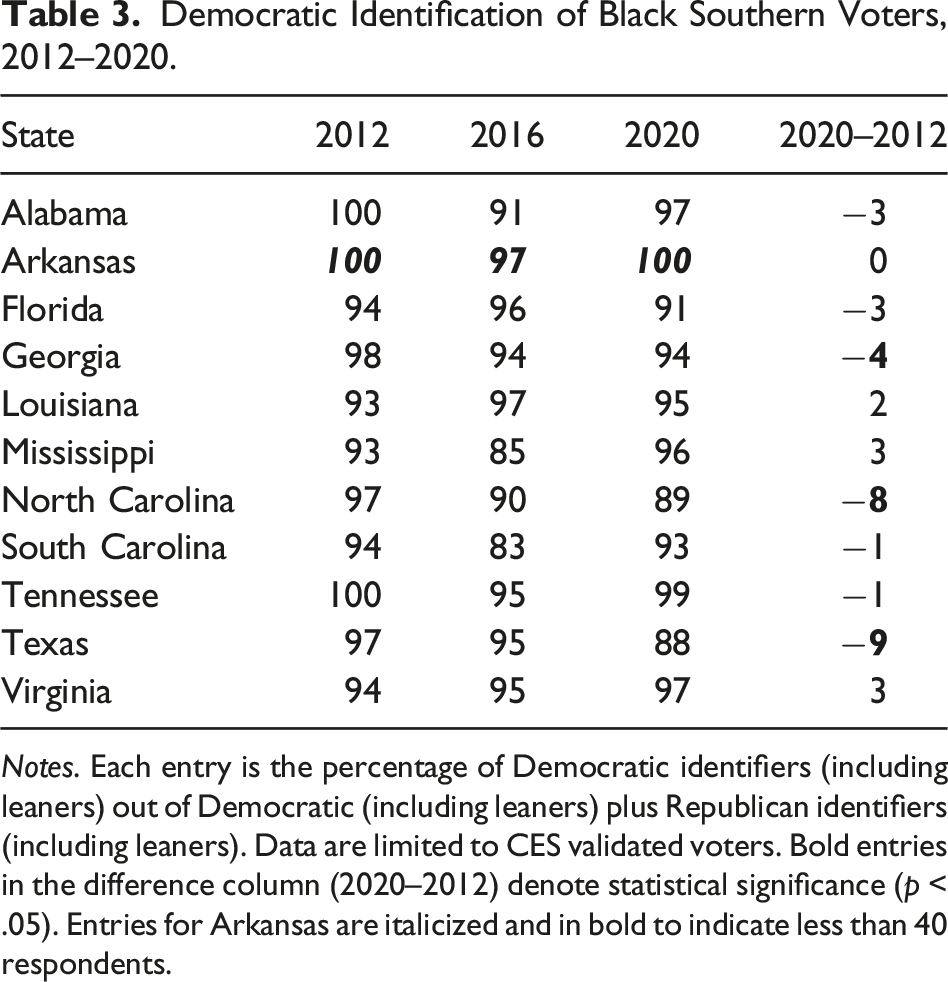
Notes. Each entry is the percentage of Democratic identifiers (including leaners) out of Democratic (including leaners) plus Republican identifiers (including leaners). Data are limited to CES validated voters. Bold entries in the difference column (2020–2012) denote statistical significance (p < .05). Entries for Arkansas are italicized and in bold to indicate less than 40 respondents.
Figure 1 can be interpreted as a gauge of racial polarization in party affiliation, because it shows the difference in 2020 GOP ID among white and Black voters by state (percent white Republicans minus percent Black Republicans). Reflecting their history of the most intense racial turmoil found among the southern states (McKee 2017) since at least the civil rights movement (mid-1950s to mid-1960s), in 2020, Mississippi and Alabama are the most racially polarized. For instance, in the case of Mississippi, the 79.3 percent value in Figure 1 was calculated by subtracting the 4 percent Black Republican voters from the 83.3 percent white Republican voters. At the other end of the spectrum, Florida’s 48.7 percent disparity (57.9 percent white Republicans minus 9.2 percent Black Republicans) is the lowest racial polarization in GOP ID among the southern states. Perhaps it is no surprise, but there is a strong and significant positive correlation between the 2020 (two-party) Republican presidential vote and the degree of racial polarization (as shown in Figure 1) in the 11 southern states (coefficient is 0.812 and p = .002).
7
Racial polarization in Republican identification, 2020 Election.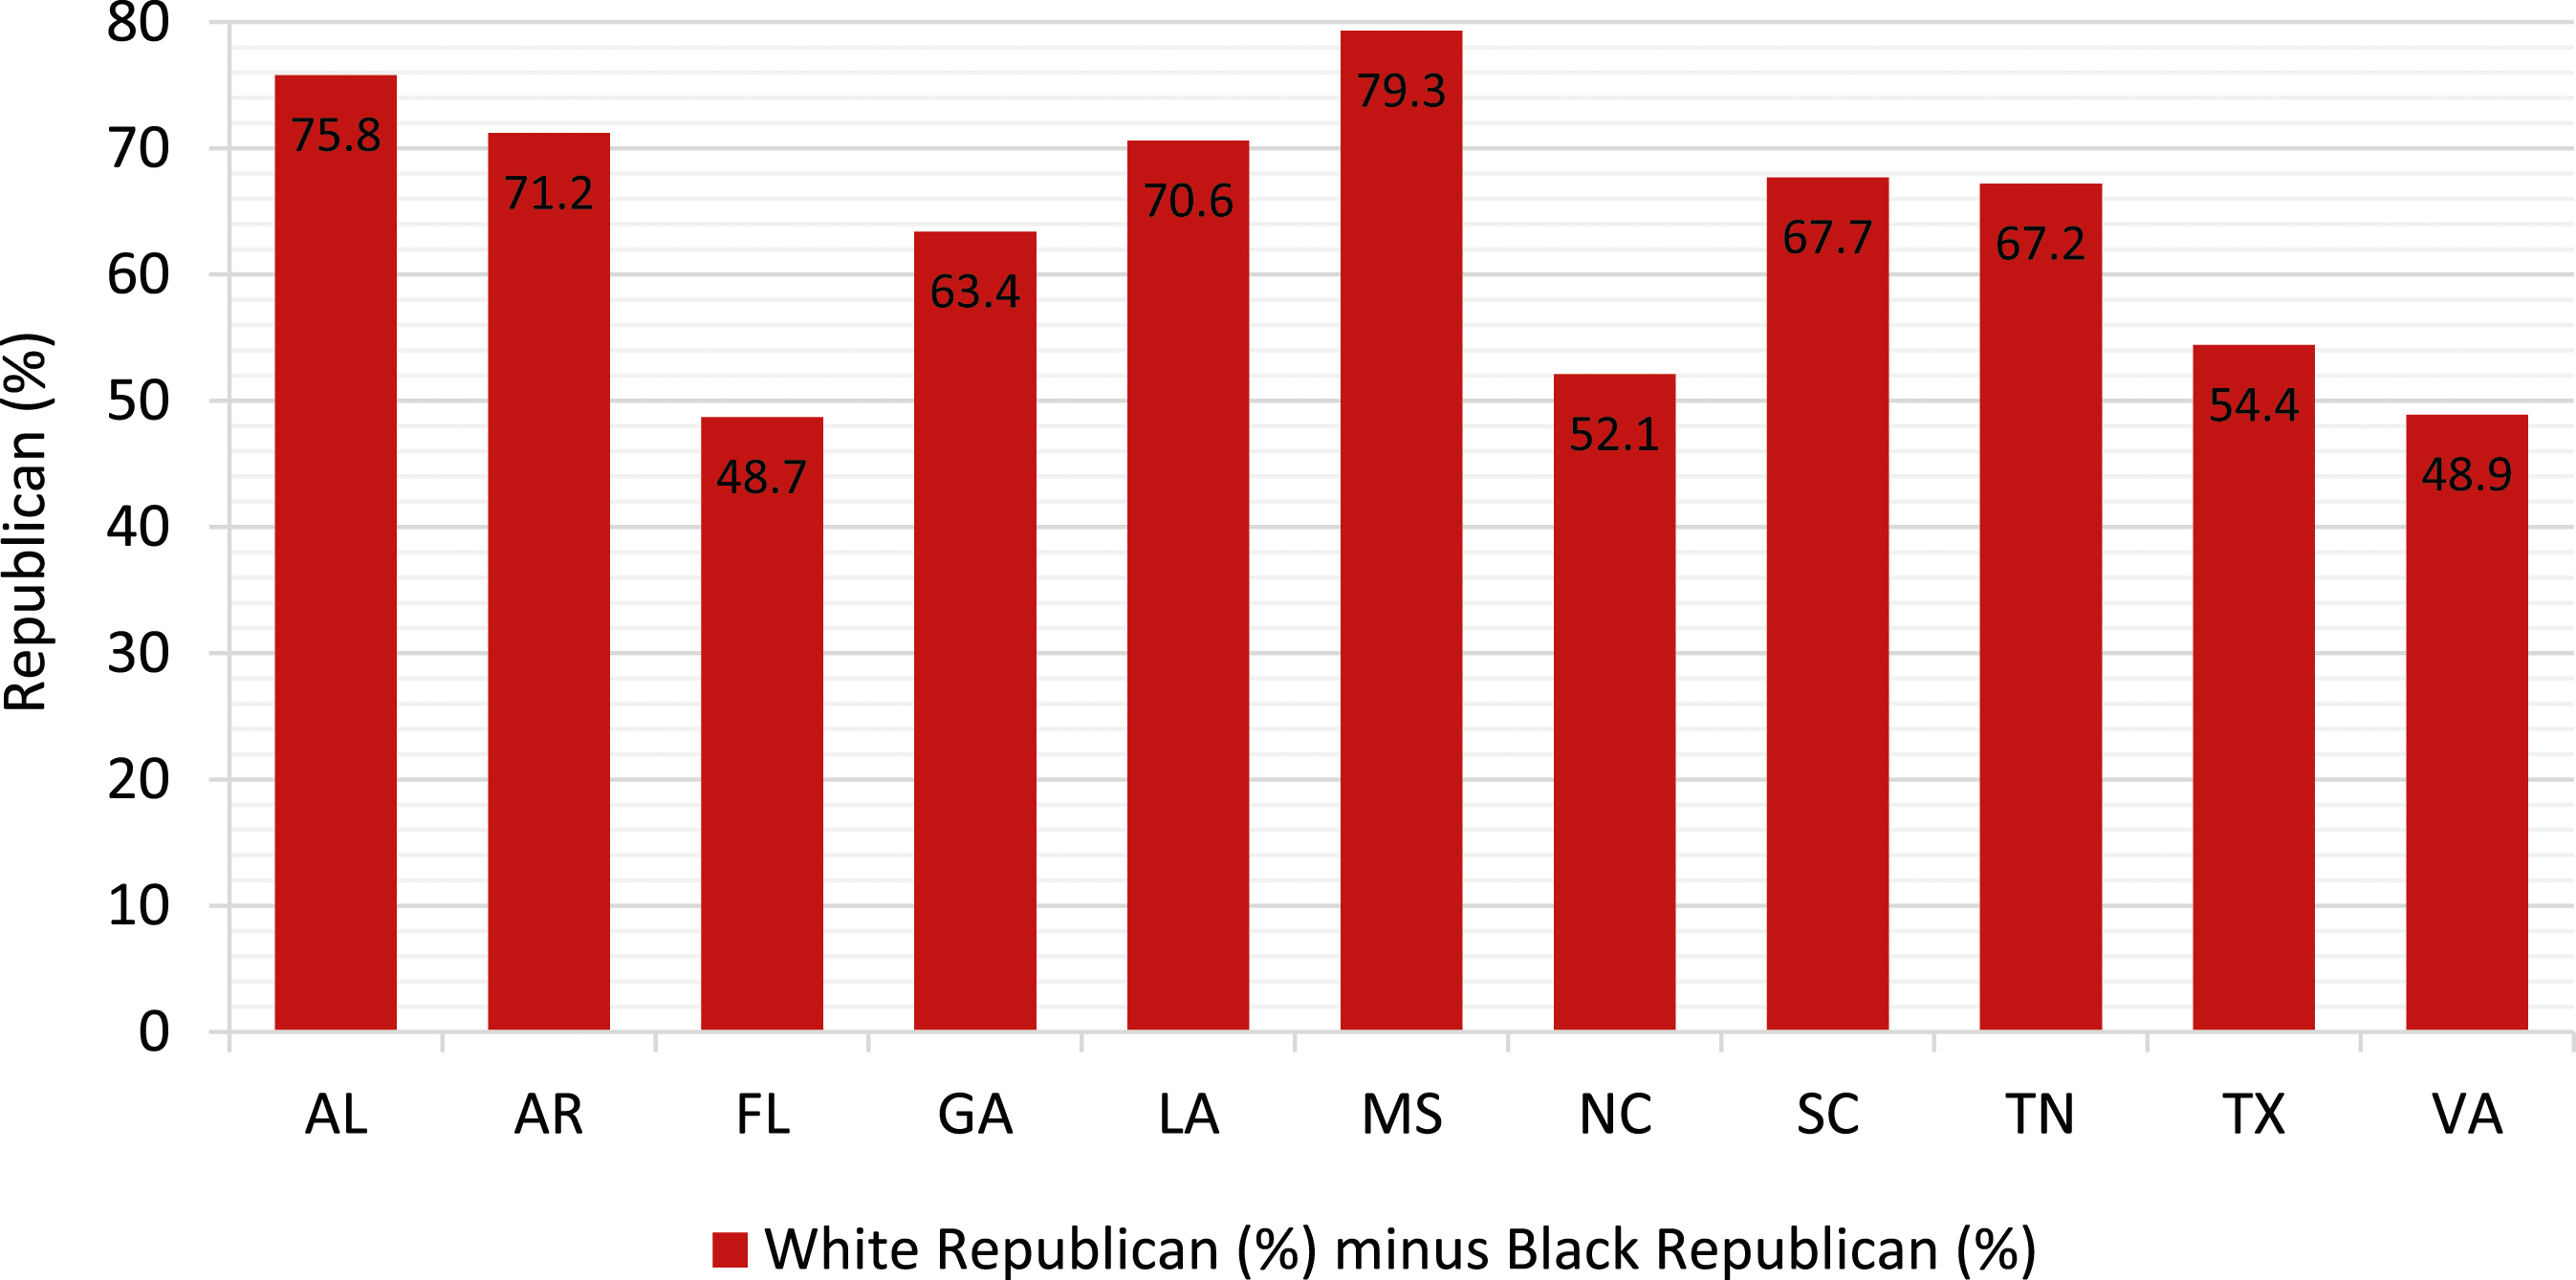
Likely the most memorable and unquestionably shocking passage from Donald Trump’s 2015 campaign announcement for president was the following: When Mexico sends its people, they’re not sending their best. They’re not sending you...They’re sending people that have lots of problems, and they’re bringing those problems with us. They’re bringing drugs. They’re bringing crime. They’re rapists. And some, I assume, are good people.
8
Hispanic voters’ party identification in Florida and Texas (2a) Florida (2b) Texas.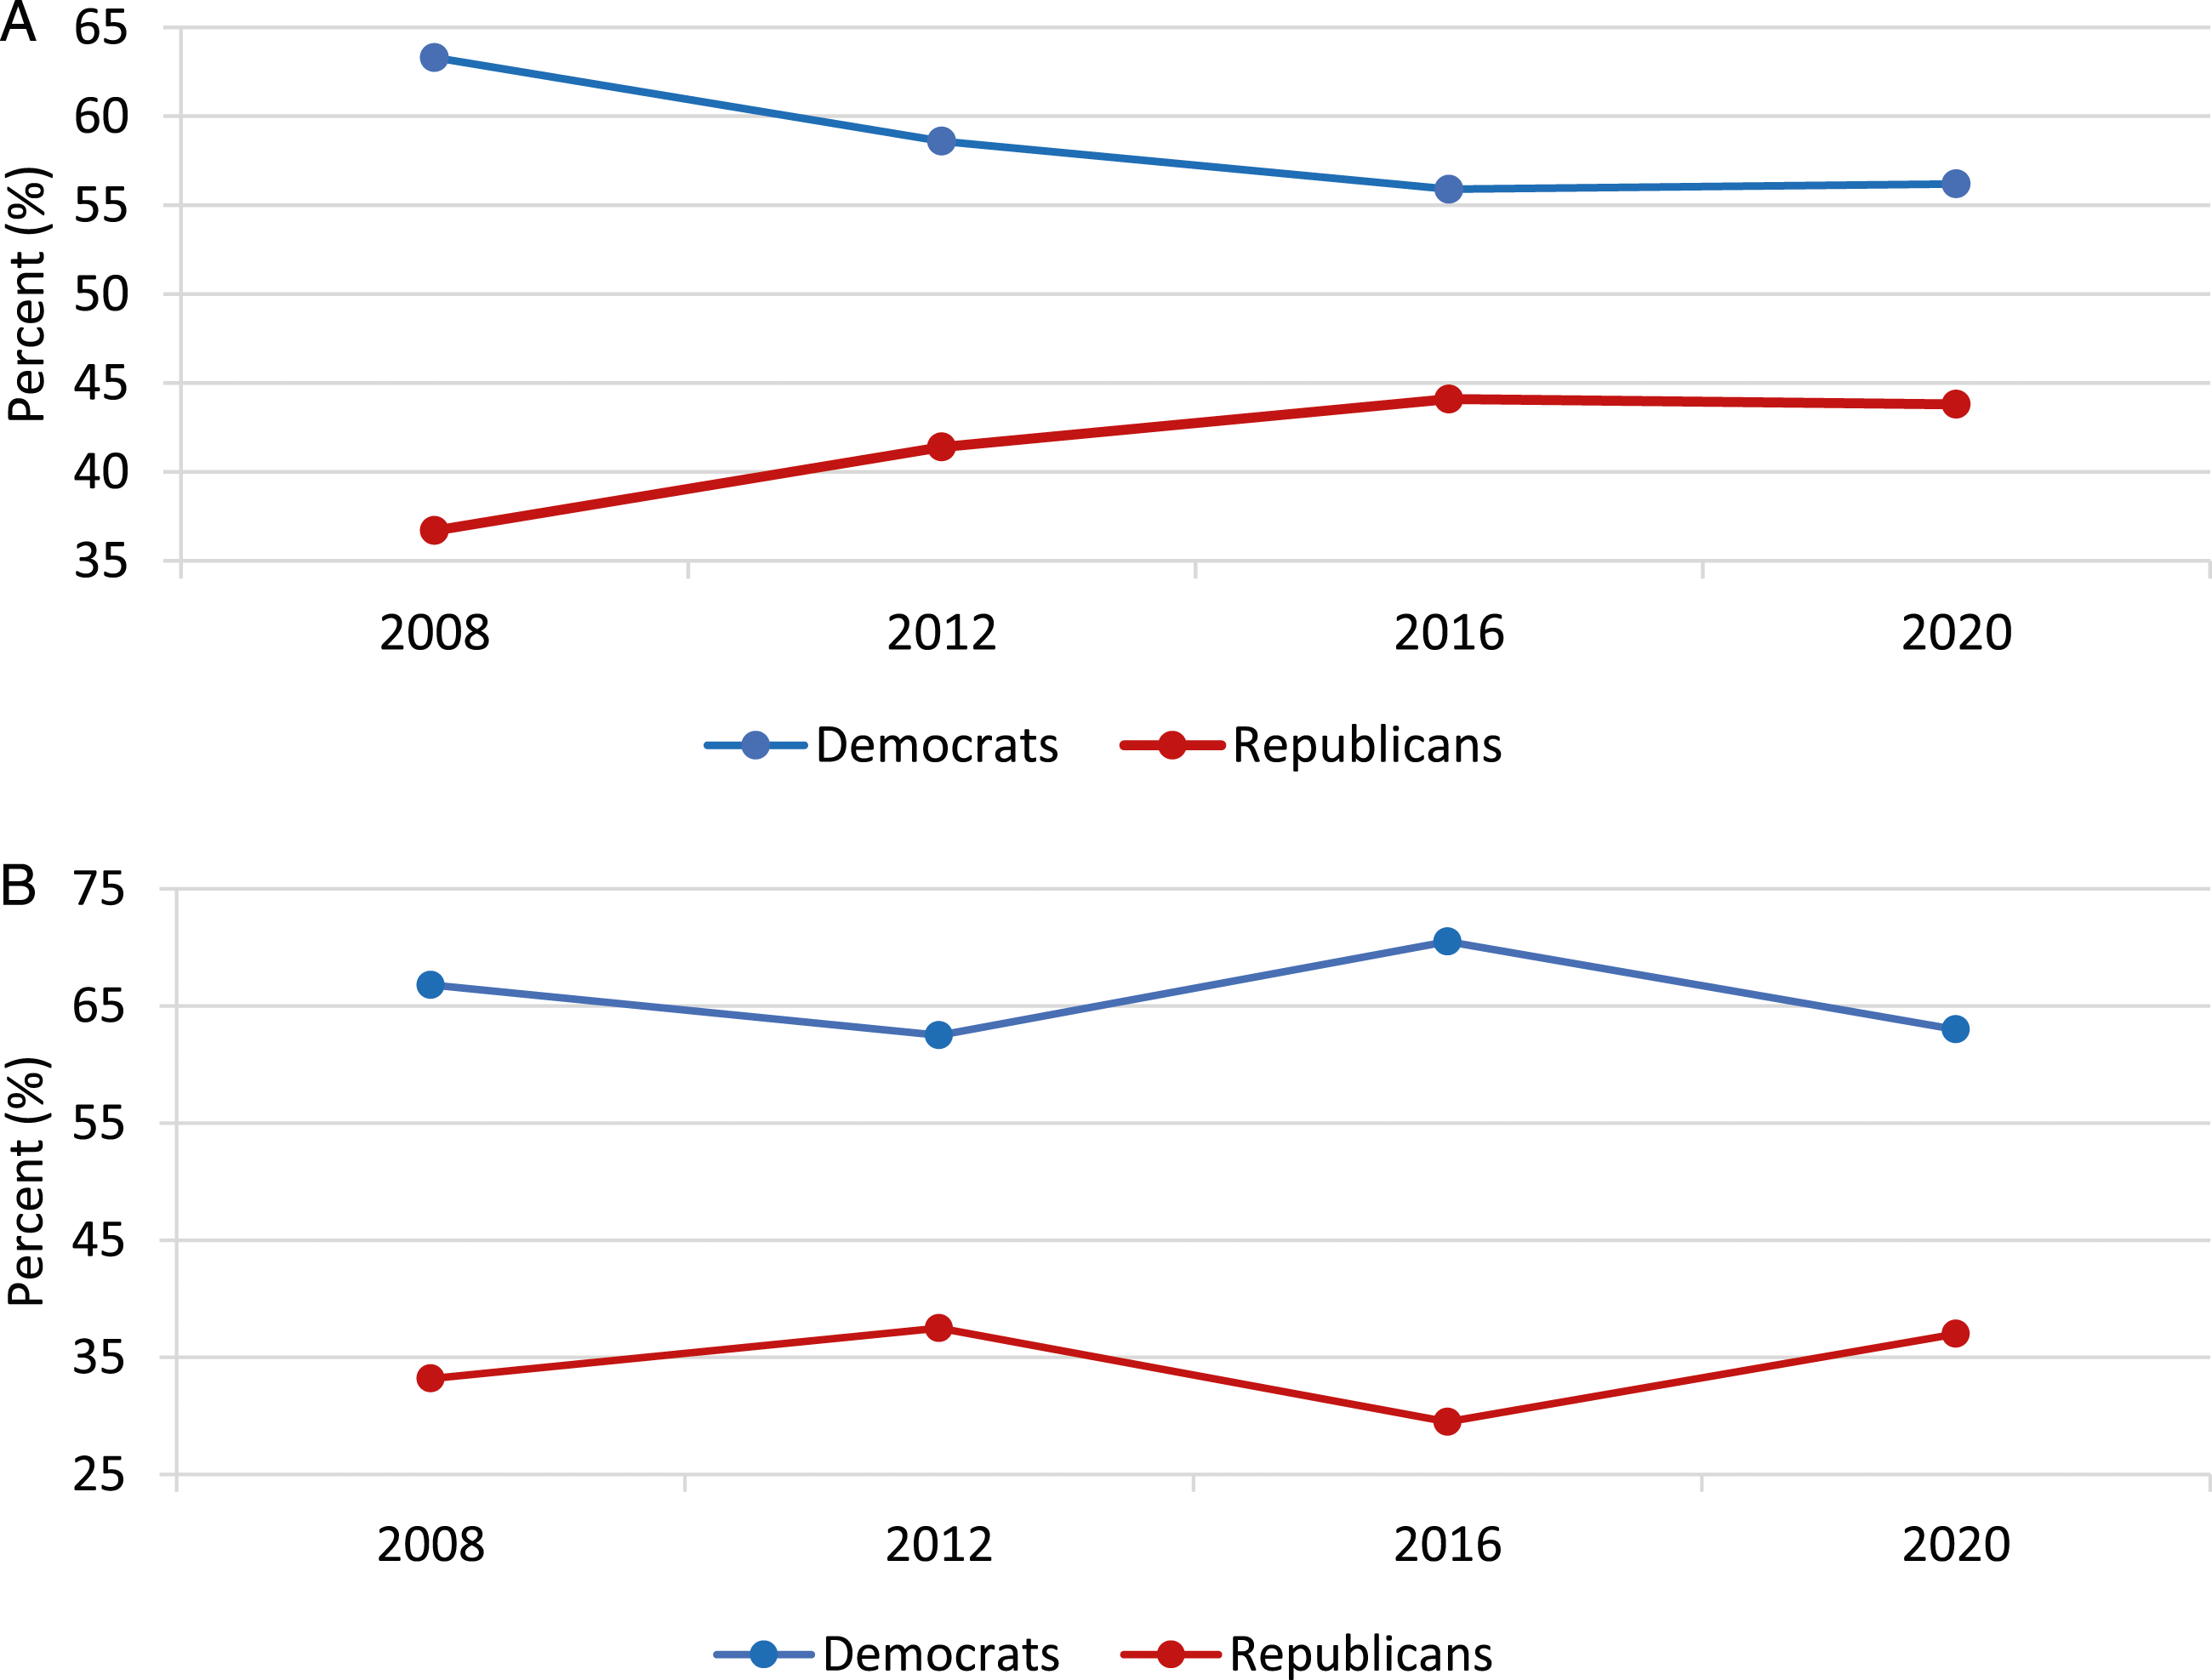
Starting with Florida, Hispanic Democratic ID (63.3 percent) is highest in 2008 and conversely GOP ID (36.7 percent) is lowest in this year (a 26.6-point Democratic ID advantage). In 2016, there is a palpable 4.7-point rise (decline) in GOP ID (Democratic ID) and in the two subsequent years it starts to level off, with Hispanic Democrats holding a 12.4-point advantage in 2020 (56.2 percent Democrats versus 43.8 percent Republicans). Compared to Texas, which has a majority Mexican Hispanic population, the Sunshine State has considerably more diversity in the origins of its Latino electorate (i.e., large numbers of Cubans, Puerto Ricans, Mexicans, in addition to sizable groups from South America, Central America, and the Caribbean). Also, though Florida and Texas are the most urban states in the South (Hood and McKee 2022b), Texas Hispanics’ tilt towards Trump in 2020 was most evident in the more rural counties located on or near the Mexico border (Hood and McKee 2022a). By comparison, in 100 percent urban Miami-Dade County, Florida’s most populous, most Hispanic (69.1 percent) county, that includes over 30 percent of the state’s Latino residents, Trump’s vote (two-party) went from 35 percent in 2016 to 46 percent in 2020. 9
The PID pattern among Hispanic voters in Texas is quite different from that found in Florida. In 2008, 66.8 percent of Texas Latinos were Democrats versus 33.2 percent Republicans. In 2012, the share of Democrats declines and hence the percentage of GOP affiliates increases. But in 2016, the percentage of Democrats (70.5 percent) rebounds to its apex while conversely the share of Republicans (29.5 percent) notches its nadir. Then, in 2020, the pattern reverses, with Democrats declining to 63 percent and Republicans increasing to 37 percent. This 7.5-point change in Texas Hispanics’ PID from 2016 to 2020 is a significant difference (p < .05), but the 26-point Democratic ID advantage in Texas is over twice the size of the 2020 Democratic ID margin in Florida (12.4 points, as noted above).
Divisions within the White Southern Electorate, 2012–2020
In his examination of PID, in which he divvies up the American electorate into region, gender, and race, Miller (1991, 560) suggested that “other dimensions of interest to both practical politics and political theory, such as religion and age, could be added to the list.” To this end, in addition to gender (Box-Steffensmeier, DeBoef, and Lin 2004), religion has been an important cleavage for decades now (Layman 2001), and maybe even more so in the South (Green et al. 2014). Age is also an important factor, as younger cohorts in the southern electorate are less affiliated with the GOP vis-à-vis their parents and grandparents (McKee 2019). Finally, the “diploma divide” is perhaps the latest and most significant wedge altering the composition of the major party coalitions, as the non–college-educated are moving into the GOP while the college-educated are leaving the party (Sides, Tesler, and Vavreck 2018; Zingher 2022).
With the large size of the participatory southern white electorate in the CES surveys, this section evaluates to what extent do gender, religion, age, and education have on party loyalties? Probit models are run, with PID as the dependent variable, coded 1 for Republican (strong, weak, and leaners) and 0 for Democrat (strong, weak, and leaners). On the right side of the model are explanatory variables for gender (1 = male, 0 = female); religion (1 = Protestant, 0 = otherwise), age (dummies for 18–29, 30–44, 45–64, and 65 and older as the omitted comparison category), and education (1 = college degree or higher, 0 = less than a college degree). Models are run separately for the 2012, 2016, and 2020 elections, and also a model that pools all three election years and therefore includes election-year indicators (with 2012 as the base category). Finally, these models include fixed effects for southern state (coefficients not shown) and cluster robust standard errors on the county of residence.
Divisions Within the White Southern Electorate, 2012–2020.
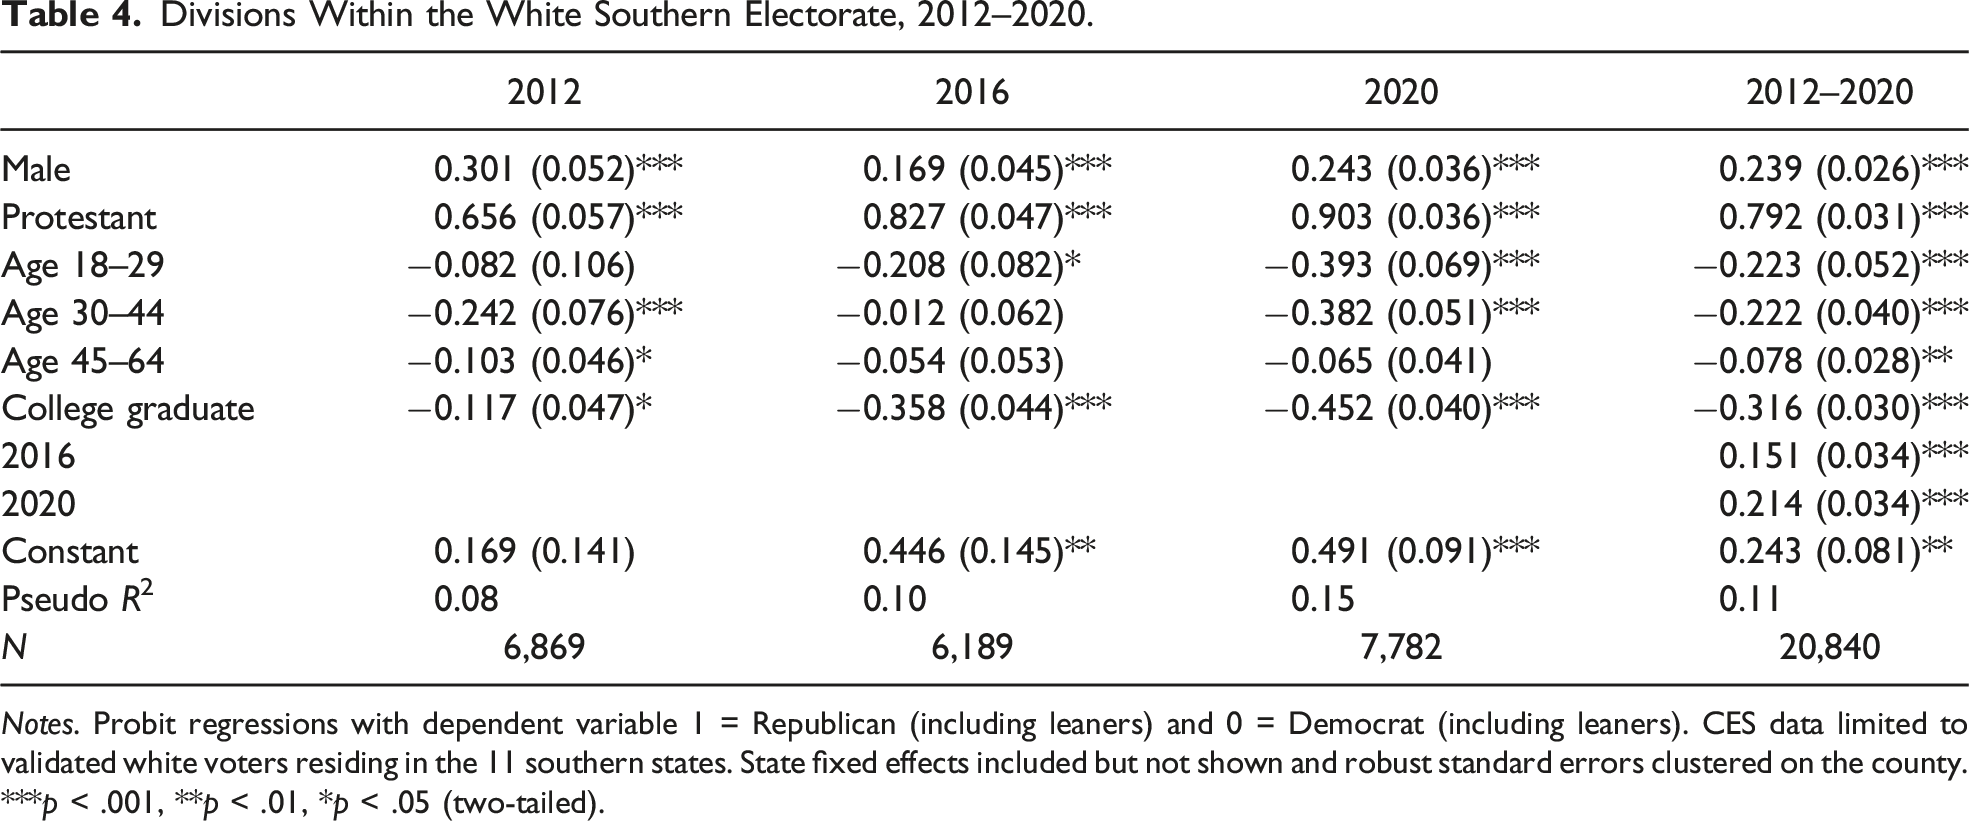
Notes. Probit regressions with dependent variable 1 = Republican (including leaners) and 0 = Democrat (including leaners). CES data limited to validated white voters residing in the 11 southern states. State fixed effects included but not shown and robust standard errors clustered on the county. ***p < .001, **p < .01, *p < .05 (two-tailed).
To interpret, effect sizes entail additional analysis. Figure 3 presents predicted probabilities for the explanatory variables in the pooled model. The observed-value approach (Hanmer and Kalkan 2013) was employed to generate the probability of Republican affiliation according to each variable of interest. The plotted probabilities are bracketed at the 95 percent confidence level and a vertical line runs up from 0.5 on the horizontal axis to show that in all but one instance, the likelihood of GOP ID exceeds 0.5. Probability of Republican identification among white southern voters.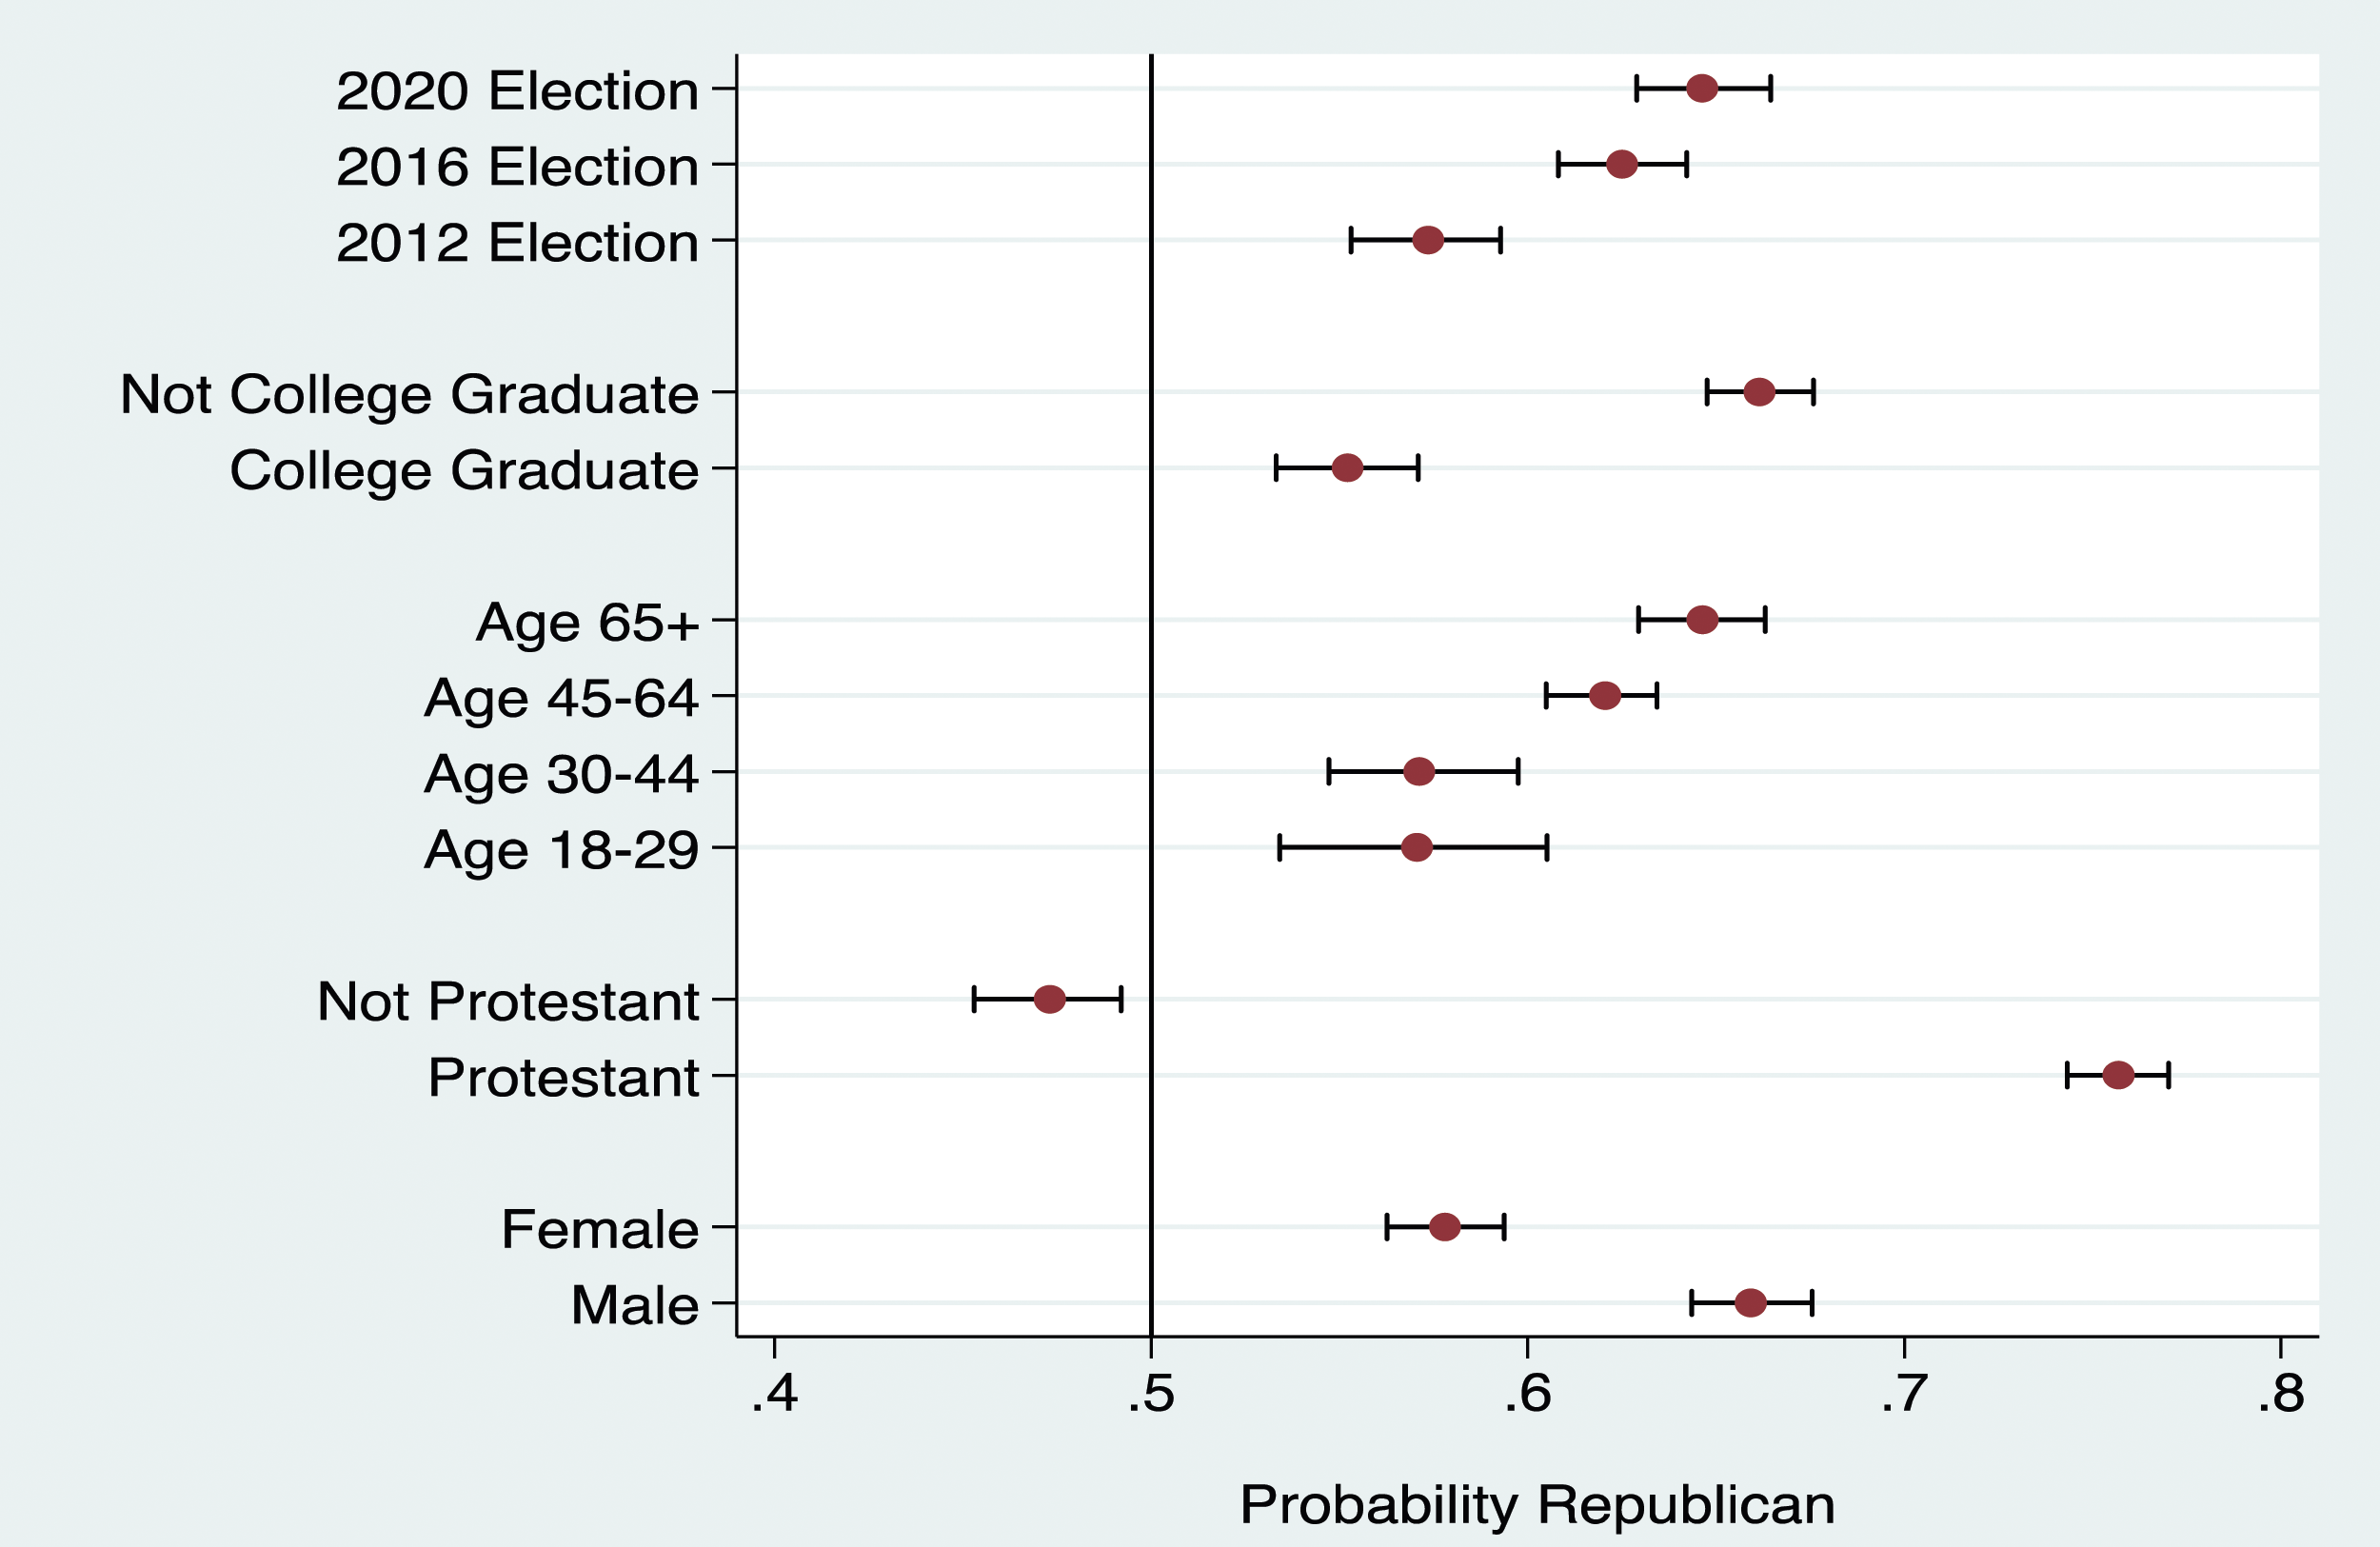
Starting at the bottom of the figure with gender, there is a notable gap in GOP ID, a 0.66 probability for men versus a 0.58 probability for women. The most gaping disparity, truly a chasm, is found among Protestants versus non-Protestants. There is a 0.76 probability that a Protestant identifies as Republican—the strongest relationship with GOP ID. In contrast, the weakest relationship with Republicanism is found among non-Protestants, who have a 0.47 likelihood of being Republican, the only group with a greater probability of not affiliating with the GOP. Turning to age groups, the two youngest cohorts (18–29 and 30–44) are notably less Republican (0.57 probability) than the two oldest age groups, a 0.62 probability for those 45–64 and a 0.65 probability for 65+ voters.
Interestingly, the diploma divide in GOP affiliation is larger than the gender gap. Voters lacking a college degree have a 0.66 probability of being Republican. College-educated voters have a 0.55 likelihood of affiliating with the Republican Party. Finally, the election-year variables document a trend in favor of Republican affiliation. In 2012, the likelihood of GOP ID is 0.57; it is 0.63 in 2016 and 0.65 in the 2020 election. 10
Geographic Polarization within the White Southern Electorate, 2008 versus 2020
Not until 2022 did the CES provide a geographic variable based on the type of place where a respondent lives. The CES has always provided county of residence, but it can be tricky deciding whether an individual resides in an area that is urban or rural because of the vast variation in subsections of particular counties. Rather than incorporate an urban/rural designation from county data in the CES, this section turns to Exit Polls, which provide place classifications. Of course, Exit Polls only consist of voters, but one drawback is an inconsistency with the previously shown ANES and CES data. The Exit Polls offer a blunter classification scheme for PID: Democrat, Republican, or Independent. 11 Thus, this three-point PID scale does not parse out potential Independent leaners, which so far have been categorized as partisans. Nevertheless, this coding of PID should not affect whether there exists a growing difference in white southern voters’ attachment to the GOP on the basis of geography. If anything, without the ability to further classify some Independents as partisans, it is likely that the relationship between geography and GOP affiliation is understated.
The Exit Polls contain five-category and three-category place designation variables. Like Hood and McKee (2022b), the three-category place variable is collapsed into a dummy for 1 = urban and 0 = rural. Originally the three-place category designation consists of 1 = cities over 50,000; 2 = suburbs; and 3 = small cities/rural. Small cities have less than 50,000 inhabitants. In the recoding, categories 1–2 = 0 for urban and category 3 = 1 for rural (including small cities/towns as such). To highlight the long-term movement of rural whites to the GOP, the Exit Polls of interest are 2008 and 2020. There is the national Exit Poll for these two elections and also state-level Exit Polls. There is a subsample of voters from all 11 southern states in the national Exit Polls. For the state Exit Polls, in order to show changes from 2008 to 2020 means only southern states with Exit Polls in both elections are featured. 12 The states with Exit Polls for 2008 and 2020 are Alabama, Florida, Georgia, North Carolina, South Carolina, Texas, and Virginia.
Geographic Polarization of White Southern Voters, 2008 Versus 2020.
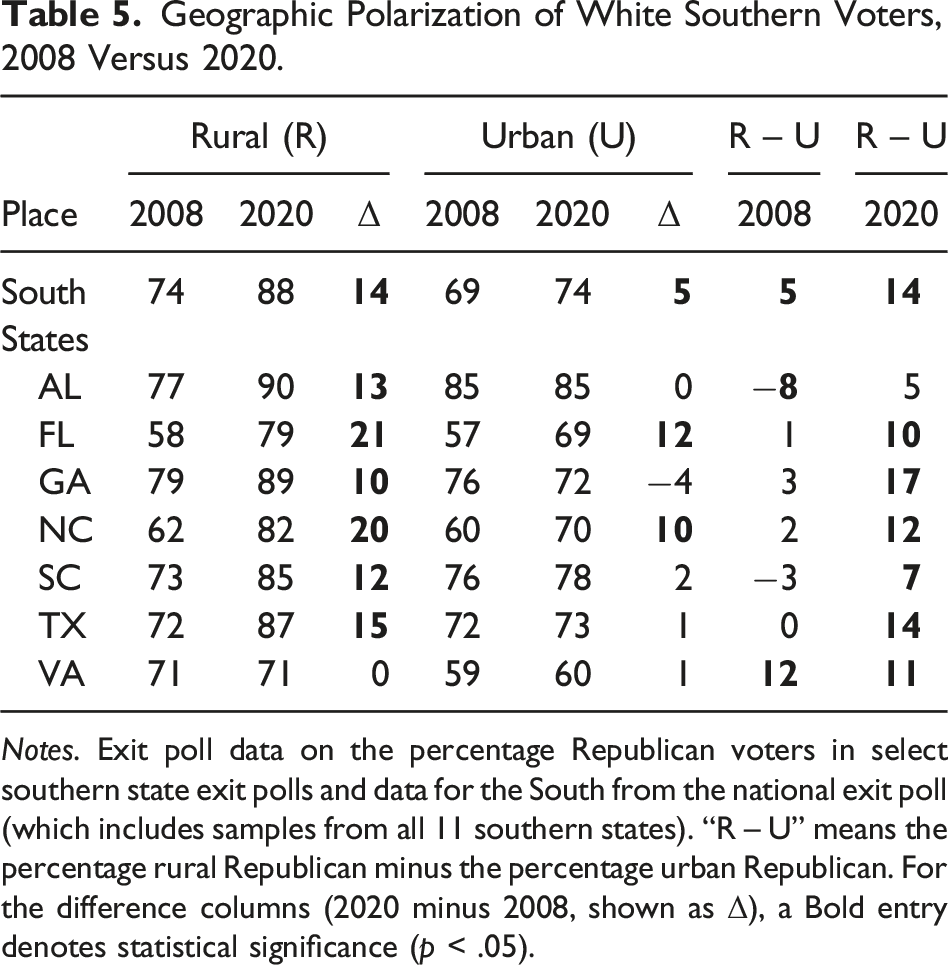
Notes. Exit poll data on the percentage Republican voters in select southern state exit polls and data for the South from the national exit poll (which includes samples from all 11 southern states). “R – U” means the percentage rural Republican minus the percentage urban Republican. For the difference columns (2020 minus 2008, shown as Δ), a Bold entry denotes statistical significance (p < .05).
Data on urban white southern voters are found in the middle three columns of Table 5. South-wide, urban white voters go from 69 percent Republican in 2008 to 74 percent in 2020, a significant 5-point increase in GOP ID. Turning to the seven state Exit Polls, the evidence does not tell the story of a continuing GOP realignment for urban white voters. From 2008 to 2020, in only Florida (12-point increase) and North Carolina (10-point increase) is there a significant increase in GOP ID among urban white voters. In the other five states, Republican affiliation is constant (Alabama), shows an insignificant and substantially small increase (South Carolina, Texas, and Virginia), or reveals an insignificant decline (Georgia).
The last two columns in Table 5 report rural versus urban differences in GOP affiliation for 2008 and 2020, respectively. In 2008, for the southern electorate in the national Exit Poll, rural whites are 5 points more Republican (74 percent) than urban whites (69 percent)—a fairly small, yet significant difference. In 2008 in Alabama, urban whites are a significant 8 points more Republican than their rural white neighbors. Only in Virginia are rural white voters in 2008 significantly more Republican than urban white voters, by a substantial 12 points. In the remaining five states, there is not a significant difference in the rate of Republicanism among rural and urban white voters.
A dozen years later in 2020, shows that the rural GOP realignment across the South has made this group the most Republican segment of the electorate (Hood and McKee 2022b). Now, there is a 14-point disparity in GOP affiliation favoring rural white voters. In the seven states, only in Alabama is there not a significant difference in GOP ID between rural and urban white voters. But in the other six states, rural white voters are significantly more Republican, with a margin ranging from a low of 7 points in South Carolina to a high of 17 points in Georgia.
Running probit regressions similar to those found in Table 4 for the southern sample of voters in the 2008 and 2020 national Exit Polls, but adding the indicator variable for rural, is insightful. Rather than showing the findings here (economizing on space), it will simply be noted that in 2008, the rural variable is insignificant, meaning there is no difference in the probability of affiliating with the GOP depending on whether a voter is rural or urban. In the 2020 model, the rural variable is positive and statistically significant, controlling for gender, religion, age, and education (as coded for the models in Table 4). Using the observed-value approach again, the likelihood of identifying as Republican is 0.73 for urban whites and 0.86 for rural whites, a substantial and significant 13-point difference. 13 In sum, the 2020 Exit Poll data highlight the white South’s rural Republican realignment (Hood and McKee 2022b). GOP affiliation among urban white voters has leveled off, but it should not be overlooked that South-wide this group shows a modest, positive, and significant increase in Republican affiliation in 2020 as compared to 2008.
Republican Participation Bias, 2012–2020
Composition and Participation of Southern Electorate, 2012–2020.
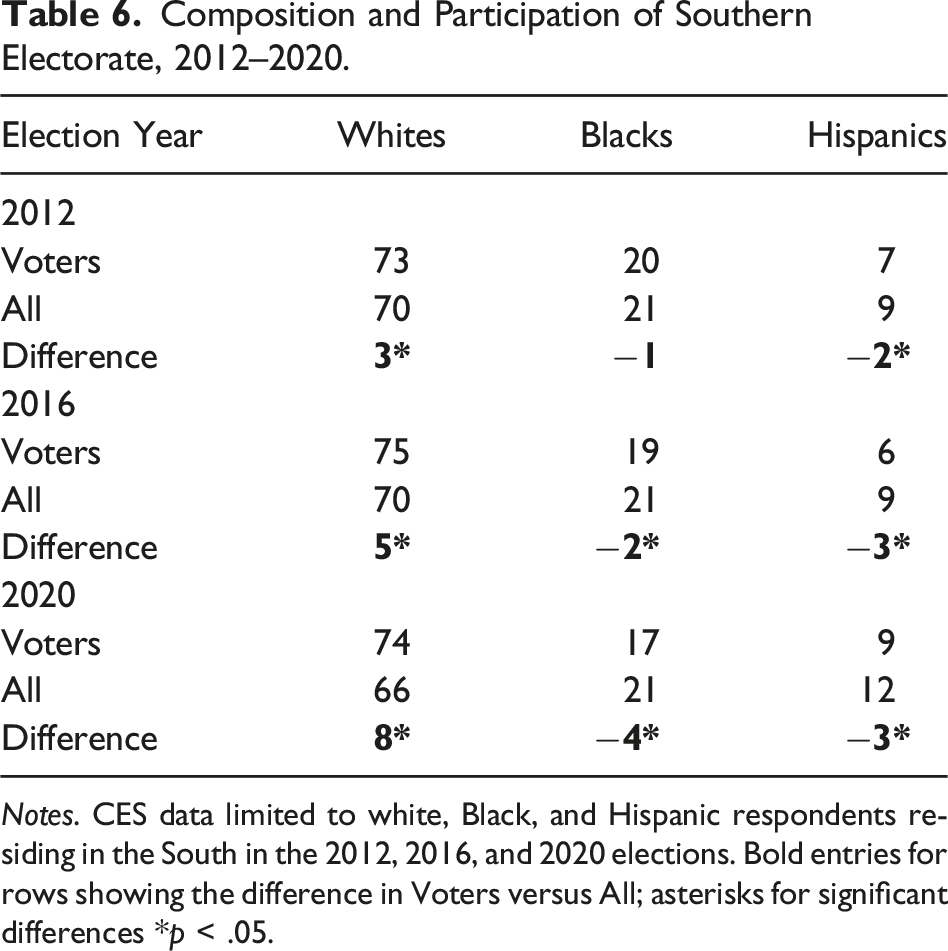
Notes. CES data limited to white, Black, and Hispanic respondents residing in the South in the 2012, 2016, and 2020 elections. Bold entries for rows showing the difference in Voters versus All; asterisks for significant differences *p < .05.
For each election, whites are significantly more participatory than their corresponding distribution among southern residents limited to whites, Blacks, and Hispanics. For instance, whites account for 73 percent of voters in 2012 but 70 percent of the electorate that year, a significant and positive 3-point participation bias. In President Obama’s successful reelection in 2012, Black participation is not any different from their share of the southern electorate, but Hispanic participation is a significant 2 points lower than their presence in the southern electorate. By 2020, the participation disparity favoring white voters has only expanded. Among the southern electorate comprised of whites, Blacks, and Hispanics, in 2020, it is 66 percent white, 21 percent African American, and 12 percent Latino. But with regard to participation, among these three groups, whites register a significant and positive 8-point participation bias, Blacks manifest a significant and negative 4-point participation deficit, and Latinos a significant and negative 3-point participation deficit.
Discussion: The Electoral Byproduct of Party Affiliation
Figure 4 shows 2020 CES data for the difference in party affiliation (Republican ID minus Democratic ID) for all validated voters (not limited to whites, Blacks, and Hispanics) in each southern state, and in the South. The least Republican/most Democratic state is Virginia with over a 15-point Democratic advantage in party affiliation. The last GOP presidential nominee to win Virginia was George W. Bush in 2004. Florida is the only other state with a Democratic ID advantage (just −0.28 points). But of late, the Sunshine State is trending Republican.
14
Trump won Florida twice and it is the only southern state in 2020 where the GOP presidential margin increased from 2016 (Hood and McKee 2022b). Additionally, for the first time, in 2021, GOP voter registration surpassed Democratic voter registration in Florida, and among active major party registrants, Republicans were 50.2 percent in 2021, 51.9 percent in 2022, and currently 53.5 percent in 2023 (as of 10/31/23).
15
Difference in party affiliation for validated voters in 2020.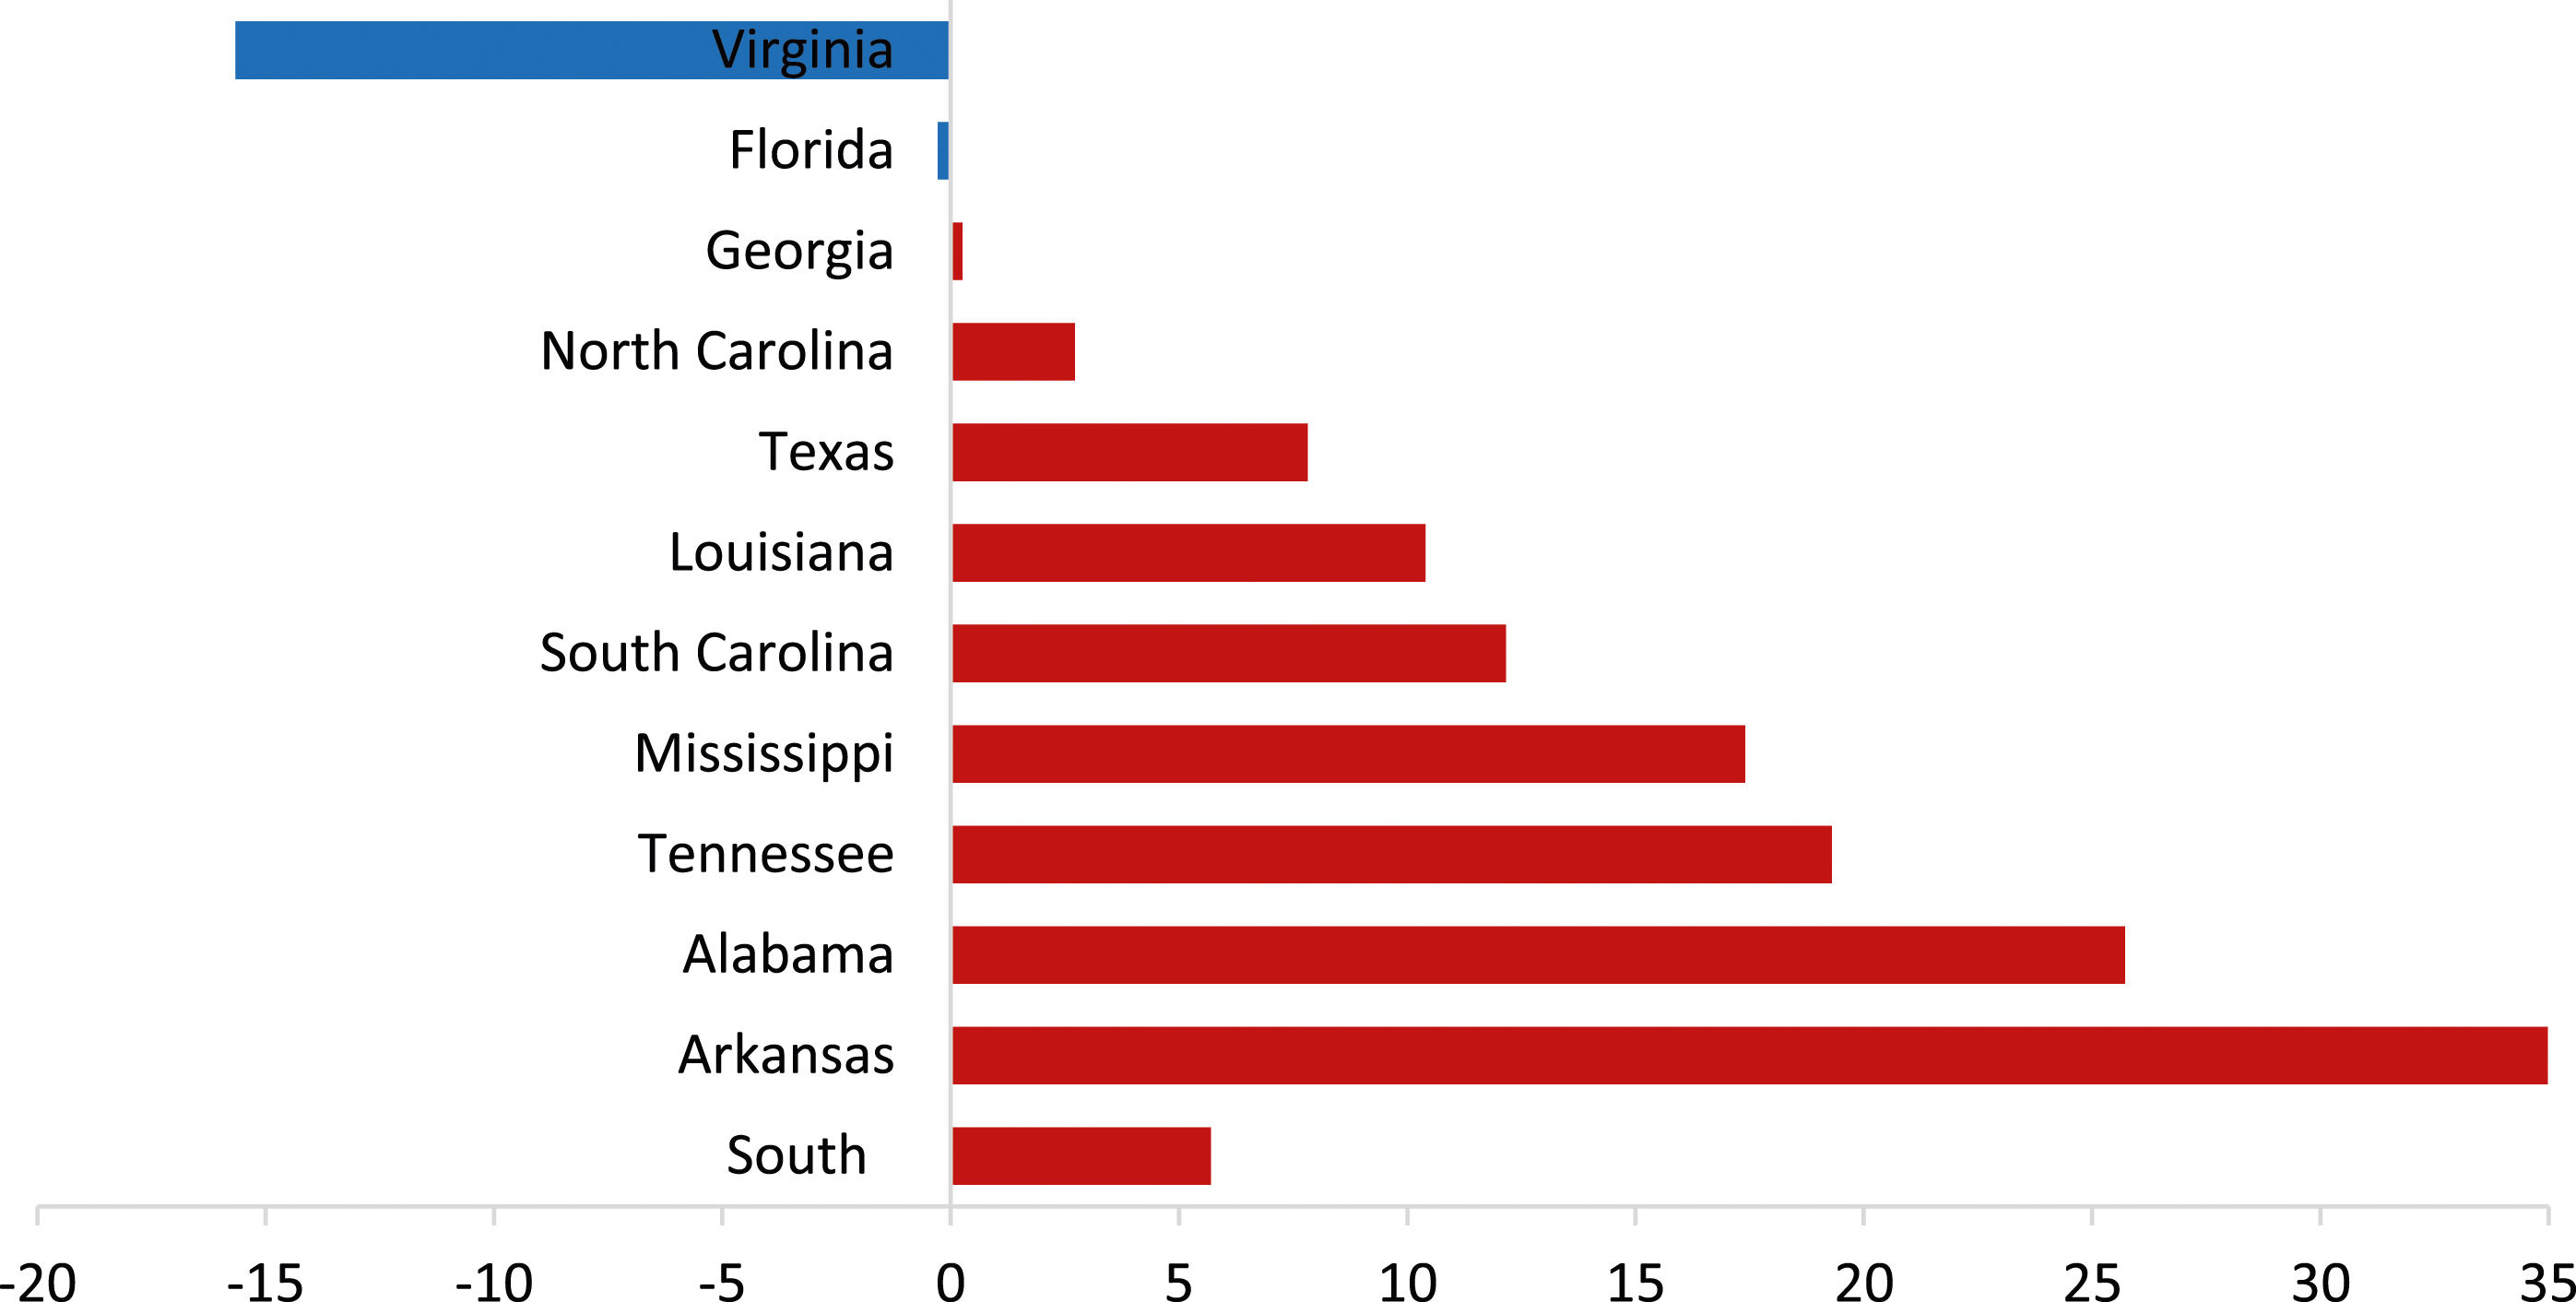
Fittingly, Georgia has the smallest party affiliation margin at 0.26 points in the Republican direction. With a Democratic advantage of 11,779 votes out of almost 5 million cast, this 0.2 percent two-party margin made the Peach State the nation’s most competitive in the 2020 presidential election. North Carolina, the next most competitive, with a 2.7-point GOP ID advantage, surprisingly went Democratic in 2008, but has remained in the Republican presidential column since. The remaining states with larger GOP ID advantages have registered impressive Republican streaks in presidential elections. GOP presidential vote margins in Texas have narrowed after 2012, but the Lone Star State was last won by a Democrat in 1976. 16 Louisiana, the median state in competitiveness based on its 10.4-point GOP affiliation advantage, like Tennessee and Arkansas (now two of the most Republican states), all last awarded their presidential votes to a Democrat in 1996. 17 The remaining three decidedly Republican states of South Carolina, Mississippi, and Alabama, last went Democratic in 1976. Finally, in a region dominated by Republicans in presidential elections going back to 1968 (Black and Black 1987), South-wide, the Republican ID advantage in 2020 was 5.7 points.
By referencing presidential elections, the data in Figure 4 offer face validity for how differences in party affiliation margins align with electoral outcomes. Also, there is general agreement among southern politics scholars that modern southern Republican inroads have marked a path of top-down advancement (see Aistrup 1996), with the earliest and most sustainable gains taking place in presidential contests and then filtering down to lower offices. It is difficult to dispute the historical record for this general pattern of southern Republican electoral success (Hood and McKee 2022b; McKee 2019; McKee and Yoshinaka 2015). But top-down GOP advancement in the South has come to an end (McKee 2019, 350–352) in this age of nationalized politics (Hopkins 2018) because so few partisans veer from their affiliation in casting votes from the top to bottom of the ticket (Jacobson 2015). This means that even narrow party affiliation margins can sustain GOP control, so long as pure Independents do not break decisively in favor of the Democratic opposition.
Officeholding offers a more telling picture of the southern GOP’s contemporary hegemony. Among white voters, it was not until the mid-1980s that GOP ID matched or slightly surpassed Democratic affiliation (Black and Black 1987). But white affiliation has continued to increase since then (refer back to Table 1). Nevertheless, translating party affiliation into party loyalty in voting, took time, especially because the incumbency advantage still had real electoral teeth into the 1990s, when southern Republicans became ascendant in congressional elections (Black and Black 2002; Bullock, Hoffman, and Gaddie 2005; McKee 2010; Petrocik and Desposato 1998).
Figure 5 displays the percentage of Republican seats in statewide contests for governor and U.S. Senate, paired alongside district-based races for U.S. House and state legislature. The data are presented this way to highlight Republicans’ more impressive advantage in statewide elections. Limiting the data to presidential years, in 1992, southern Democrats still had the upper hand in holding all of these offices. But in the following 1994 midterm, Republicans won their first majority in the southern U.S. House delegation since 1874 (Black and Black 2002). Republican share of southern seats in presidential years, 1992–2020.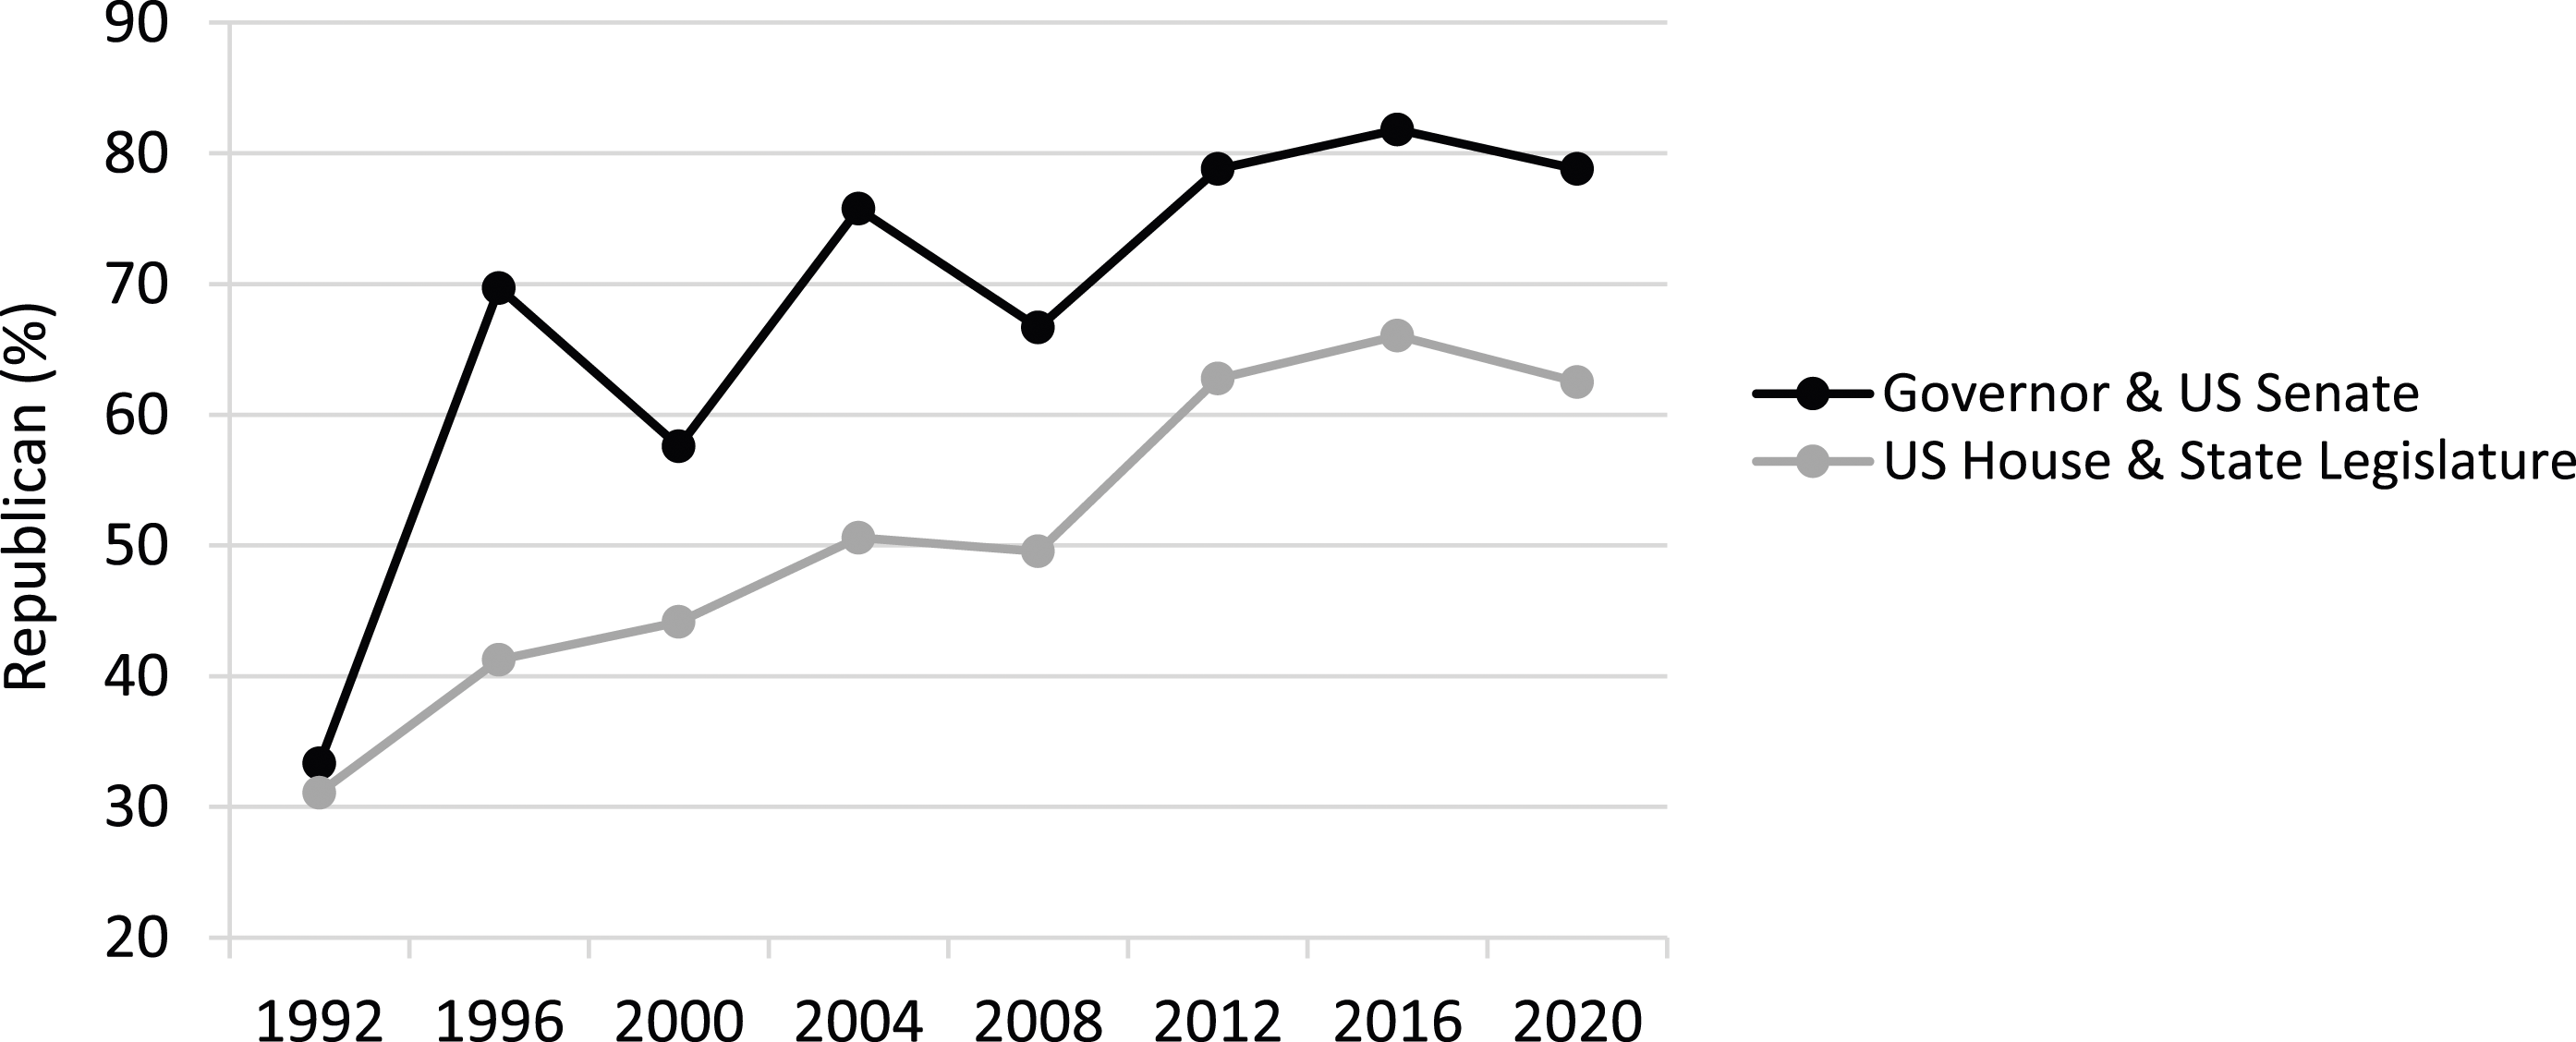
In the most recent 2020 presidential cycle, Republicans had just under 80 percent of gubernatorial and senatorial seats and almost 63 percent of U.S. House and state legislative offices. These numbers ticked up for Republicans after the 2022 midterm elections. At the time of this writing, Republicans hold 10 of 11 governorships (91 percent), 18 of 22 Senate seats (82 percent), 98 out of 142 U.S. House seats (69 percent), and 1,170 out of 1,782 state legislative seats (66 percent). 18 The GOP controls 9 states’ U.S. House delegations, North Carolina is evenly split (7 to 7), and Democrats are the majority in Virginia. Out of 22 southern state legislative chambers, Republicans control all but two, the Virginia House and Senate.
Covering elections into the mid-2000s, Hayes and McKee (2008, 24) analyzed a trove of data to conclude that “the near future of southern politics entails a majority Republican Party and a minority Democratic Party.” 19 This has since come to pass, but perhaps the most prescient insight of this work comes from the observation that immediately followed:
If we conceptualize each southern state as a single district for the sake of considering Republican prospects in statewide elections, then, to the extent that these contests reflect the dynamics in district-level contests, the GOP is greatly advantaged. Given the fact that Whites comprise a clear majority in every southern state but Texas, further movement of Whites in favor of the GOP necessarily dims the prospects for Democrats in statewide elections (Hayes and McKee 2008, 24).
To emphasize the manifestation of the aforementioned expectation, Figure 6 documents the Republican and Democratic percentage of seats in all constitutional (non-judicial/non-federal) statewide elective offices from 1990 to 2023. Of the 78 statewide elective offices in 1990, Democrats held 65 (83 percent) and Republicans 13 (17 percent). Figure 6 captures the two most pronounced GOP electoral surges over these 30-plus years, the 19.2-point burst from 1993 to 1994, and the 16.2-point jump from 2009 to 2010.
20
Both of these historic electoral advances resulted in new plateaus that eventually grew even higher. The highest GOP peak yet manifests in 2023. Of the 73 statewide elective offices in 2023, Democrats have 4 (5.5 percent) and Republicans occupy the remaining 69 (94.5 percent). The four Democratic seats all reside in North Carolina (governor, secretary of state, attorney general, and auditor). Republican and Democratic seats in statewide elective offices, 1990–2023.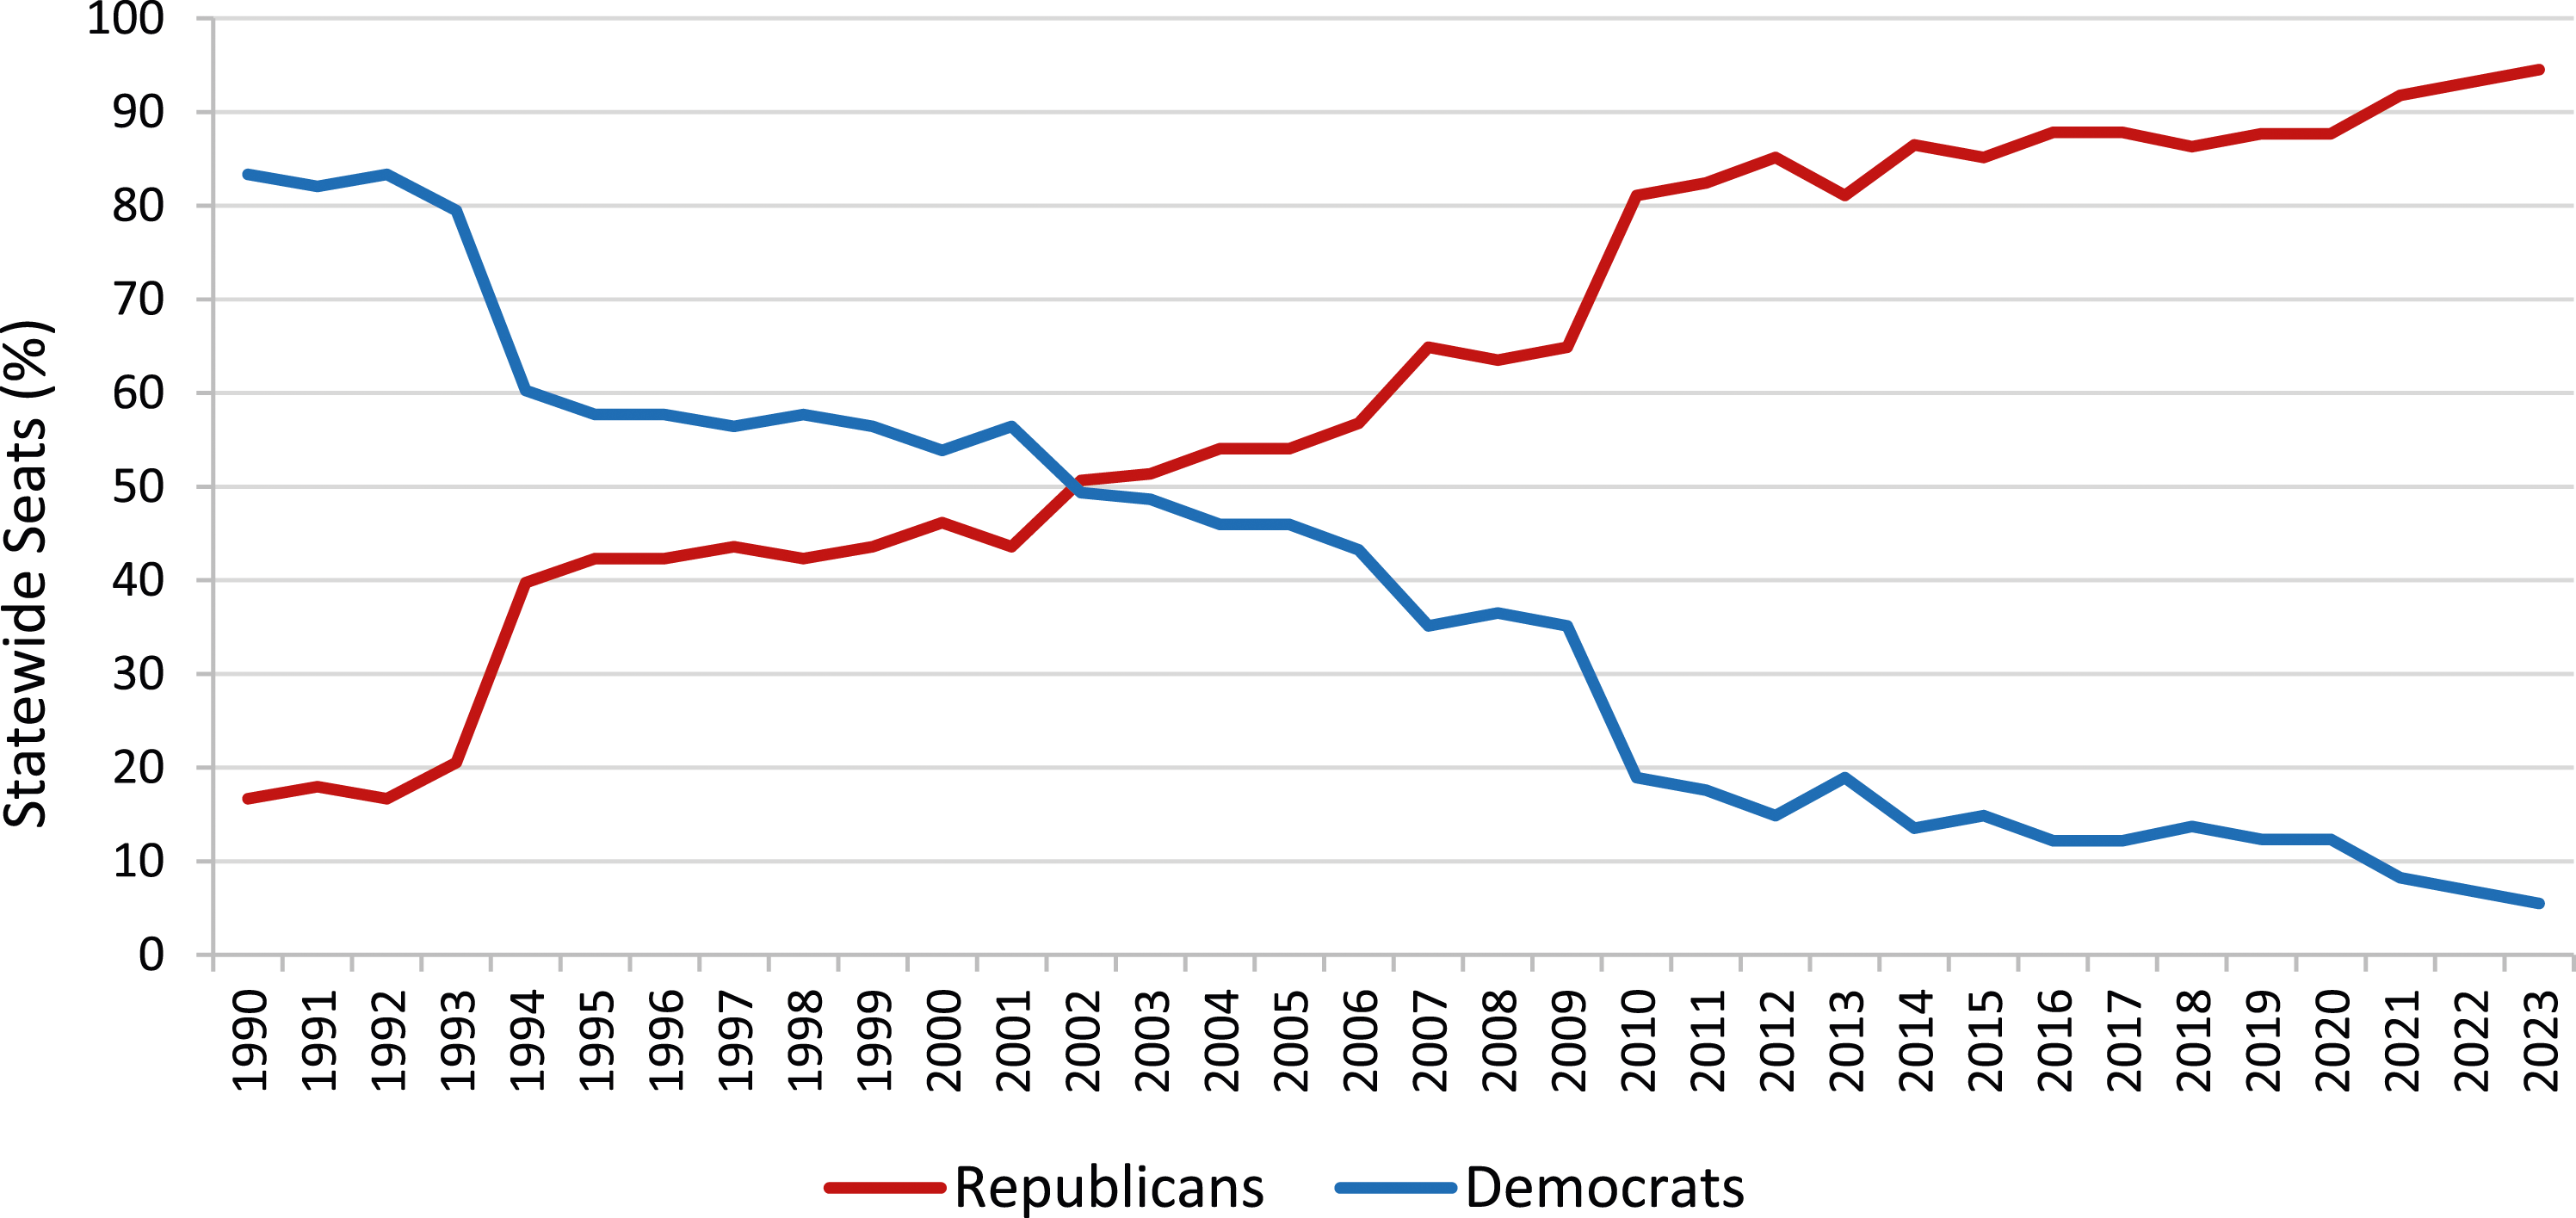
Concluding Thoughts
Just as it took decades for southern Republicans to attain their perch from the top to bottom rungs of the electoral ladder, expect it to take a very long time for southern Democrats to turn the party affiliation balance back in their favor. 21 The principal findings in this study reiterate Republican dominance in contemporary southern politics. In the last several presidential elections, the white electorate has increased their GOP ID, and especially rural white voters who continue realigning to the Republican Party. Black and Hispanic voters have also tilted toward the GOP, albeit modestly to the point of inconsequential in the case of African Americans, but more notably so among Latinos, and particularly those living in Florida and Texas. Finally, white voters are more participatory than their Black and Hispanic neighbors, to the point that their turnout more than offsets their declining share of the southern electorate.
This current state of affairs appears to paint a grim picture of southern Democratic prospects, but most likely not. For instance, the South’s impressive population change and population growth via urbanization (Bullock et al. 2019), migration (Morris 2021), and generational turnover (McKee 2019), all fosters Democratic affiliation. Also, the increase in college-educated voters, and declines in white Protestantism and white rural voters (Hood and McKee 2022b), favors Democratic allegiance. 22 To be sure, these developments can be painfully slow in transforming the political status quo (as was true for southern Republicans from the 1950s to 1980s), but it has already happened in Virginia, and now Georgia seems to be following in the Old Dominion’s footsteps (Bullock 2022c).
Lastly, two more immediate short-term conditions augur favorably for Democrats’ electoral fortunes and nurturing Democratic affiliation. First, the recent Supreme Court ruling in the Alabama case of Allen v. Milligan (2023) upheld enforcement of Section 2 of the Voting Rights Act (for now). This means the Yellowhammer State will redraw its congressional boundaries so that a second district (out of seven total) allows Black voters the opportunity to elect a candidate of their choice (a Democratic candidate should prevail). This decision may cause a ripple effect, increasing Democratic representation in multiple southern states that currently dilute minority representation by packing these voters into as few districts as possible (Edsall 2023). 23
Second, former President Trump has yet to exit the political scene. Although this unique political actor has proven an accelerant for the white rural Republican realignment across the South (Hood and McKee 2022b), Trump is a repellant to otherwise GOP-leaning college-educated white voters residing in urban areas, like Texas’s largest metropolitan centers and greater Atlanta. In fact, it is hard to point to another reason beyond Trump, accounting for the Peach State having two Democratic U.S. senators. In the game of winning close elections, Trump is anathema to swing voters. Black voters are captured by the Democratic Party (Frymer 1999), and rural white voters are now captives of the GOP (Hood and McKee 2022b). 24 This means that in competitive elections and in efforts to grow the major party coalitions, these voters can be ignored, or at least relatively neglected as compared to those up for grabs (e.g., Hispanics and suburbanites). More likely than not, a post-Trump GOP will be stronger in the South. Virginia’s Republican Governor Glenn Youngkin, elected in 2021, comports with this expectation. Hence, it is probably the case that modern southern Republican hegemony is all the more notable in spite of Trump, rather than because of his polarizing presence.
Among the voting electorate, party affiliation has always held the key to who wins elections and thus governs the polity. In American politics, PID is one of the most studied topics—necessarily and rightfully so. Consider that for the entire span of the ANES time series from 1952 to 2020, the percentage of strong partisans reached its highest point in 2020. Nationwide, strong partisans account for 44.2 percent of the American electorate, 43.3 percent in the non-South, and 46.1 percent of southerners. In an age of ideologically, socially, geographically, and emotionally driven partisan polarization (Abramowitz 2022; Iyengar et al. 2019; Mason 2018; Myers 2013), the influence of PID on all things political, has probably never mattered more than it does now.
Supplemental Material
Supplemental Material - Party Affiliation in the Southern Electorate
Supplemental Material for Party Affiliation in the Southern Electorate by Seth C. McKee in Political Research Quarterly
Footnotes
Acknowledgements
The author thanks David Hughes for making him a keynote speaker at the 2023 Southern Studies Conference, which resulted in an early draft of this article.
Declaration of Conflicting Interests
The author(s) declared no potential conflicts of interest with respect to the research, authorship, and/or publication of this article.
Funding
The author(s) received no financial support for the research, authorship, and/or publication of this article.
Supplemental Material
Supplemental material for this article is available online.
Notes
References
Supplementary Material
Please find the following supplemental material available below.
For Open Access articles published under a Creative Commons License, all supplemental material carries the same license as the article it is associated with.
For non-Open Access articles published, all supplemental material carries a non-exclusive license, and permission requests for re-use of supplemental material or any part of supplemental material shall be sent directly to the copyright owner as specified in the copyright notice associated with the article.