
Abstract
We examine if increased salience of partisan competition causes affective polarization in the United States during presidential elections. To do so, we leverage the random and quasi-random timing of survey interviews conducted during election campaigns. We conduct three separate studies. In Study 1, we utilize the 2008 National Annenberg Election Survey (NAES), in which random survey interview timing allows for a credible causal estimate of salience on affective polarization. In Study 2, we employ American National Election Studies (ANES) data from 1980 to 2016, again leveraging survey timing to assess the effect of salience on affective polarization. In Study 3, we examine changes in affective polarization as a result of increasingly salient partisan competition using NAES and ANES panel data from 1980 to 2008. Across the three studies we identify a meaningful increase in affective polarization toward candidates, but not toward parties, as a result of heightened partisan competition.
Leading explanations of affective polarization attribute it to heightened partisan competition (e.g., Iyengar, Sood, and Lelkes 2012, West and Iyengar 2022). However, it is difficult to identify the causal impact of partisan competition on affective polarization using traditional survey-based research methods due to endogeneity threats from reverse causation and unobserved confounders. To overcome this problem, we exploit that the timing of survey interview dates during campaigns is often random or quasi-random.
We assume that political parties seek political power, and we take “partisan competition” to refer to the jockeying for this power that takes place between parties. In democracies, this battle is fought on several fronts, with elections being the key forum. It is through elections and their associated campaigns that parties win or lose the offices that afford them political power.
Our measure of the salience of partisan competition depends on these features of electoral democracy. 1 Electoral competition intensifies as elections approach, as parties are more visibly disputatious in the run-up to elections. This conflict is signaled via their own campaign communications and also through sanctioned inter-party events, most notably debates. The media enthusiastically report on party conflict, making partisan competition more apparent to citizens as elections get closer and the campaign wears on. As such, we measure the salience of partisan competition with the temporal proximity of an upcoming election.
Evidence for the validity of this measurement strategy comes from the comparative politics literature, where the use of the (quasi-)random timing of elections vis-á-vis survey interview dates as a plausibly exogenous measure of the salience of partisan competition was pioneered. As spelled out by Michelitch and Utych (2018, 417), “temporal proximity to group competition, especially high-stakes competition over societal resources...” will lead to increased “in-group cohesion and out-group hostility.” The enhanced communication efforts of parties and candidates during election campaigns help to convey and amplify such competition. Michelitch and Utych (2018) and Singh and Thornton (2019) show that election timing relative to survey interview dates causes changes in partisan attachments in the public. 2 Similarly, Bassan-Nygate and Weiss (2022), Rodríguez, Santamaría, and Miller (2022), and Hernandez, Anduiza, and Rico (2021) find a link between relative election timing and affective polarization in Israel, in Spain, and across countries.
Beyond partisan considerations, scholars of comparative political behavior have successfully leveraged the timing of surveys relative to elections to study ethnic identification (Eifert, Miguel, and Posner 2010), satisfaction with democracy (Higashijima and Kerr Forthcoming; Loveless 2020), and cooperation with surveys and satisficing (Banducci and Stevens 2015). We employ this valuable strategy in the United States, where recent growth in hostility toward out-parties outstrips that seen in other democracies (Gidron, Adams, and Horne 2020), using a multitude of data sets and empirical strategies. 3
With a focus on presidential elections in the United States, we conduct three separate studies. In Study 1, we utilize the 2008 National Annenberg Election Survey (NAES), which is particularly suitable in that interview timing is random and thus not itself determined by affective polarization or related factors. In Study 2, we make use of the American National Election Studies (ANES) from 1980 to 2016. With the ANES data, we take care to adjust for variables related to interview timing and affective polarization, as we cannot treat timing as truly random. We supplement our cross-sectional analyses in Study 3, in which we use panel data to examine changes in affective polarization from the summer—before the campaign starts in earnest—to the fall.
Of course, temporal proximity to an election captures more than the salience of partisan competition. In this sense, as a treatment, election proximity is “bundled” (see Dunning 2012) with other variables that also correlate with timing. These include opportunistic scheduling of elections, economic patterns, and seasonal factors. As we focus on the United States, strategic election timing is not a factor. It is possible that incumbent governments stimulate the economy ahead of elections, but economic comfort should not heighten affective polarization (Gidron, Adams, and Horne 2020). Finally, we have no strong theoretical reason to expect that weather patterns, school calendars, or other seasonal factors should cause affective polarization. 4
Ultimately, we find little evidence that increases in the salience of partisan competition generated by campaigns and forthcoming elections shapes affective polarization toward the parties. However, across all three studies we identify a politically important increase in candidate-based affective polarization as the campaign proceeds. Specifically, we detect an increase of about four points over the course of the fall. To place this result in context, consider that from 1980 to 2016 affective polarization toward candidates has increased by a total of about 25 points. We find little evidence that our findings are driven by changes in specific evaluations of the in- or out-party or candidate.
Our results suggest that affective polarization toward parties is not due primarily to increased levels of competition between the major parties. Instead, our results are consistent with evidence suggesting that heightened salience of competition alone is not a sufficient condition for affective polarization (e.g., Lelkes 2019, Webster and Abramowitz 2017) and that affective polarization does not substantially drop after a campaign concludes (West and Iyengar 2022). Our results indicating little movement in ratings of the parties are also consistent with evidence that voter sentiment is stable over the course of the fall campaign as well as those who conceive of “increasing polarization as a long-term process” (Stoker and Jennings 2008, 619). However, our evidence suggests that campaigns induce affective polarization toward candidates. We discuss reasons for this discrepancy and expand on the implications of our findings in the concluding section, where we also compare our findings to results from studies conducted outside the United States.
Affective polarization, campaigns, and elections
Affective polarization represents “animosity between the parties” (Iyengar et al. 2019, 131) and, in part, an emotional reaction to them (Mason 2016). In a recent study, West and Iyengar (2022, 808) note that a “dominant explanation for increasing levels of affective polarization” is that partisanship increasingly operates as a social identity (as compared to being an indicator of political preferences). As a result, partisanship is associated with elevated positive feelings about one’s own party, often coupled with heightened negative feelings toward the other (e.g., Iyengar, Sood, and Lelkes 2012, Iyengar and Westwood 2015, Mason 2015, Mason 2018).
It is well established that the battle between parties that plays out during presidential campaigns in the United States makes partisan considerations more salient. As Rudolph (2011, 562–563) explains, increased competition serves as a pathway for altering how the parties are evaluated. Panel data from the U.S. show, for example, that following the nominating conventions partisans “changed their perceptions of the two candidates’ in ways that brought liberals and Democrats closer to the Democratic, more liberal candidate while conservatives and Republicans increased their relative affinity for the more conservative Republican” (Miller and Shanks 1982, 332); that ambivalence toward the candidates declines over the course of the campaign (Rudolph 2011); and that one’s internalization of partisanship as a self-identity declines following an election (West and Iyengar 2022). Similarly, panel data from Denmark demonstrates an increase in polarization over the course of the campaign (Hansen and Kosiara-Pedersen 2017).
When a shared national identity is made more salient, affective polarization decreases (Carlin and Love 2018, Levendusky 2018), perhaps suggesting that, when divergent partisan identities are made more salient, the reverse will be true. In line with this, Iyengar et al. (2012, 425–427) demonstrate that campaigns are a potential source of affective polarization. And, there exists substantial evidence that one of the main roles campaigns have is to restore partisanship and increase its relevance (e.g., Campbell 2008, Iyengar and Simon 2000). Nominating conventions, which are partisan events which arouse partisan considerations (e.g., Holbrook 1994), are a particularly important feature of campaigns, though the “bumps” that they provide may fade with time (e.g., Campbell, Cherry, and Wink 1992).
If election campaigns make partisan competition more salient, this suggests that they also increase affective polarization. We examine two observable implications of this. First, as the salience of partisan competition increases over the course of a campaign, people will become more affectively polarized toward parties and candidates. Second, the boost in the salience of partisan competition generated by nominating conventions as well as other campaign events may cause higher levels of affective polarization toward parties and candidates. As such, we test for linear changes over the course of a campaign and also estimate models that allow for a more flexible relationship.
Still, we acknowledge that there is also reason to expect that feelings about the parties and even the candidates will change little over a campaign. For example, Finkel (1993) finds a limited impact of campaigns on the electorate. Likewise, Jacoby (2009) finds that, although the criteria used to evaluate candidates can change during a campaign, opinion change itself is minimal. Kalla and Broockman (2018) demonstrate that persuasion during campaigns is exceedingly rare. These findings are consistent with the earliest studies of voting behavior (e.g., Berelson, Lazarsfeld, and McPhee 1954), which found little change in voter sentiment over the course of the campaign. There is also evidence that elite hostility does not lead to a “general increase in partisan prejudice” (Westwood, Peterson, and Lelkes 2019, 591), and that partisan acrimony is instead a result of ideological divergence and issue positions (Lelkes 2019, Orr and Huber 2020, Rogowski and Sutherland 2016, Webster and Abramowitz 2017). Moreover, theories of polarization tend to focus on long-term trends (e.g., Levendusky 2009, Ridout et al. 2018, Stoker and Jennings 2008). In other words, if the public responds slowly to increasing elite polarization, we might anticipate that affective polarization will be steady within the context of a particular campaign.
We also examine in- and out-party and candidate ratings separately. Existing evidence (e.g., Iyengar et al. 2019) demonstrates that the bulk of the recent increase in affective polarization in the United States has been a result of declining warmth toward the out-party as in-party ratings have remained relatively stable. On the smaller time scale of a fall campaign, this suggests that the salience of partisan competition would share a stronger relationship with out-party ratings.
Extant research has also identified greater polarization toward candidates than parties (Bolsen and Thornton 2021). Particularly relevant is Christenson and Wesiberg’s (2019) argument that candidates themselves are important sources of polarization. Moreover, longstanding theories of vote choice identify candidates as the attitude objects that voters ultimately decide between (Campbell et al. 1960). Thus, if candidate evaluations are more influenced by the salience of competition, we will observe greater polarization toward candidates than parties over the course of the campaign.
Study 1: 2008 National Annenberg Election Survey
In this study, we employ data from the 2008 National Annenberg Election Survey, which is a nationally representative survey conducted online by GfK. For our purposes, the NAES has two useful features. The first has to do with the NAES fieldwork. As stated at the outset, inter-party competition for power heightens with proximity to elections. In the NAES, respondents’ interview dates are randomly assigned within waves (see Johnston 2008). As such, we are able to exogenously measure proximity to elections, and thus the salience of partisan competition, with the timing of one’s survey interview. In turn, we are able to credibly estimate the effect of the salience of partisan competition.
Second, the NAES data set is very large—we are able to include about 17,000 observations in our main analysis. As Levendusky (2018) notes, this provides the statistical power necessary to detect even small effects. Of course, with a data set this large, special care must be given to substantive as well as statistical significance (e.g., Gross 2015, Tufte 1969).
We utilize the fourth wave of the 2008 NAES, which was conducted during the height of that year’s presidential election campaign. Surveys were administered online between August 28th and November 4th. Thus, we have dates ranging from 68 to 0 days before the election, with a median of 35, a mean of 33.5, and a standard deviation of 18.5. Because some early interviews (about 7.7% of our data) coincide with the Democratic and Republican conventions (which occurred during August 25–28 and September 1–4), we test the robustness of our results by excluding those interviewed during this period. 5 The full distribution of dates appears in the online appendix. Our variable, date, is coded so that lower numbers indicate the respondent was interviewed further from the election: it is measured as −1(days from election). 6
NAES respondents rate major party candidates (but not the parties themselves) on feeling thermometers, and we use these ratings to create a measure of affective polarization toward the candidates. We do so by subtracting the rating of the out-party from the in-party as determined by self-reported party identification (Iyengar et al. 2019) and as such focus just on partisan identifiers (including leaners). As the thermometers range from 0 to 100, the affective polarization variable ranges from −100 to 100. The mean of affective polarization is 41.56 with a standard deviation of 37.63. We display the distribution of this variable in the online appendix.
Because the timing of survey dates is random, we are able estimate the causal effect of the salience of partisan competition with bivariate linear regressions in which our dependent variable, affective polarization toward the candidates, is a function of survey interview date. Given our coding, we anticipate that the coefficient for date will be positive. When examining the parties separately, for the in-party our expectations are identical to those just outlined, as ratings should increase over the course of the fall. That is, we anticipate the coefficient for date will be positive. For the out-party, we have the opposite expectations, as ratings are expected to decline, meaning date should have a negative coefficient. As noted, it is also plausible that the conventions themselves increase the salience of partisan competition, which may dissipate before increasing again as the campaign unfolds. To account for this possibility, we present results from nonparametric analyses that relax the assumption of a monotonic increase in affective polarization. 7
Results
Candidate Affective Polarization and Time From the Interview to the Election, 2008 NAES.
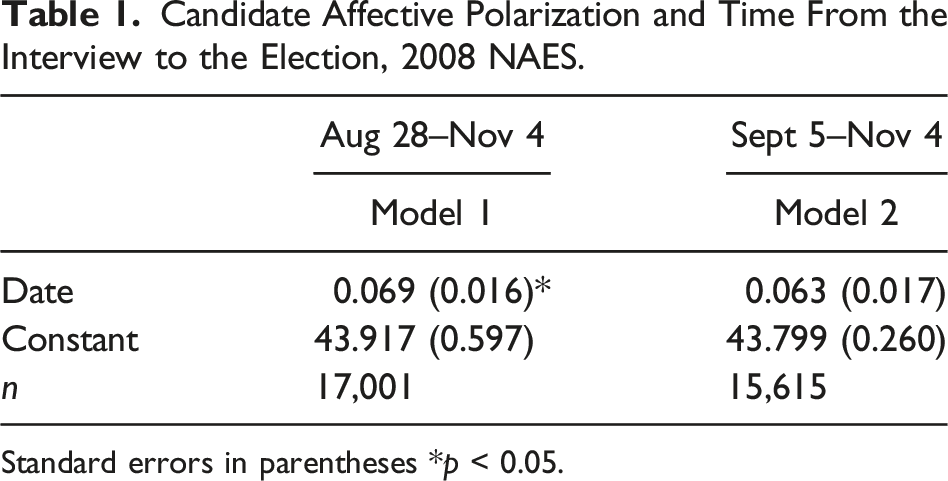
Standard errors in parentheses *p < 0.05.
We next assess the relationship between survey timing and polarization nonparametrically. We plot a LOESS curve with 95% confidence intervals in Figure 1 (we restrict the y-axis to the relevant values and suppress the plotting symbols). The relationship does not appear to deviate dramatically from linearity, and an F-test does not indicate that a more complex functional form better describes the data (p = 0.456). While the nominating conventions might further along the salience of partisan competition, and thus affective polarization, these feelings do not diminish over the course of the fall. Instead, there is a meaningful and statistically significant linear increase in affective polarization toward the candidates as the salience of partisan competition increases over the course of the campaign. The relationship between survey timing and affective polarization. Predictions are a LOESS curve with 95% confidence intervals. Data: 2008 NAES.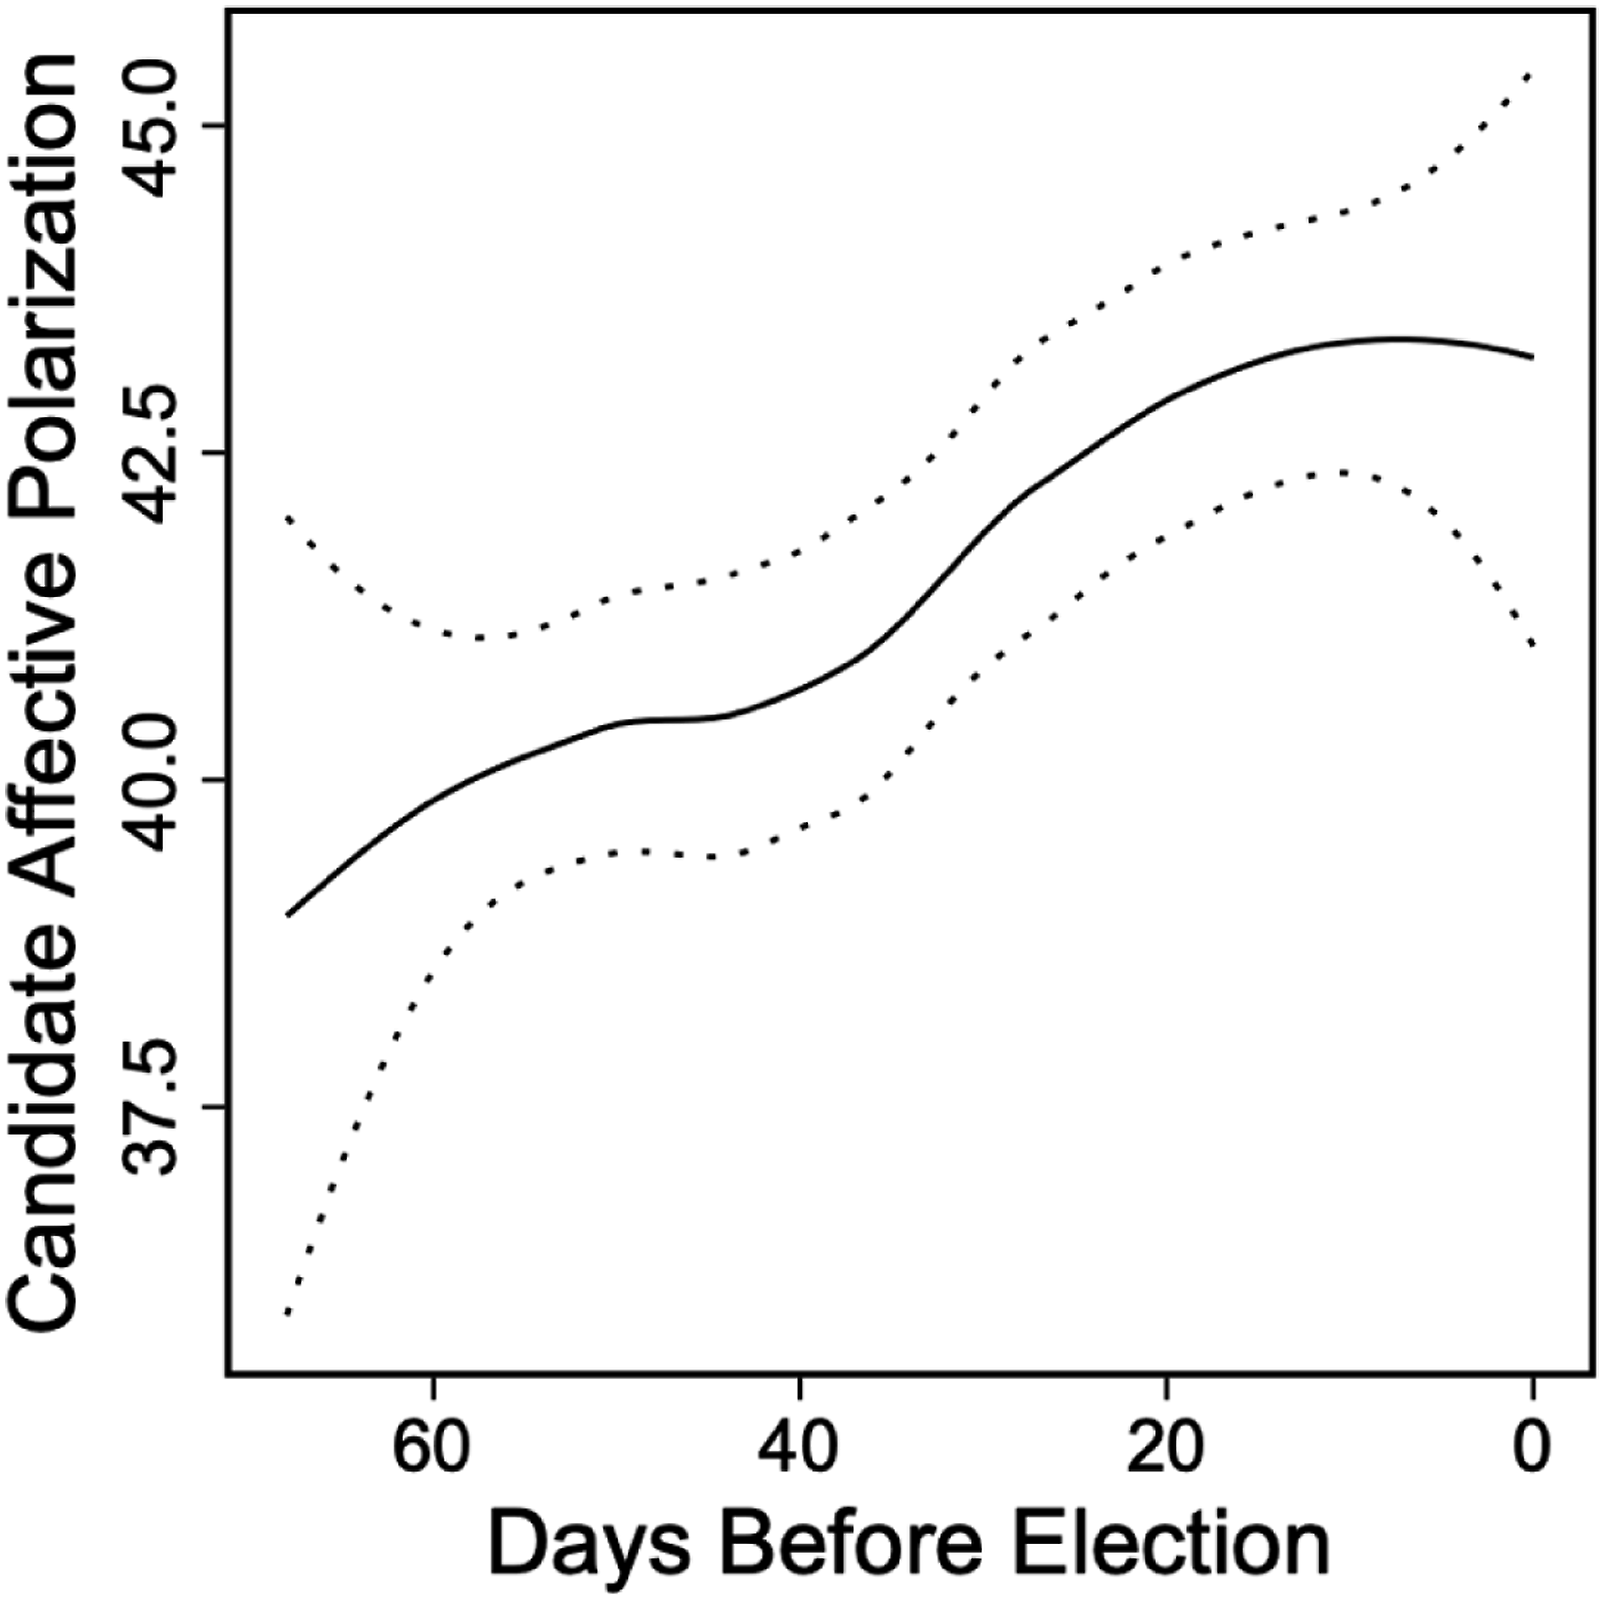
While the dates on which the NAES interviews are administered are randomly selected, we detected very slight imbalances when examining the relationship between survey timing and several demographic variables, as shown in the online appendix. Thus, we re-estimate the models in Table 1 with controls for income, education, age, self-reported participation in political activities, race, marital status, and region. As these covariates are linked to affective polarization, their inclusion also increases the precision of our estimated effects. The estimated coefficients and standard errors are similar to those presented in Table 1. For example, when estimating Model 1 with covariates, we observe a coefficient on date of 0.063 with a standard error of 0.016. Full results, as well as the balance test and information on variable coding, are presented in the online appendix. 8
In- and Out-Candidate Ratings and Time From the Interview to the Election, 2008 NAES.
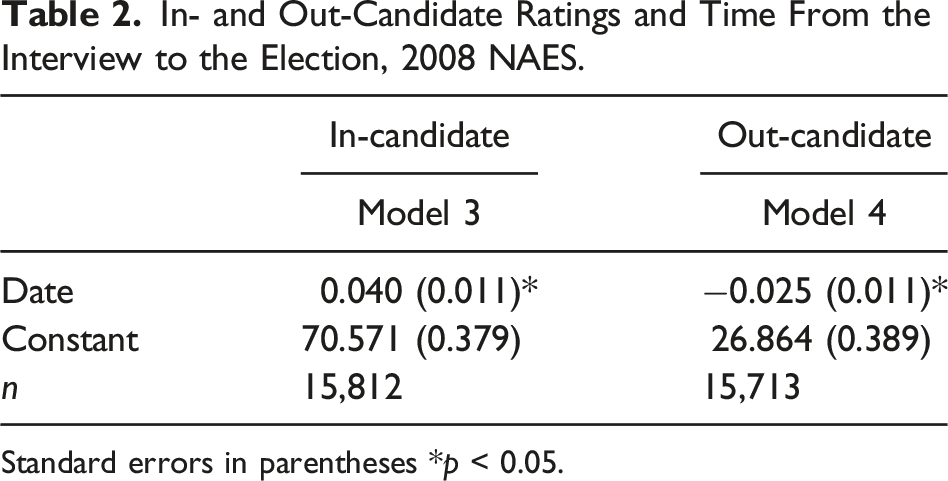
Standard errors in parentheses *p < 0.05.
In summary, there is a detectable effect of the salience of partisan competition on affective polarization toward the candidates over the roughly 2 months of the fall campaign. In Study 2, we expand our analysis to examine feelings toward the parties.
Study 2: American national election studies cumulative file
Partisan competition for power intensifies as elections increase. Accordingly, in this study we again measure the salience of partisan competition with survey timing relative to an upcoming presidential election. We capture affective polarization with questions on pre-election surveys included in the ANES cumulative file. An advantage of the ANES is it allows us to examine both party- and candidate-based affective polarization.
With these data, we are on weaker ground when treating survey timing as random. As such, as we detail below, we take care to adjust for covariate imbalances that may represent a threat to identification. Ultimately, we limit our analysis to data from face-to-face interviews conducted between 1980 and 2016, excluding the 2012 survey. 12 We employ this limitation because an important variable that correlates with survey timing and potentially with affective polarization—the number of times a respondent was contacted before being interviewed—is only available in these years. We examine the robustness of our results by restricting our analysis to 1992 onward, when affective polarization in the public began its upward trajectory. Results—presented in the online appendix—are quite similar to those reported here.
Survey interview timing in the pooled sample ranges from 0 to 63 days before the election (never during the nominating conventions). On average, surveys are completed 32.8 days before the election with a standard deviation of 17.8 and median of 33. Within individual years, the average ranges from about 29 to 36 days. Full distributions for each election year are displayed in the online appendix. As in the previous study, we code survey timing so that lower numbers represent dates further from the election: date = −1(days from election). 13
We again employ the now standard measure of affective polarization, which is the difference in thermometer ratings between a partisan’s rating of his or her in-candidate (party) and out-candidate (party). We therefore again limit our analyses to partisans (including leaners). As in Study 1, our measures of affective polarization range from −100 to 100. In the pooled sample, the mean for candidate affective polarization is 36.34 with a standard deviation of 38.94; for partisan affective polarization, the mean is 35.68 with a standard deviation of 31.29. We display the distribution for both variables for each year included in the analysis in the online appendix.
As noted, we cannot treat the timing of survey interviews as strictly random with these data. Though the ANES is rolled out without regard to individual covariates,
14
given the difficulty of securing face-to-face interviews with potential respondents, some individual level characteristics likely correlate with survey timing. Thus, we examine if an assumption of as-if random timing is appropriate. To do so, using the pooled sample, we estimate a model where the dependent variable is survey timing. We include as predictors the same covariates that we adjusted for in Study 1: income, education, age, participation, race (with dummy variables for Black, Hispanic, and other, with white as the excluded reference category), marital status (with dummy variables for never married, divorced, separated, widowed, with married as the excluded reference category) and region (with dummies for Midwest, South, and West, with the Northeast as the excluded reference category). Additionally, we include the number of times a respondent was contacted before agreeing to be interviewed. Because the number of contacts is right skewed, we take the natural log (we display the full distribution in the online appendix). Details of question wording and coding are included in the online appendix. Results of our balance tests are presented in Figure 2, in which the plotted points represent coefficients with 95% confidence intervals. Balance test of demographic covariates, self-reported participation, and the number of contacts. Horizontal lines indicate 95% confidence intervals.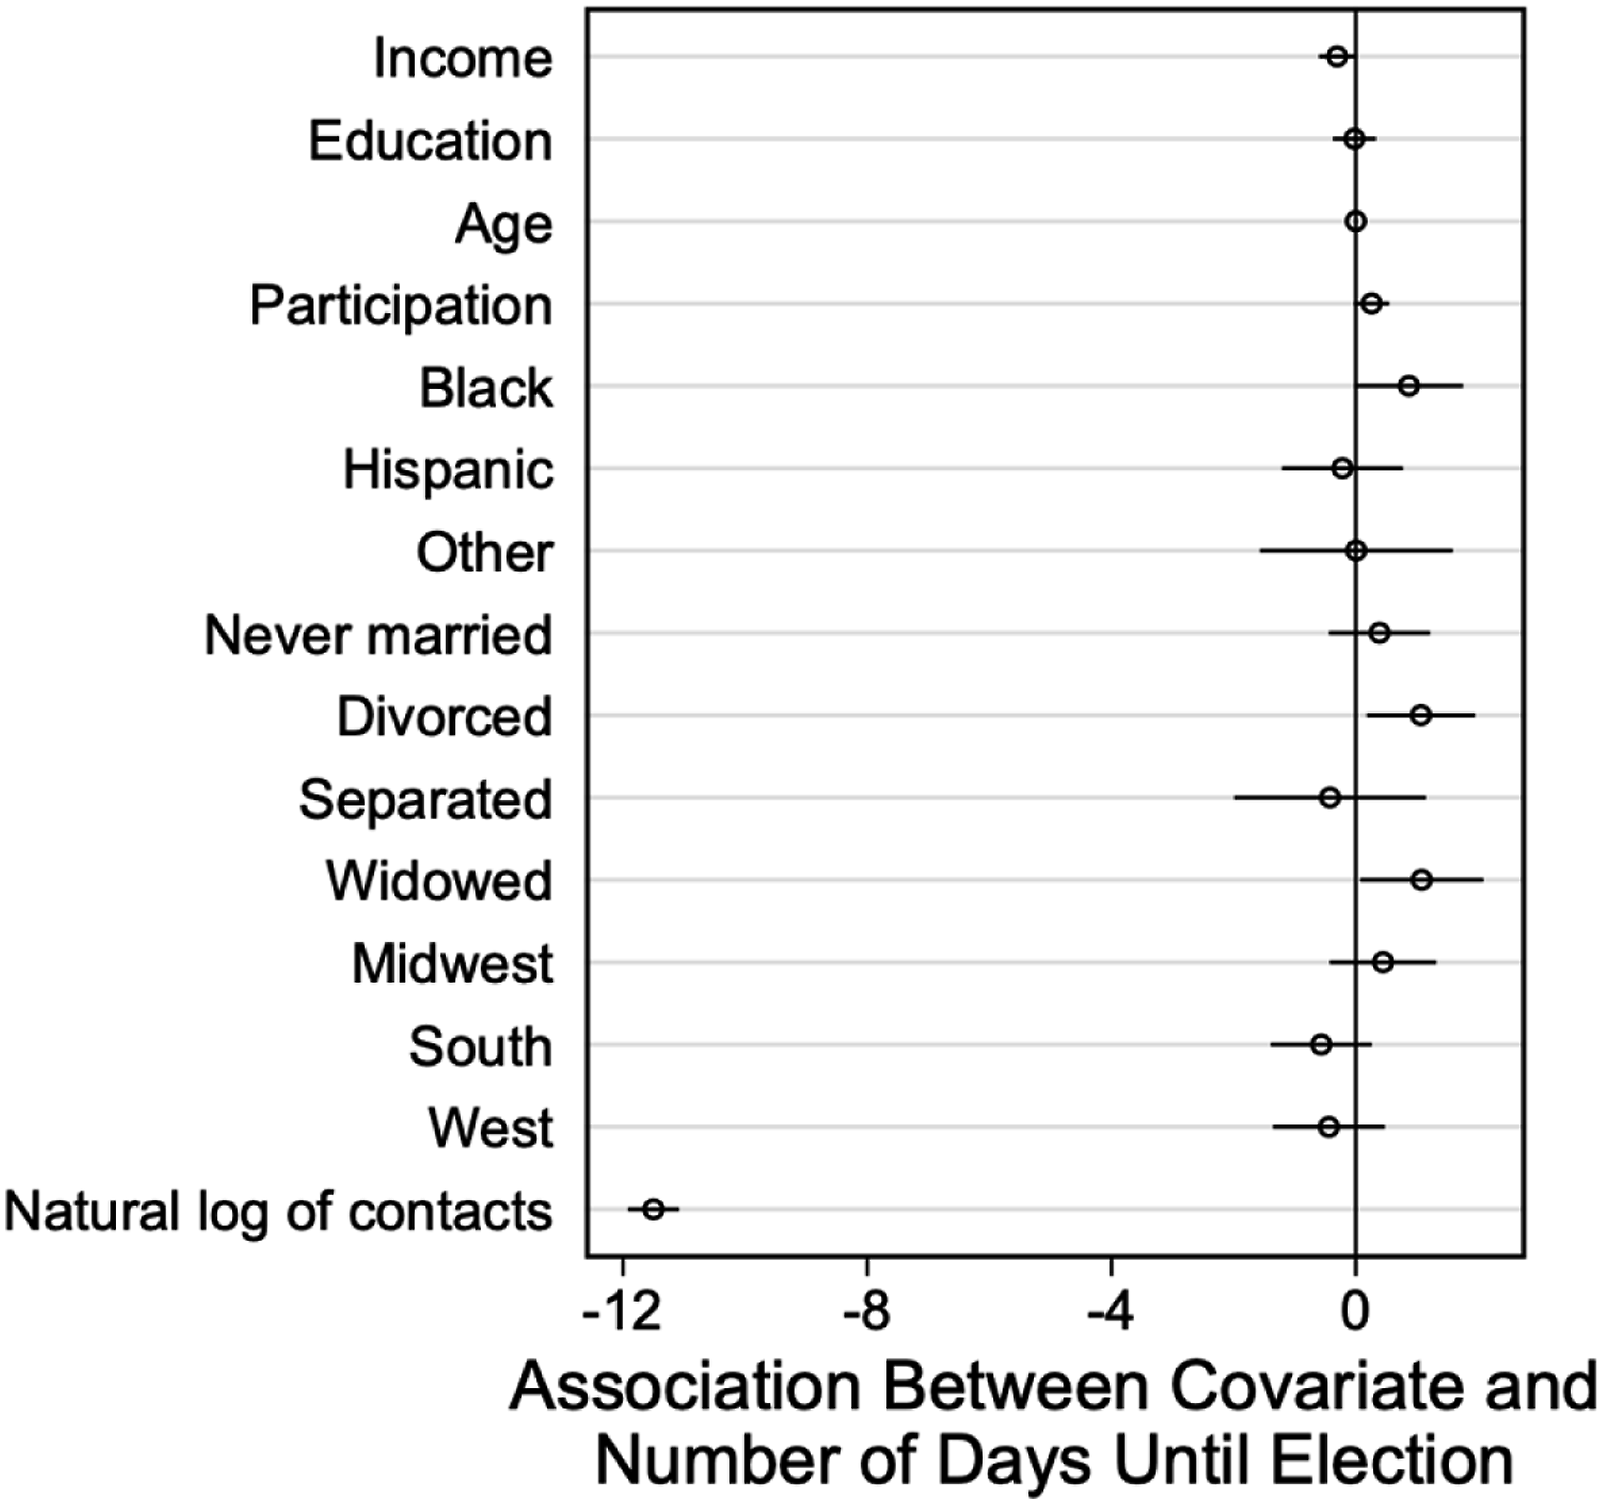
As anticipated, we detect some imbalances. To begin, we observe that both income and marital status are weakly related to survey timing. For example, moving from the lowest income category (0 to 16th percentile) to the top (96th to 100th percentile) is associated with a shift of about 1 day. In terms of marital status, we observe that widows and widowers are interviewed on average about 1 day before married respondents (the reference group), as are divorcés and divorcées.
Perhaps most importantly, we observe a relationship between the number of times a respondent is contacted and survey date. Here, the relationship is meaningful in substantive terms. For example, moving from one contact to ten is associated with a shift of the survey date from 48.7 days before the election to 22.2. If the number of contact attempts is systematically related to affective polarization, this presents a substantial threat to our identification strategy.
Given the detected imbalances, we adjust for all of the covariates displayed in Figure 2. To the extent that the covariates predict affective polarization, doing so also improves the precision with which the coefficients are estimated. As in Study 1, to avoid post-treatment bias, we do not adjust for any variables that may themselves be influenced by the presence of an upcoming election.
Because the data are pooled across multiple years, we estimate a linear multilevel model. We allow for year-specific intercepts and slopes, which helps account for the possibility that the timing of survey fieldwork could systematically vary with affective polarization in the electorate across election years. We note that results are robust to the inclusion of year-fixed effects, as shown in the online appendix. Given our coding, if the salience of partisan competition increases affective polarization, the coefficient for date should be positive.
Nominating conventions are generally held in July or August. 15 In all cases, the ANES was fielded after the conventions. Because conventions (and other campaign events) might influence levels of polarization, similar to Study 1 we estimate a nonparametric model to examine the functional form between survey timing and affective polarization. In this case, we estimate a generalized additive model (GAM) in which we allow for a flexible relationship between the two variables while controlling for an identical set of covariates as in the linear model. The model is fitted with splines, and we restrict all other covariates to a linear specification. 16
As in Study 1, we disaggregate our measures of affective polarization to examine ratings of the parties and candidates separately. Our expectations are identical to those in Study 1. For the in-party (and its candidate) the coefficient for date should be positive, and for the out-party (and candidate) we anticipate a negative coefficient for date.
Results
Affective Polarization and Time From the Interview to the Election, Multilevel Model Estimations, 1980–2008, 2016 ANES.
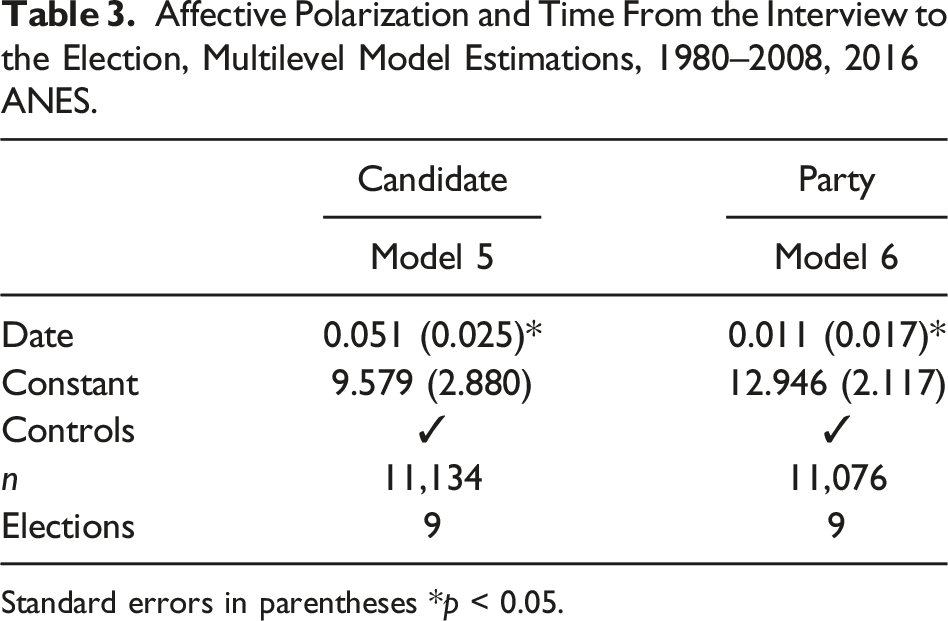
Standard errors in parentheses *p < 0.05.
We find little evidence that survey timing is related to levels of affective polarization toward the parties. The coefficient for date in Model 6 is not significant (p = 0.533) and is associated with an increase of only 0.693 units moving from the earliest to the latest survey dates. The linear specification for both models in Table 3 is appropriate: a GAM estimation does not improve fit for either Model 5 (p = 0.456) or Model 6 (p = 0.339). We present predicted values from the GAM models in Figure 3. The relationship between survey timing and affective polarization. Predicted values (which are mean-centered) from GAMs with 95% confidence intervals. Data: 1980–2008, 2016 ANES.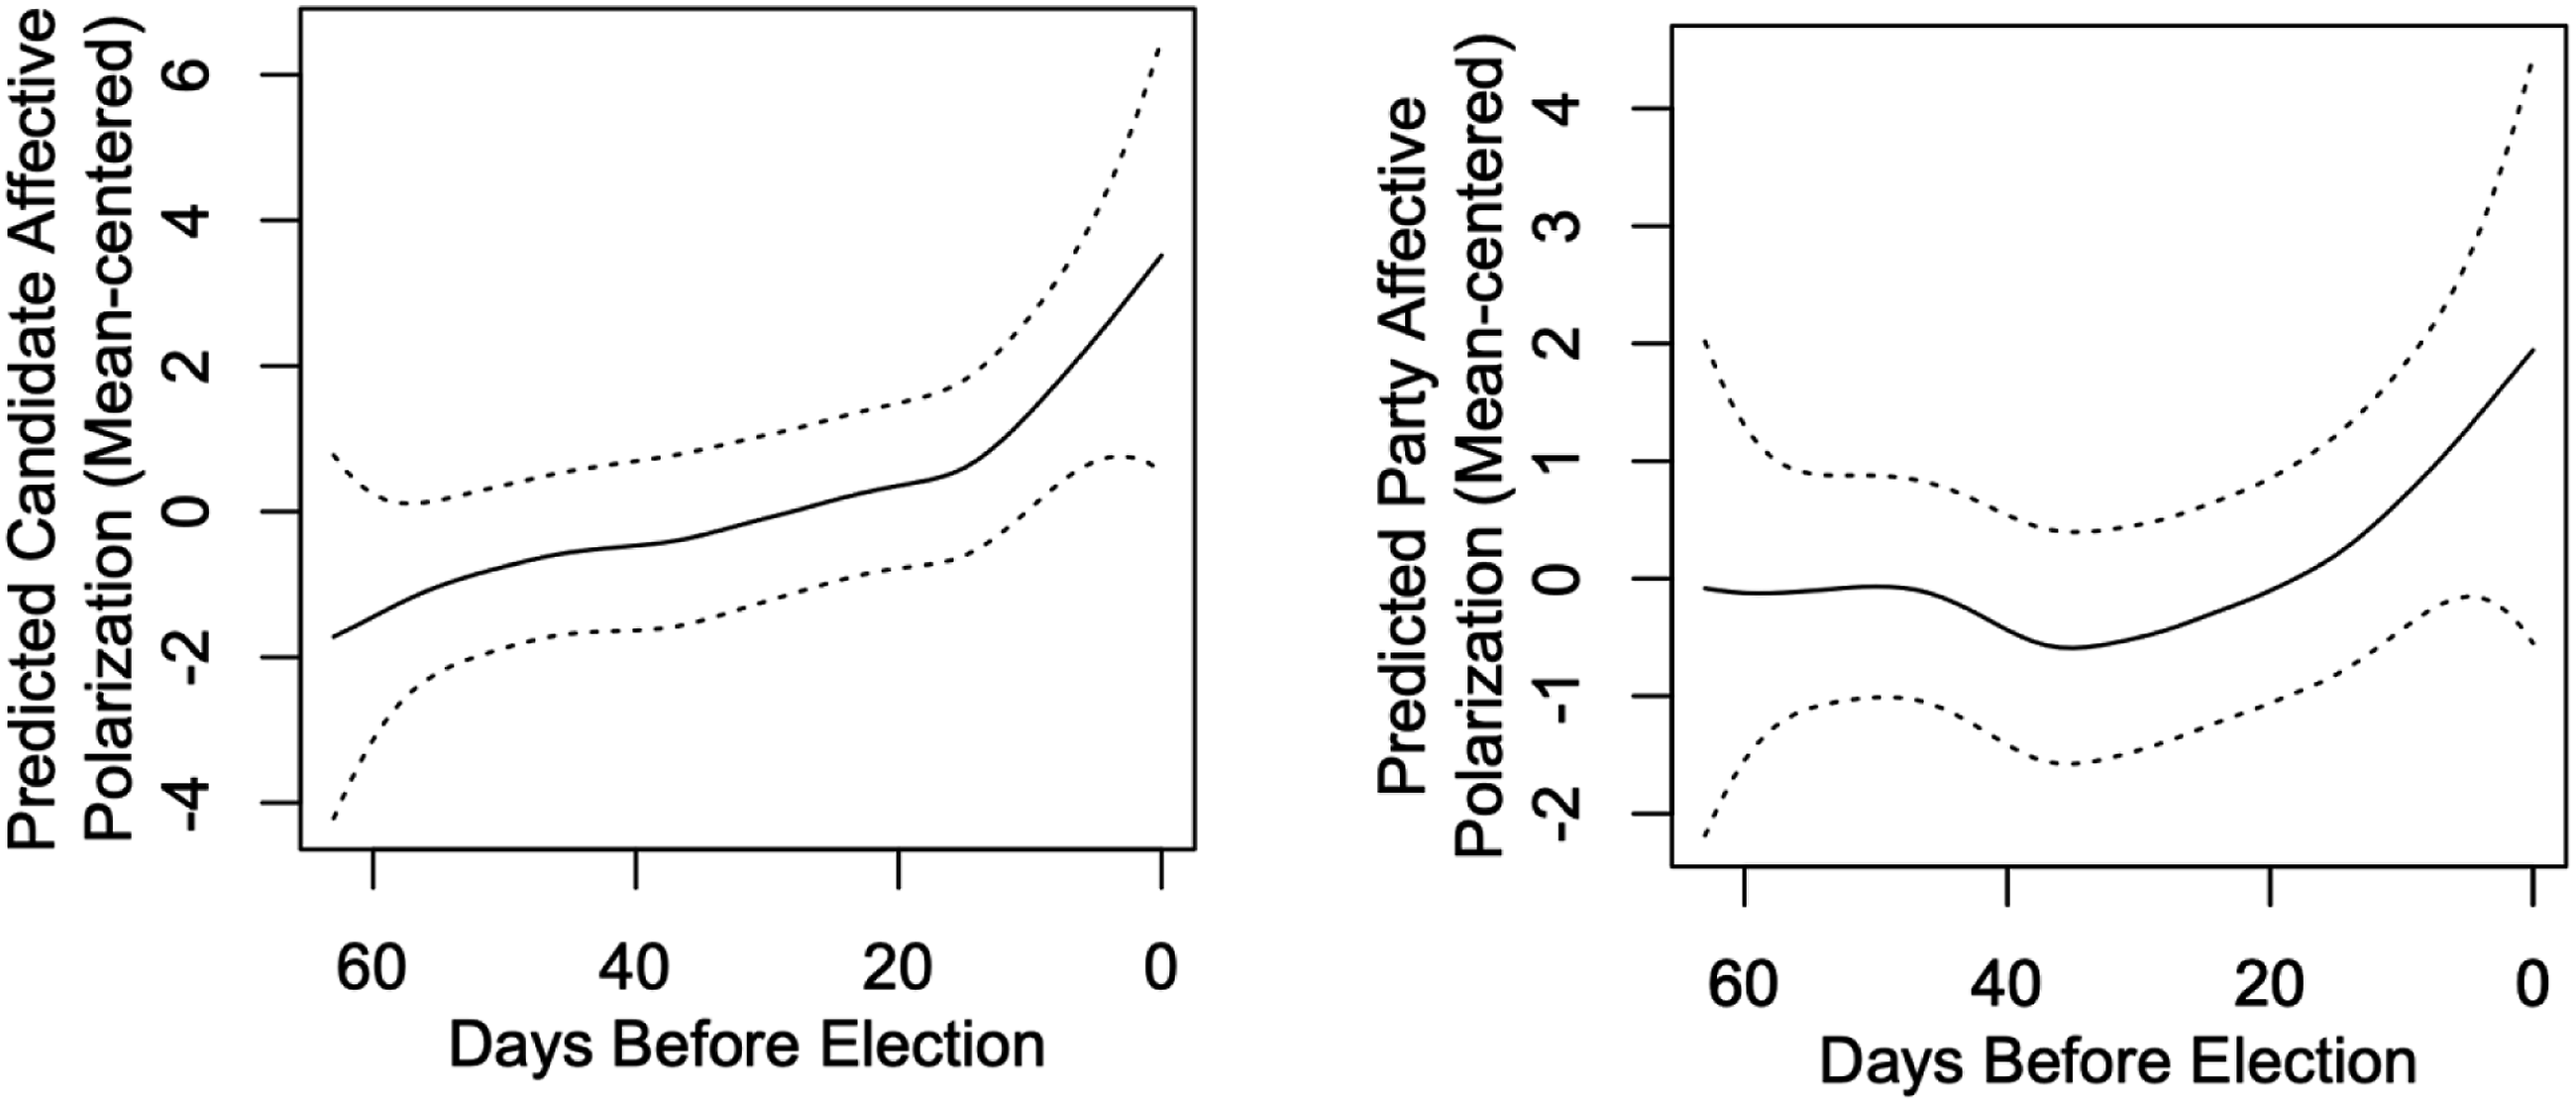
In- and Out-Party and Candidate Ratings and Time From the Interview to the Election, 1980–2008, 2016 ANES.
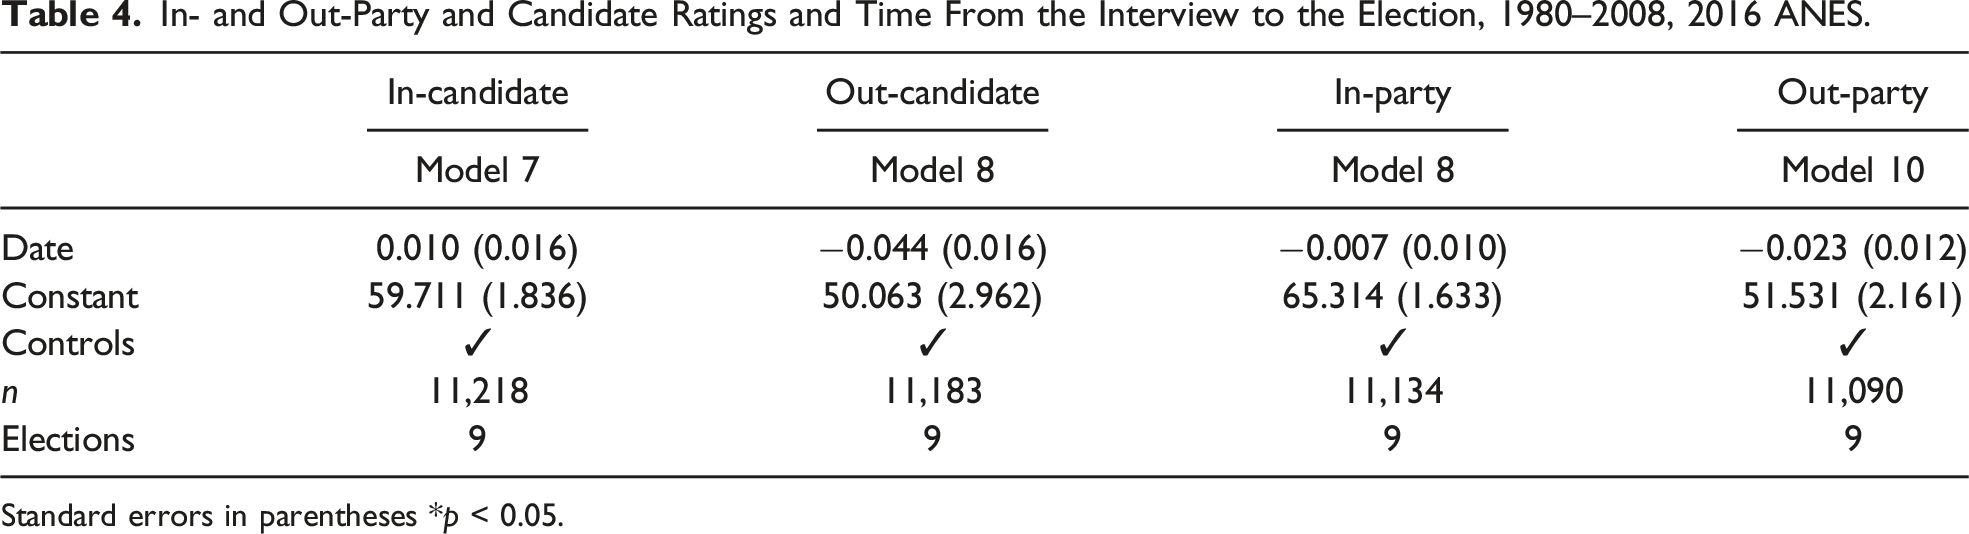
Standard errors in parentheses *p < 0.05.
Moving to ratings of the parties, we find no evidence that survey timing is related to ratings of either one’s own (p = 0.516) or the opposition (p = 0.066) party. However, the more flexible GAM does indicate that ratings of the in-party vary over the course of the campaign (p = 0.037): ratings decrease in the month following the conventions before increasing as the election nears. The nonparametric model does not better represent the data for Model 10 (p = 0.721). Full results of these analyses are presented in the online appendix.
Considering the results from Study 1 and Study 2 together, we identify a consequential increase in affective polarization toward the candidates as the salience of partisan competition increases over the duration of the convention-to-election period. The ANES data indicate, however, that there is no similar polarization of feelings toward the parties. We next expand the timeframe we consider, using panel data to compare affective polarization in the summer and fall.
Study 3: 1980 and 2008 panel data
Up to this point, working under the assumption that partisan competition for power intensifies as elections increase, we have examined data collected during the height of the fall campaign. While some evidence indicates that voter sentiment changes over this time period (e.g., Hillygus and Jackman 2003, Hmielowski et al. York 2020, Wlezien and Erikson 2002), the short duration of pre-election fieldwork, which could limit variance in the salience of partisan competition, may be biasing results downward. To gauge changes over a longer period preceding presidential elections, we turn to data from the 1980 ANES Major Panel Study, the 2008–9 ANES Panel Study, and, again, the 2008 NAES. Our approach to analyzing these data is straightforward. We calculate the average level of polarization toward candidates,
The 1980 panel data is the only ANES study that contains feeling thermometers over the course of a single campaign. 1980 is a stringent test, as polarization at the elite level was relatively low—that is, if we uncover effects here, we can be confident that the pattern is a general phenomenon and not restricted to only the polarized era. Respondents surveyed for the 1980 ANES Major Panel Study were asked to rate the parties and candidates in three waves. 20 Interviews took place in late January and early February, in early June to mid-July, and in September and early October. Because the nominees were unknown in January, we focus on the summer and fall waves. We use the same measure of affective polarization as in Studies 1 and 2, which again ranges from −100 to 100. When examining parties and candidates separately, our measures range from 0 to 100.
The 2008–9 ANES Panel Study does not contain feeling thermometers. However, it does include items that can be used as proxies for affective polarization. Respondents are asked if, and how much, they like or dislike the parties and candidates, resulting in a seven-point scale that ranges from disliking a great deal to liking a great deal. We measure affective polarization by subtracting the out-party (and its candidate) rating from the in-party (and its candidate) rating. The resulting variables range from −6 to 6. These items were included in the June (Wave 6) and the September (Wave 9) waves. When examining parties and candidates separately, our measures range from one to seven.
For the NAES data, as with the 1980 ANES panel data, we focus on only the summer and fall to measure candidate affective polarization, as the primaries were not completed until June 3rd. As in Study 1, we utilize Wave 4. We additionally employ Wave 3, which was administered in the spring and summer (from April 2 through August 29). We restrict our analysis to those respondents who were interviewed after John McCain and Barack Obama were the clear nominees (June 3rd). Our measure of candidate affective polarization is the same as in Studies 1 and 2. As with the ANES data, when examining the candidates separately, our measures range from 0 to 100.
Results
Starting with the 1980 data, for polarization toward candidates we observe an increase from 18.42 in Wave 2 to 21.46 from the summer to the fall, a change of 3.04 units. We reject the null hypothesis that
Turning to the 2008 ANES data, we observe that party-based affective polarization is unchanged from June to September (p = 0.923). Candidate bias, though, exhibits an increase: from 1.924 to 2.164, a change of 0.24 points, and we reject the null hypothesis that
Finally, we examine the 2008 NAES panel data and find that candidate affective polarization increases from 31.304 to 38.178 from the summer to the fall, a change of 6.874 units. As before, we reject the null hypothesis of no change from the fall to the summer (p < 0.001). We summarize these results in Figure 4, where we plot the average level of affective polarization for each wave (in the figure, we recode each variable so that the maximum value is 1 and the minimum −1 for ease of comparison). Average level of affective polarization toward candidates and parties from two waves of the 1980 ANES Major Panel Study, two waves of the 2008–9 ANES Panel Study, and two waves of the 2008 NAES. Variables recoded to range from −1 to 1. Vertical lines indicate 95% confidence intervals.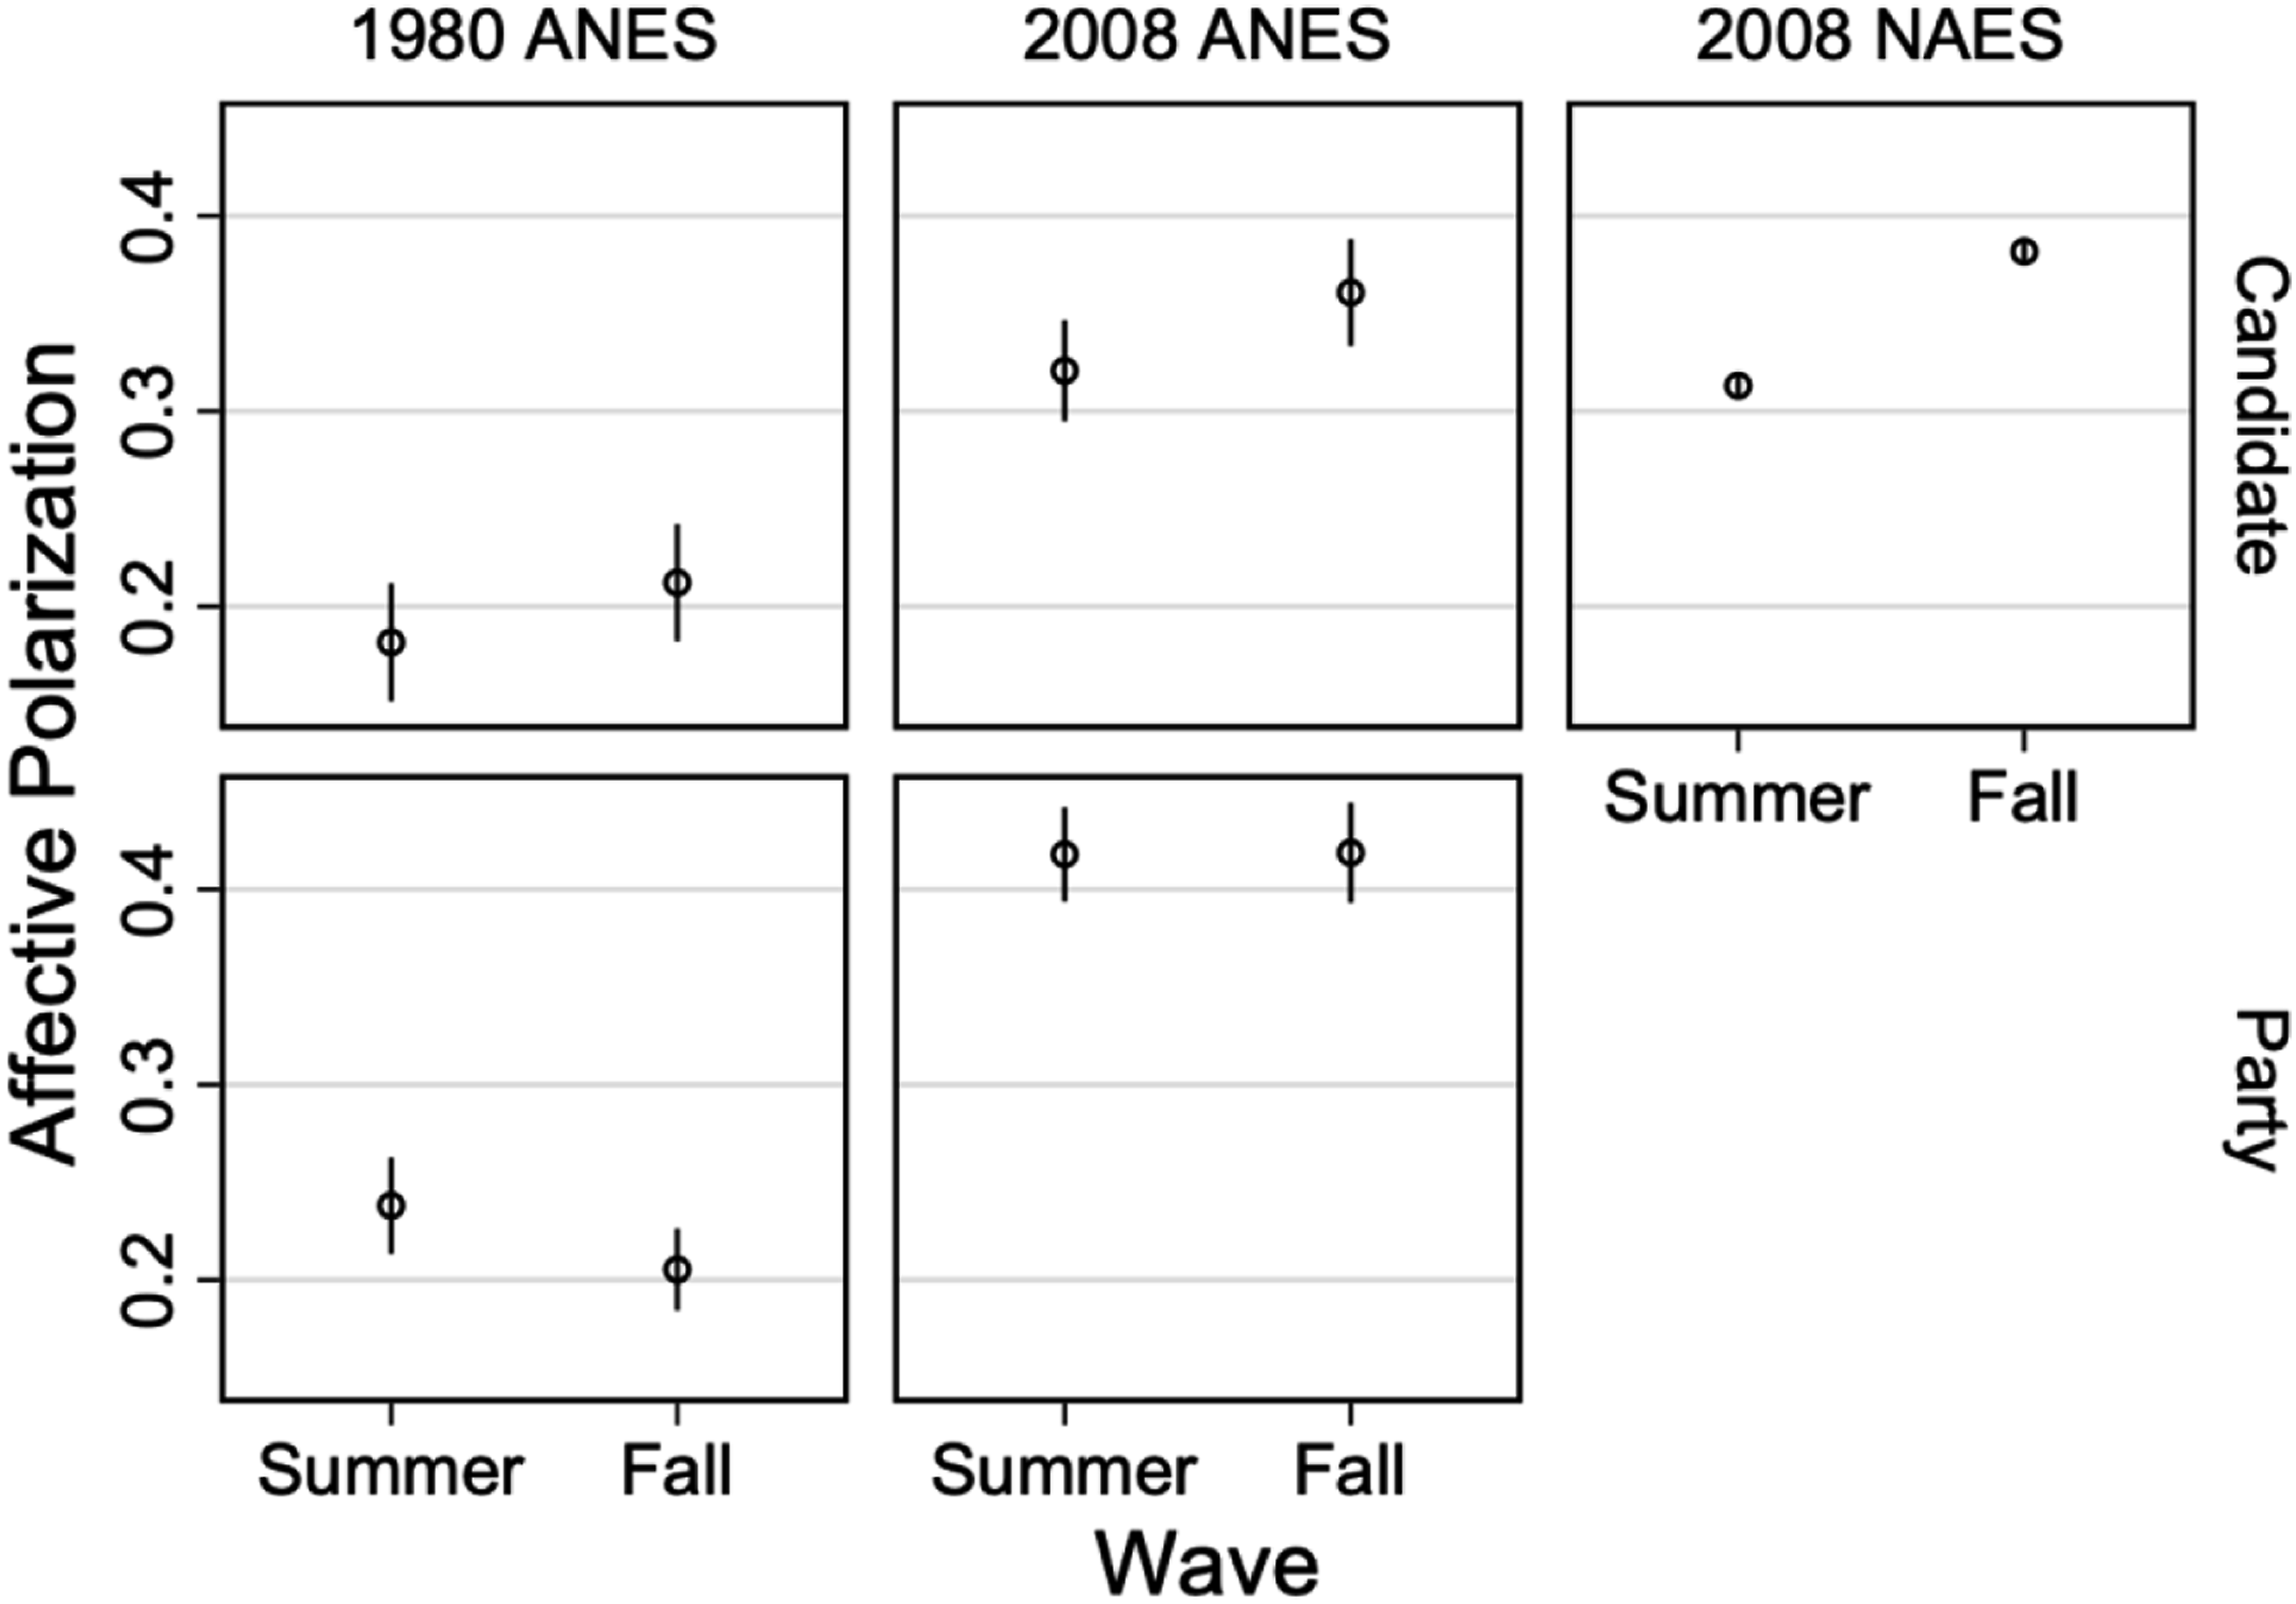
When examining the candidates separately, in 1980 we find that ratings polarize due to an increase in ratings of the in-party candidate—an increase of 2.230 units (p = 0.002); while the change, about −0.858, in ratings of the out-party candidate is indistinguishable from zero (p = 0.392). 21 In the 2008 ANES we find that ratings of both the in- (0.330, p < 0.001) and out-party (0.090, p = 0.020) candidate increase although the increase in the in-party is larger. 22 Conversely results from the 2008 NAES suggest that how one measures affective polarization may influence conclusions, as ratings of the in-party candidate increase by 5.801 units (p < 0.001) while those of the out-party candidate decrease by 1.042 units (p < 0.001). 23
Turning to the parties, consistent with Figure 4, we observe depolarization in 1980 as the in-party is rated less favorably, a shift of −2.364 units (p < 0.001). Ratings of the out-party increased by an average of 0.652—indistinguishable from zero (p = 0.370)—moving from the summer to the fall.
24
The 2008 ANES data indicate no change in ratings of either the in- (0.030, p = 0.391) or out-party (0.025, p = 0.485). We summarize these results in Figure 5, where we recode the measures to range from zero to one to aid in comparisons. Average in- and out-party and candidate ratings from two waves of the 1980 ANES Major Panel Study, two waves of the 2008–9 ANES Panel Study, and two waves of the 2008 NAES. Variables recoded to range from zero to one. Vertical lines indicate 95% confidence intervals.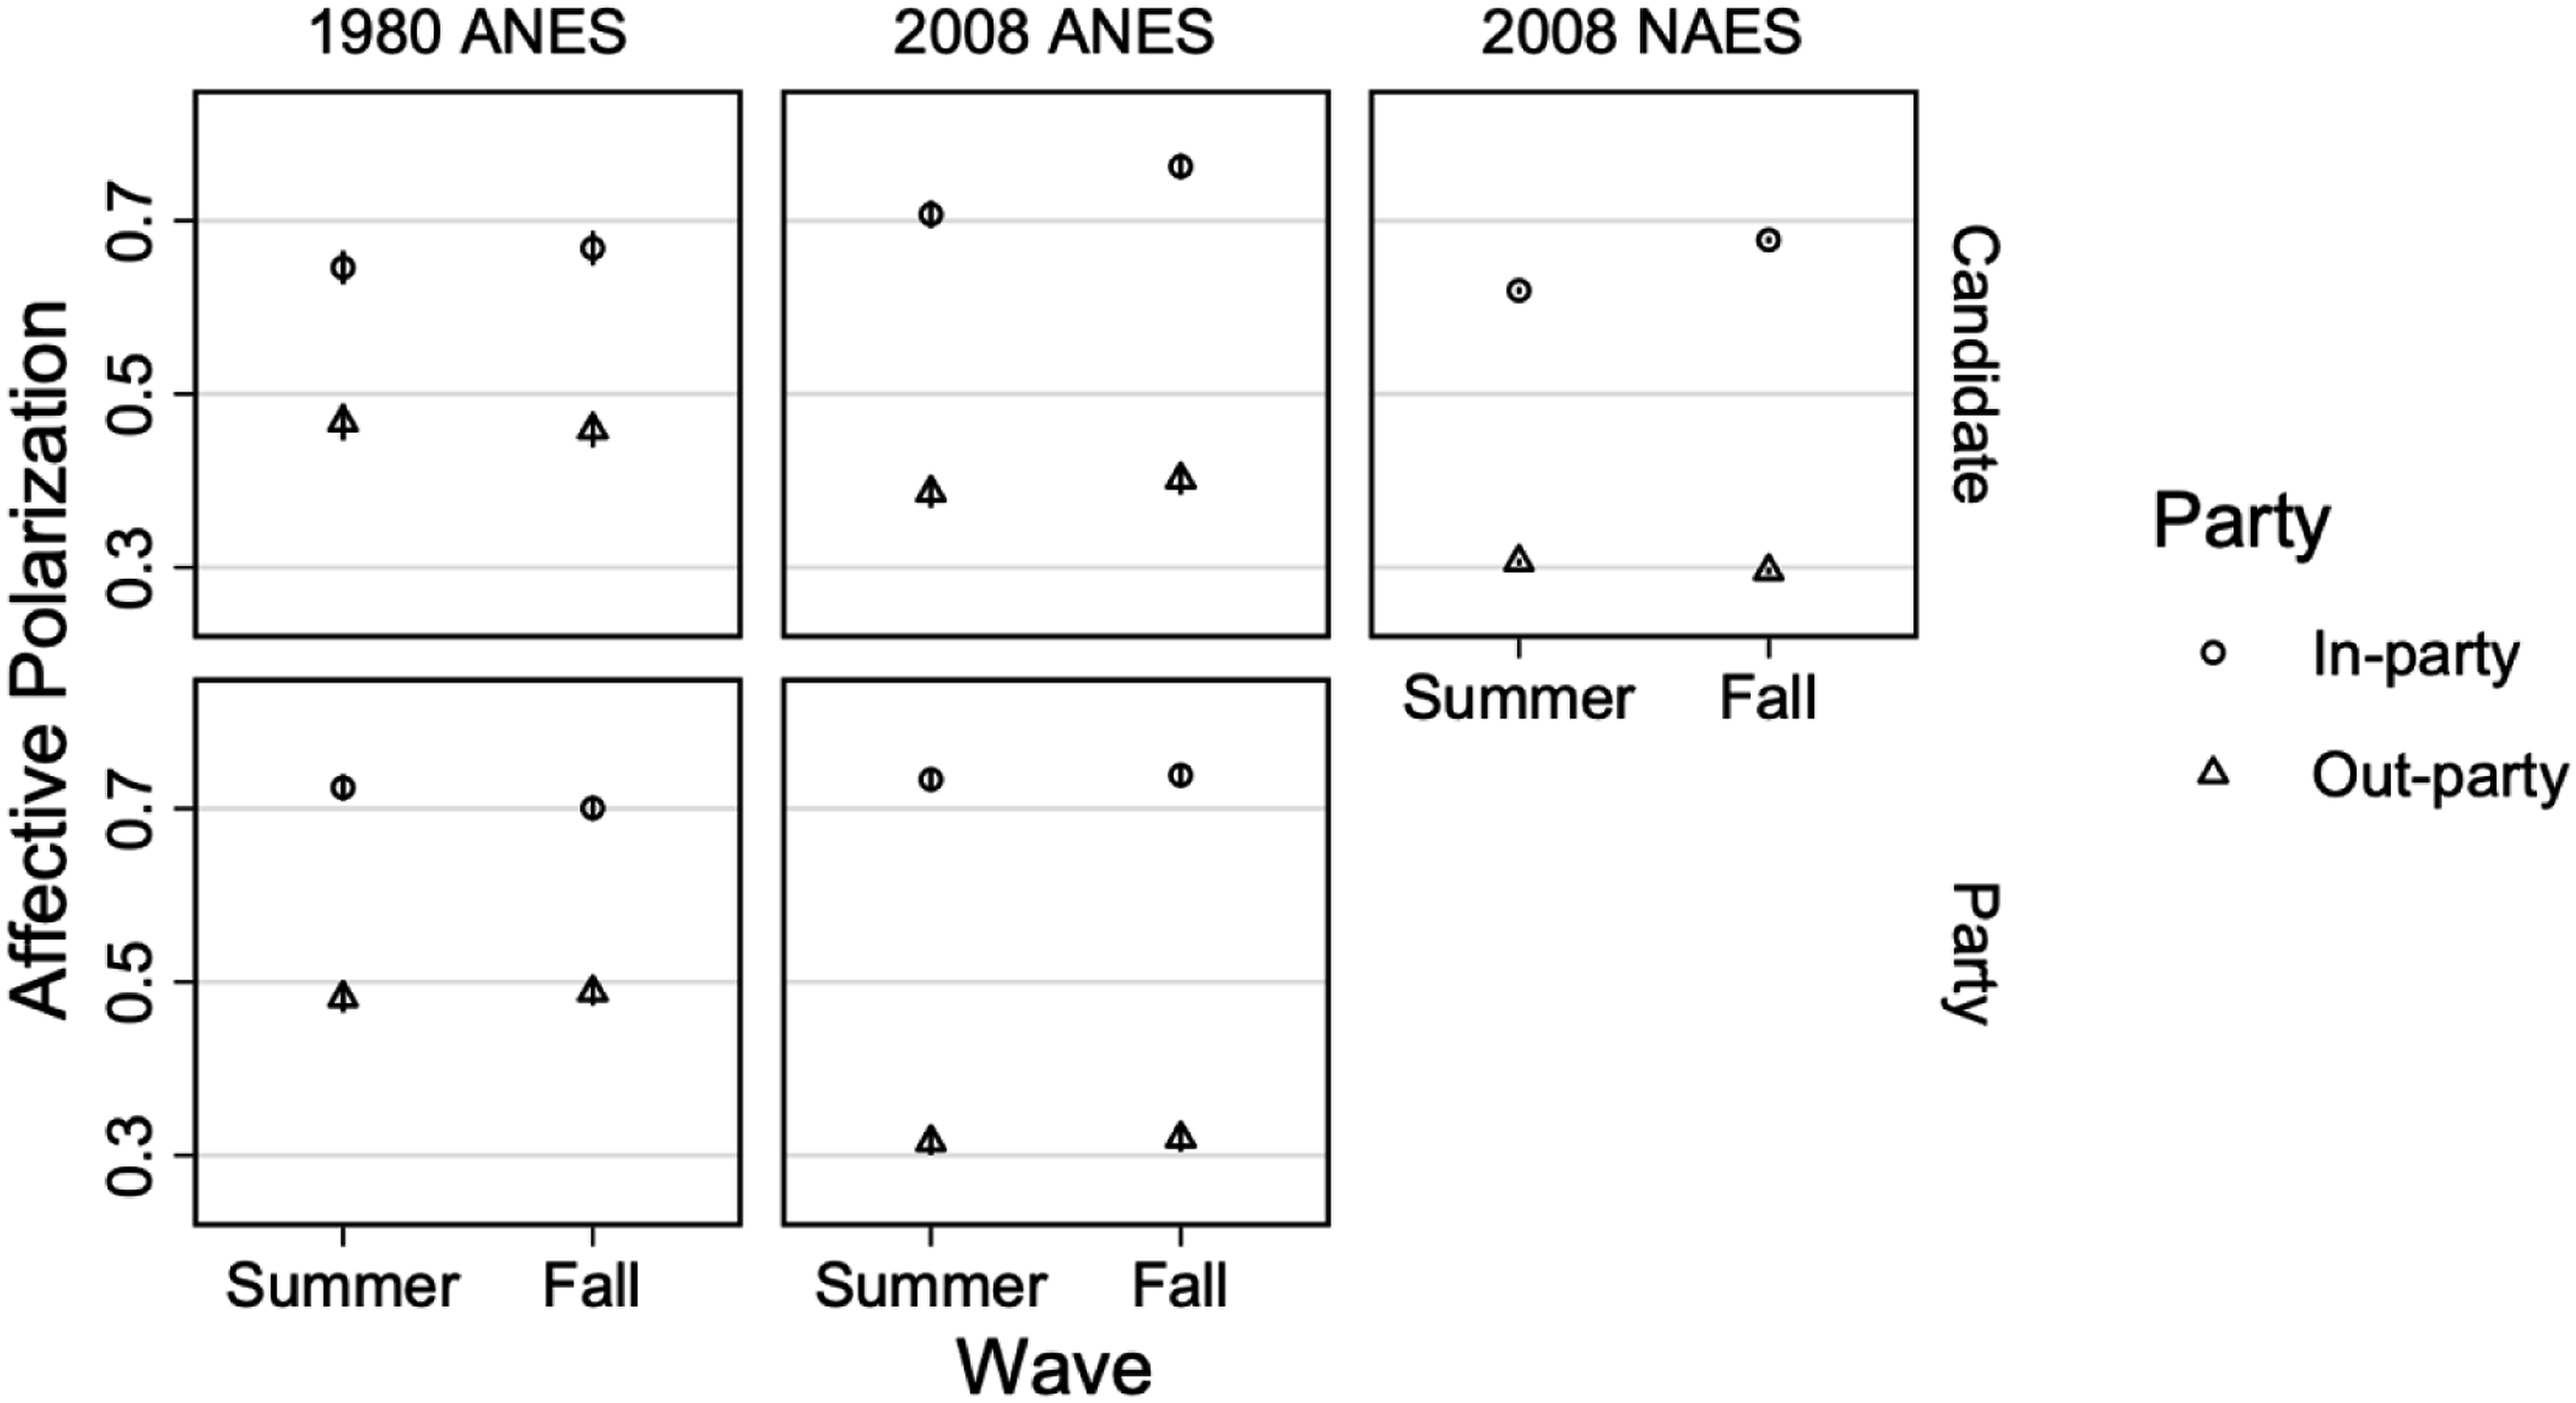
Results from the analyses of the panel data are consistent with the cross-sectional results. We find no evidence that party-based affective polarization increases over the duration of a campaign. However, we detect a meaningful increase in affective polarization toward candidates across three panel data sets.
Conclusion
We examine whether affective polarization is driven by heightened partisan competition. To do so, we take advantage of the fact that the salience of partisan competition increases during election campaigns. In three separate studies, we use the random or quasi-random timing of respondents’ survey interviews relative to nominating conventions and the day of the election to create an exogenous measure of the salience of partisan competition. We identify a meaningful increase of candidate-based affective polarization over the duration of a campaign, but no change in party-based polarization.
Our findings do not challenge the claim that partisanship is more relevant today than it was decades ago, and that this helps explain, in part, increased levels of partisan acrimony and all that it entails. Nor do our results necessarily conflict with evidence that certain campaign strategies may increase polarization among segments of the electorate (e.g., Webster and Abramowitz 2017). However, our results are not consistent with the proposition that heightened partisan competition in the form of an election causes substantive increases in affective polarization toward parties. It does, however, cause affective polarization toward candidates to rise notably.
Why might partisan competition in the United States increase affective polarization toward candidates but not parties? We have three potential explanations. The first relates to the information campaigns actually provide about stances on political issues. Parties’ core positions are more stable over time than those associated with a particular candidate, and campaigns thereby highlight the issue positions of the competing candidates without necessarily providing new information to voters about party platforms. Another way to consider this is that parties are known commodities in ways that candidates are not—there is more to learn about candidates than parties during the campaign. This means that it is more likely for candidate than partisan affective polarization to respond to campaign competition.
Second, campaigns may induce affective polarization toward candidates by triggering divisive matters of identity. Campaigns highlight personal characteristics and attributes related to honesty, wealth, religion, sexuality and relationships, race, ethnicity, and gender. Accentuation of these personal qualities, which may cause voters to evaluate candidates through the lens of identity, can alter evaluations of candidates without necessarily reshaping attitudes toward the parties.
Our third explanation is institutional. Presidential democracy elevates presidents and candidates for the presidency to a pedestal well above any other national politician. Linz’s (1990, 53) famous essay on presidentialism speaks of the “aura” that surrounds the presidency. It thus follows that affective polarization toward presidential candidates will respond more sharply to the dynamics of contests for the presidency than will affective polarization toward parties, consistent with existing evidence of greater polarization toward the candidates (e.g., Bolsen and Thornton 2021, Christenson and Weisberg 2019) at least in the United States (Reiljan et al. 2023).
If this supposition is true, we should observe more evidence of increasing affective polarization toward parties during campaigns in parliamentary democracies, where chief executives are not directly elected and the paramount goal of most major parties is to secure a legislative majority. We might expect the sharpest increases in party-based affective polarization in parliamentary systems that use closed party lists, which are known to depersonalize politics and heighten the importance of party reputations (Carey and Shugart 1995). Israel is one such country, and its extremely high district magnitude should further lead to parties, rather than candidates, dominating campaign politics (Carey and Shugart 1995, 431). 25 Bassan-Nygate and Weiss (2022) indeed find a significant positive effect of exposure to campaigns on affective polarization toward parties in Israel.
Still, it is important to recognize that, while Israeli politics may be less personalistic than those of a presidential system such as the United States, Israel is among the most personalized parliamentary systems (Balmas et al. 2014, Rahat and Kenig 2018). As such, we may also look to Spain, which, like Israel, combines parliamentarism, closed lists, and high, if varied, district magnitude. 26 Rodríguez, Santamaría, and Miller (2022) uncover a pattern in Spain similar to what Bassan-Nygate and Weiss (2022) find in Israel: election campaigns heighten partisan affective polarization. More broadly, we anticipate that the effect of campaign competition on party- and candidate-based affective polarization may be conditional on democratic and electoral institutions, and we leave tests of this expectation to subsequent, cross-national investigations.
We conclude by noting that, as scholars of affective polarization have turned to questions of measurement (e.g., Druckman and Levendusky 2019), there is reason to wonder if our results also generalize to other measures of partisan hostility. Sheffer (2020), examining results from a dictator game played by a sample of Canadians, finds a decrease in discrimination of out-partisans only 2 days after an election. It is possible that such behavioral measures vary more than attitudinal measures relative to elections. Or, it could be the case that the temporal change in partisan salience in the post-election period is sharper than what is observed during the pre-election period that we observe. Along these lines, Hernandez et al. (2021), in a cross-country study, find a statistically significant but small decrease in affective polarization toward parties following elections—although they note the precise pattern depends on ideological polarization. Perhaps the United States, with its frequent elections and seemingly constant campaigns, is the sort of environment where we would least anticipate partisan acrimony to fade after an election. Examining the extent to which the results we have presented extend to other measures of affective polarization and the post-election period are avenues for future research.
Supplemental Material
Supplemental Material - Does the Salience of Partisan Competition Increase Affective Polarization in the United States?
Supplemental Material for Does the Salience of Partisan Competition Increase Affective Polarization in the United States? by Shane P. Singh and Judd R. Thornton in Political Research Quarterly
Footnotes
Acknowledgements
The authors would like to thank Adam Enders, Toby Bolsen, Jennifer McCoy, Sean Richey, Nicolas Campos, and Daniel Weitzel for feedback on earlier versions of the paper.
Declaration of Conflicting Interests
The author(s) declared no potential conflicts of interest with respect to the research, authorship, and/or publication of this article.
Funding
The author(s) received no financial support for the research, authorship, and/or publication of this article.
Supplemental Material
Supplemental material for this article is available online.
Notes
References
Supplementary Material
Please find the following supplemental material available below.
For Open Access articles published under a Creative Commons License, all supplemental material carries the same license as the article it is associated with.
For non-Open Access articles published, all supplemental material carries a non-exclusive license, and permission requests for re-use of supplemental material or any part of supplemental material shall be sent directly to the copyright owner as specified in the copyright notice associated with the article.