
Abstract
The literature that examines cross-national satisfaction with democracy seeks to discover a set of predictors that are associated with evaluations of regime performance. The most common way of examining the determinants of satisfaction with democracy is null hypothesis significance testing. While this approach has merit, this paper argues that the literature, as it stands, can be complemented to gain additional insights. To date, little research has focused on what variables best predict satisfaction. This is important because it helps guide researchers when determining which features to give attention to when devising theories about what causes (changes) in satisfaction. In this paper, I use machine learning algorithms to determine and evaluate the predictive power of variables identified as important in literature. Drawing on the sixth round of the European Social Survey, I find satisfaction with the economy, procedural fairness and responsiveness to be the most important predictors of satisfaction with democracy. These findings justify a stronger focus on the latter two topics in future studies of satisfaction with democracy, which has received little attention in the scholarly literature.
Introduction
In the field of comparative political behaviour, one of the most common indicators of political support is people’s satisfaction with the way democracy works (Magalhães 2016). This indicates the level of support for how well the democratic regime works (Anderson et al. 2005; Linde and Ekman 2003; Norris 1999). The availability and intuitiveness of this indicator has allowed the development of a research field in which researchers investigate the determinants of satisfaction with democracy (SWD). According to Anderson and Guillory (1997), satisfaction captures a citizen’s response to the process of democratic governance. This exemplifies the importance of this particular outcome for social science research.
Because it is such an important indicator of the health of democracy, scholars of comparative politics have sought to understand citizens’ subjective assessment of the functioning of democracy for decades. Using cross-national surveys, scholars have made efforts to uncover the political, economic, contextual and social conditions associated with democratic satisfaction. Null hypothesis significance testing has been the dominant way of examining the relationship between SWD and potential determinants.
The literature has identified several determinants that stand out as important. Many scholars propose explanations related to what Easton (1965) calls democratic input such as institutional factors (e.g. Anderson and Guillory 1997; Wagner, Schneider and Halla 2009); various forms of trust (e.g., Grönlund and Setälä 2007; Zmerli, Newton and Montero 2007); responsiveness and congruence (e.g., Kim 2009; Mayne and Hakhverdian 2017; Sirovátka, Guzi and Saxonberg 2019) and procedural fairness (e.g., Armingeon and Guthmann 2014; Magalhães 2016). On the output side, scholars point to the evaluation of the economy (e.g., Schäfer 2013) and the winner–loser gap (e.g., Blais and Gélineau 2007; Curini, Jou and Memoli 2012; Dahlberg and Linde 2016) as the most important explanations for satisfaction. However, we do not know which of these input and output factors are actually the most important. Considering the importance of understanding SWD and that there has been considerable research attempting to understand people’s SWD, we need to develop a better understanding of which factors most contribute to explaining this variable. The aim of this article is to contribute by applying a machine learning framework to test which variables have the most explanatory power.
While previous research has provided a wealth of insight into what affects satisfaction, this paper argues that the literature, as it stands, can be complemented to gain additional insights. By focussing on prediction, we can assess the relative contribution of new empirical work in the existing literature. Statistical significance alone does not provide grounds to sufficiently progress our theoretical upstanding of a social phenomenon. To assess the contributions of explanatory factors, scholars should focus on whether a new theoretical specification of the statistical model contributes to the prediction accuracy of the outcome of interest (Cranmer and Desmarais 2017).
The shortcomings of relying solely on statistical significance in social science are well documented (cf. Cranmer and Desmarais 2017). By focussing on null hypothesis significance testing, research is not taking advantage of the model’s ability to predict satisfaction. Whether a predictor is significant or not may have little to do with its ability to accurately predict citizen satisfaction. This approach is more focused on understanding the effects of the independent variables than on explaining the dependent variable. The implication of this is that a predictor that is statistically significant. The approach does not necessarily address how substantial the effects are. Like Ward, Greenhill and Bakke (2010) demonstrate, statistical significance and predictive validity can be incompatible, that is, covariates with statistically significant coefficients can undermine a model’s predictive performance.
While the tests for statistical significance have value, evaluating the ability of a model to predict satisfaction out-of-sample offers at least an additional, and perhaps a better, way of assessing the explanations for satisfaction patterns (cf. Beck, King and Zeng 2000). Significance tests for coefficients are certainly not the only option available, and they may not be the best, depending on the purpose of the research. This point also has implications for empirical research in any area of political science that continues to employ statistical significance as the primary criterion for evaluating results. In addition, the traditional regression-based approach could also lead to over-fitting, which can yield relationships among variables that are in reality just noise in the data and thus unlikely to generalise beyond the sample at hand. Furthermore, I also circumvent making arbitrary modelling choices that could lead, depending on the actual modelling, to underestimation of modelling uncertainty (Bartels 1997; Montgomery, Hollenbach and Ward 2012).
Thus, the literature effectively ignores the ability to predict satisfaction. Knowledge about what covariates best forecast an outcome will certainly help guide future research. To compensate for this deficiency in the literature, I use the current state of knowledge in the literature to determine what covariates studies focus on when they analyse satisfaction. Next, I use a machine learning algorithm named ‘random forest’ (Breiman 2001) to determine the predictive power of the determinants that have been shown to be most important for SWD. To the best of my knowledge, an algorithmic approach to determine the best predictors of satisfaction has not yet been employed in the literature. The results can shed light on what covariates best predict SWD and make it possible to evaluate their relative importance. By turning to machine learning, we can allow for non-linearities, interaction, nested functions and a number of other complexities that are difficult to study in a linear regression framework, thus furthering our understanding of the relationship with satisfaction.
This study thus contributes to the field by identifying what determinants future research should focus on without assuming independence among the variables and linearity or yielding conditional results that are difficult to interpret (Achen 2005; Hindman 2015; Lee Ray 2005). These advantages have increasingly led political scientists to use machine learning tools to study questions relating to topics as diverse as interest group politics, voting behaviour, survey research methods, legislator ideology, genocide, civil war onset and congruence (Becker, Fetzer, and Novy 2017; Bonica 2018; Cohen and Warner 2021; Grimmer and Stewart 2013; Hainmueller and Hazlett 2014; Lupu and Warner 2021; Muchlinski et al. 2016).
The results show that evaluations of the economy, responsiveness and procedural fairness stand out as the most important covariates for predicting SWD, thus signalling that scholars also should pay attention to input-related explanations. The article proceeds as follows: After a short review of the relevant literature, I will briefly discuss the dependent and independent variables, data sources and methodological approach. I then present the results of the analysis. Based on a benchmark experiment with different algorithms, I use random forest to identify permutation importance to show which variables contribute most to predicting SWD.
Predicting Satisfaction With Democracy
The literature on regime support has produced a wealth of insights for explaining variation in SWD. Relating these findings back to the well-known political support model by Easton (1965), there is a debate, sometimes explicit and sometimes implicit, regarding whether outputs or inputs are the most important predictors of satisfaction.
On the output side, much of the literature on satisfaction has concerned the observed difference in satisfaction between electoral winners and losers (cf. Anderson and Guillory 1997; Anderson et al. 2005; Bernauer and Vatter 2012). Being an electoral loser, defined as not having voted for one of the parties or party in government, is thought to increase dissatisfaction of citizens because the government is less likely to produce policies that they agree with. When examining aggregate levels of satisfaction, this line of research has spawned a debate over whether institutional factors, that is, the black box of the political system, can explain differences in satisfaction levels.
At the individual level, some scholars argue that citizens who are democratic winners are more satisfied than democratic losers. The political authority enjoys more support when it delivers favourable policy outcomes if citizens perceive them as unbiased (Estlund 2009; Hibbing and Theiss-Morse 2002). This claim is contested by scholars who argue that the input side of democracy also matters. Dahlberg and Linde (2016) suggest that the winner/loser gap explains some of the variation in satisfaction but that this gap narrows when the electoral process is considered fair. This tells us that procedural fairness plays an important role in the context of regime support.
Another important output-oriented variable is economic performance. Both objectively and subjectively, this is thought to shape patterns of satisfaction, while most emphasis has been given to citizens’ reactions to economic performance and judgements about government effectiveness in managing them (e.g. Armingeon and Guthmann 2014; Bratton 2005; Lühiste 2014; Rohrschneider and Loveless 2010) For instance, Kim (2009) show that levels of satisfaction is correlated with the government’s economic performance. If the economic condition in a country is favourable to citizens, this will boost satisfaction. Conversely, if the economic conditions are unfavourable, citizens will be less satisfied. However, this argument rests on the assumption that citizens are aware of national changes in the macro-economy.
On the input side, drawing on social psychology in organisational settings (cf. Thibaut and Walker 1975; Tyler 2006), scholars emphasise the procedural aspects of democracy. Theories of procedural fairness contend that individuals are more likely to comply with the law and accept authoritative decisions when they believe that they are treated fairly, and if they believe that those institutions are sufficiently morally upstanding to command obedience. Dahlberg and Holmberg (2014) and Dahlberg, Linde and Holmberg (2015) find that impartiality and effectiveness raise support for bureaucracy, which in turn improves satisfaction. Several recent studies have found that corruption erodes perceptions of procedural justice and thus regime support (Anderson and LoTempio 2002; Kestilä-Kekkonen and Söderlund 2017; Linde and Erlingsson 2013; Van der Meer, Hakhverdian and Aaldering 2016). Importantly, procedural justice moderates the influence of economic outcomes on support (Magalhães 2016; Magalhães and Aguiar-Conraria 2019; Rhodes-Purdy 2017a, 2017b), while Linde and Peters (2020) find that fair procedures build systemic support, which gives political authorities greater latitude to pursue necessary but unpopular policies.
In addition, a growing number of studies have investigated the role of congruence in relation to regime support. Congruent voters, understood here as the ideological proximity of citizens to the government of the day, are theorised to be more positively oriented towards the government (Christmann and Torcal 2018; Curini, Jou and Memoli 2015; Dahlberg and Holmberg 2014; Kim 2009; Mayne and Hakhverdian 2017). This is related to the losers’ consent literature reviewed above, but it captures a more nuanced relationship between voters and the executive. Congruence also captures important elements of winning and losing in politics, which are not substitutes for one another, especially in systems with multiple parties occupying the same ideological space. Here, some voters may therefore be ideologically congruent with their government without having supported a governing party, and vice versa.
There is, however, some disagreement concerning what constitutes the best model for explaining SWD. For instance, Dahlberg and Linde (2016) suggest that the winner–loser gap explains some of the variation in SWD and that this winner–loser gap in satisfaction narrows when the electoral process is considered fair, indicating that procedural fairness plays an important role. This contrasts with earlier work. Curini, Jou and Memoli (2012) argue that losing or winning, interchangeably, moderates the effect, meaning that among present losers, previous experience with electoral victory reduces dissatisfaction. Among voters with a history of electoral victory, only high ideological congruence with the current government boosts satisfaction. On the other hand, Magalhães (2016) argues that the interaction between perceptions of the economy and procedural fairness is the most important predictor. Furthermore, Sirovátka, Guzi and Saxonberg (2019) argue for the predictive power of responsiveness, namely, that a lack of responsiveness, or unequal responsiveness, can cause citizens to be dissatisfied with democracy. Responsiveness has not received as much attention as the other variables discussed above. However, increasing attention has been given to the government’s ability to be responsive and congruent with the citizens in a country (Sirovátka, Guzi and Saxonberg 2019). Advocates of this position argue that if the citizens regard the government as unresponsive, as defined by a discrepancy between citizens’ opinion and their evaluation of the regime, their satisfaction decreases.
In recent years, a growing number of studies have examined congruence, with a particular focus on the relationship between political attitudes and citizens’ ideological proximity to the national government. Citizens who are ideologically proximate to the government of the day will be more positively oriented towards it (Christmann and Torcal 2018; Curini, Jou and Memoli 2015; Dahlberg, Linde and Holmberg 2015; Kim 2009; Mayne and Hakhverdian 2017). The argument relates to the loser consent literature cited above, but the conceptualisation of distance is somewhat different. Rather than considering electoral winners and losers, these studies hypothesise that ideological distance to the government predicts patterns of satisfaction. Work in this field has found similar results when congruence is operationalised in policy and process terms rather than ideological proximity (André and Depauw 2017a; Ferland 2021; Reher 2015; Stecker and Tausendpfund 2016).
As evident from the literature review above, there is no consensus on what the most important predictors of satisfaction are, and different studies emphasise different indicators as being key to explaining SWD. Note that these different investigations into SWD are not distinct. Rather, they build on one another, and many include the same variables as controls. While this brief review is not an exhaustive synthesis of the entire field, it does reflect the main debates in the field regarding the most important explanatory variables that have been identified as explaining SWD. The contribution of this paper is to help settle these debates and guide further research by empirically assessing what variables are the most important predictors of SWD. This will allow future research to identify which previously studied explanations should receive the greatest focus.
In this paper, I attempt to resolve some of these controversies and empirically evaluate what best predicts satisfaction. Output-oriented studies, that is, those that regard satisfaction as being contingent on producing desirable outcomes, have long dominated the field. In recent years, however, scholars have also focused on the input aspects of regime performance. To guide further inquiry and build a stronger causal theory for what affects satisfaction, I argue that an alternative empirical strategy is merited.
Data and Measurement
SWD can be understood as reflecting citizen evaluation of the performance of democracy in practice (Linde and Ekman 2003; Norris 2011). Canache, Mondak and Seligson (2001) are relatively critical about the inferences that can be drawn from this indicator. More recent studies have also indicated that the standard survey question ‘how satisfied are you with the way democracy works in your country’ reflects a more general evaluation of the political system’s performance than support for more abstract principles of democracy (André and Depauw 2017b; Anderson et al. 2005). However, in a recent study, Quaranta (2018) finds that alternative aggregates of perceived regime performance yield similar results as SWD, at both the individual and country levels.
To exhaustively test the importance of the independent variables discussed in the literature above, I use the sixth round of the European Social Survey (ESS). For my purposes, the ESS is the best choice, since it allows for testing and comparing a wide range of explanations proposed in earlier research. The data are collected from 25 European countries (ESS 2012). As noted by Sirovátka, Guzi and Saxonberg (2019), this round of the ESS is particularly well suited for this type of study, as it contains a rotating module on aspects of democracy. 1 Using only one data source could bias the results, but by using cross-validation to measure out-of-sample predictive power, the results remain unbiased and guarded against over-fitting (cf. Athey and Imbens 2019; Breiman 2001; Molina and Garip 2019).
Figure 1 presents the cross-country distribution of average levels of SWD. The scale runs from 0 to 10, with 10 indicating the highest level of satisfaction. In the top-right corner, we find the Scandinavian countries and Switzerland where satisfaction is highest. The bottom of the plot is dominated by Eastern European countries. The figure also displays the individual confidence intervals. The overall standard deviation in the sample is 2.37, and the individual confidence intervals are displayed in Figure 1. Satisfaction with democracy. Note: The dots are country averages of satisfaction with democracy, and the bars show their 95% confidence intervals. The vertical dashed line indicates the sample mean (µ = 5.64). Country abbreviations on the Y-axis are ISO country codes Alpha-2.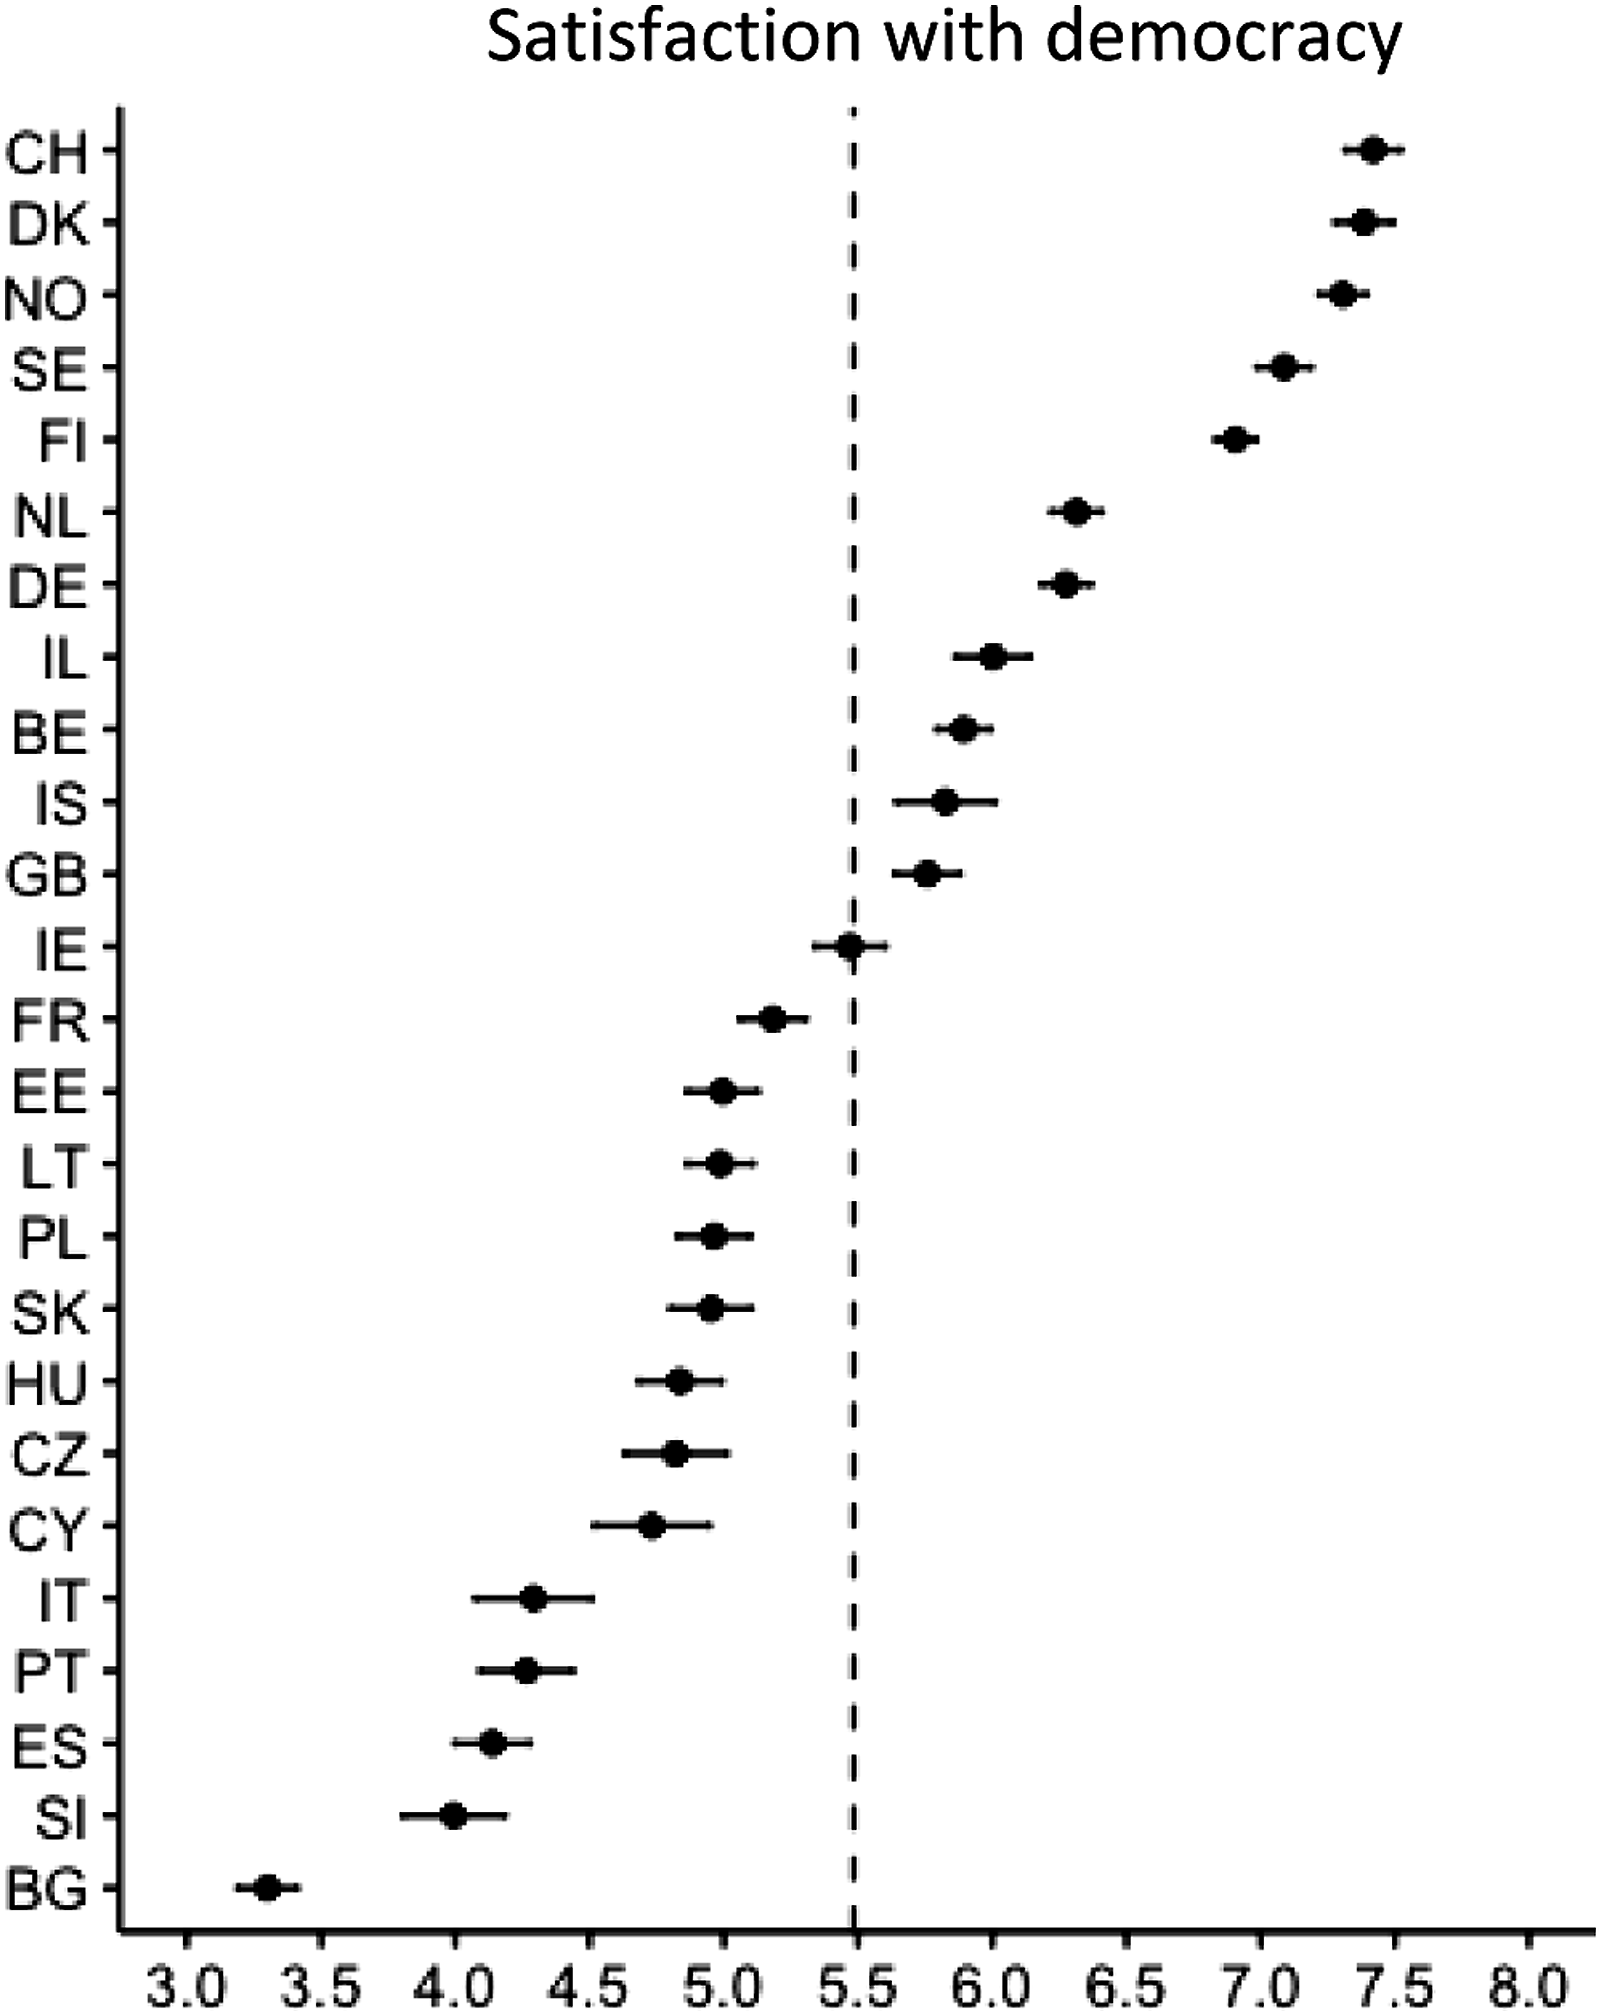
Descriptive Statistics.
While most variables are self-explanatory, others require further explanation. First, the variable Electoral winner/loser is a binary variable, where a value of 1 indicates that the respondent voted for a party in government, that is, a winner, and 0 indicates that the respondent voted for a party outside of government, that is, a loser. Second, the variables Inequality and Poverty are measures of government responsiveness to inequality and poverty as perceived by respondents. Respondents are asked to what extent they think it is important that the government addresses poverty and inequality. Their answer to this question is then compared to a question where they subjectively evaluate the performance of the government of their country on this question. A larger discrepancy implies a wider gap between what citizens want and what they believe is delivered by the government, that is, smaller values indicate higher perceived responsiveness. The specific value is obtained by taking the standard deviation of the difference between the expectations of citizens concerning what the government should do to reduce inequality and poverty and the citizens’ evaluation of the government’s performance in reducing inequality and poverty (Sirovátka, Guzi and Saxonberg 2019). This ensures that responsiveness can be measured regardless of the direction of the distance between opinion on the issue and the evaluation of the government’s effort.
Last, the variable Incongruence is calculated using the respondent’s left-right self-placement on a 11-point scale and an average left-right score weighted by the number of seats from the ParlGov data set (Döring and Manow 2018), which is also on an 11-point scale. The measure of incongruence is obtained by calculating the absolute value of the distance from the cabinet in power at the point in time when the respondent was surveyed. A high value means that the respondent is ideologically distant from the government of the day, while a low value indicates ideological proximity to the government of the day. There are of course multiple ways in which congruence can be measured, be it on policy issues, priorities, salience, procedures and representational congruence (see Lefkofridi 2020, for a recent review) and conceptualised (see Golder and Stramski 2010, for a thorough discussion). Additionally, a growing body of work has found consistent support for the hypothesis that ideological proximity to one’s government is positively associated with citizen satisfaction with democracy (cf. Christmann and Torcal 2018; Kim 2009; Mayne and Hakhverdian 2017; Mayne and Broderstad 2022). Hence, I focus here exclusively on ideological congruence.
Empirical Strategy
While the current methodological approach has provided a wealth of insights into the explanations of SWD, I argue that the standard analysis used in the literature can be complemented to gain additional insights. Since statistically significant variables may not meaningfully increase the model’s predictive power, the current approach with conventional hypothesis testing effectively ignores the ability to predict satisfaction and thus assessing which variables should be included in a standard regression analysis.
Second, when scholars routinely use all of the data to fit their model, there is no way of knowing whether the patterns they uncover are the results of the peculiarities of a given data set or are more general. That is, many of the results in the literature likely result from over-fitting, meaning they reflect noise in the data rather than meaningful relationships. If indicators of theoretical concepts fail to produce relationships with satisfaction that generalise to other sets of data, they do not add predictive validity to a model. This calls into question the importance of these concepts in influencing satisfaction patterns.
This study remedies this deficiency in the literature by following Hill and Jones (2014) and making use of the random forest algorithm.
2
Random forest, and the associated decision trees, is a non-parametric class of supervised machine learning algorithms that is commonly used for prediction (Breiman 2001). The algorithm operates by constructing a multitude of decision trees. A decision tree is a common predictive modelling approach used in machine learning. It employs a predictive model to infer conclusions about an item’s target value from observations about the item. The random forest algorithm creates a large number of decision trees and averages the results of each individual tree to best determine the prediction of an outcome, in our case, SWD. It also allows us to examine the predictive power that each covariate adds to models, rather than what each covariate adds to the baseline model alone. Random forest also allows for non-linear functional forms and complex interactions among the covariates, without the researcher having to pre-specify a particular functional form or interaction term (Biau, Devroye and Lugosi 2008; Strobl, Malley and Tutz 2009). Hill and Jones (2014, 666) describe the process in the following way: 1. ‘Select a set of observations (by sub-sampling from the full set of data). 2. Select a subset of covariates. 3. Find the variable in the selected subset that is most strongly related to the dependent variable. 4. Find the point in the selected variable that optimally classifies the dependent variable. 5. Repeat steps 2 through 5 on the resulting partitions (daughter nodes) until a stopping criterion is met (set to 500 trees)’.
This process is repeated a given number of times chosen by the researcher and will result in a ‘forest’ of decision trees. Each of these decision trees are made up from a sub-sample of the full data set and each node can have any set of predictors. The predictor in each node is randomly sampled from the list of predictors available. At the end of this process, the algorithm will give a predicted value for the empirical phenomenon. This value is found by averaging all predicted value in each decision tree in the forest. The algorithm also allows for identification of non-linear and interaction effects because it can split a particular variable at different points across different trees in the forest. 3
When employing multiple trees, it can be difficult to interpret the results of an analysis performed using a random forest algorithm. I therefore make use of variable importance, which is a standard metric in machine learning (Breiman 2001). The measure indicates the amount of information a variable provides for predicting the outcome. To measure variable importance, I use an unscaled permutation test that measures the mean decrease in classification accuracy after permuting each covariate of the set of predictors Xj, where j indexes each covariate over all trees in the forest. Permuting important variables will result in a systematic decrease in prediction accuracy, whereas permuting unimportant variables will result in a random decrease, or no decrease, in prediction accuracy. We can, in other words, measure the error created by omitted variable bias. If an important covariate is permuted, the model’s ability to correctly predict an outcome decreases across all the trees in the forest.
To address the hierarchical structure of the data, I estimate a separate model for each country in the sample and aggregate the importance scores across all the individual country predictions. The final model is then trained and tested at the individual level and aggregated to a country-level estimate using 500 Monte Carlo iterations to compute confidence intervals. These results are then, in turn, aggregated to a cross-country average with 95% confidence intervals (Hajjem, Bellavance and Larocque 2014). 4
Based on the results from the analysis of prediction accuracy, that is, feature importance, I estimate a partial dependency model (Friedman 2001). 5 Plotting the partial dependencies yields the marginal relationship between the covariates and the outcomes as estimated by the random forest model. By doing so, we can present an exact relationship between satisfaction and each of the relevant features. Partial dependence plots present the functional form of the relationship between covariates and the outcome. These plots are similar to average marginal effects in the sense that they show the expected value of an outcome given a covariate, when averaging over the estimated effects of the other covariates. Partial dependence marginalises the estimated model, specifically by averaging over the features that are not of interest, and is equivalent to average marginal effects, but it can be applied in situations where derivatives are not available, as is the case with random forest. In contrast to a standard regression analysis, the relationships are estimated without assuming a functional form (Jones and Lupu 2018).
Results – What Are the Most Important Predictors?
First, I assess the prediction accuracy of our model, that is, how well the algorithm accuracy can predict satisfaction. For most countries, the random forest model performs quite well. Even though country-level predictors are omitted, the trained model is able to predict satisfaction with a mean error of approximately 1.71. This tells us that when the sample is split in a training set, that is, where the algorithm learns the patterns of satisfaction in the data, the overall prediction in the test set ultimately has a small prediction error on a 0-to-10-point scale.
We now turn to the permutation importance measures from the random forest, displayed in Figures 2 and 3. This importance score is defined as the decrease in model accuracy when an individual variable is randomly excluded. Theoretically, this means that it can run from 0 to 10 because our outcome variable is measured on that same scale. These figures show each covariate’s importance score from the permutation test described above. In Figure 2, the individual importance scores for all countries are plotted. Due to the number of units, the individual importance scores are perhaps difficult to interpret in Figure 2. However, we observe that procedural fairness-oriented variables, as well as satisfaction with the economy, emerge as important predictors. Variable importance for countries. Note: The dots are the point estimates of the permutation importance. Countries are abbreviated with ISO Alpha-2. Country-level variable importance. Note: The dots are the point estimates of the permutation importance. Bars are 95% confidence intervals.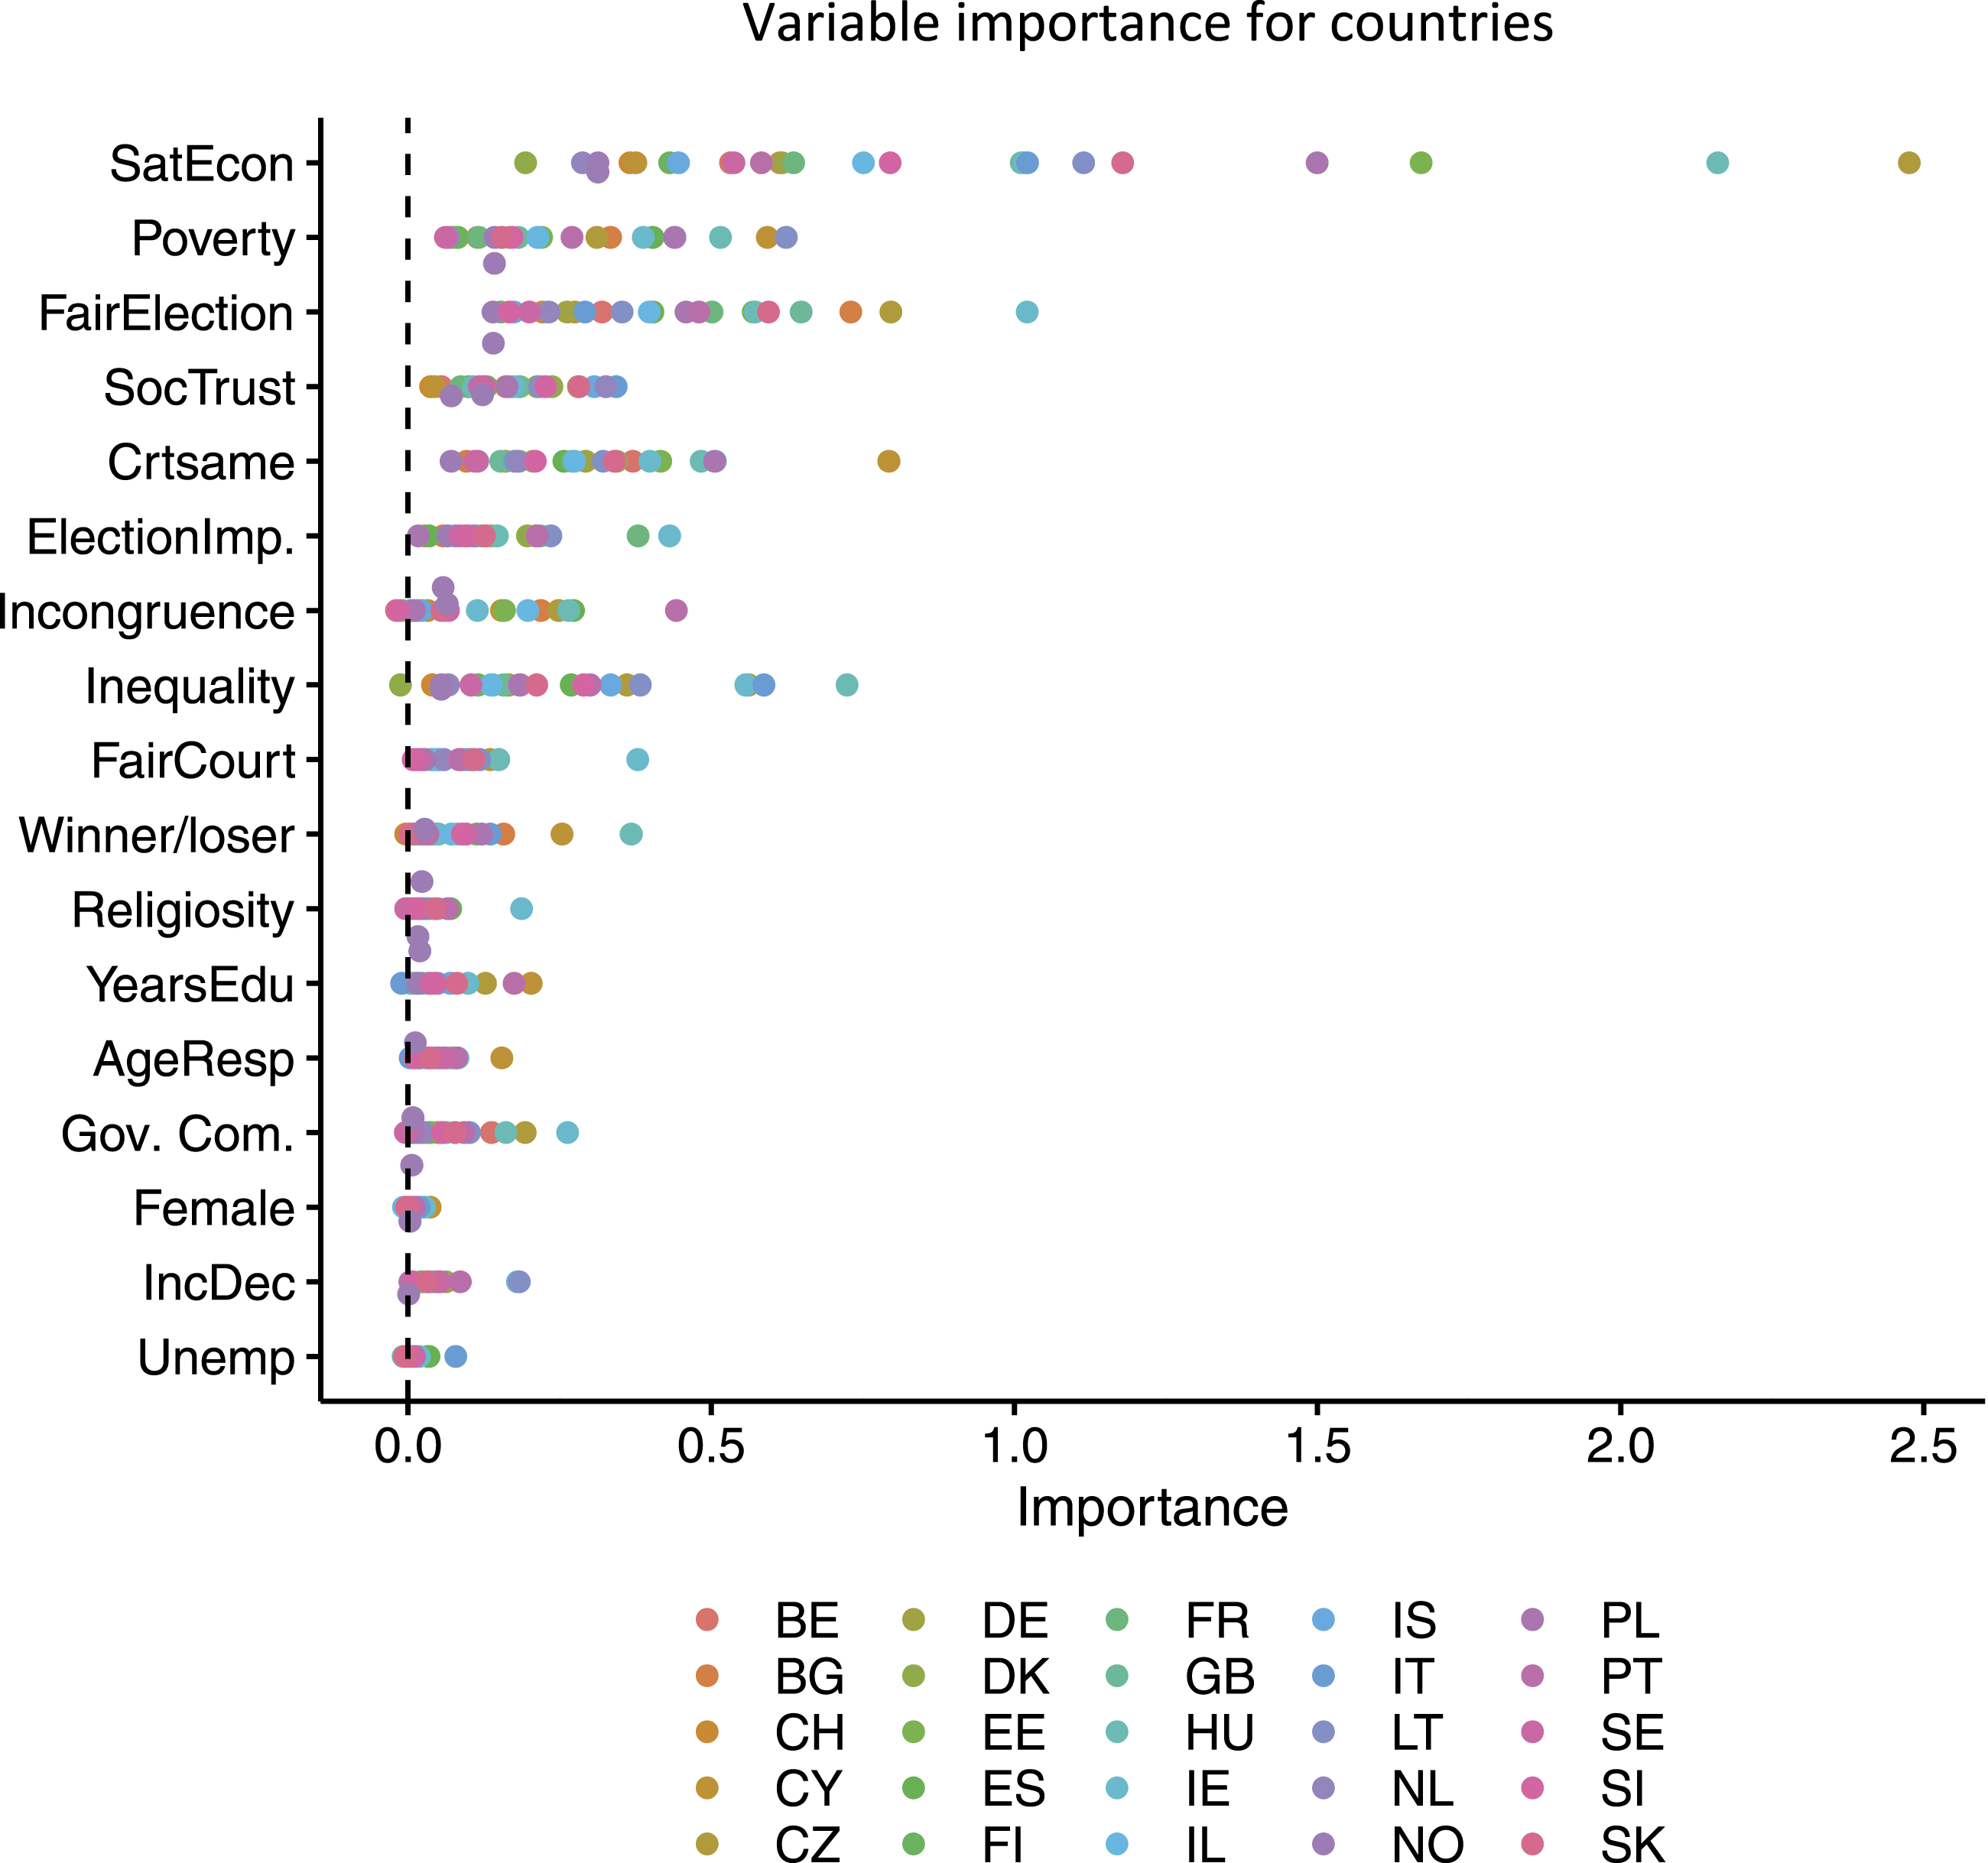
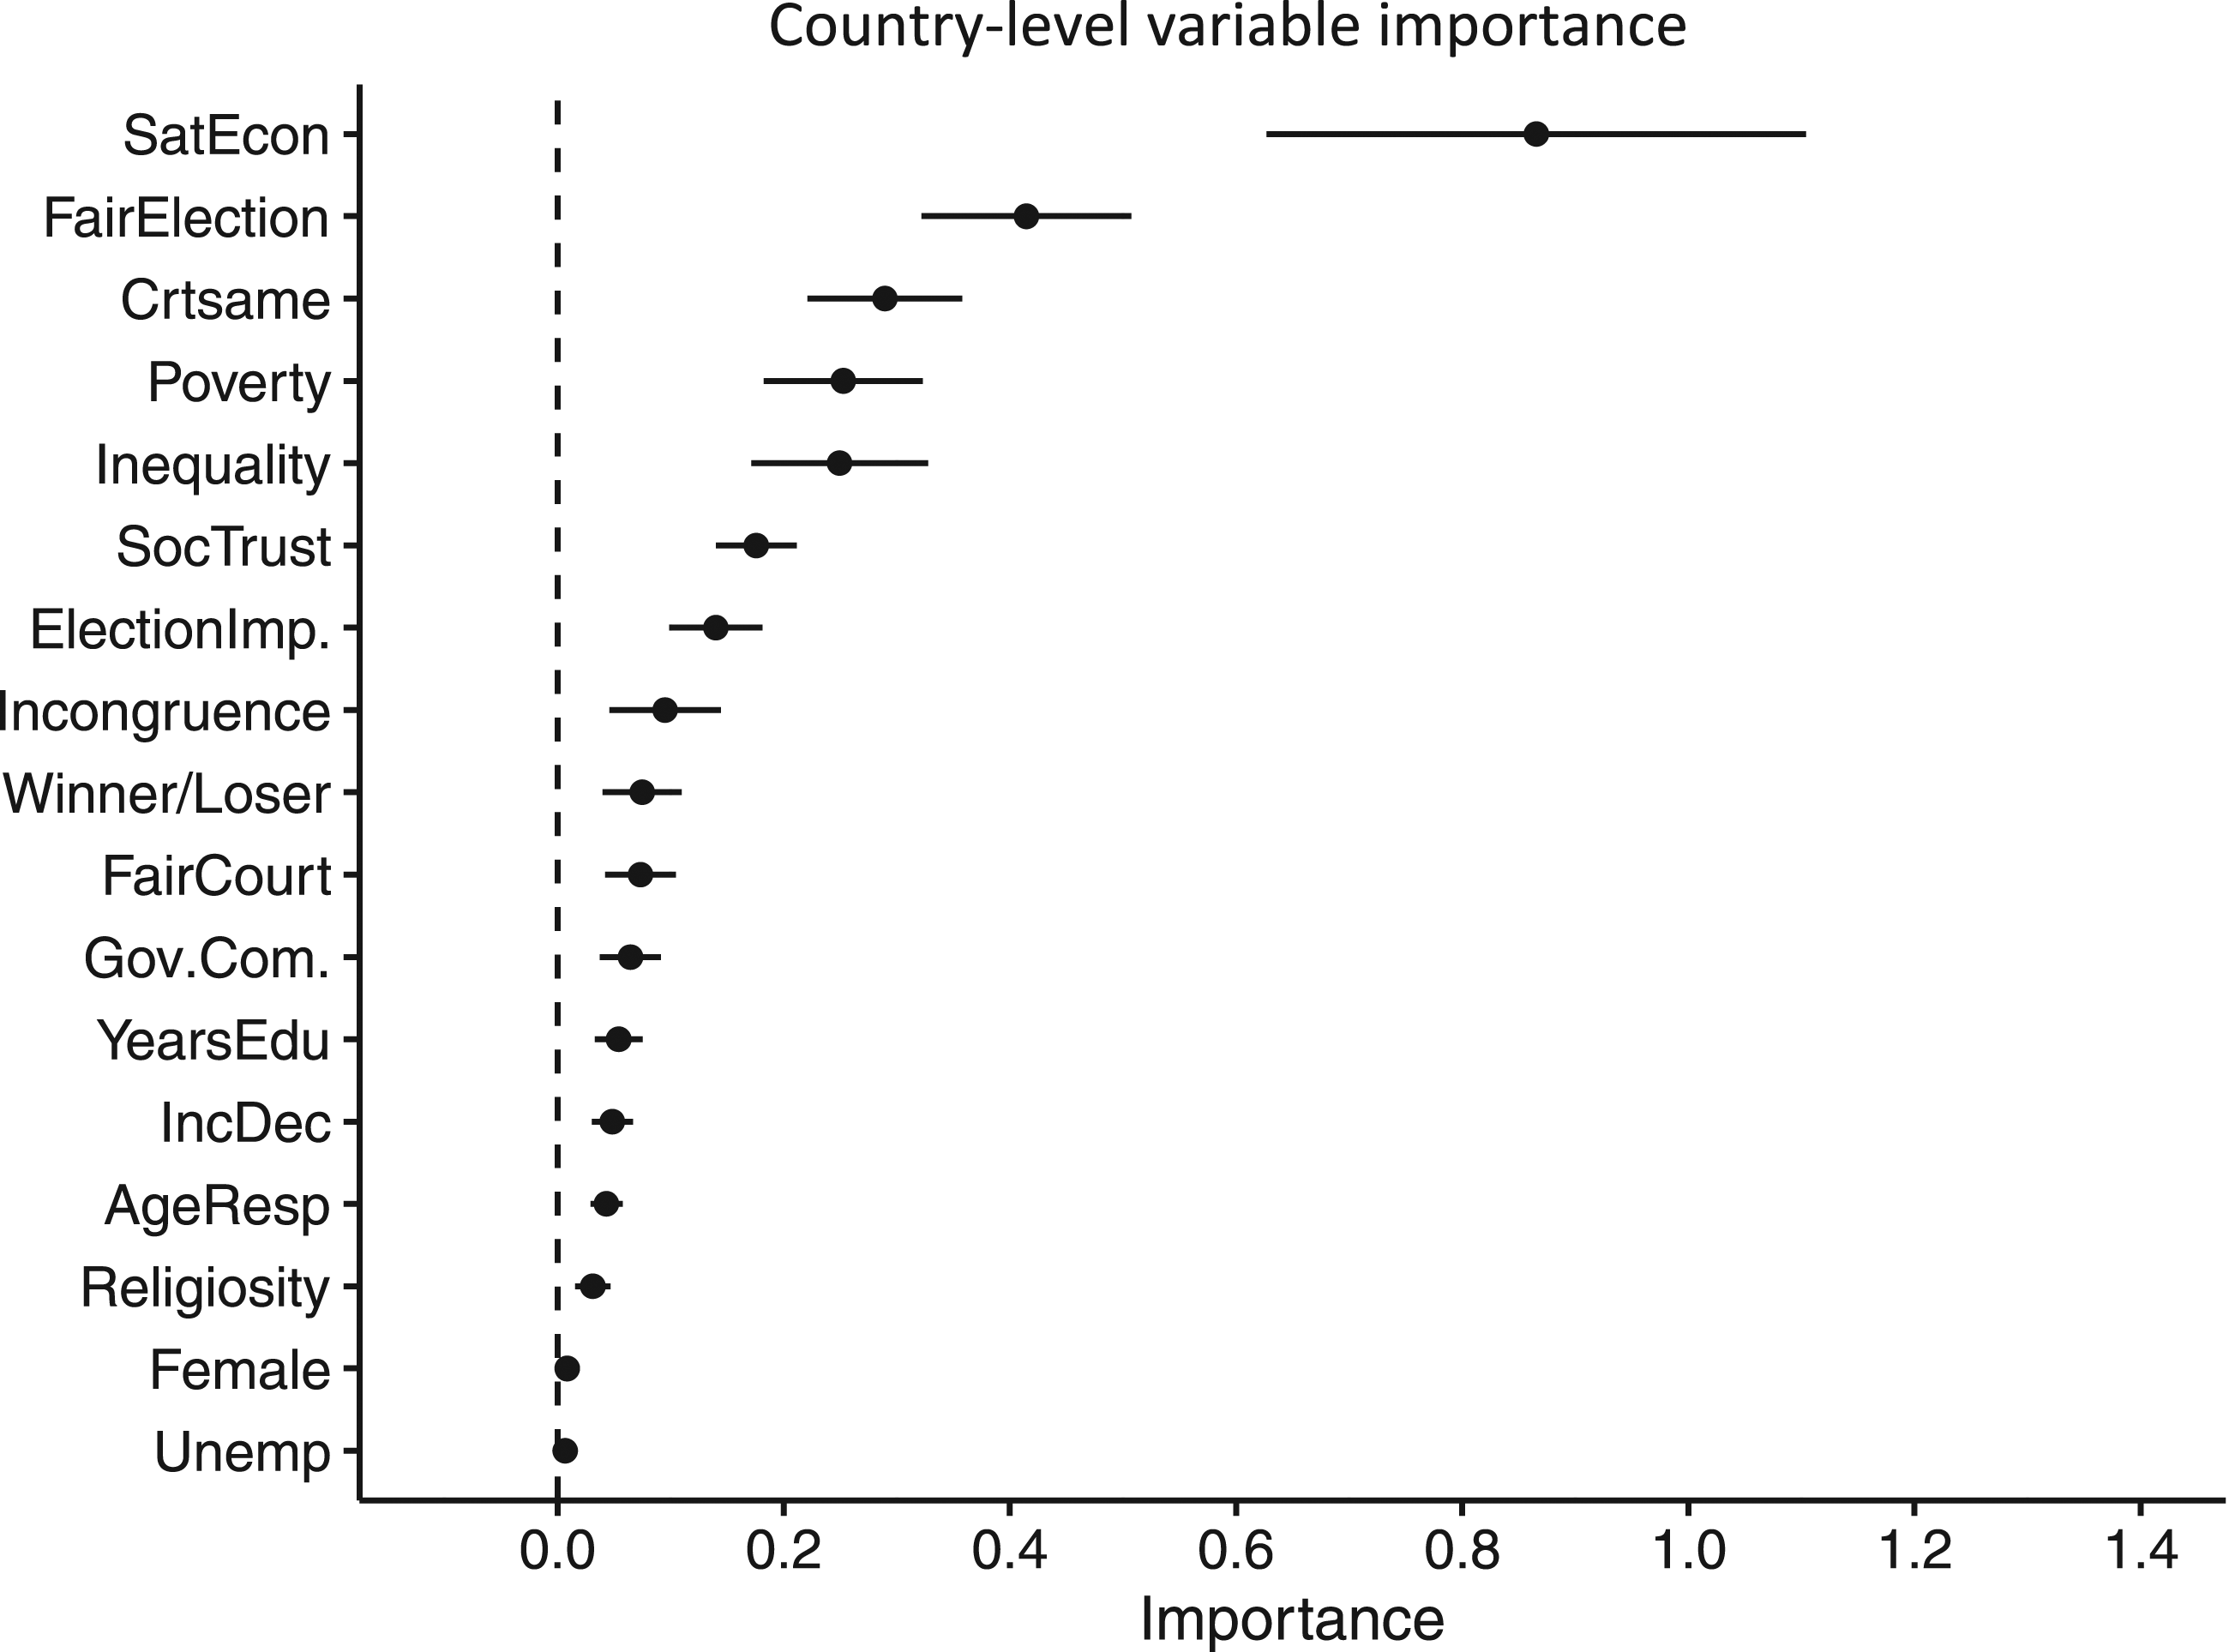
To further assess the results from the analysis, I turn to Figure 3. In this graph, I have aggregated the individual country importance results and estimated 95% confidence intervals. Electoral winner receives a low importance score despite the substantial focus it has received in the literature. Interestingly, given the relatively low level of attention it has received in the literature thus far, responsiveness to inequality and poverty also emerges as important predictors of SWD. The argument, as presented above, is that electoral losers are more likely to be dissatisfied than winners with the way democracy works (Dahlberg and Linde 2016). This also relates to unfavourable outcome bias, as discussed above.
Some of the most common control variables at the individual level seem relatively unimportant. In recent years, there has been increased focus on income gaps and inequality in representation and responsiveness (Sirovátka, Guzi and Saxonberg 2019). Testing unequal responsiveness as a predictor of satisfaction is beyond the scope of this article. However, it is interesting that the income decile covariate is not identified as important in this sample.
Partial Dependency
From Figure 4, we can observe the partial dependency of each of the most important covariates. The estimates are calculated based on the full sample of country observations. The most striking is perhaps the impact of evaluations of the economy: as satisfaction with the economy increases, SWD increases from approximately 4.5 to just under 7 on an 11-point scale. Consistent with the results from the variable importance plot, this tells us that there is a strong relationship between these two covariates. Partial dependency plot for most important features. Note: Dots are the estimated marginal effect of each feature (X-axis) on satisfaction with democracy (Y-axis). In Figure 4F, squares indicate the effects of being an electoral winner (Incongruence = 0) and loser (Incongruence = 8). The circles indicate the predicted estimates for the empirical range of incongruence.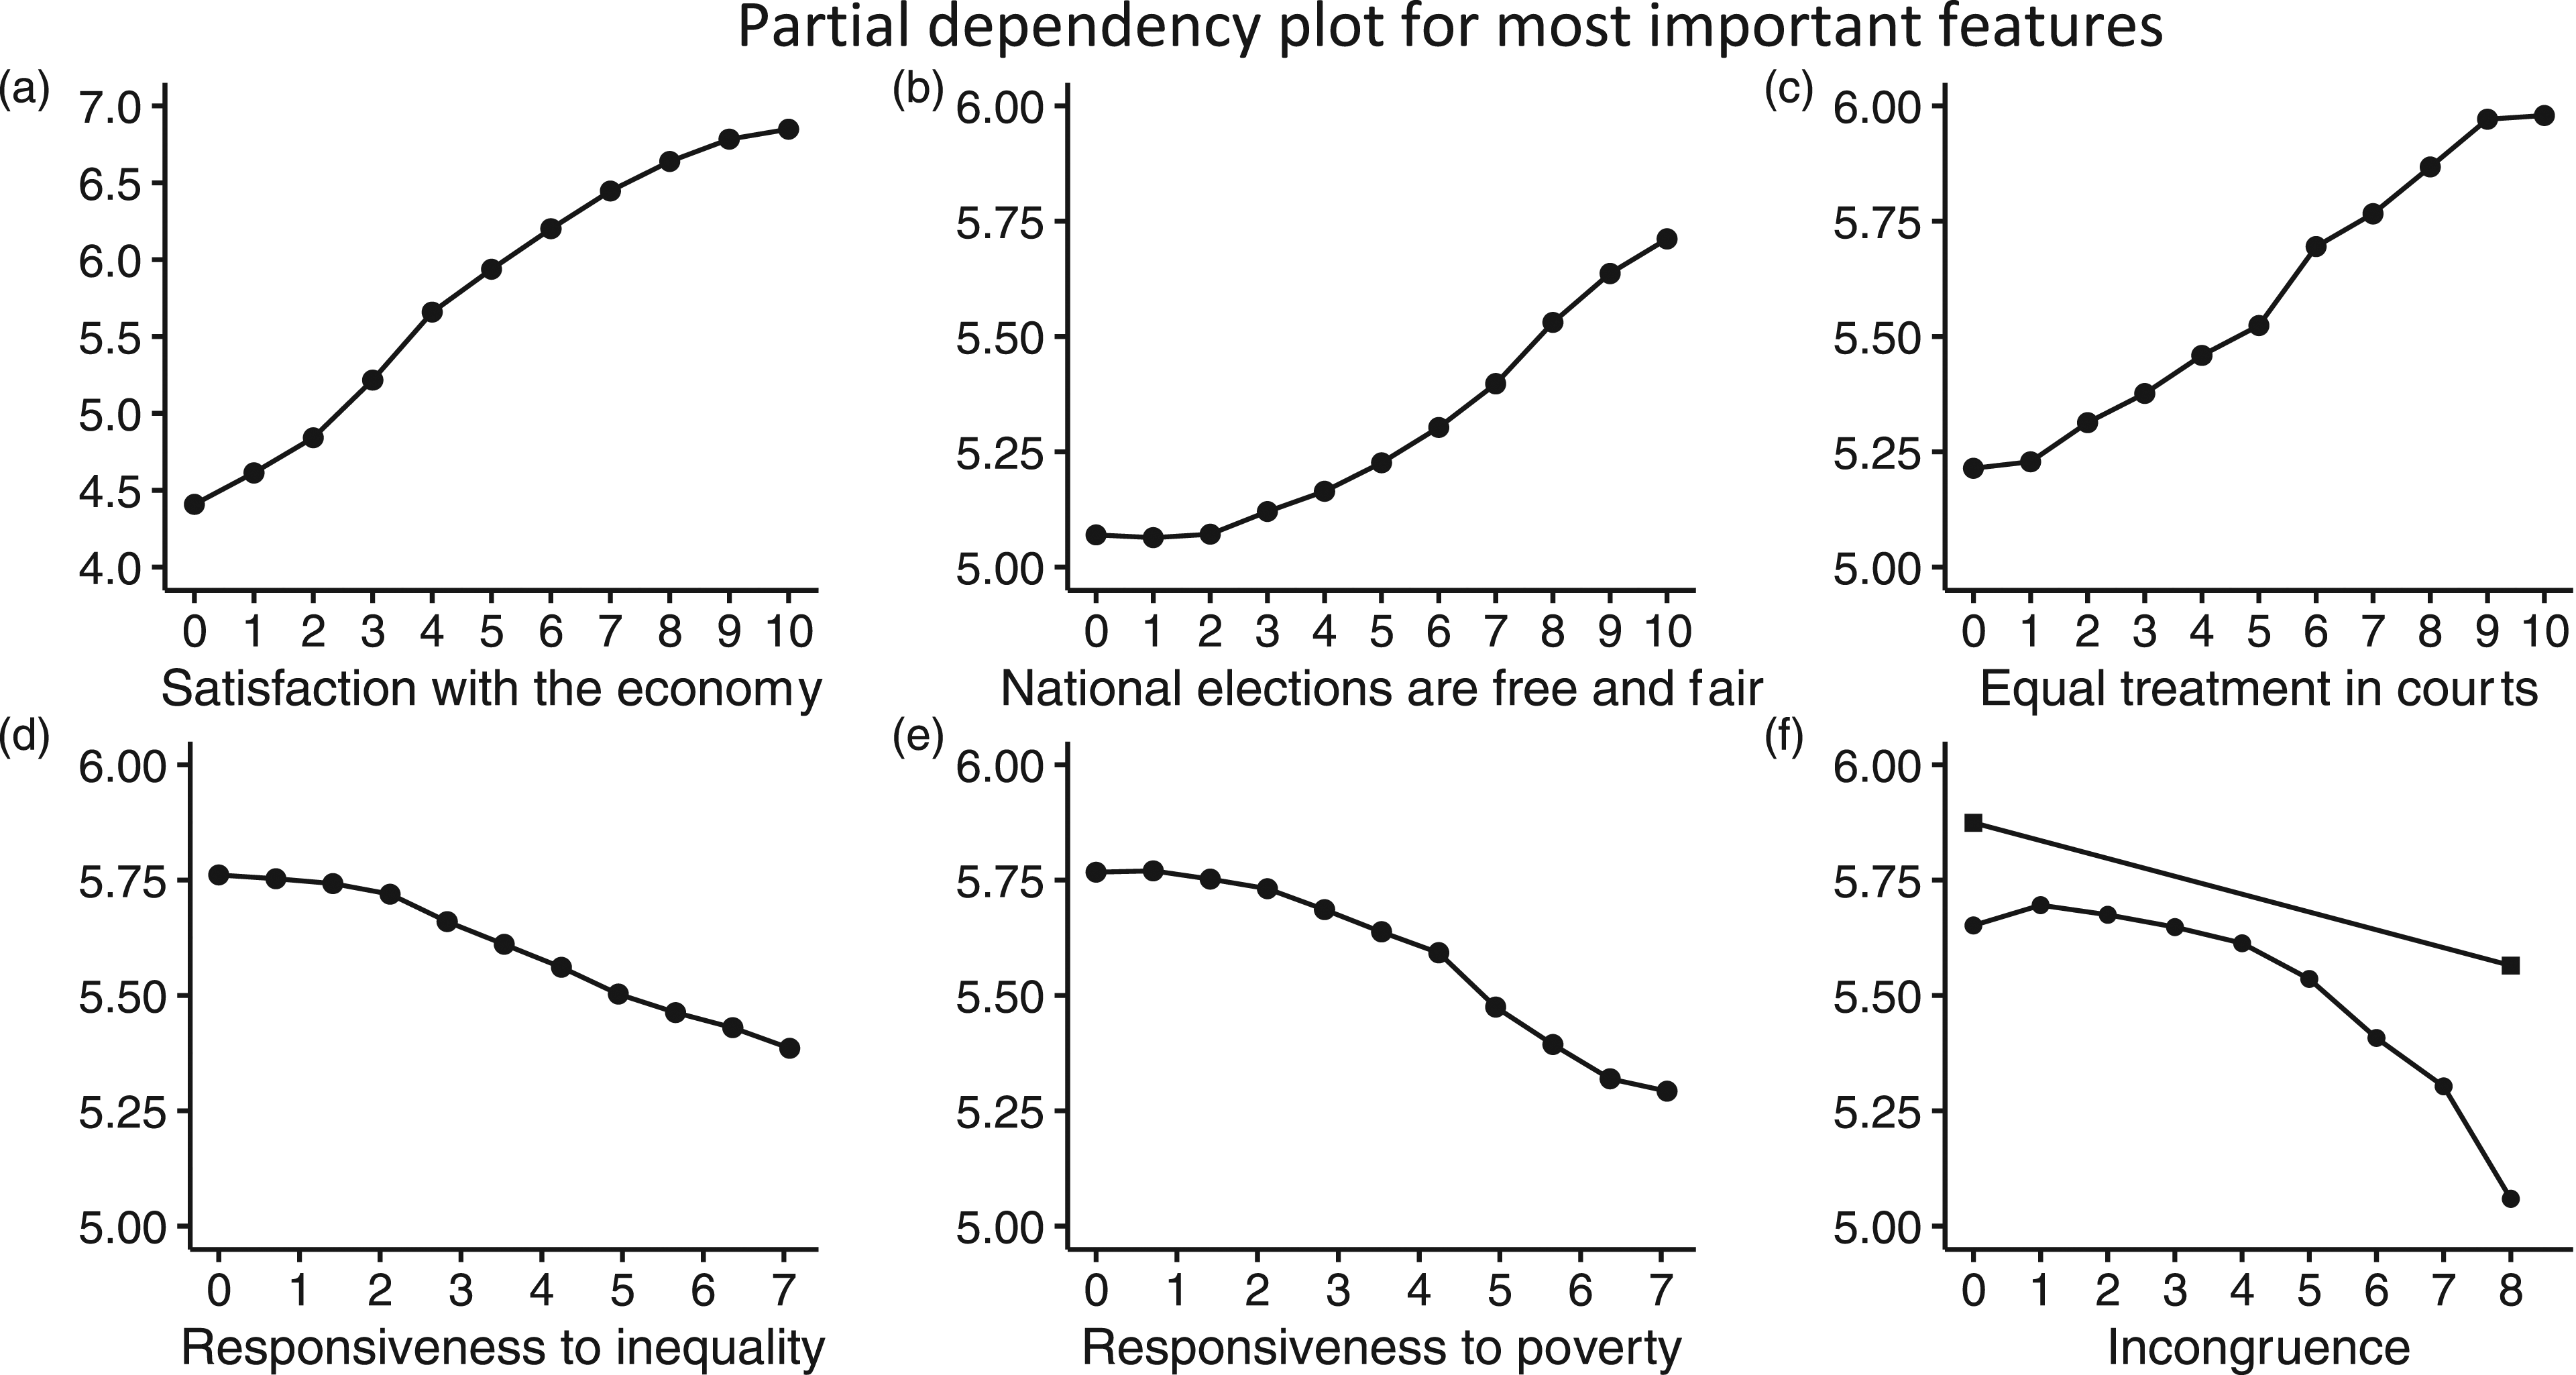
The features associated with procedural fairness also have a strong impact, albeit not as strong as with satisfaction. As noted by Magalhães (2016), procedural fairness should have a positive effect on satisfaction because political authorities and institutions lose legitimacy if they do not comply with norms of procedural fairness (Tyler, 2006). The importance of transparent, unbiased and predictable decision-making has been proven to affect the political system (Lind and Tyler 1988). It also relates to quality of government, at both the individual and institutional levels (Erlingsson, Linde and Öhrvall 2014; Linde and Erlingsson 2013; Rose, Mishler and Haerpfer 1998).
Furthermore, a lack of responsiveness and incongruence has a negative impact on satisfaction. As mentioned above, this is understudied in the literature, but some scholars (Mayne and Hakhverdian 2017; Sirovátka, Guzi and Saxonberg 2019) have found evidence of the same. In Figure 4F, the effect of being an electoral winner or loser is plotted in tandem with incongruence. When incongruence is equal to zero, electoral winners display the same level of satisfaction, and there is a clear negative effect on satisfaction as incongruence decreases. While the effect of losing is capped at approximately the same level as perfectly congruent citizens, the negative effect of congruence continues to drop. This suggests that congruence plays an important role in shaping satisfaction and that citizens who are ideologically distant from the government are less satisfied.
Discussion and Conclusion
This paper has proposed an alternative strategy for empirical investigations of the determinants of public SWD. Rather than focussing on traditional hypothesis testing, I have provided an empirical application of how to test potential predictors of SWD by using machine learning. Drawing on the sixth round of the ESS, the analysis focuses on some of the most frequently used determinants of SWD. The results show that citizens’ perceptions of the economy, procedural fairness, congruence and responsiveness are the most important variables in this sample. This, in turn, can be used to further develop fruitful analysis and theoretical advances in the field.
The results show that economic evaluations do not seem to have the same relationship with regime support in all contexts. Rohrschneider and Loveless (2010) and Magalhães (2016) argue that economic evaluations are less relevant in nations with high national affluence. This latter finding can be related to the recent economic crisis in Europe, and a decline in SWD has been observed in most countries (Alonso 2013). According to some findings, satisfaction with the economy is the strongest individual-level predictor of regime satisfaction (Armingeon and Guthmann 2014; Lühiste 2014; Rohrschneider and Loveless 2010). However, there is no clear-cut pattern whereby more affluent countries stand out. The results are in line with the research that has shown that satisfaction with the economy is the most important predictor of SWD. For instance, according to Armingeon and Guthmann (2014), satisfaction declined as a result of the 2007 economic crisis. This is also in line with findings indicating that people expect democratic regimes to function better when subjective evaluations of the economy are more prosperous (Lühiste 2014; Rohrschneider and Loveless 2010). Subjective evaluation of the economy is followed by variables capturing aspects of procedural fairness, that is, that the courts and the elections are free and fair. This shows that procedural fairness is likely to matter for regime support.
In the literature on SWD, the winner–loser effect has received considerable attention from many researchers. However, in this sample, the winner–loser effect is not clear. This might be because this cross-sectional study does not capture the effect of winning or losing over time (Dahlberg and Linde 2016). However, few studies are able to do this due to the lack of panel data in a comparative context. A change in µ SWD across temporal and spatial contexts is not able to effectively test this hypothesis. The effect of incongruence is on average somewhat stronger, but the confidence intervals overlap. Interestingly, the partial dependence plots estimated above show that there is a negative relationship between congruence and satisfaction that has a more substantial effect beyond the difference between winning and losing an election. Borrowing from Singh (2014), we can say that not all winners are created equal, and that ideological distance should be factored into the equation when studying satisfaction. That being said, there are multiple ways in which scholars can conceptualise and measure congruence beyond ideological congruence. Coupled with other studies that look at other forms of congruence, the results from this analysis suggest that researchers should look beyond ideological proximity (cf. André and Depauw 2017a; Ferland 2021, who study the relationship between satisfaction and policy and process congruence) when investigating the relationship between satisfaction and congruence.
The respondents perceived responsiveness to inequality and poverty by elected officials emerge as important variables to take into consideration when attempting to explain SWD in this study. Thus, it seems that linking responsiveness to legitimacy is a venture that needs to be pursued further (Mayne and Hakhverdian 2017; Linde and Peters 2020). Since the responsiveness measures included in this study focus on policy areas related to inequality, scholars should investigate these variables across different social strata and political beliefs within countries. However, the relationship between regime performance and responsiveness remains understudied in the literature. 6
The findings from this analysis indicate that scholars should focus on both input- and output-oriented explanations. Regarding the output-based explanations, researchers should place less emphasis on the winner–loser hypothesis and use different indicators. Considerably less attention has been given to input indicators, and future research should certainly direct more attention to these aspects. These assumptions should also be tested in other countries, using other surveys. Although cross-validation addresses the problems of the sample being restricted to one country and year, other studies should look to different data sources and investigate whether these findings generalise to countries outside Europe. It could also be interesting to examine how citizen heterogeneity conditions the relationship between satisfaction and these variables, as it may be unrealistic to assume that this relationship is the same for all citizens.
While this study addresses the most commonly used predictors in the literature on satisfaction, it is important that scholars also look for novel and understudied explanations for changes in regime support patterns. Scholars can pursue this by using both non-parametric and parametric approaches that generate novel theories and explanations for changes in SWD.
Related to this, scholars should also look beyond the most commonly used data sources (like the ESS) and assess temporal and spatial variation in SWD as well as other explanatory variables that are perhaps not included in the most common cross-country surveys. It is very well possible that the reliance on a single data source for this and other studies exclude possible explanations for patterns of satisfaction. Therefore, we should encourage novel theorising when designing and fielding surveys to study this phenomenon.
Methodologically, as the discussion above shows, most approaches that seek to explain variation in regime support are observational in nature. In addition to using new data sources and alternative (understudied) explanatory variables, scholars should focus more on causal identification. Making use of novel methodological advances, like generalised synthetic control method (Xu 2017) and matching approaches (see Haugsgjerd, Linde and Mathisen 2023, for an application) are fruitful avenues for future research.
A broader problem that is addressed here is the mere focus on statistical significance alone. Future research should pay particular attention to what features are added to the model and examine whether they improve the model’s fit. Emphasis should be given to these particular covariates when interpreting and discussing the results and implications. In addition, it can sometimes be problematic to apply a particular functional form to the data. Algorithmic approaches are commonly viewed as a black box of prediction, but this study shows how we can assess the content of the black box and use it to further satisfaction research, especially in terms of evaluating the functional relationship within an algorithmic framework. Ultimately, however, it is important to stress that this non-parametric approach to satisfaction research should be seen as a part of the picture, along with classical hypothesis testing, causal inference and experimental studies.
Supplemental Material
Supplemental Material - An Empirical Evaluation of Explanations for Political System Support
Supplemental Material for An Empirical Evaluation of Explanations for Political System Support by Troy S. Broderstad in Comparative Politics
Footnotes
Declaration of Conflicting Interests
The author(s) declared no potential conflicts of interest with respect to the research, authorship, and/or publication of this article.
Funding
The author(s) disclosed receipt of the following financial support for the research, authorship, and/or publication of this article: This research is funded by the Trond Mohn Foundation under the project ‘The Politics of Inequality’ (grant no. 811309).
Author’s Note
For their advice and comments, the author is grateful to Jonas Linde, Quinton Mayne, Yvette Peters, Nathalie Giger, Pedro C. Magalhães, Per Selle, Mikael Poul Johannesson, and participants at the 2020 National political science conference, Uni. of Tromsø, Norway.
Supplemental Material
Supplemental material for this article is available online.
Notes
References
Supplementary Material
Please find the following supplemental material available below.
For Open Access articles published under a Creative Commons License, all supplemental material carries the same license as the article it is associated with.
For non-Open Access articles published, all supplemental material carries a non-exclusive license, and permission requests for re-use of supplemental material or any part of supplemental material shall be sent directly to the copyright owner as specified in the copyright notice associated with the article.