
Abstract
Do the electoral incentives of political leaders influence who is compelled to serve in the military? We argue that conscription policy is designed by political actors who care about winning elections. In wartime, politicians face the twin threats of military and electoral defeat. Therefore, they will shield swing communities, who hold considerable sway over the outcome of elections, from some costs of military service. We leverage a novel database of 9.2 million U.S. service-members during World War II. We find that counties that narrowly voted for President Roosevelt and Democratic members of Congress had substantially fewer conscripts in the Army during 1942, 1943, and 1945. Substantively, 139,000 fewer soldiers—six times the number of soldiers who landed at Normandy—were enlisted from swing counties than expected. Our findings imply that democratic leaders do not want to lose re-election during wartime, and in doing so sacrifice democratic norms of fairness.
On the 13th of July 1863, New York City residents rioted against a government draft policy that permitted individuals to either pay $300 or find a substitute to avoid serving in the U.S. Civil War. The decision to allow some individuals to opt out contrasts with other, far more draconian government policies that were intended to support the war effort; the Lincoln administration seized property, suspended habeas corpus, and arrested members of state legislatures. Yet the government was unable or unwilling to institute an equitable conscription system. Military history is replete with similar stories of democratic governments implementing similarly inequitable systems of conscription (Leonhard, 2013).
We argue for the first time that partisan concerns inform conscription policy. Previous studies show that governments enact conscription deferments for the wealthy and educated (Baskir and Strauss, 1978; Bernstein, 1991; Martin and Weitz, 2003; Anbinder, 2006). These class-based understandings are incomplete. We theorize the existence of strong incentives for partisan manipulation. Democratic leaders will design conscription policies that enable the political success of their party, providing benefits to swing voters (Cox and McCubbins, 1986; Lindbeck and Weibull, 1987). Our novel argument clearly speaks to the conflicting political incentives of democratic leaders during war.
We test our argument on the case of the United States during the Second World War. We argue that the enlistment system permitted extensive manipulation for electoral advantage. The Selective Service System (SSS), the institution introduced to carry out conscription policies, was an executive-branch agency directly overseen by the presidency. The government, through the SSS, had the authority to set the number of conscripts needed from each county as well as establishing deferments for specific social or economic classifications (Flynn, 1993).
We use a novel dataset containing the names and records of all 9.2 million American servicemembers in the Army during World War II. We use these records to create an aggregated measure of enlistment rates for each county for each year of the war. We then combine these original data with existing census and electoral data, permitting us to thoroughly answer this question. To our knowledge, this is the first study to examine the relationship between electoral politics and conscription at such a granular level. We supplement these new data with extensive archival research. 1
Our findings provide strong support for our theory. The conscription rate in New Deal-era swing counties was significantly lower than the conscription rate in other counties. We examine swing counties from President Roosevelt’s elections, and Democratic Congressional candidates in elections, 1936–1942. Substantively, swing counties’ lower conscription rates equates to 100 fewer soldiers per swing county per year that enlisted into the Army, or 139,000 soldiers overall—the equivalent of four Army corps, or the number of U.S. solders along the front at the start of the Battle of the Bulge.
We disaggregate our data by year, finding that our effect was strongest in 1942. To further demonstrate that swing voters benefited from preferential treatment, we run extensive placebo tests and robustness checks. Finally, we analyze regional effects, to see which locations picked up the slack created by preferential treatment shown to swing counties. We find, as expected, that the most Republican and the most Democratic regions experienced the highest rates of conscription.
More importantly, for each soldier not drafted, there is a larger unobserved network of family, friends, and acquaintances whose support for Democrats may have been contingent on that soldier’s health and well-being. A voting bloc of 139,000 potential soldiers and their networks, concentrated in pivotal constituencies, may have been sufficient to sway presidential and congressional outcomes in 1942 and 1944. Scholarship identifies that wartime support for government is tied to a community’s experience with wartime losses (Gartner and Segura, 1998; Sullivan, 2008; Althaus, Bramlett, and Gimpel, 2012). For example, Roosevelt won Michigan in 1944 by only 22,000 votes, while he lost Ohio by 12,000 votes. Governments’ perceptions of this larger pool of voters is what may motivate them to design inefficient conscription policy.
Not only does our argument add to our understanding of conscription specifically, it adds to the discipline’s understanding of the electoral incentives relating to war more generally. Previous research has explored how governments use war as a tool for electoral benefit, while other work investigates the electoral connection to war outcomes (Arena, 2008). We build on this literature by showing that governments manipulate the distribution of the costs of war for electoral benefit. If politicians view conscription as a redistributive good, they have strong incentives to use enlistment policy as a tool for obtaining re-election. This study is a part of a growing body of literature within security studies that explores the war-fighting process from the bottom up by rigorously employing intra-disciplinary domestic level theories (Lyall, 2020).
Answering this question is as important now as ever, as tensions increase between great powers. The ability of nations to contest major wars remains largely dependent on their military labor acquisition system. To this end, 25 countries have re-introduced conscription in the past decade, highlighting the need to understand its institutional implications. If conscription allows for politics, these political considerations will benefit residents of pivotal electoral districts and the public’s willingness to bear the burdens of war (Horowitz and Levendusky, 2011).
The Story of Elections and War
One of the most prominent literature in political science demonstrates that a democratic politician’s first priority is assuring that they stay in office (Mayhew, 1974; Aldrich and Rohde, 2000). Incumbent politicians appeal to broad coalitions of voters in the hopes of maintaining a majority that will keep them in power (Adams, Merrill III, and Grofman, 2005; Strøm, 1990). Once elected, politicians will distribute the benefits associated with political power in return for voters’ continued support (Lee, 2003; Ansolabehere and Snyder Jr, 2006; Cox, 2009; Gordon, 2011; Gordon, 2009; Kriner and Reeves, 2015; Rogowski, 2016). Such benefits include the redistribution of resources to supporters in the form of pork-barrel projects, preferred policy outcomes, or the creation and distribution of public goods (Downs et al., 1957; Weingast, Shepsle, and Johnsen, 1981; Cox and McCubbins, 1986). The more tenuous the support of a member of the politician’s majority, the more expensive it will be for the politician to maintain their support (De Mesquita et al., 2005). As such, politicians will take steps to ensure that swing voters receive enough benefits, that they will continue to prefer the politician over their opponent (Golden and Min, 2013; Stokes et al., 2013).
This dynamic holds even under the most extreme conditions, including times of war. Voters’ demands on government do not cease during war, nor their demands for responsive leadership. In order to maintain power, politicians must still provide their supporters with public resources (Bueno De Mesquita et al., 2005). Yet, during war, the kind of public goods voters prefer and that the democratic government can offer change. Rather than demand that the government redistribute material benefits, supporters of the incumbent party will desire to pay fewer of the war’s costs. They will demand that the government wins the war (Conconi, Sahuguet, and Zanardi, 2014), but they want to assume less of the war’s total costs.
Unfortunately for wartime democratic governments, the public assumes domestic burdens will be borne equitably. Tax increases, shortages of consumer goods and rationing, declines in domestic spending, and labor disruption may affect everyone (Glick and Taylor, 2010; Carter and Palmer, 2015), but most importantly, voters may demand fair distribution of wartime costs. In many democratic forms of government, checks on executive power explicitly prevent politicians from selectively targeting certain groups with wartime tax increases or rationing.
The highest costs of any war are associated with military service (Kriner and Shen, 2010). Those who are chosen to serve make tremendous sacrifices in the short and long run. Returning soldiers bear physical and mental injuries that affect their quality of life (Tanielian and Jaycox, 2008; Cesur, Sabia, and Tekin, 2013). Military veterans also face lower wages than civilian co-workers (Hansen and Weisbrod, 1967; Hosek and Sharp, 2001), as well as substantial education and skills gaps (Angrist et al., 1989). The families, friends, neighbors, and co-workers of soldiers feel the costs of service most acutely (Gartner and Segura, 1998). In communities with large numbers of veterans, the cumulative effects of these consequences can last decades (Goldin and Lewis, 1975). Communities would rather avoid sending their residents to fight, fearing these “lost” generations (Winter 1977).
Knowing this, politicians will manipulate the costs of war associated with military service. In most democratic societies, elected officials and their appointees have influence over who serves and in what capacity. The decision of whom to send to fight is therefore a political one; everyone wants to avoid having their community suffer the consequences of military service, but somebody has to serve. If governments are not victorious in war, they are likely to lose office. As the costs of war mount, they face pressure from the voters bearing those costs, and this pressure has the potential to impose high electoral costs and force them, and their co-partisans, out of office (Carson et al., 2001; Kriner, 2006; Kriner and Shen, 2007) Governments are constrained not just by the need to win the war, but by electoral calculations. Given these competing incentives, how do governments extricate themselves from this dilemma?
Who Fights, and Who Votes
Politicians therefore try to both maintain their electoral majority and win the war, by using discretionary war-fighting powers to shield some voters from military service. While politicians should conscript able-bodied individuals to fight based upon their ability to support the war effort, there are strong incentives not to do so. Because the effect of military service on public opinion is localized, citizens who do not personally experience the losses associated with military service may continue to support the government. Thus, governments attempt to maintain electoral majorities by protecting crucial swing voters.
The intensity at the onset of the war itself is unrelated to this process; a democratic government should manipulate the costs of war along partisan lines, in both small and large wars. Voters who pay these costs will still have incentives to vote out the government, and governments will still need to maintain an electoral majority. For example, research has shown that in both the Vietnam conflict and the second Iraq war, Black soldiers and lower-class soldiers experienced disproportionate casualties (Kriner and Shen, 2010).
Our argument begins with three assumptions. First, most individuals would prefer not to take on the costs associated with military service; even those citizens most supportive of the war effort would prefer it be won without the risk to their own lives. Second, we assume the central government can coerce individuals to serve. In other words, the decisions about who serves and who does not serve are largely a function of government policy choices rather than individual choice. Third, we assume that the central government is interested in retaining power, and therefore that the government desires the war to be fought as efficiently as possible.
Unlike the other costs of war, democratic governments may determine who serves in the military, and in what capacity. Since the easiest way to prevent soldiers from dying in war is to stop them from enlisting, manipulating conscription policy is the best mechanism to protect their electoral majority. Although systems of conscription vary, most governments have discretionary powers to defer or exempt groups from military service. For example, during the Vietnam conflict, the Johnson administration established a sweeping set of deferments designed to cause as little disruption to civilian life as possible. (Baskir and Strauss, 1978). These deferments were criticized for their disproportionate benefits to the wealthy and well connected. Governments routinely extend deferments for a wide variety of reasons, related both to the war effort and domestic politics. Deferments are common practice, and often uncontroversial, and are routinely extended to religious minorities, conscientious objectors, university students, and employees of industries deemed essential to the war-fighting effort (Flynn, 1993).
Draft deferments, a relatively crude instrument, only explain part of the story. They allow democratic governments to protect large groups of otherwise eligible citizens for politically advantageous reasons, but they do not allow for the precision needed to effectively maintain an electoral majority. This precision can instead be achieved through the bureaucracy that carries out the draft process.
The logistical demands associated with conscripting millions of soldiers are extraordinary, and implementation varies widely. Governments may centrally manage conscription or delegate ground-level conscription responsibilities to local bodies. We argue that more centralized systems invite more oversight and therefore give political governments less control to manipulate conscription. Centralized systems are far more efficient in that they can speedily enlist more soldiers from across the country. Yet they have drawbacks as there are fewer opportunities for governments to manipulate inefficiencies for electoral purposes. This is due to the fact that centralized systems are more easily overseen by regulatory or legislative bodies beholden to the public (Gordon, 2011; Gordon, 2009; Rogowski, 2016).
Delegation is inefficient, but has political advantages; inefficiency obfuscates the process by which the central government can protect swing voters. Central governments can overlook underperforming localities from electorally valuable areas, and the arbitrary nature of quotas is less obvious to the voting public (Gordon, 2011; Gordon, 2009; Rogowski, 2016). Decentralized systems allow governments to take advantage of inefficiencies to benefit clusters of swing voters. Since voters are often categorized into swing and non-swing entities (Flynn, 1985; Johnston, Manley, and Jones, 2016), decentralized, inefficient government conscription policies can aid politicians in achieving their short-term electoral goals during times of war.
For example, in the United States (1865–1973), draft-eligible citizens were required to register with a local draft board. These boards were composed of local elites, thought to be good judges of individual circumstances, who would make fair decisions. While the central government conducted rigorous oversight of these boards and pushed them to meet quotas, boards had broad discretion over enlistments (Broad, 2006; United States Congress, 1969). 2
Decentralized conscription policies work to the advantage of democratic governments through two mechanisms. First, politicians can target certain areas with disproportionate quotas, relative to population. It is important to note that such politically advantageous manipulation of conscription will occur at the margins. Blatantly “unfair” quotas are both politically unpalatable and unsustainable over an extended period of time (Flynn, 1998; Levi, 1996).
Second, democratic governments may selectively use oversight capabilities to follow-up with local draft boards and ensure quotas are met. For example, draft boards in swing regions could receive lenient treatment from the central draft agency, while other draft boards may be subject to repeated follow-up and punitive oversight. Often, this process occurs without an official record to instruct bureaucrats. We offer two justifications for the lack of written documentation on conscription policy manipulated for partisan reasons. First, no reasonable government official would ever put pen to paper to document electorally based conscription as an official policy. Second, careers of political appointees are linked to the party’s electoral success; they will have strong self-preservation incentives even in the absence of directives from superiors. Therefore, our mechanism holds in the presence of either a top-down directed effort, or a “grassroots” effort from local elites to protect the party.
To summarize our argument, democratic governments realize that the costs of war will imperil their political survival, and subsequently distribute these costs away from supporters essential to maintaining power. Since the highest costs of war are associated with military service, governments are especially keen to direct these costs away from these critical supporters. Democratic norms suggest that wartime sacrifice should be evenly spread throughout society, therefore a government’s ability to do this is dependent on the military labor acquisition system. Decentralized systems of conscription allow for less bureaucratic and political oversight. Ultimately, this should enable governments to more effectively distribute the costs of military service away from communities on which governments depend for electoral success.
The implications of our narrative are simple: swing entities should receive relative protection from conscription during the war. From this theory we derive two hypotheses:
To understand how decentralized military labor acquisition policy enabled politicians to manipulate the draft for electoral ends, we examine the case of the United States in World War II. We show that President Roosevelt and the Democratic party strained to hold together the tenuous and fluid New Deal coalition. Large segments of the coalition were previously reliable Republican voters, or had flirted with voting Republican in the recent past. The Democratic party could not hold Congress in the 1942 elections, or secure Roosevelt’s presidential re-election, without ensuring the continued support of these voters. At the same time, the United States needed millions of enlistees to simultaneously fight against Japan, Germany, and Italy, across four continents. This next section describes how the conscription system may have guaranteed Democratic control of power by keeping New Deal voters from military service.
Conscription in the United States
Historically, the US was hesitant to use conscription. 3 In 1940, Democratic leaders realized they needed to quickly raise a large army, anticipating involvement in the war despite public opinion remaining steadfastly opposed to intervention. Further, many politicians feared that implementing a national conscription system would have severe political ramifications. 4 Thus Congress passed the Selective Training and Service Act, designed and established by the previously unknown “Joint Army-Navy Selective Service Committee” (Flynn, 1985). This Act provided the funding and bureaucracy required to increase the size of the Army from less than 250,000 to 1.4 million at the time of the attack on Pearl Harbor a year later (Flynn, 1993).
The SSS was directly overseen by the president and run by Brigadier-General Lewis Hershey. The president, through the SSS, could authorize the number of conscripts needed from each county and establish deferments for specific social or economic classifications (Flynn, 1993). To carry out their task the SSS established 6400 local draft boards, with a minimum of one board per county, each capped at 8500 registrants. The draft boards were comprised of local civic leaders whose nominations were approved by the SSS. When state leaders attempted to engage in behavior that ran counter to national mandates or went to the press with their complaints, they were quickly removed (Flynn, 1985).
The government had considerable discretion determining who served. Conscription was highly politicized; Congress and powerful interest groups lobbied the SSS for preferential deferments (Chambers, 1987; Flynn, 1985). There is strong evidence that members of Congress routinely put pressure on government agencies; the SSS received an estimated 250–1000 Congressional requests per week during the war and would have been most responsive to members in the majority party (Flynn, 1985). To exemplify this pressure, Representative Francis Case (R-SD) argued in floor debate: A letter comes from a Nebraska farmer. He is a Democrat. Three times he has voted for the President and was [a] vigorous supporter of his pre-Pearl Harbor policies...He writes: “[Hershey] hasn’t the guts to tell Congress that he is increasing our quotas 50 percent, 100 percent, to 150 percent. He alone is to blame. Every time we meet to reclassify it is because we are compelled to take deferred men out of this class and place them in 1-A in order to fill his quotas.“ (Congressional Record, 1942, p.7569-70)
While there was strong pressure on the president to ensure the draft gave the appearance of fairness, the president granted deferments to wide swaths of the population. 5 The political pressures on the president to achieve re-election, and retain control of Congress, means that it is very possible the government protected swing voters by shielding them from the draft.
The predominance of the SSS in forcing compliance meant that political leaders could selectively influence where and when the SSS exerted pressure. Draft boards had wide latitude to make decisions regarding who would serve. The board’s decisions could be reversed by an appeals process, and failure to comply with the SSS could result in severe punishment. Throughout the war, most boards were compliant with the demands of the SSS (Flynn, 1993).
In return, the SSS selectively permitted discretionary decision-making of these boards. In spite of the fact that the SSS remained relatively popular, there was a widespread and persistent perception of inequities that nobody—outside of the SSS—had the means to properly identify. 6 It is important to note, then, that General Hershey gave the following advice to SSS employees: “I do advise you to not leave a lot of memoirs on what you did. If you make decisions, you will not have time to justify them.” (Flynn, 1985, p. 189).
To obtain a better understanding of the operations of the SSS, we visited the United States Archives and obtained hundreds of documents on the SSS. 7 Analysis of these documents reveals that the SSS was highly attuned and responsive to politics and public opinion, both locally and nationally. The SSS was in a tenuous position; there were strong advocates for either an all-volunteer force or universal conscription. To gauge public support for the draft, SSS staff tracked articles and books that mentioned the Selective Service, as well as polling on the topic. They kept track of newspapers as small as the New London Day in Connecticut and the Hazelton Standard Sentinel in Pennsylvania. At the national level, the SSS sought to build relationships with influential political and economic elites. The SSS hosted events including cocktail parties and an annual birthday ball for President Roosevelt. Additionally, SSS officials had ties with high-powered advertising executives, whose job was to manage the agency’s public image. The SSS was clearly aware of its risky position, attuned to domestic politics, and susceptible to manipulation by political elites (National Archives and Records Administration. 2020).
The New Deal Coalition and World War II
President Roosevelt and Congressional Democrats won power alongside an ascendant Democratic coalition that reshaped American politics for 30 years. In addition to Southerners, urbanites, Catholics, and immigrants, the Democratic party added Black voters, Midwestern farmers, labor unions, and industrial workers (Sundquist, 2011). By 1940, however, that coalition was showing signs of strain: some of the newer voting groups in the coalition were starting to turn back towards the Republicans, while tensions over civil rights in the South threatened another segregationist “bolt” from the party, as it did in 1928 (Carlson and Franklin, 1964). Democrats were attuned to these issues and saw the maintenance of their coalition as the way to ensure continued Democratic government in Washington.
The outbreak of war threatened this coalition even further. Parts of the New Deal coalition petitioned to ensure deferments, including labor unions, Blacks, farmers, and religious minorities. When obtaining large deferments were not possible, members of the coalition abandoned the party; for example, isolationist-minded Midwesterners helped the Republican party gain 70 seats in the U.S. House of Representatives in the 1938 midterm elections, ostensibly to avoid the war altogether. Democrats in Washington had to keep the New Deal coalition together long enough to secure re-election, but also win the war. The fact that the plans put forward to achieve this objective depended upon enlisting 9 million Americans, was not appealing to the President. Roosevelt feared that if the costs of the sacrifice needed were known, it would bolster isolationist sentiment within the US (Todman, 2016).
Therefore, the government established a conscription policy that would provide for the military labor needs of the war while also minimizing the damage to the New Deal coalition. This was accomplished through two mechanisms. First, the administration would demand and tolerate lower than average enlistment numbers from swing counties. Second, they would create a system of exemptions and deferments that were likely to disproportionately benefit voters in swing counties. 8
Fortunately for the Democratic party, blocs of swing voters were easily identifiable, allowing the SSS to both mobilize for war and aid in re-election. The party was attuned to conditions “on the ground” across hundreds of localities throughout the country. In the 1930s and 1940s,
American political parties were organized with the county as its foundational unit (Frendreis, Gibson, and Vertz, 1990; Cotter et al., 1989; Seligman, 1961). These local parties recruited candidates, administered campaign materials, fundraised, and mobilized supporters on Election Day. The Democratic party relied not only on public opinion polls but on state and local party chairs to identify swing voter groups, blocs of voters that might be straying from the party, and potential solutions.
Since parties were organized at the county level, and draft boards were also organized at the county level, our mechanism is as follows. High-ranking Democratic party officials working in the Roosevelt administration helped set quotas for each draft board across the country; many boards failed to meet their quotas. At the same time, news of citizens disgruntled with perceived unfairness in the administration of the draft would percolate from county party leaders to the national Democratic party. Then, the Roosevelt administration and Congressional Democrats had the discretion to determine which draft boards would be pressured to meet quotas, and which would not.
This mechanism should be most evident in election years. Voters will remember proximate rather than distant events, and vote accordingly. If large numbers of residents of swing counties are conscripted, their relatives might vote against Democrats. But in 1943 and 1945, without the pressure of imminent elections, the party faced fewer pressures from their swing voters. The Roosevelt administration could fill the ranks of the military with soldiers from the tenuous parts of the New Deal coalition and worry less about the costs of service reducing their popularity. This would be especially true for 1945, as the Allies had largely won the war and newly enlisted soldiers would see little combat.
Thus our hypotheses expect fewer enlistments from swing counties throughout the course of the war, and particularly in election years.
Data
Our unit of analysis is the county-year, comprising 15,575 observations across 3115 counties, 1941–1945. 9 Each observation corresponds to the proportion of enlisted soldiers during that county-year. We match these data with county-level voting data averaged across three presidential elections, 1932–1940 (Haines et al., 2005). Additionally, we obtain county-level covariates from the 1940 Census (Dodd and Dodd, 1973). By combining these disparate data, we are able to explore whether leaders manipulated conscription policy along partisan lines.
Dependent Variables
We operationalize our dependent variable using a novel, original dataset comprising 9.2 million enlisted US Army service-members during the Second World War (National Archives and Records Administration. 2017).
10
These data contain the serial numbers, full name, state and county of residence, state of residence, date of enlistment, place of enlistment, year of birth, race, level of education, civilian occupation, marital status, height, and weight for each enlistee.
11
We aggregate each service-member’s information to the county-year. Our primary dependent variable is a county-year count of enlistees as a proportion of population, such that
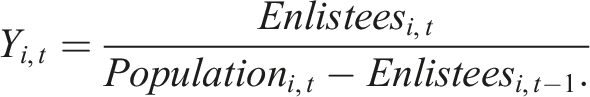
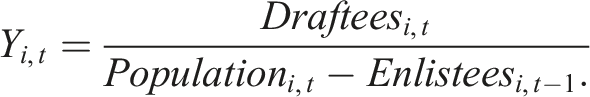
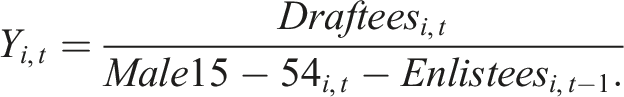
Subtracting the previous year’s enlistees confirms we do not “double-count” them: enlistees typically served multiple successive years. To overcome concerns that any particular construction of our dependent variable drives results, we also include three additional specifications of the dependent variable, as seen below:

Summary Statistics, Covariates. Each Observation Represents a Single County for a Single Year.
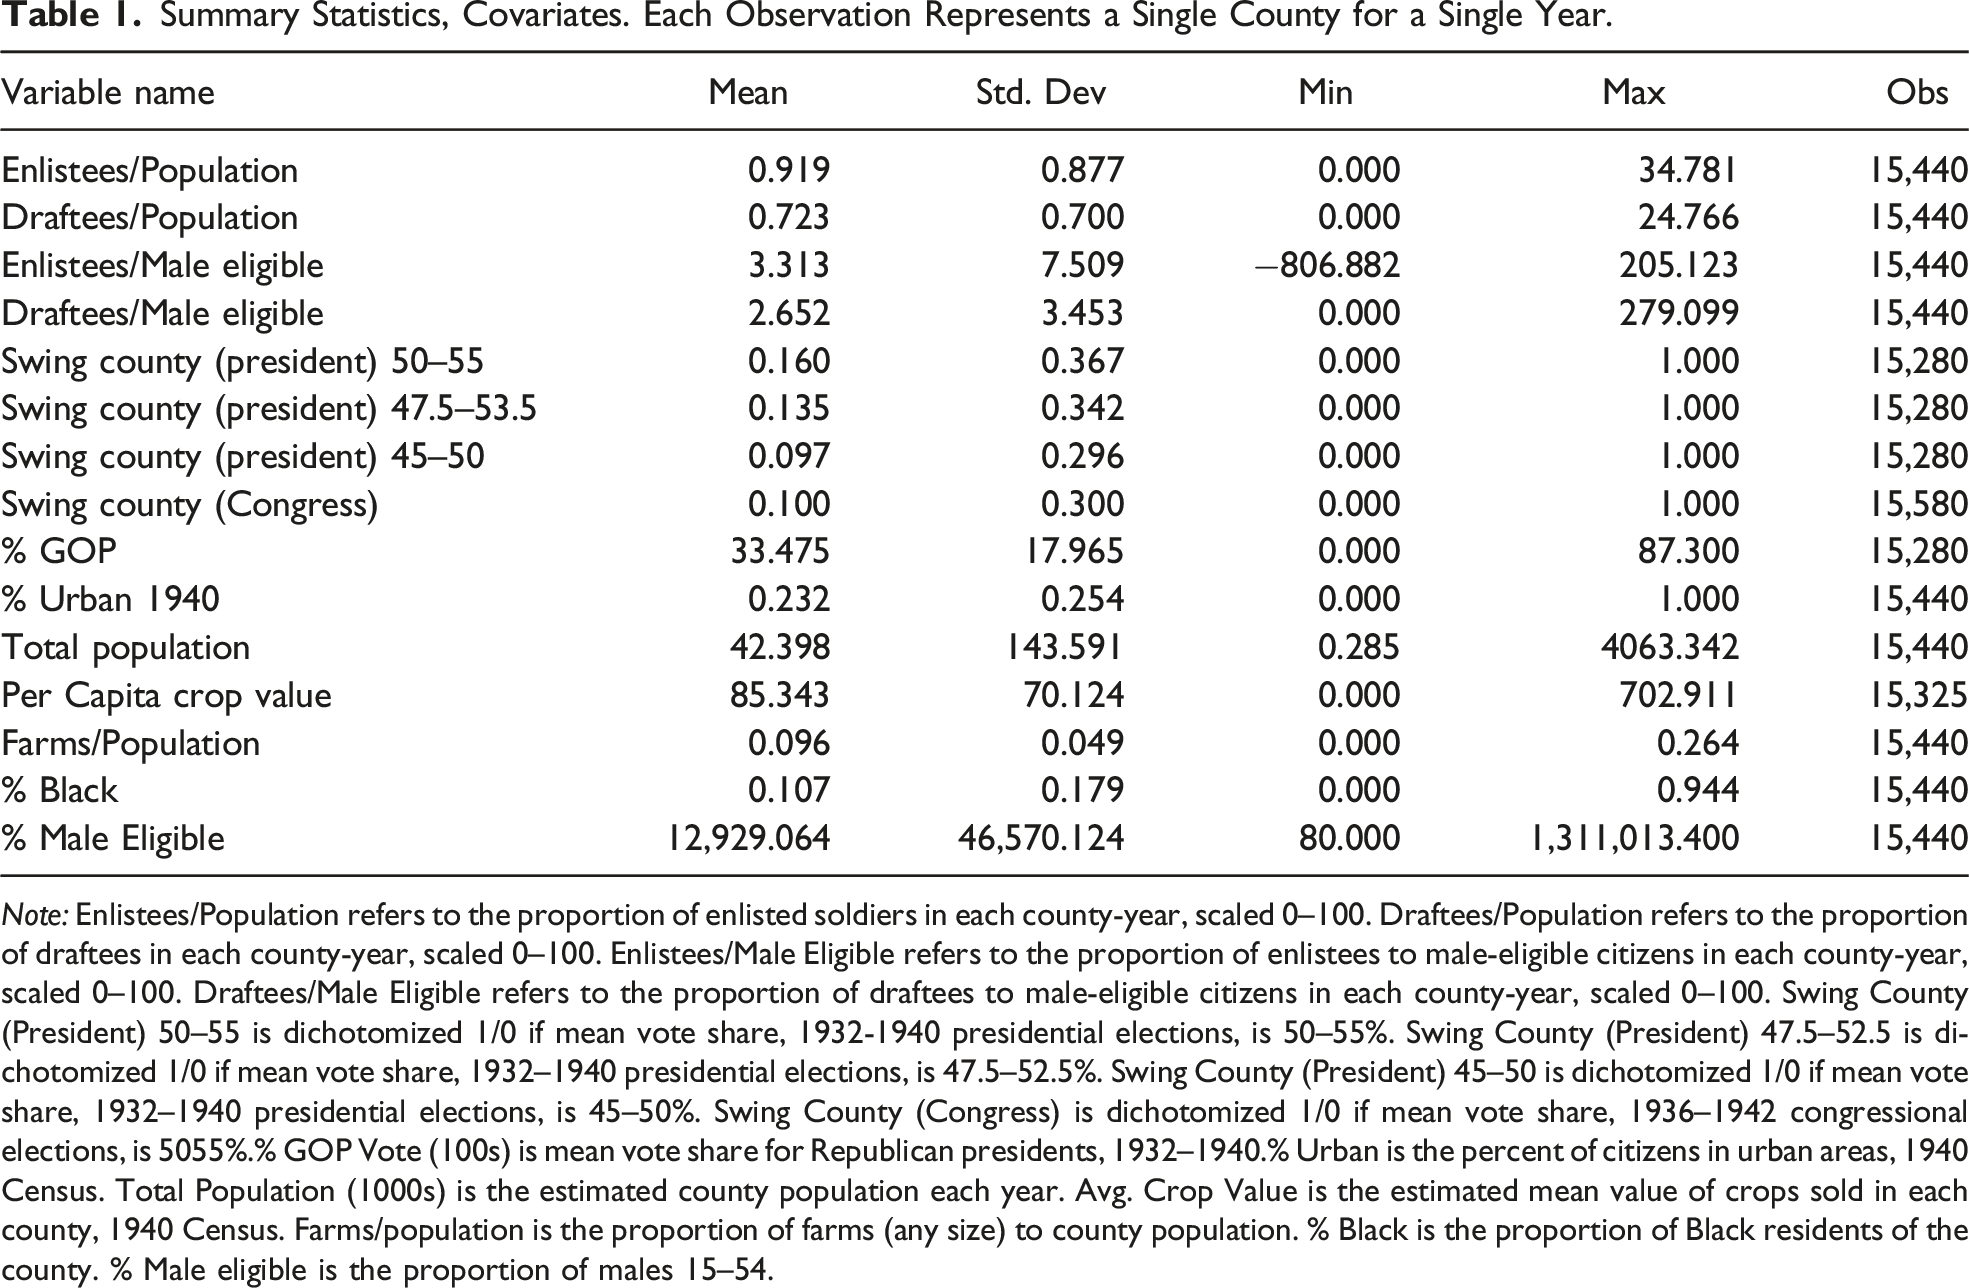
Note: Enlistees/Population refers to the proportion of enlisted soldiers in each county-year, scaled 0–100. Draftees/Population refers to the proportion of draftees in each county-year, scaled 0–100. Enlistees/Male Eligible refers to the proportion of enlistees to male-eligible citizens in each county-year, scaled 0–100. Draftees/Male Eligible refers to the proportion of draftees to male-eligible citizens in each county-year, scaled 0–100. Swing County (President) 50–55 is dichotomized 1/0 if mean vote share, 1932-1940 presidential elections, is 50–55%. Swing County (President) 47.5–52.5 is dichotomized 1/0 if mean vote share, 1932–1940 presidential elections, is 47.5–52.5%. Swing County (President) 45–50 is dichotomized 1/0 if mean vote share, 1932–1940 presidential elections, is 45–50%. Swing County (Congress) is dichotomized 1/0 if mean vote share, 1936–1942 congressional elections, is 5055%.% GOP Vote (100s) is mean vote share for Republican presidents, 1932–1940.% Urban is the percent of citizens in urban areas, 1940 Census. Total Population (1000s) is the estimated county population each year. Avg. Crop Value is the estimated mean value of crops sold in each county, 1940 Census. Farms/population is the proportion of farms (any size) to county population. % Black is the proportion of Black residents of the county. % Male eligible is the proportion of males 15–54.
Independent Variables
In order to approximate how politicians perceived the tenuous constituencies in the New Deal Coalition, we operationalize a series of measures of swing-county voters. We obtain averaged and disaggregated county-level and state-level vote share for the Democratic party in presidential elections from 1932 to 194,0. 13 Additionally, we obtain county-level vote share for the Democratic party in House of Representatives elections from 1936 to 1942. In each instance, we create a series of measures of “swing” status to demonstrate the robustness of our findings to alternative explanations. Our theory explicitly argues that the conscription system is manipulated to protect tenuous supporters of the Democrats, not to try to win new voters; therefore, our primary swing-county measure is 50–55% Democratic. Dichotomizing this variable isolates swing counties for comparison to all other counties; our theory does not expect a 65% Democratic county would have fewer enlistees than a 64% Democratic county. Doing so also emphasizes the party’s perception of the vulnerable parts of the New Deal coalition. To relax this assumption, we produce swing-county measures of 47.5—52.5% and 45—50% averaged Democratic vote share; we produce these measures both for models using presidential vote share and models using congressional vote share.
Controls
We leverage a series of covariates that simultaneously influenced enlistment rates and the composition of the county electorate. 14 We report the summary statistics for our covariates in Table 1.
Our swing-county variable is dichotomous and therefore collapses a lot of information which might influence the rate of conscription; therefore, including a continuous measure of party vote share will show that our findings are robust to any alternate specification that might suggest a linear effect between the independent and dependent variables. As the US is a two-party system, the correlation between Democratic vote share and Republican vote share is almost perfect (−0.9898), therefore, we use averaged GOP vote share, to avoid readers confusing the swing-county and linear vote share variables.
The predominating class- and economics-based argument of enlistment remains valid; lower-class citizens are more likely to fight in conflicts initiated by upper-class elites. Thus we include controls for county urbanization rates and total county population. Because farmers received special deferments, we also include average crop values per county and the ratio of farms to population.
Our theory is also complementary to race-based accounts of wartime enlistment. We account for the number of Black residents in the county—the Democratic Party of Roosevelt was still not fully in favor of civil rights, and segregationists ran many administration posts. Thus we would expect that race may play a large role in enlistment.
Finally, we include a control for the proportion of men living in the county who were between 15 and 54 years of age, to account for the ratio of enlistment-aged men to total population.
Descriptive Findings
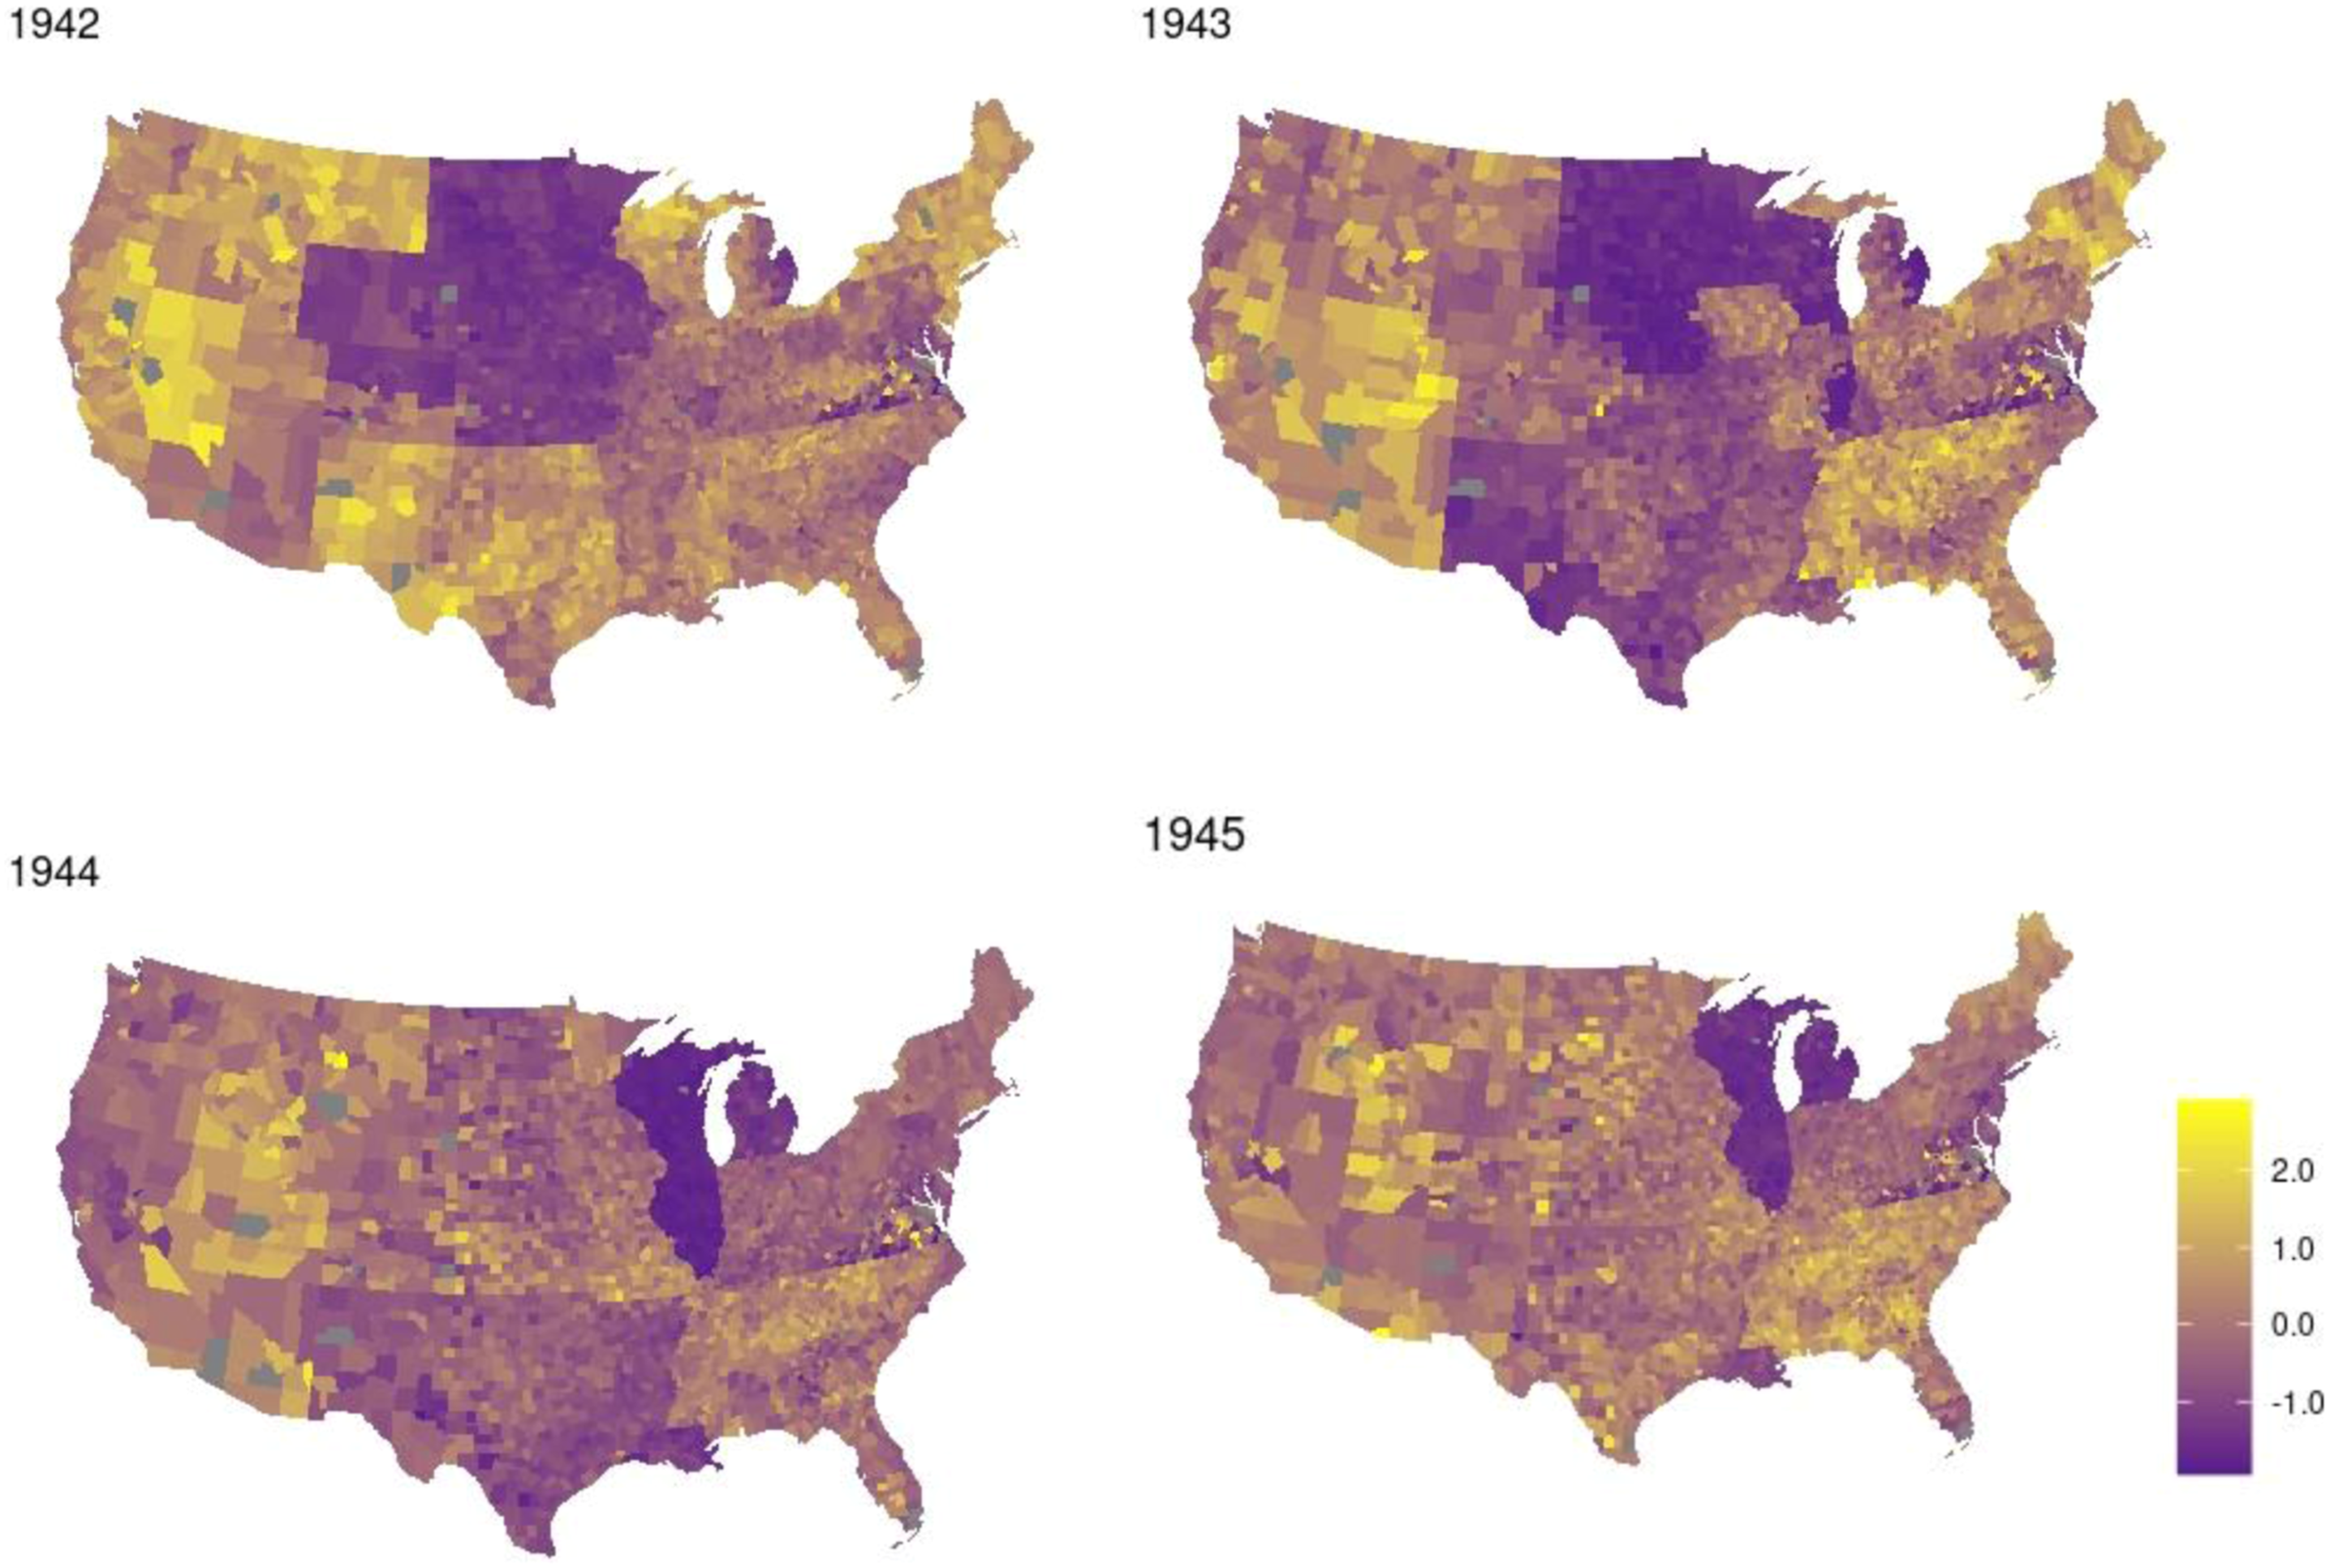
We first demonstrate descriptive evidence supporting our theory. In Figures 1 and 2, we map swing counties and conscription rates, 1942–1945. Figure 1 shows that most swing counties were in the Midwest, although many counties in the Northeast and Mountain West also swung between Democrats and Republicans. In Figure 2, the clear division in conscription rates along state and county boundaries is compelling evidence of political manipulation of the draft. In particular, the sharp contrast between the swing region of the Midwest—comprising the Plains and the industrial Great Lakes region—and the rest of the country is striking. The distribution of swing counties across the United States, averaged from the 1932, 1936, and 1940 presidential elections. Yellow indicates a swing county. Gray counties indicate electoral data missingness. Standardized distribution of enlistment across the United States, 1942–1945. Enlistment standardized within years. Darker purple indicates lower levels of enlistment, while brighter yellow indicates higher levels of enlistment.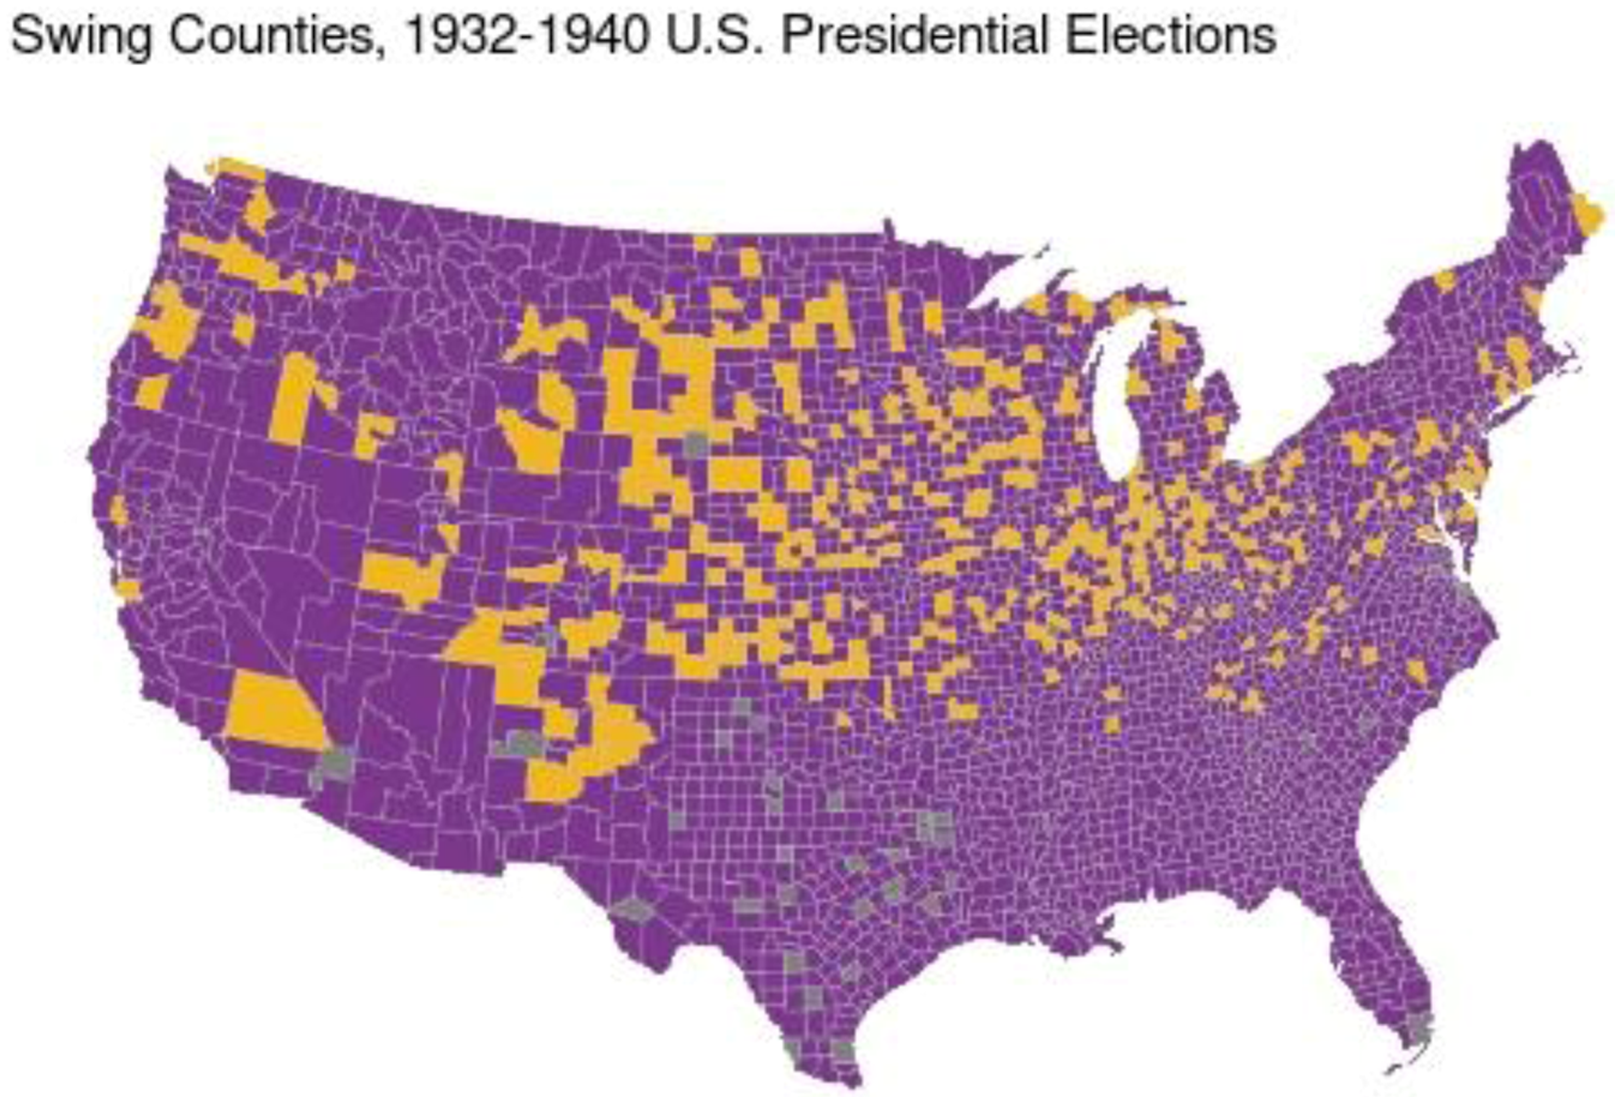
Analysis
In Figure 3, we report estimated swing-county coefficients from a series of ordinary-least squares (OLS) models.
15
We include election-interaction and year-specific models; this approach controls for variation in both war-fighting intensity and partisan trends. Impact of county partisanship on U.S. Army enlistment rates in World War 2. Full coefficient tables are reported in the Appendix.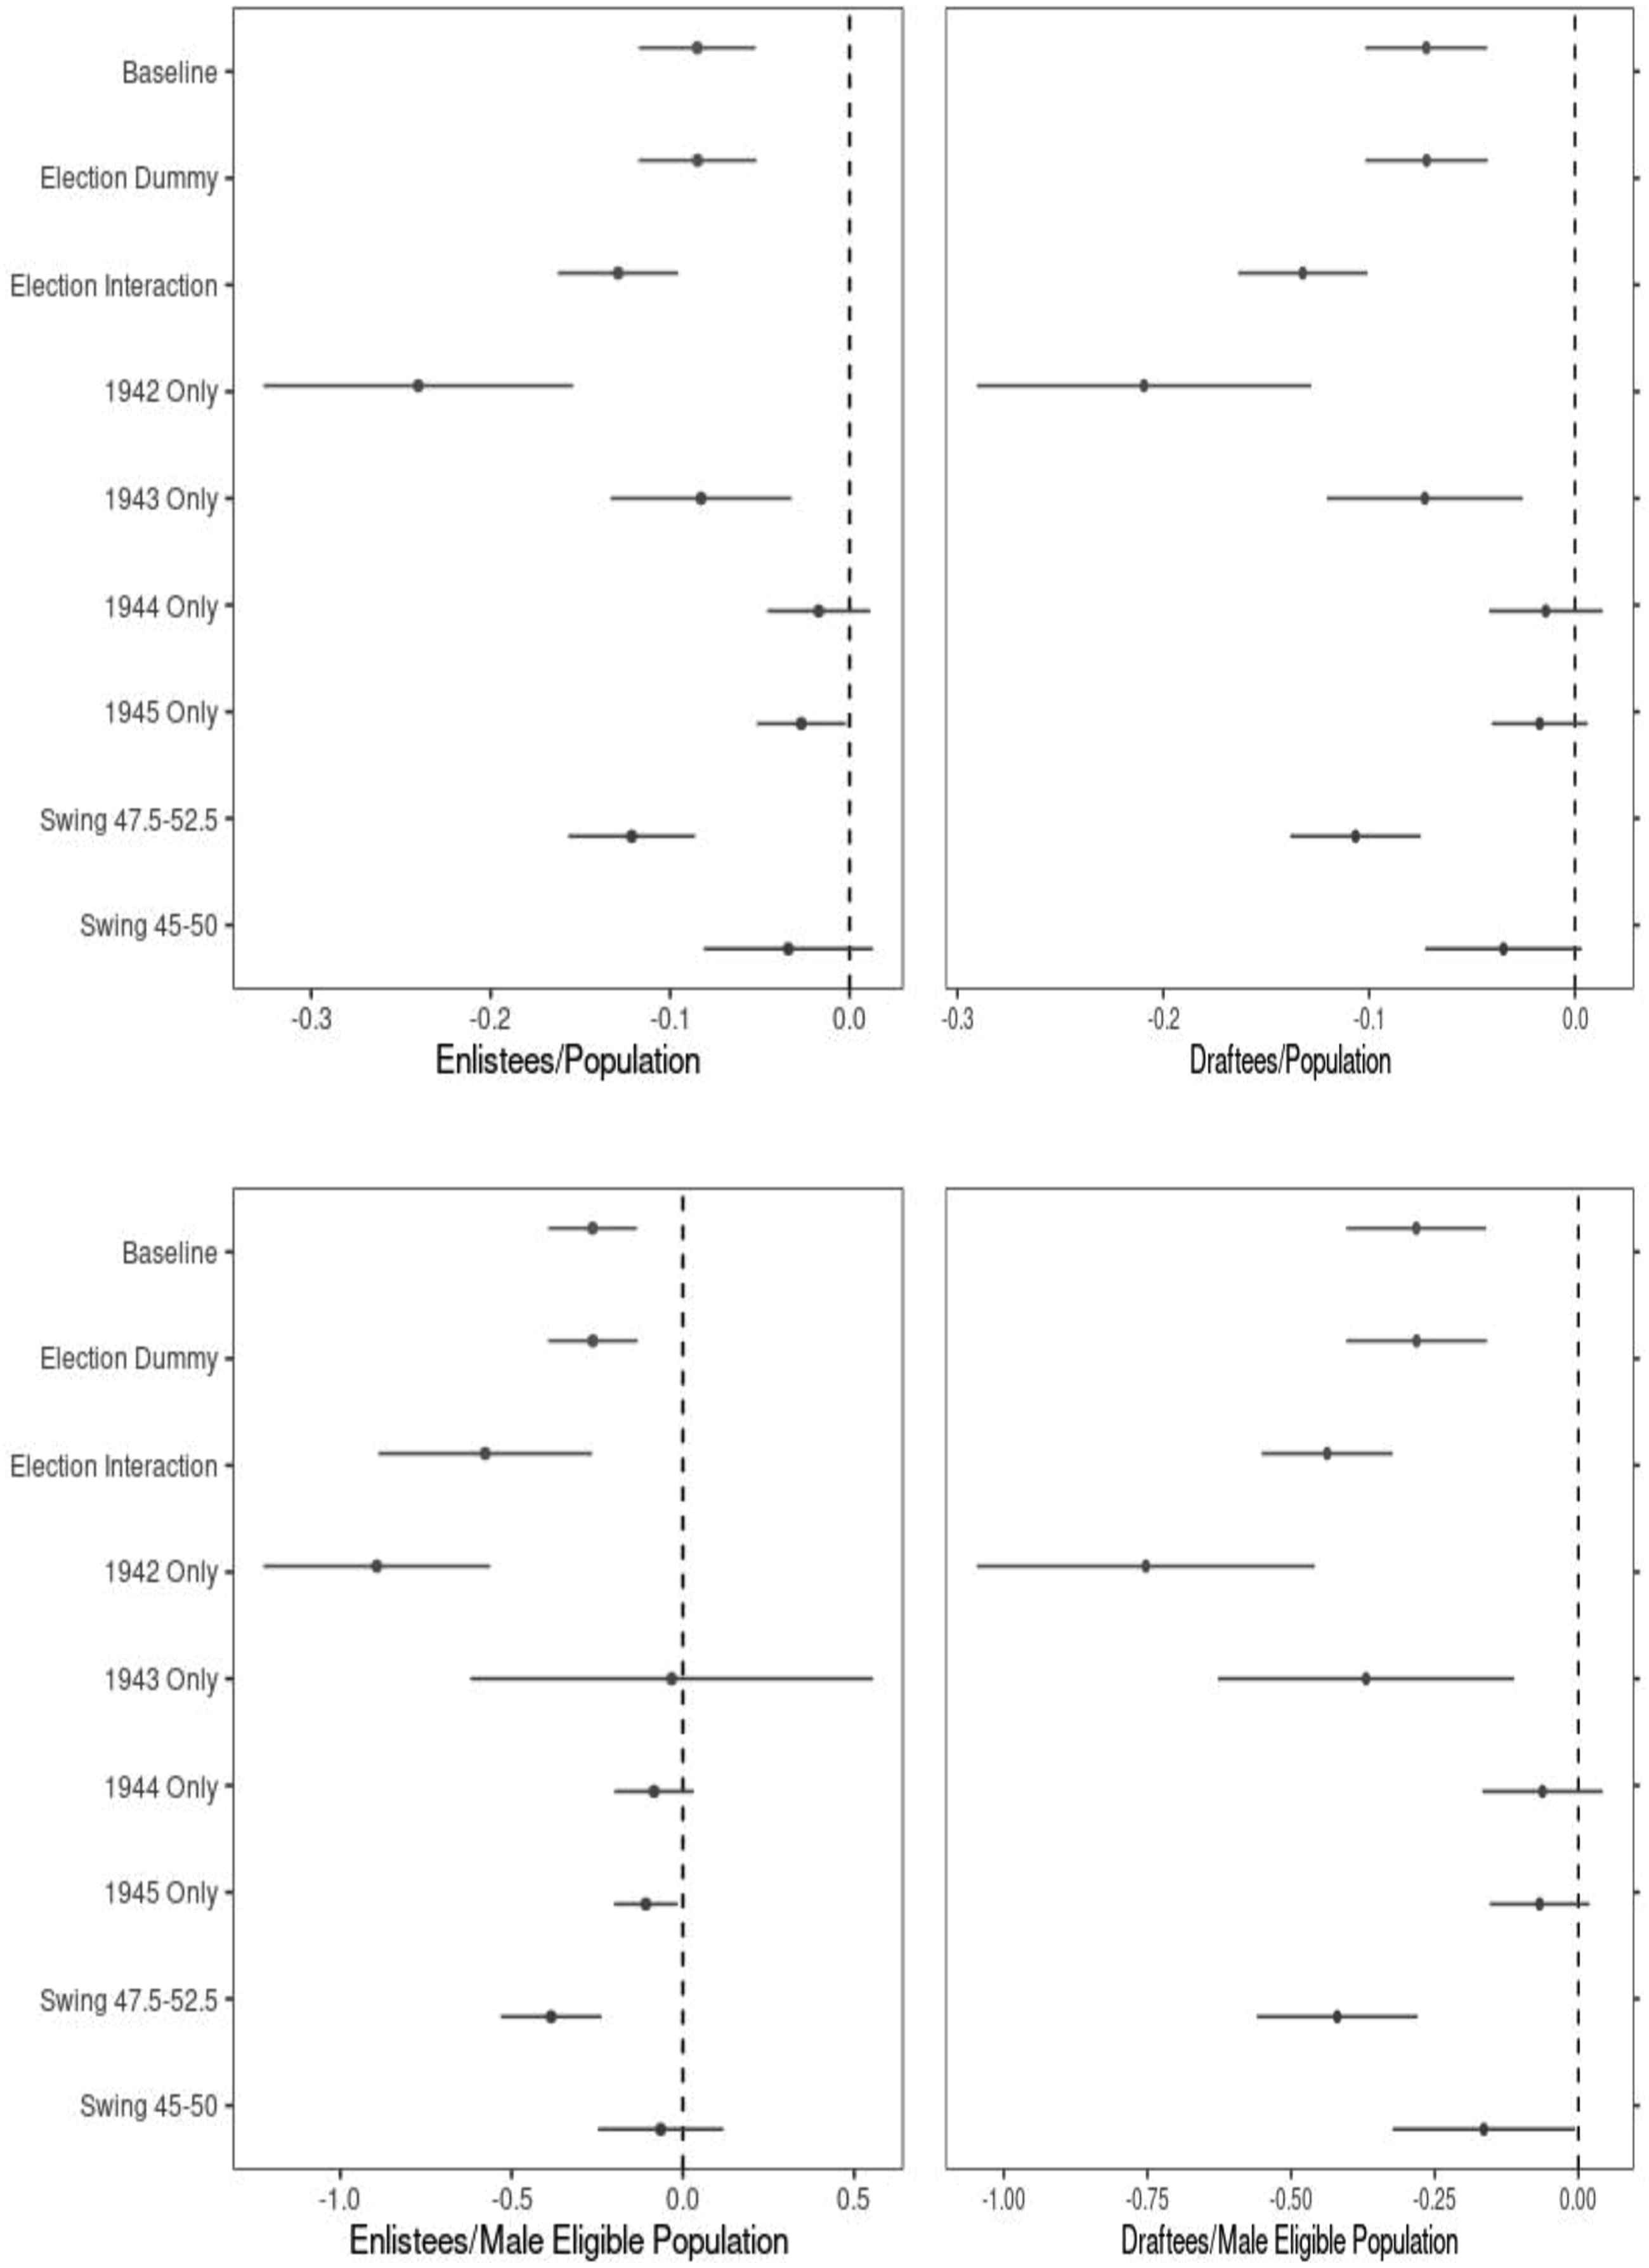
These analyses provide substantial evidence for our first hypothesis and limited support for our second hypothesis. All models report negative coefficients. Our baseline, election interaction, 1942 Only, and Swing 47.5–52.5% models are statistically significant across all specifications of our dependent variable. Substantively, we find that in the average county, 11.5 fewer individuals per year enlisted from swing counties compared to non-swing counties. Aggregated, across the length of the war, there were 139,000 fewer enlistees from swing counties than otherwise would be expected. This effect was largest in 1942, the first full year of the war; using our draftees/male eligible baseline model, we estimate that 36 fewer eligible individuals were drafted per county in 1942.
In Figure 4, we graphically present predicted values for swing counties from the Baseline and Election Interaction models using Enlistees/Population as the dependent variable, as the estimated magnitude of that coefficient is smaller than the other three. In the Baseline model, swing counties enlisted 0.84% of their enlistment-eligible residents per year while non-swing counties enlisted 0.95% of their enlistment-eligible residents. As we anticipated, President Roosevelt and the Democratic party had the incentives to engage in the manipulation of conscription for electoral purposes. Predicted values of proportion of enlisted eligible men.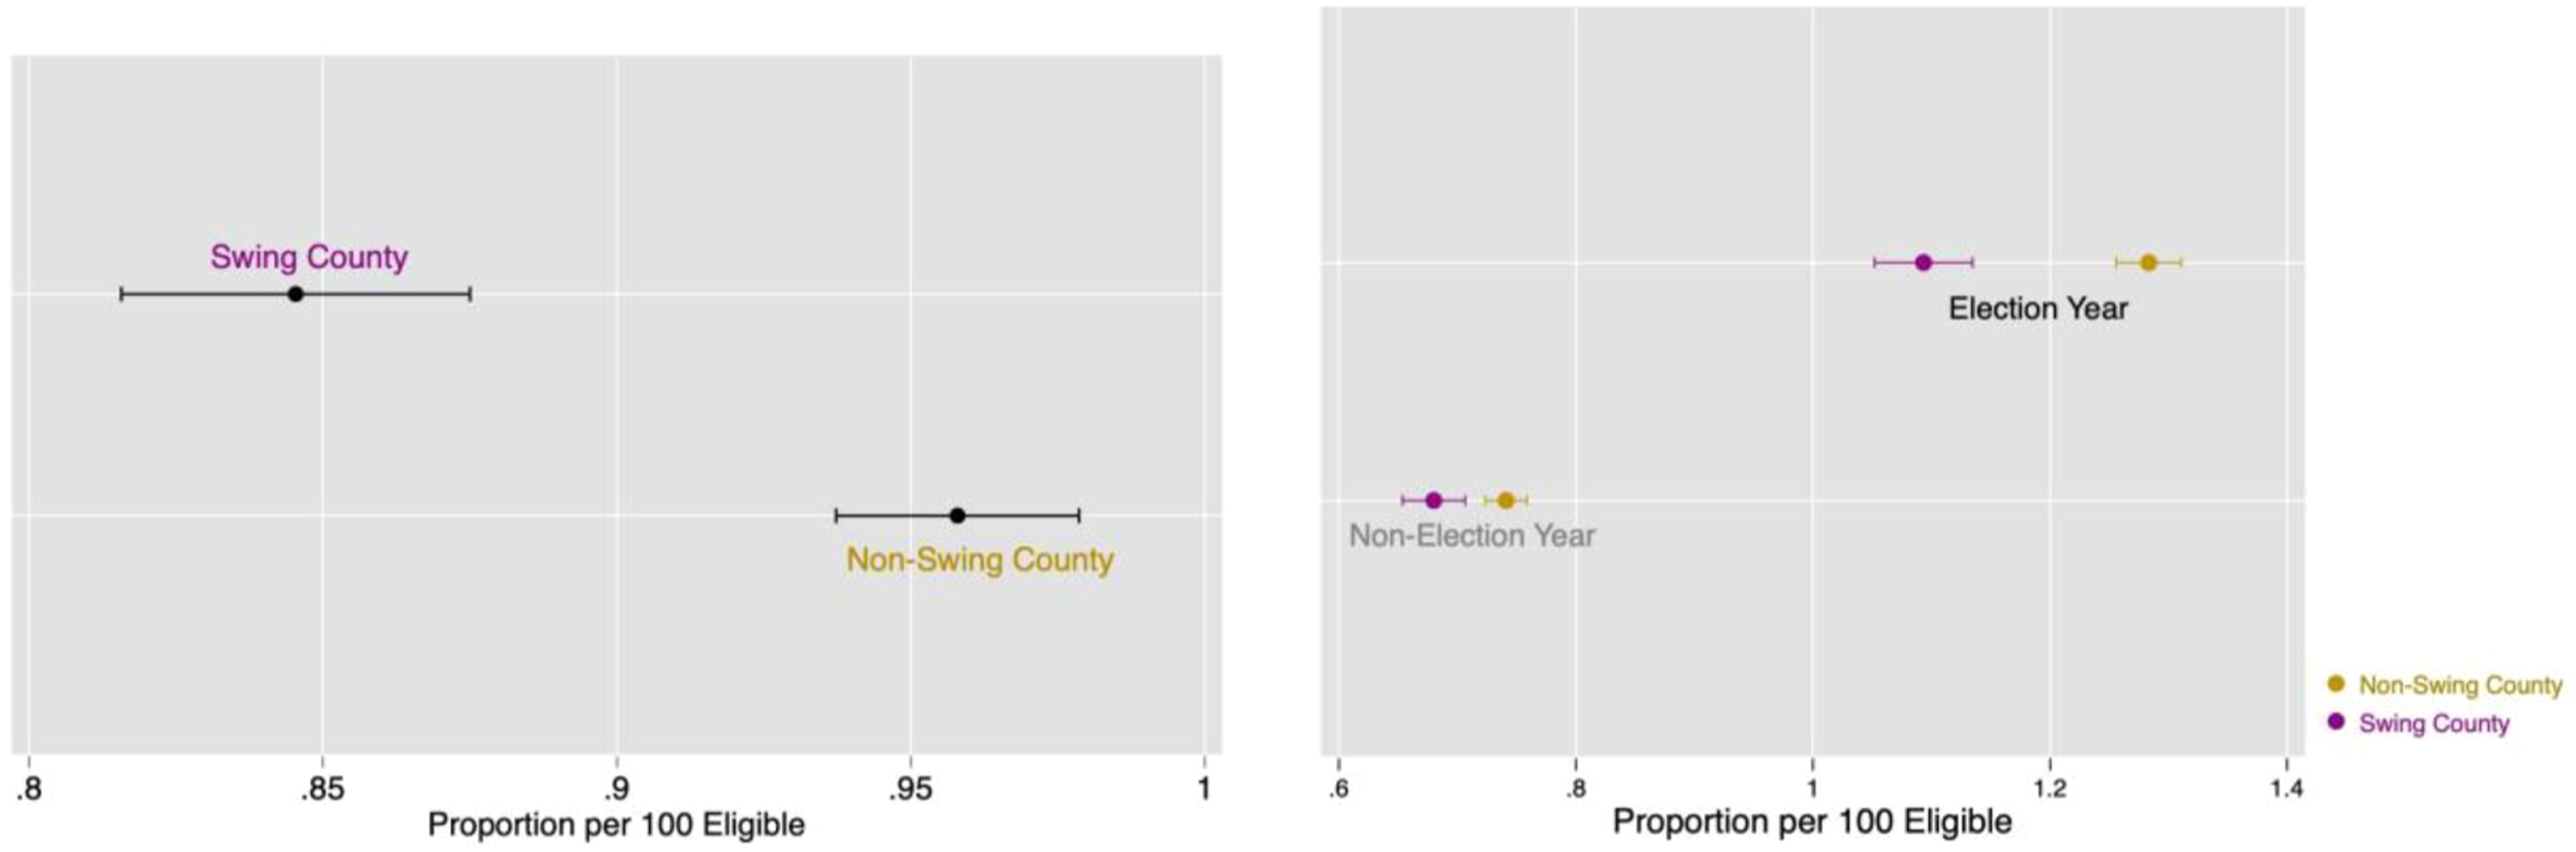
Our Election Interaction substantive effects are similar. We find that during election years the average county experienced a 1.6% increase in the number of citizens who enlisted in the military. Consistent with the null finding in the 1944-only models, the effect is largely driven by 1942, when Democrats fought to maintain control of Congress. Nevertheless, during 1942 and 1944, we estimate that swing counties had 106,000 fewer enlistments, compared to 27,000 fewer enlistments during 1943 and 1945.
Further, we disaggregate our results by year; these models permit us to see whether the effects of electoral politics on enlistment vary as the war went on. We find that the estimated effect is highest in 1942, the first full year of the war. We anticipate that the non-statistically significant effect in 1944 may be due to three reasons. First, the number of soldiers necessary for the liberations of France, Italy, the Philippines, and other military operations required the SSS to draw on untapped pools of potential enlistees. Second, the 1944 Presidential election—in which Roosevelt won 1.8 million fewer votes than in 1940 and the Republicans won the swing states of Ohio and Wisconsin—shows that there was substantial electoral cost. Third, perceptions that the war would soon be over may have contributed to the calculation of administration officials to enlist substantially from swing counties. This is further evidence that there were consequences for enlistment, but the events of the war may have outweighed electoral considerations.
Robustness checks
Archival evidence and our theory note that the SSS was decentralized to the county level, beholden to the president rather than Congress, and targeted swing voter blocs. It is possible that some state-level and Congressional political control existed outside the county and state-level party machinery, and that our theorized mechanisms imperfectly targeted swing voters. We estimate coefficients from a series of models that challenge our theoretical claims.
16
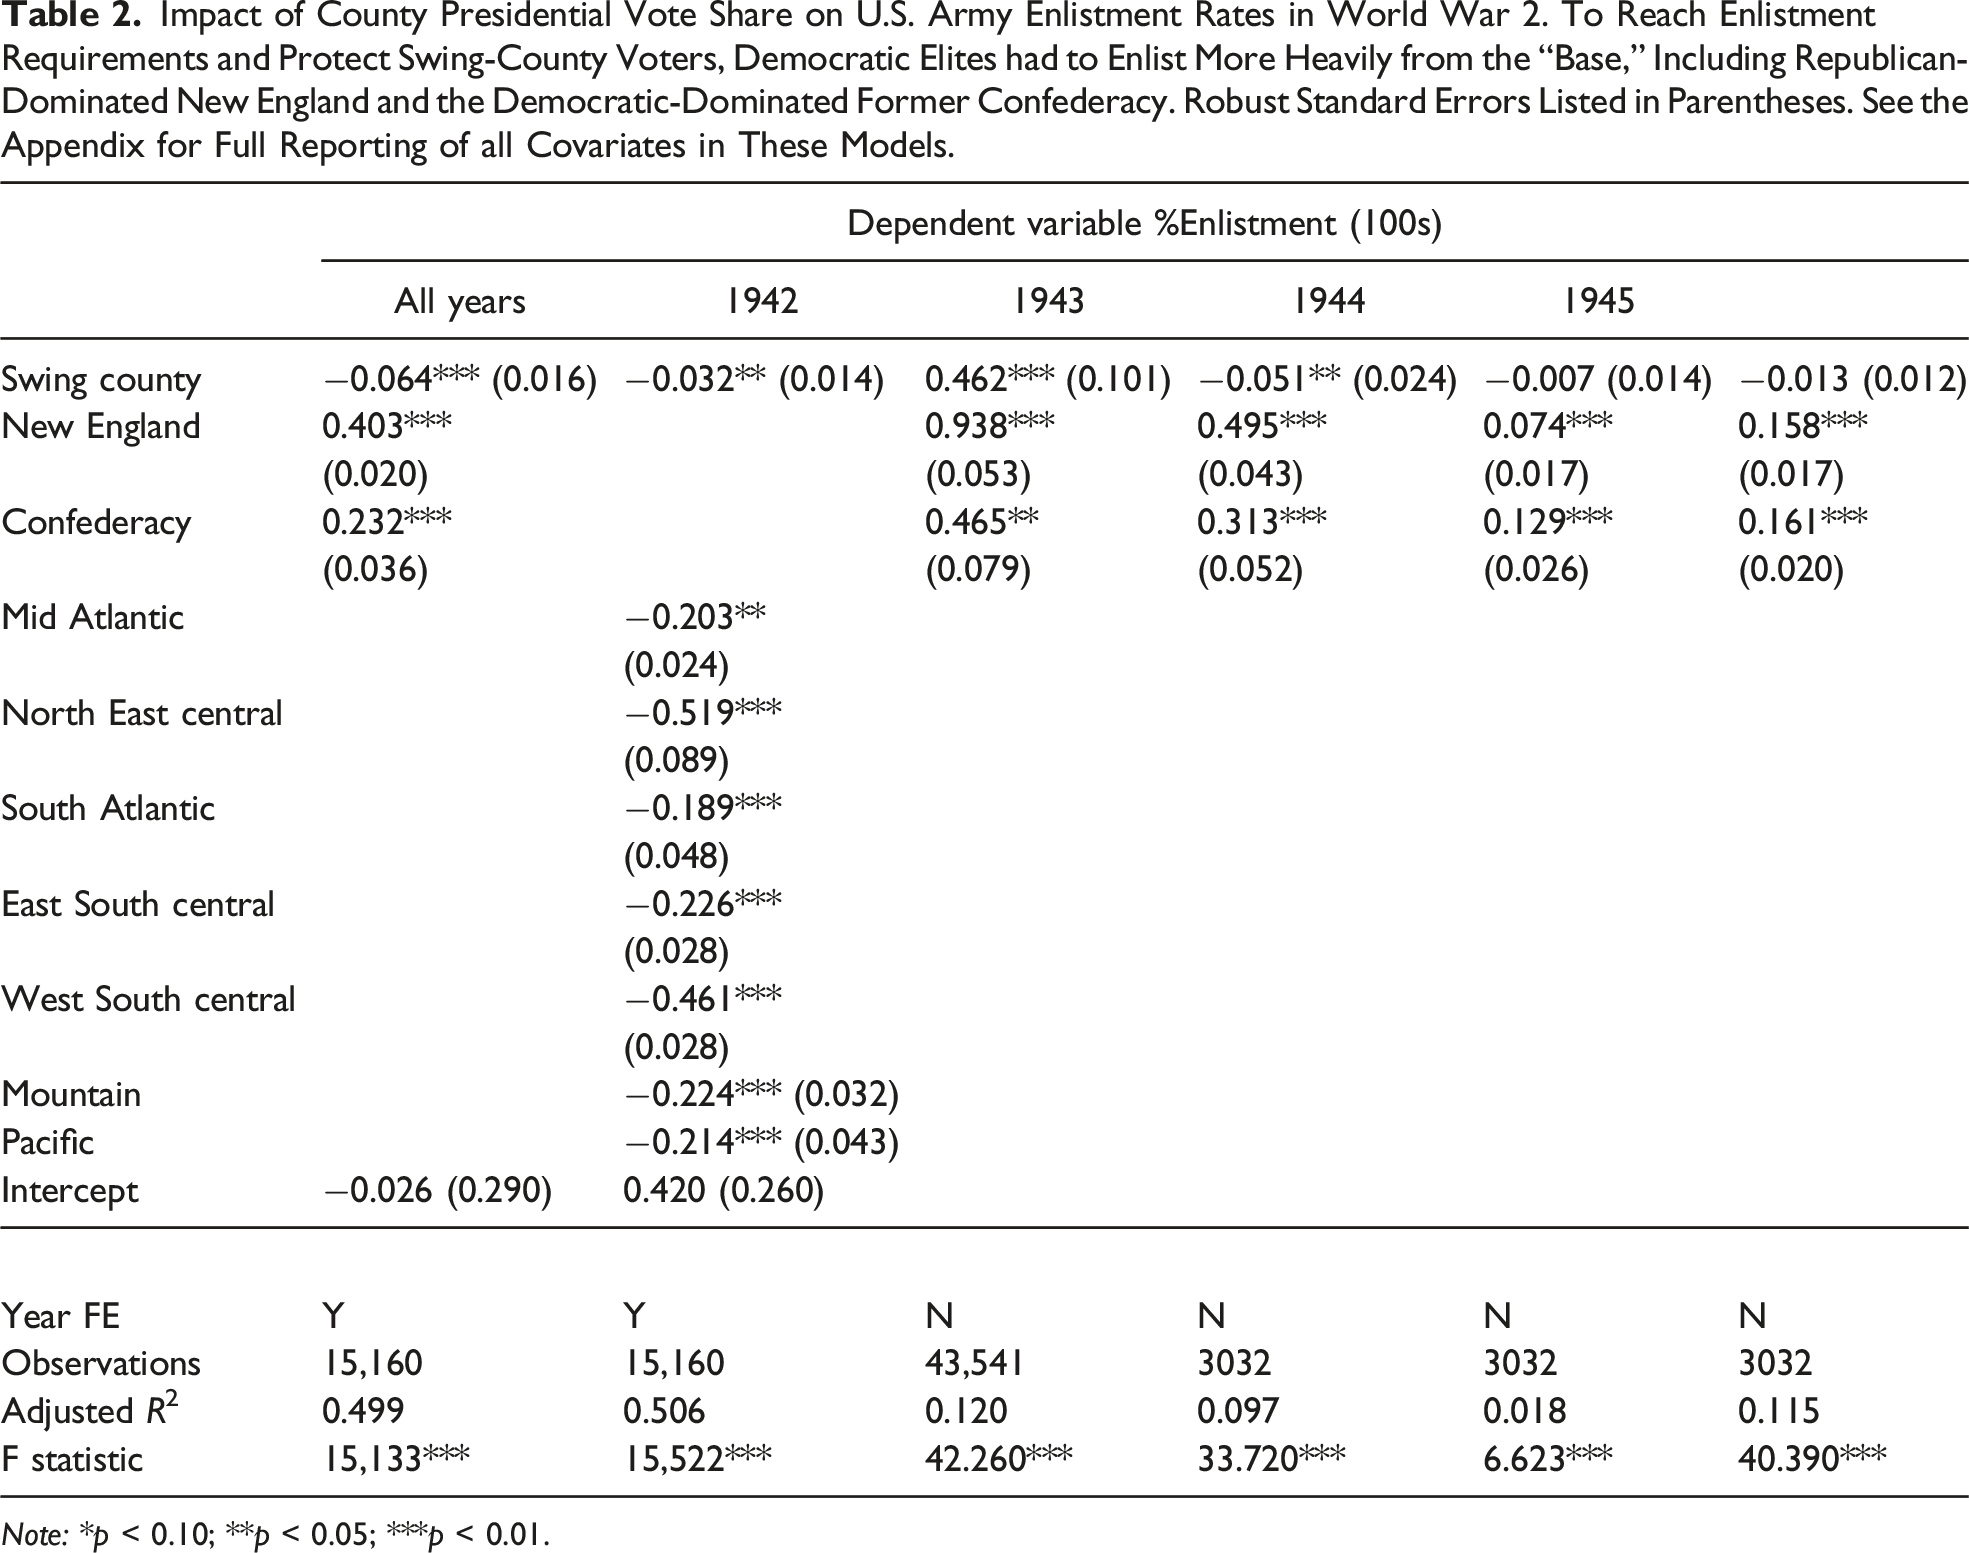
In all cases, our theory is robust to these alternate specifications: swing states (Figure 5) and vulnerable Congressional districts (Figure 6) had lower enlistment rates, swing counties near both sides of the 50% threshold had lower enlistment rates (Figure 7), and “base” regions of the country had higher enlistment rates (Table 2). Impact of state presidential vote share on U.S. Army enlistment rates in World War 2. Aggregation to the state demonstrates that our finding is robust to conceptions regarding “swing” and “safe” state electoral politics. Year and state fixed effects employed in all models, as are unit-clustered standard errors (95% confidence intervals). See the Appendix for full reporting of all covariates in these models. Impact of House of Representatives election results at the county-level on U.S. Army enlistment rates in World War 2. Exploring congressional election results demonstrates enlistment also protected vulnerable Congressional Democrats before, but not after, the 1942 midterm elections. Each model relates to different specifications of our “swing county” measure. Swing county-status reported on left-hand side; “Swing = 45-50% (1936)” indicates that we code a county as a swing county if the Democratic candidate for the House of Representatives received between 45 and 50% of the vote in the 1936 election. All models employ 1942 enlistment rates as the outcome, save models that explore 1942 election results; 1943 enlistment rates are used instead. 95% confidence intervals reported. See Supplement Appendix 4.1.3 for full reporting of all covariates in these models and 4.3.3 for full reporting using all four dependent variables. Placebo tests, bins (95% confidence intervals, two-way test). Placebo tests explore the effects of different specifications of swing-county status on enlistment status; these findings indicate that counties with between 48 and 54% Democratic vote share reported consistently lower enlistment rates, but not counties outside this zone. The “U”-shape to the plot on the left is consistent with a conscription scheme meant to protect swing voters, not base voters, while the plot on the right demonstrates the precision with which this scheme was implemented. Impact of County Presidential Vote Share on U.S. Army Enlistment Rates in World War 2. To Reach Enlistment Requirements and Protect Swing-County Voters, Democratic Elites had to Enlist More Heavily from the “Base,” Including Republican-Dominated New England and the Democratic-Dominated Former Confederacy. Robust Standard Errors Listed in Parentheses. See the Appendix for Full Reporting of all Covariates in These Models. Note: *p < 0.10; **p < 0.05; ***p < 0.01.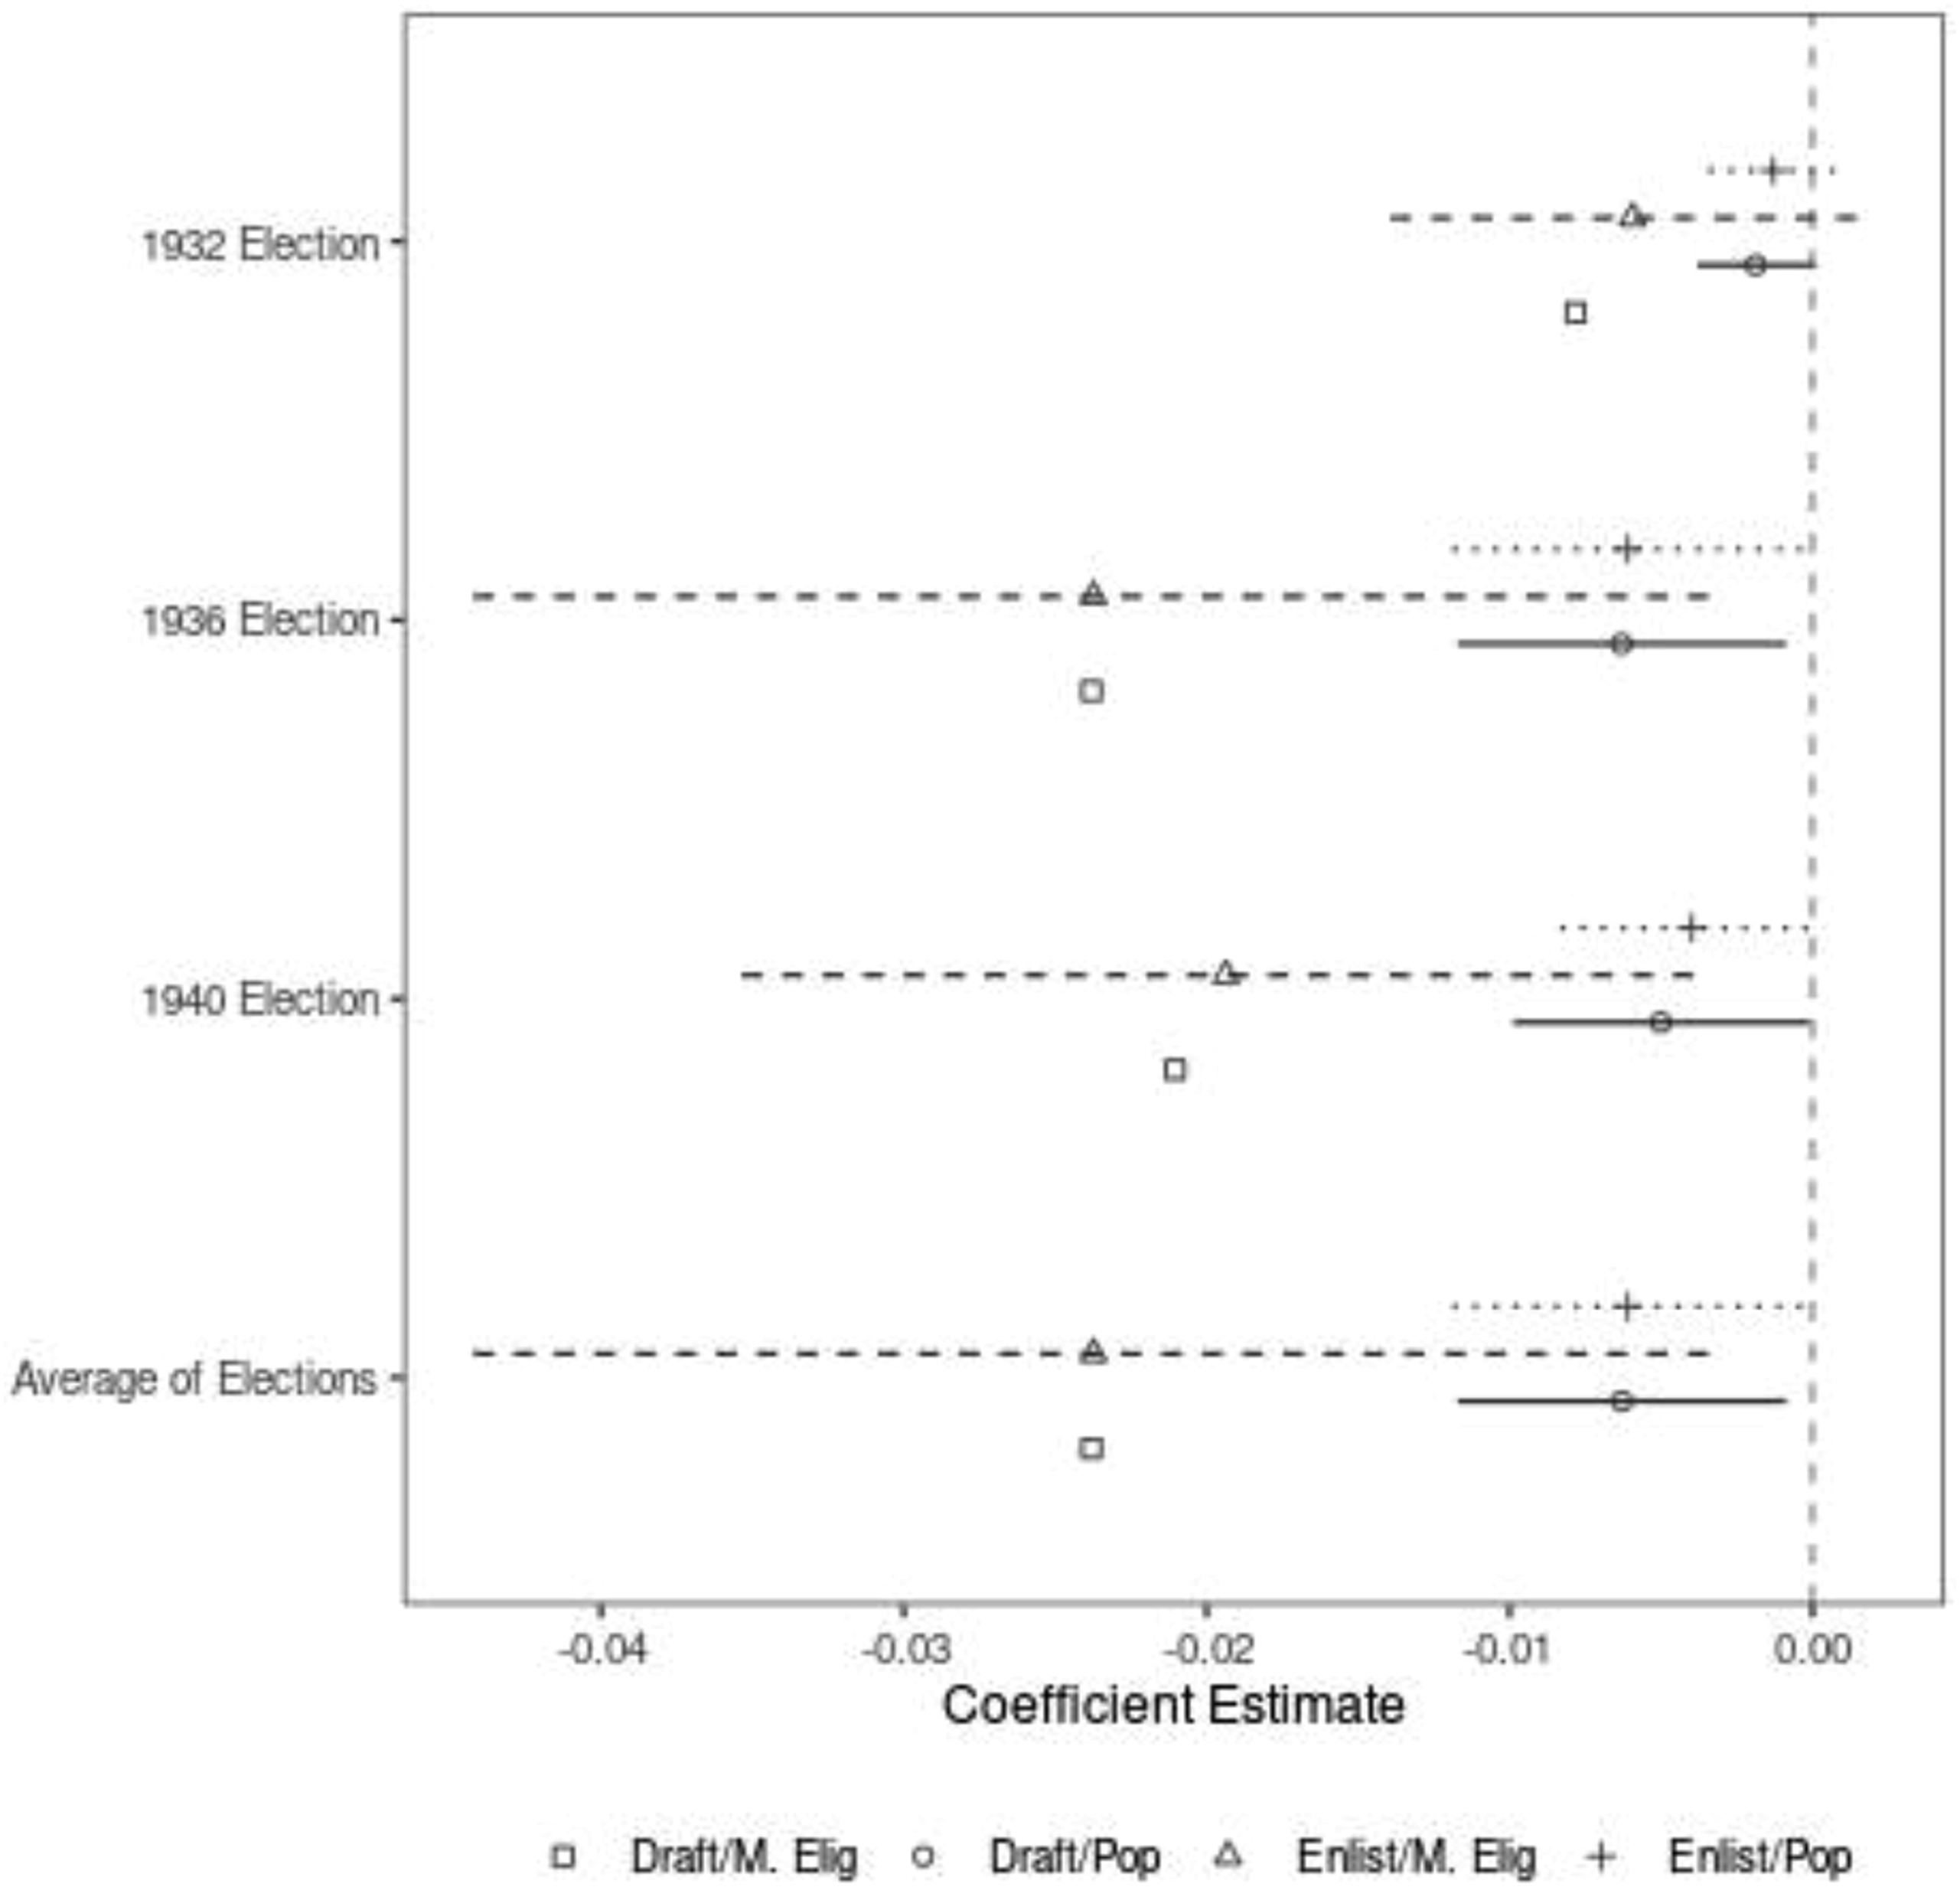
Archival evidence and our theory note that the SSS was decentralized to the county level, and political parties were organized at the county level. Thus, we would not expect to see state-level electoral manipulation differ from county-level results. In Figure 5, we report an analysis that aggregates our county-level data to state-level vote shares in the 1932, 1936, and 1940 elections and create an averaged measure of Roosevelt’s performance in each state across all three elections.
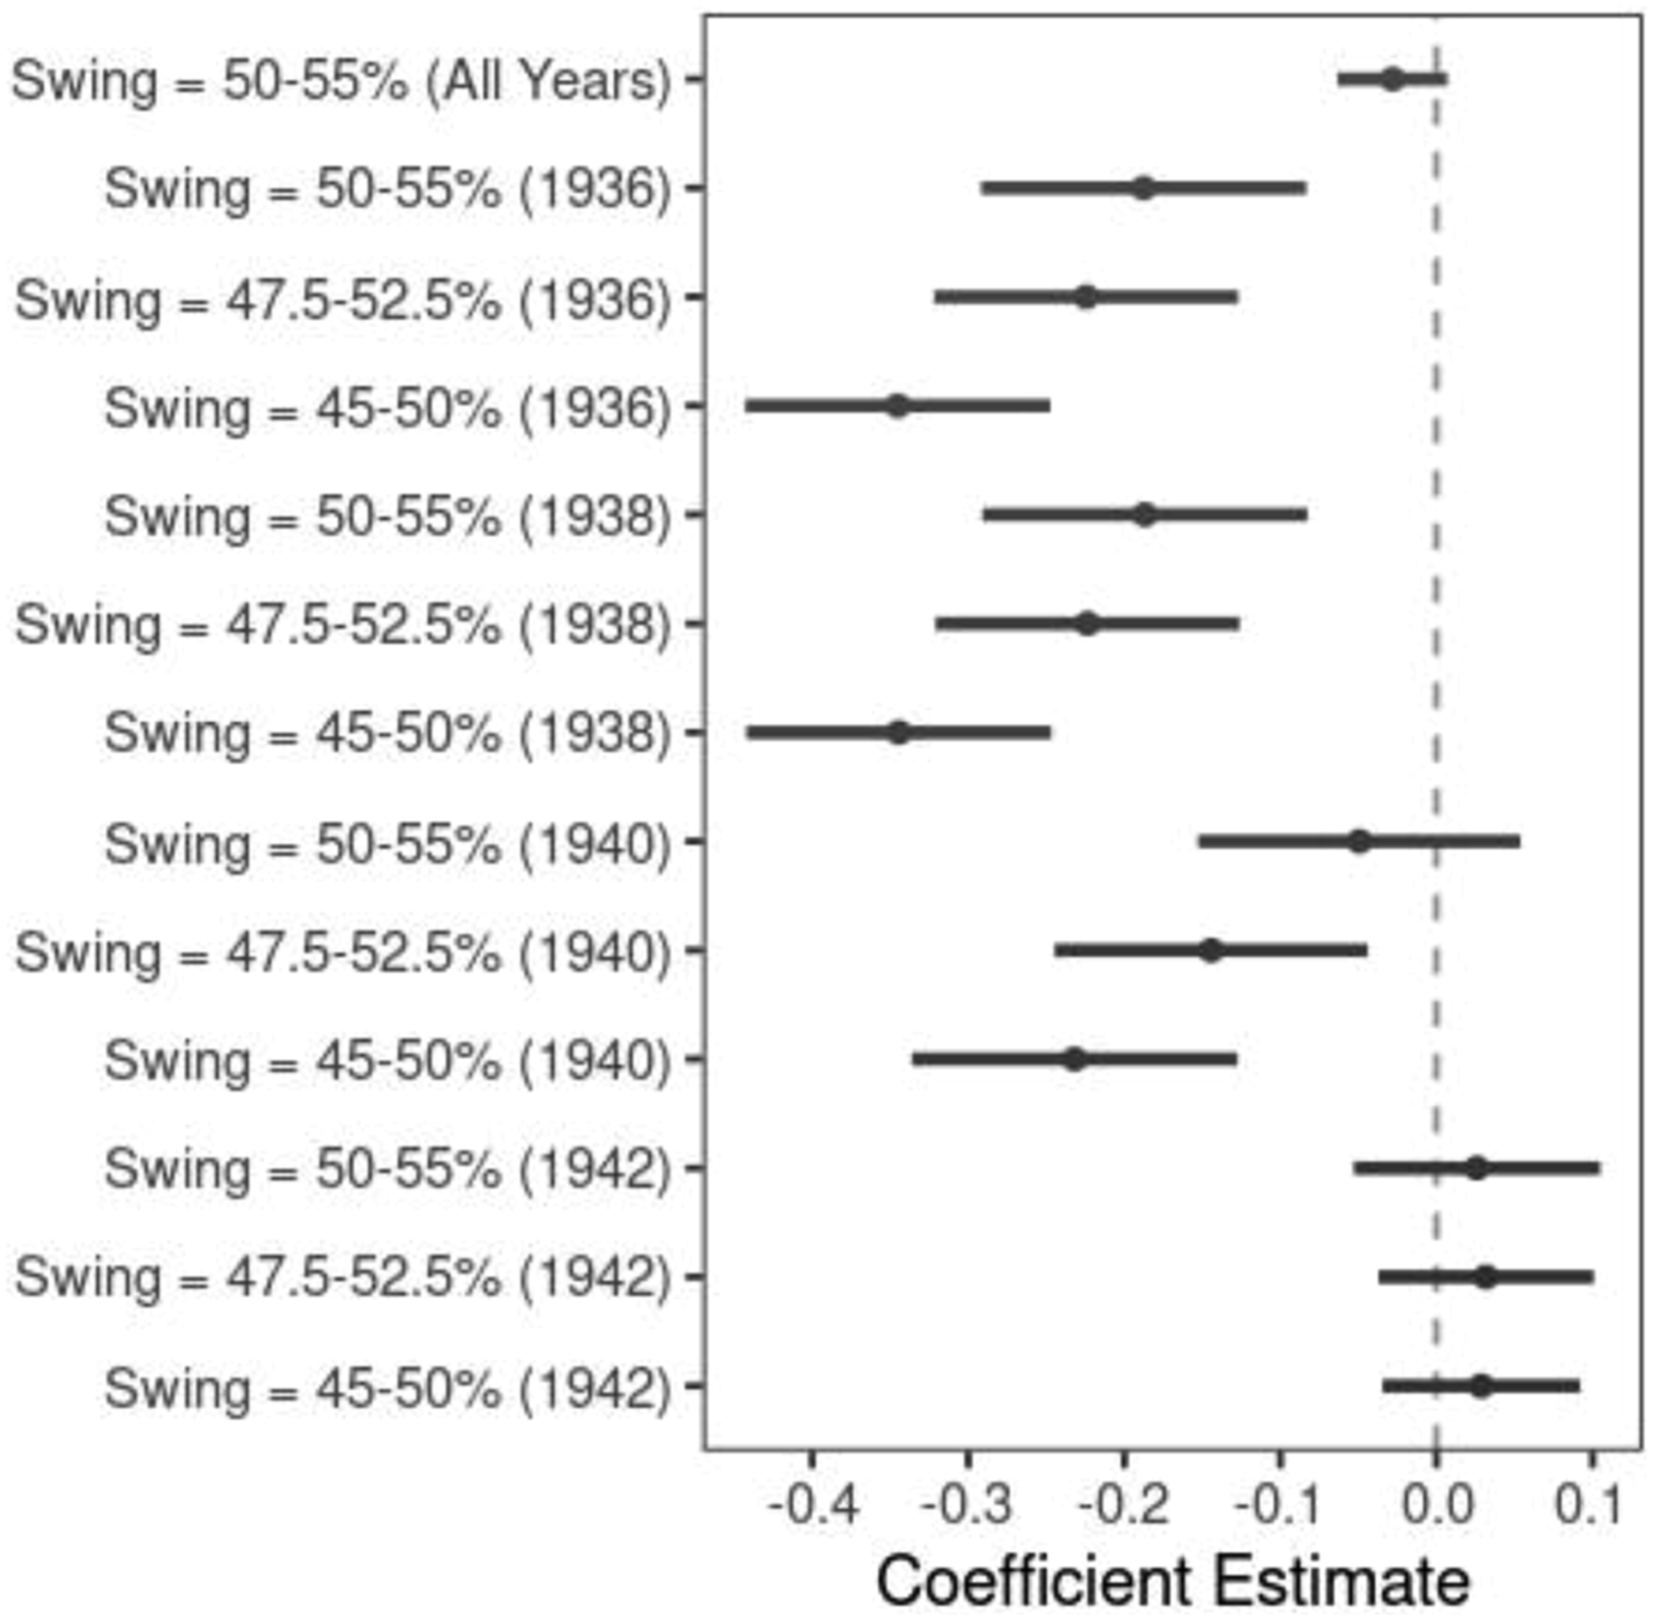
In Figure 6 we report estimated coefficients from 13 models that regress county-level conscription on swing counties in Congressional elections, 1936-1942. For 1936-1940 elections, we examine 1942 enlistments; for 1942 elections, we examine 1943 enlistments. Our results remain consistent; citizens in swing House of Representatives counties in prewar elections were less likely to be conscripted into the military in 1942. 17
Substantively, this effect is approximately the same: between 100,000 and 200,000 fewer soldiers enlisted from swing counties than otherwise would have, depending on the model. We do not find a statistically significant effect for the 1942 congressional election using any specification; this may be because the Democrats, having held their congressional majorities in the 1942 election, were free to prosecute the war without trying to hold onto swing voters.
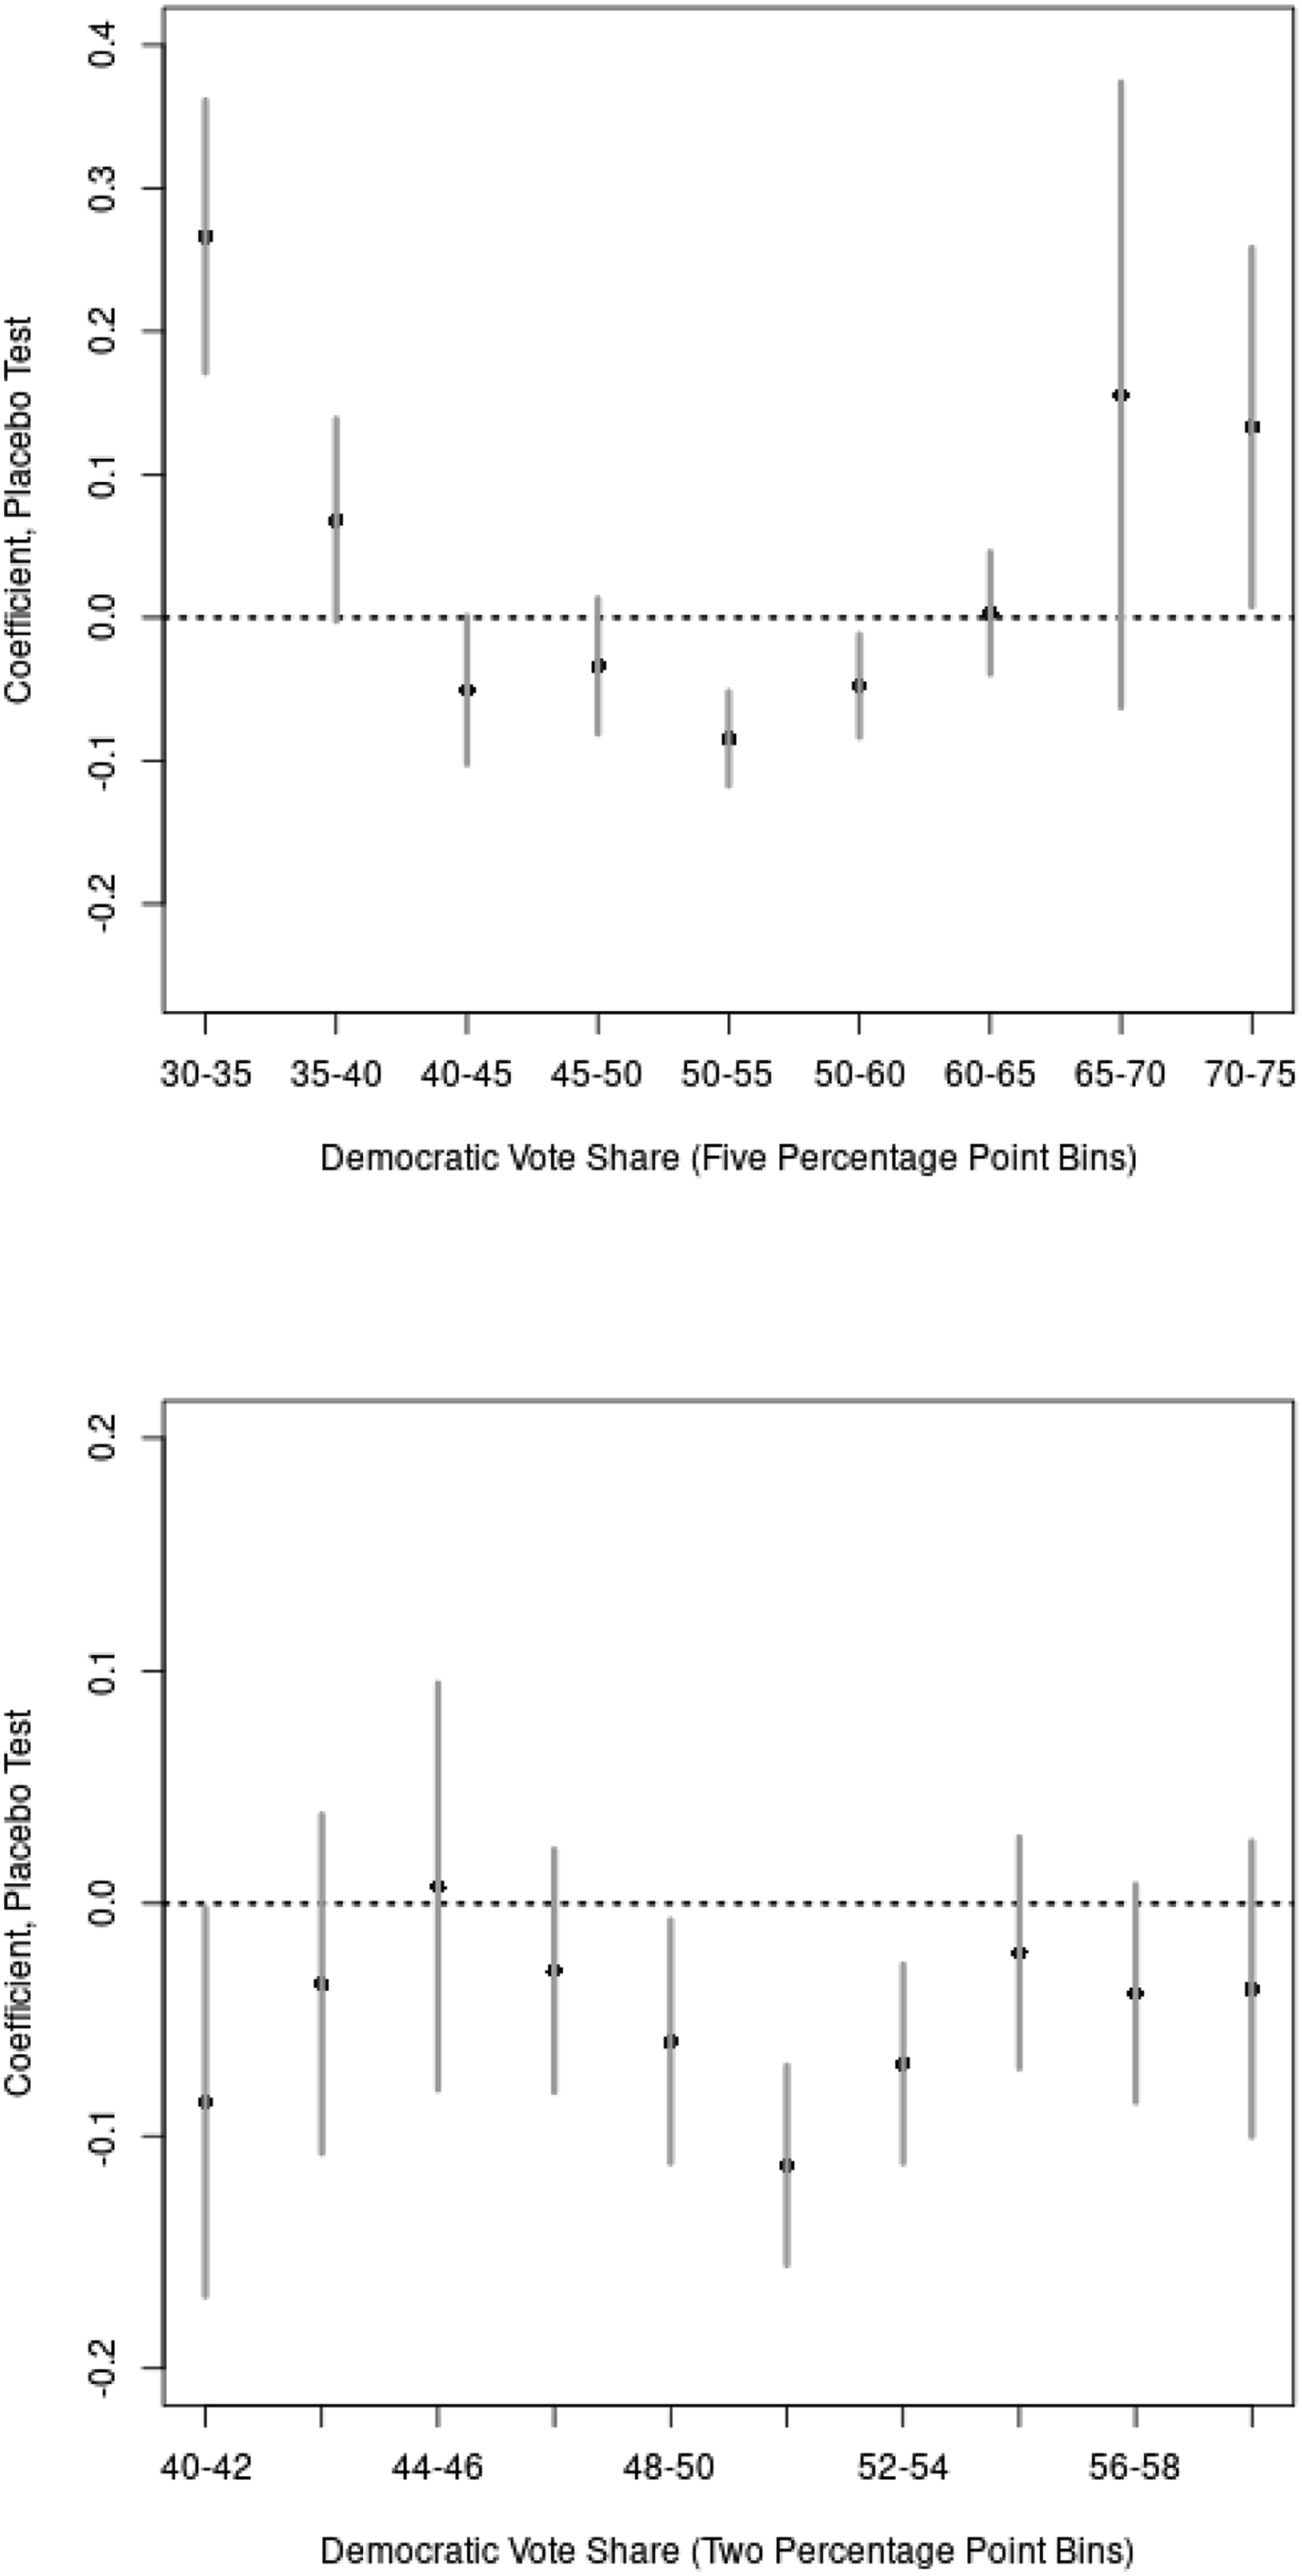
While the archival evidence demonstrates, and our theory articulates, that electoral manipulation of enlistment would focus on tenuous supporters rather than trying to win over new votes, here we relax that assumption. Some counties that gave 49%, or 56%, of their two-party vote share to Roosevelt might inadvertently benefit. Moreover, the coalition of voters that Democrats wanted to hold together could be drawn from both swing counties and safe counties. 18 We believe that our measure of counties is robust to this alternative explanation, and provide evidence that Roosevelt did target swing voters. Therefore, we assign swing-county status to non-swing counties. 19 We explore this dynamic further with placebo tests. Placebo tests work by changing the intervention—in our case, swing-county status—such that the theory expects no effect. We change our intervention by re-coding our swing county variable as an iterated window of each five percentage-point vote share bin, from the 30–35% bin to the 7075% bin. Additionally, we examine only the 40–60% range of Democratic vote share, creating two percentage-point vote share bins in this range. These estimated coefficients and standard errors are reported in Figure 7. Again, we show evidence that swing voters were protected, and evidence of higher enlistment in both Republican and Democratic “base” counties.
This analysis points to a marked but asymmetric decline in enlistment rates, beginning at approximately 48% Democratic vote share and persisting until 54% vote share. The selective conscription program and local party organization systems worked together to precisely target residents in swing counties. Conscription targeted both the Democratic and Republican “bases,” as indicated by Figure 7. To ensure that the military had adequate enlistments, the military had to rely on reliable Republican and Democratic counties. We analyze who picked up the slack for the preferential treatment shown to swing counties. We anticipate that counties in Republican-leaning New England and the Democratic-leaning former Confederacy sent a disproportionate number of soldiers to the military. We note that New England had a strong industrial sector, and the former Confederacy had an agrarian-based economy, both of which were subject to extensive deferments. In Table 2, we confirm our suspicions that “base” regions were over-conscripted relative to swing counties.
Consequences of enlistment
Associations Between Enlistment Rates and Vote Share Swing Towards the Democratic Presidential Candidate, 1944 Election. Year Fixed Effects Included for Models 1–2. Robust Standard Errors in Parentheses. see the Appendix for a Full List of Controls.
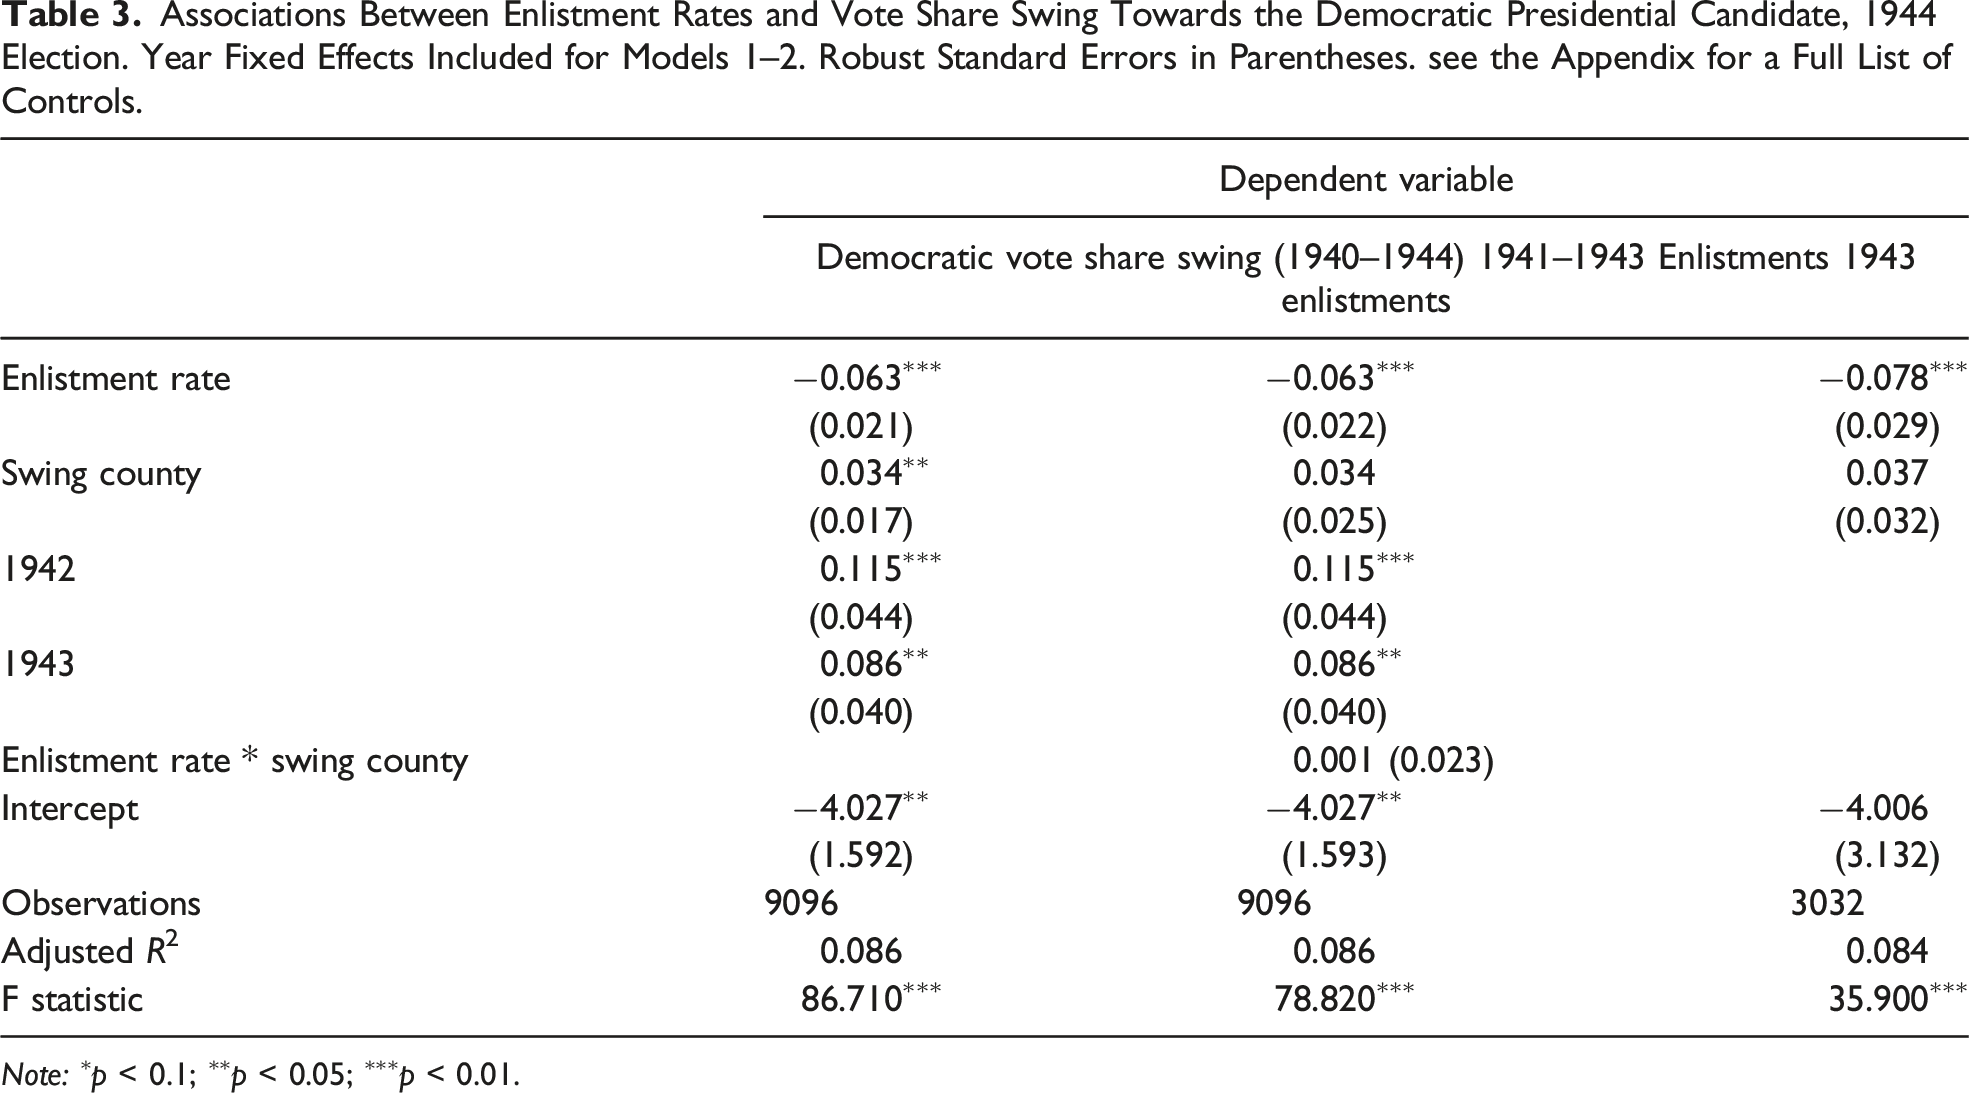
Note: ∗p < 0.1; ∗∗p < 0.05; ∗∗∗p < 0.01.
Discussion
These analyses provide strong support for our first hypothesis. We find considerable evidence that partisan electoral concerns played an important role in determining enlistment rates. Specifically, counties that narrowly supported Democrats sent fewer soldiers to war. This effect was largest in 1942, the year such enlistments were most needed. This placed an inequitable amount of pressure upon other geographic areas to pick up the slack. Inequities in conscription did not go unnoticed and were a source of constant political strife throughout the war. 20
However, manipulating service for partisan advantage can help leaders stay in office and may even permit democratic leaders to fight more aggressive and successful wars. When governments can manipulate conscription policies, they may be more likely to stay in office, have larger war aims, and possibly fight the war more aggressively. Partisan manipulation of the composition of the military is likely to have hitherto unknown consequences, including effects on battlefield performance and the outcome of conflicts. We contend that scholars should place more detailed focus on the links between the design of domestic institutions and the subsequent effect they have on conflicts.
More broadly, we make three important contributions to the political science literature. First, we demonstrate to the conflict literature that partisan politics also influence the manner in which militaries are formed. Specifically, political manipulation of superficially technocratic processes may determine how democratic governments wage war. Second, we demonstrate to the particularistic policymaking literature that enlistment is merely another dimension of partisan contestation. Partisan influence on redistributive politics does not stop when war begins. Third, we introduce a novel dataset that provides a granular look at the characteristics of the American military during World War 2. These data can open up several promising avenues for future research.
Policymakers should note these findings. Conscription schemes need to account for the partisan motives of political agents and officeholders. The SSS was concerned their enlistment system would be perceived as unfair, which might reduce morale and encourage civil disobedience. Democratic governments are driven by strong incentives to listen to their voters, even during war. Our finding does not implicate President Roosevelt and the Democratic Party in any conspiracy, but, having analyzed these data extensively, we do not expect any other outcome from a democracy in wartime.
Ending this sort of conscription policy may come with substantial risks. Rationalizing the draft by establishing a lottery system spreads the costs of war throughout the population, increasing the odds that voters will sour on the incumbent party and the government may lose elections. This could potentially have large and unknown consequences on domestic stability, war outcomes, and battlefield performance. Turning to an all-volunteer military could result in overstretched armies unable to accomplish major military objectives. It may be that a conscription policy manipulated to protect vulnerable voters offers democracies the best opportunity to win the war and ensure domestic stability. Future research needs to explore the implications of this partisan process on war-fighting efficiency and outcomes. Until then, we may only speculate.
Supplemental Material
Supplemental Material—Ain’t No Fortunate Son: The Political Calculus of Conscription
Supplemental Material for Ain’t No Fortunate Son: The Political Calculus of Conscription by Douglas B. Atkinson and Kevin Fahey in Political Research Quarterly
Footnotes
Acknowledgment
The authors would like to thank Zach Warner, Rene Lindstadt, Gabrielle Spilker, Josh Gubler, Amanda, Murdie, Andy Owsiak, John Holbein, Quintin Beazer, Matthew Pietryka, Amanda Driscoll, Luca Trenta, and Carol Weissert, two anonymous reviewers, and the editors at Political Research Quarterly for helpful comments and suggestions.
Declaration of Conflicting Interests
The author(s) declared no potential conflicts of interest with respect to the research, authorship, and/or publication of this article.
Funding
The author(s) received no financial support for the research, authorship, and/or publication of this article.
Supplemental Material
Supplemental material for this article is available online.
Notes
References
Supplementary Material
Please find the following supplemental material available below.
For Open Access articles published under a Creative Commons License, all supplemental material carries the same license as the article it is associated with.
For non-Open Access articles published, all supplemental material carries a non-exclusive license, and permission requests for re-use of supplemental material or any part of supplemental material shall be sent directly to the copyright owner as specified in the copyright notice associated with the article.