
Abstract
Teaching is one of the most stressful occupations in the United States. This is especially true for teachers who are responsible for meeting the complex needs of students with disabilities, particularly those with emotional and behavioral disorders (EBD). In fact, EBD teachers have a higher risk of experiencing burnout than their special education and general education colleagues. This burnout leads EBD teachers to leave the specialization of EBD, leave the field of special education, or leave the teaching profession as a whole. One way to mitigate this exodus of EBD teachers is to provide a broader pedagogical opportunity. Project-based learning (PBL) is a pedagogical methodology that is not often used by EBD teachers. The current study examines the use of PBL teaching to support students behaviorally and its impact on EBD teacher stress and job satisfaction. PBL was shown to improve student classroom and personal behaviors as well as increase job satisfaction for EBD teachers.
Teaching is one of the most stressful occupations (Hurley, 2021). This is especially true for teachers who are responsible for meeting the complex needs of students with disabilities. Special education teachers have a higher risk of burnout than their general education colleagues (Aloe et al., 2014). Brunsting and colleagues (2014) conducted a synthesis of studies published between 1997 and 2013 that focused on special education teacher burnout. One finding was that students’ challenging behavior was a predominant factor affecting the degree of special education teacher burnout. Findings from a recent meta-analysis (Park & Shin, 2020) indicate that student age and disability type were significantly related to special education teacher burnout, and Fitchett et al. (2018) reported that special educators of students with challenging behaviors may have more classroom management challenges and, therefore, a higher rate of burnout.
Adera and Bullock (2010) found that problem behaviors of students with EBD contributed to some of the most stressful factors attributed to job dissatisfaction. Students with EBD may exhibit physical and/or verbal aggression, noncompliance, and poor interpersonal relationships with others. Observable behaviors which may be witnessed in students with EBD include impulsivity, immaturity, and lack of attention in class (Rutherford et al., 2007). These problem behaviors can make it more difficult for teachers to implement instruction in the class, especially for novice teachers and those without specialized training (Conroy, 2016). Aloe et al. (2014) indicate that working with students who have challenging behavior can be a large contributing factor to teacher burnout. Supporting this assertion, Gilmour and Wehby (2020) reported that as the percentage of students with EBD in a teacher’s classroom increased so did the probability of teacher burnout. Moreover, working with students with EBD had a higher association with burnout than teachers working with students in other disability categories. Katsiyannis et al. (2003) found that teachers of students with EBD were the most likely to leave the profession over a 10-year period.
Special educators’ roles are unique as, unlike most teachers, they may be asked to teach any content, in any school setting, or combination of settings (e.g., inclusion, self-contained). They may be interventionists and/or teach multiple content areas, address challenging behavior, schedule and support paraprofessionals, and collaborate across multiple teachers and grade levels, as well as manage legal requirements and paperwork, among other responsibilities (Goldhaber & Theobald, 2022; Sutcher et al., 2019). It is not surprising that special education teachers who work with students identified with EBD consistently report higher levels of stress than general education teachers and other special education teachers (Adera & Bullock, 2010; Nichols & Sosnowsky, 2002; Singh & Billingsley, 1996).
Along with special educators, research has shown that paraeducators also experience burnout in classrooms when working with students with high support needs. The causes of burnout in paraeducators vary, but research suggests the reasons include (a) low levels of school support (Barnes et al., 2018), (b) emotional exhaustion (Shyman, 2010), (c) loss of interest in the job (Garwood et al., 2018), or (d) feeling unaccomplished professionally (Brouwers & Tomic, 2016). Regardless of the reason, paraeducator burnout like teacher burnout is real and can have a lasting effect on the quality of services and education that students with EBD may receive.
A potential way to combat EBD educators’ burnout related to student behavior is through instructional methodology. It is well documented that when teachers increase active student engagement, challenging behaviors decrease (Adamson & Lewis, 2017; Armendariz & Umbreit, 1999; Common et al., 2020). Systematically designing instruction to support student learning and independence can provide structure and engage students’ interests, resulting in a decrease in challenging behaviors. One instructional strategy that combines structured teaching with active student engagement is Project-Based Learning (PBL).
Project-Based Learning
PBL is a student-centered type of instruction based on principles of constructivism (Kokotsaki et al., 2016). This type of learning is predicated on the beliefs that learning is context-specific, learners are active participants in the learning process, and learners achieve their goals through the process of social interaction and sharing their learning and understanding. Using this inquiry-based learning strategy, students are provided with authentic questions and real-world problems (Al-Balushi & Al-Aamri, 2014). Students then answer these questions and attempt to problem solve through asking and refining questions; designing and conducting investigations; gathering, analyzing, and interpreting information and data; drawing conclusions; and reporting their findings (Blumenfeld et al., 2000). While pedagogically similar to problem-based learning (Helle et al., 2006), PBL culminates in a product (Blumenfeld et al., 1991; Larmer et al., 2015). This product represents the students’ new understandings, knowledge, and attitudes about the issue they investigated (Holubova, 2008). Most importantly, these end products are shared with peers, faculty, staff, and even community members. Using visual displays comprised of videos, photographs, sketches, reports, models, and other artifacts (Holubova, 2008), students explain the process they followed, share reflections on their learning, and highlight the relevancy of the topic to their own lives (Larmer et al., 2015).
In a review of the literature, Kokotsaki and colleagues (2016), identified seven themes found in classrooms successfully implementing PBL. These included: (a) teachers providing enough time and flexibility for students through the use of block scheduling or coordination with other teachers; (b) providing students with a rubric to explicitly define expectations and grading criteria; (c) establishing a classroom culture stressing self-management; (d) appropriately grouping students to promote full participation; (e) working with others outside the classroom to encourage investigation; (f) using technological resources efficiently to support critical thinking skills; and (g) using a variety of assessment methods, including individual grades, group grades, and feedback regarding group performance and participation. These themes guided the authors’ recommendations for future implementation of the PBL model, with particular emphasis paid to the importance of student support, effective group work, student choice and autonomy, regular monitoring and recording of student progress, and making certain students already have sufficient knowledge and skills regarding the project topic prior to asking them to complete independent work (Kokotsaki et al., 2016).
According to Larmer and Mergendoller (2010), PBL can be implemented with as much independence as the teacher determines appropriate for the students. Older students may be given the opportunity to decide what products they will create, what resources they will use, and how they will structure their time, with some students able to select their project’s topic and driving questions. Younger or unpracticed students may require more controlled choices, wherein they select which topic to study within a general question provided to them or select how they will design, create, and present products (Larmer & Mergendoller, 2010). A limited menu of options for creative products helps to prevent students from becoming overwhelmed with choices (Larmer & Mergendoller, 2010).
Project-Based Learning and Students With Disabilities
The literature concerning PBL with students with disabilities is still emerging. The limited research that focuses on the use of PBL instruction has been found in the science, technology, engineering, and mathematics (STEM) academic areas. Students with specific learning disabilities score lower than general education students on national science tests (National Center for Education Statistics [NCES], 2021) as well as being underrepresented in STEM fields (National Center for Science and Engineering Statistics [NCSES], 2023), the use of PBL with students receiving special education services provides a potential pathway to closing these gaps. This is due in part to the fact that traditional general education science instruction has relied heavily on textbooks and/or lectures heavy with scientific language (Scruggs & Mastropieri, 2007; Terrazas-Arellanes et al., 2018). Students with learning disabilities frequently struggle with comprehending complicated text-based information and utilizing background science knowledge and often require textual enhancements and reading comprehension strategies (Mason & Hedin, 2011). In addition, discovery-based, non-structured learning is also problematic (Therrien et al., 2011) as students with learning disabilities have poorer working memory capacities (Alloway & Archibald, 2008), which translates into a lowered capacity to hold information long enough to process it. This lowered capacity then leads to further difficulties in maintaining attention, carrying out complex tasks, following instructions, and completing further reading (Swanson et al., 2019). Due to the factors identified by Alloway and Archibald (2008) and Swanson et al. (2019), PBL may provide culturally relevant supportive multimedia learning environments with activities designed to address literacy, cognitive load, and access problems faced by students with disabilities (Kingston, 2018).
PBL offers inherent flexibility and emphasizes the relevancy of material (Terrazas-Arellanes et al., 2018), which motivates students with disabilities to develop literacy skills and academic vocabularies (Mason & Hedin, 2011) while allowing them to manage their cognitive load by processing information at their own pace (Terrazas-Arellanes et al., 2018). There is also evidence supporting that students with disabilities do especially well with PBL when they are engaging with typically developing peers (Council, 2018), as the students learn from each other’s experiences. Researchers have also found STEM PBL increases student success rates for completing activities (Cobbs & Cranor-Buck, 2011) and students’ interest and motivation (Hafner & Miller, 2011). This is especially true when technology is incorporated into lessons (Foulger & Jimenez-Silva, 2007).
Positive impacts on literacy and promoting learning have been noted when teachers incorporate culturally relevant materials (Lee et al., 2005). As documented by Atwater and colleagues (2013), Hispanic English learners who are able to draw on their culture are more likely to succeed in learning science. Recommendations by Quinn et al. (2012) encouraged teachers to have students contribute to classroom discourse regardless of language flaws to promote a more inclusive science learning community.
In a 3-year, randomized control trial (RCT) implementing culturally informed PBL-based interactive online science units, Terrazas-Arellanes and colleagues (2018) collected data concerning the efficacy of such lessons with students with disabilities and English language learners enrolled in 13 middle schools across districts in Oregon and Georgia. They found students who received the PBL-based lessons scored an average of 16.7 percentage points compared with 5.7 percentage points on classroom level science measures than those receiving traditional instruction. Furthermore, there was no significant difference between the performance of students with disabilities and typically developing students, indicating students with learning disabilities receiving PBL-based lessons gained science knowledge similar to their non-disabled peers (Terrazas-Arellanes et al., 2018).
Existing research emphasizes the importance of technology in the implementation of PBL for students with disabilities. Technology is essential in providing an alternative way to access science curriculum (Marino et al., 2010), particularly when using a Universal Design for Learning (UDL) framework (Basham et al., 2010). The use of technology extends beyond using different devices, and can include class blogs, social networking, mobility technologies, and alternative reality gaming and simulations (Bender, 2012). Interest generated from using aids such as technology is considered “task-based interest,” and enhancing task-based interest in students with disabilities helps them to overcome learned helplessness and has been found to have a direct impact on situational interests and beliefs in their ability to succeed (Rotgans & Schmidt, 2011; Wei et al., 2021). Computer-assisted instruction (CAI), hypertext, audiobooks, and text-to-speech are all ways to support decoding and reading fluency while using PBL (Wei et al., 2021). There are even free technology options available for teachers, such as Nature Reader, TTSREADER, and Read Works, for teachers whose budgets do not allow for purchasing new technology for the classroom (Wei et al., 2021). However, it is essential when utilizing technology that teachers develop students’ computer skills as well as providing corrective, elaborative, and immediate feedback to guarantee the student’s learning is as supported as possible (Wei et al., 2021).
Purpose of the Current Study
Taylor et al. (2018) introduced a framework that uses PBL for students with EBD in the context of emphasizing the Arts as an instructional consideration. However, empirical research on the use of PBL exclusively for students with EBD is virtually non-existent. They also theorized that PBL could reduce challenging behaviors displayed by students with EBD. As research on EBD teacher burnout has suggested, the need to reduce student challenging behavior may support teacher retention for longer periods of time. Furthermore, Garwood (2023) provided a call for examining EBD teacher burnout and ways to prevent educators from leaving the classroom and the field.
The current study examines the two-fold use of PBL instruction to (a) reduce the challenging behavior of students with EBD and (b) combat instructor burnout. The study attempts to answer the following questions:
Is there a positive functional relation between PBL instruction and reducing challenging behaviors?
What is the effect of PBL instruction on EBD student behavior?
Do EBD classroom instructors report improved job satisfaction after using PBL instruction?
Method
Participants and Setting
The current study occurred in a high school in a rural school district in a state located in the southern United States. The school serves 298 students from 9th to 12th grades with 89% of students receiving free or reduced lunch. Ninety-one percent of students are African American. The classroom in which the study took place was designated as the school district home for students who needed extensive behavioral support. Students in this class were from multiple schools as the self-contained behavior support classroom was in a centralized high school location as dictated by their Individualized Education Plan (IEP) and least restrictive environment.
Four adolescent students identified with EBD were selected to participate in the study. Each student was determined to be eligible for the current study according to the following criteria: (a) an IEP diagnosis of EBD as identified by the school district; (b) received instruction in a self-contained classroom for behavior support; (c) maintained regular school attendance; and (d) an average success rate of 60% or less in weekly behavioral assessment via daily behavior report card (DBRC). All four students were African American males and were eligible for free and reduced lunch. Eric (pseudonym) was 13 years old and was placed in a high school class as his behavior was considered too severe for the faculty and resources of the middle school. He was not using prescribed medication. Kenneth (pseudonym) was 15 years old, had never been retained, and took prescribed medications for depression. Stanley (pseudonym) was 16 years old, had been retained for 1 year, and took prescribed anxiety medication. Kyle (pseudonym) was 16 years old, had never been retained, and was taking no medication.
The classroom consisted of an experienced special educator with 10 years of classroom experience working with students receiving IEP services for EBD and a novice paraprofessional. The teacher was an African American male with a Master of Education degree in Collaborative Education. The paraprofessional was also an African American male and reported being new to education as it was a change of career move from the military. Each educator reported that he had been working in the target classroom for less than a year.
Intervention
The current study used PBL as the instructional intervention. PBL is an instructional approach that centers student learning away from teacher-directed lectures and supports students in leading their own learning process. PBL uses a constructivist approach to learning in which student perspectives are used in support of knowledge to create a product as a social activity with both group and individual self-management and self-development components (Duffy & Cunningham, 1996). High-quality PBL has been identified by six characteristics: (a) intellectual challenge and accomplishment, (b) authenticity, (c) a public product, (d) collaboration, (e) project management, and (f) reflection (Buck Institute for Education [BIE], 2018). The intervention was implemented by the classroom teacher and paraprofessional.
Dependent Variable
Percentage scores on DBRCs for each student were used as the measurement variable for the current study. A percentage of points earned via a DBRC was calculated for each student weekly, with a maximum daily score of 12 (i.e., 100%). See Figure 1 for an example of the DBRC. A daily percentage was calculated (% added per day divided by days of attendance) and used with a minimum of a 75% weekly average needed to participate in the PBL instructional time.
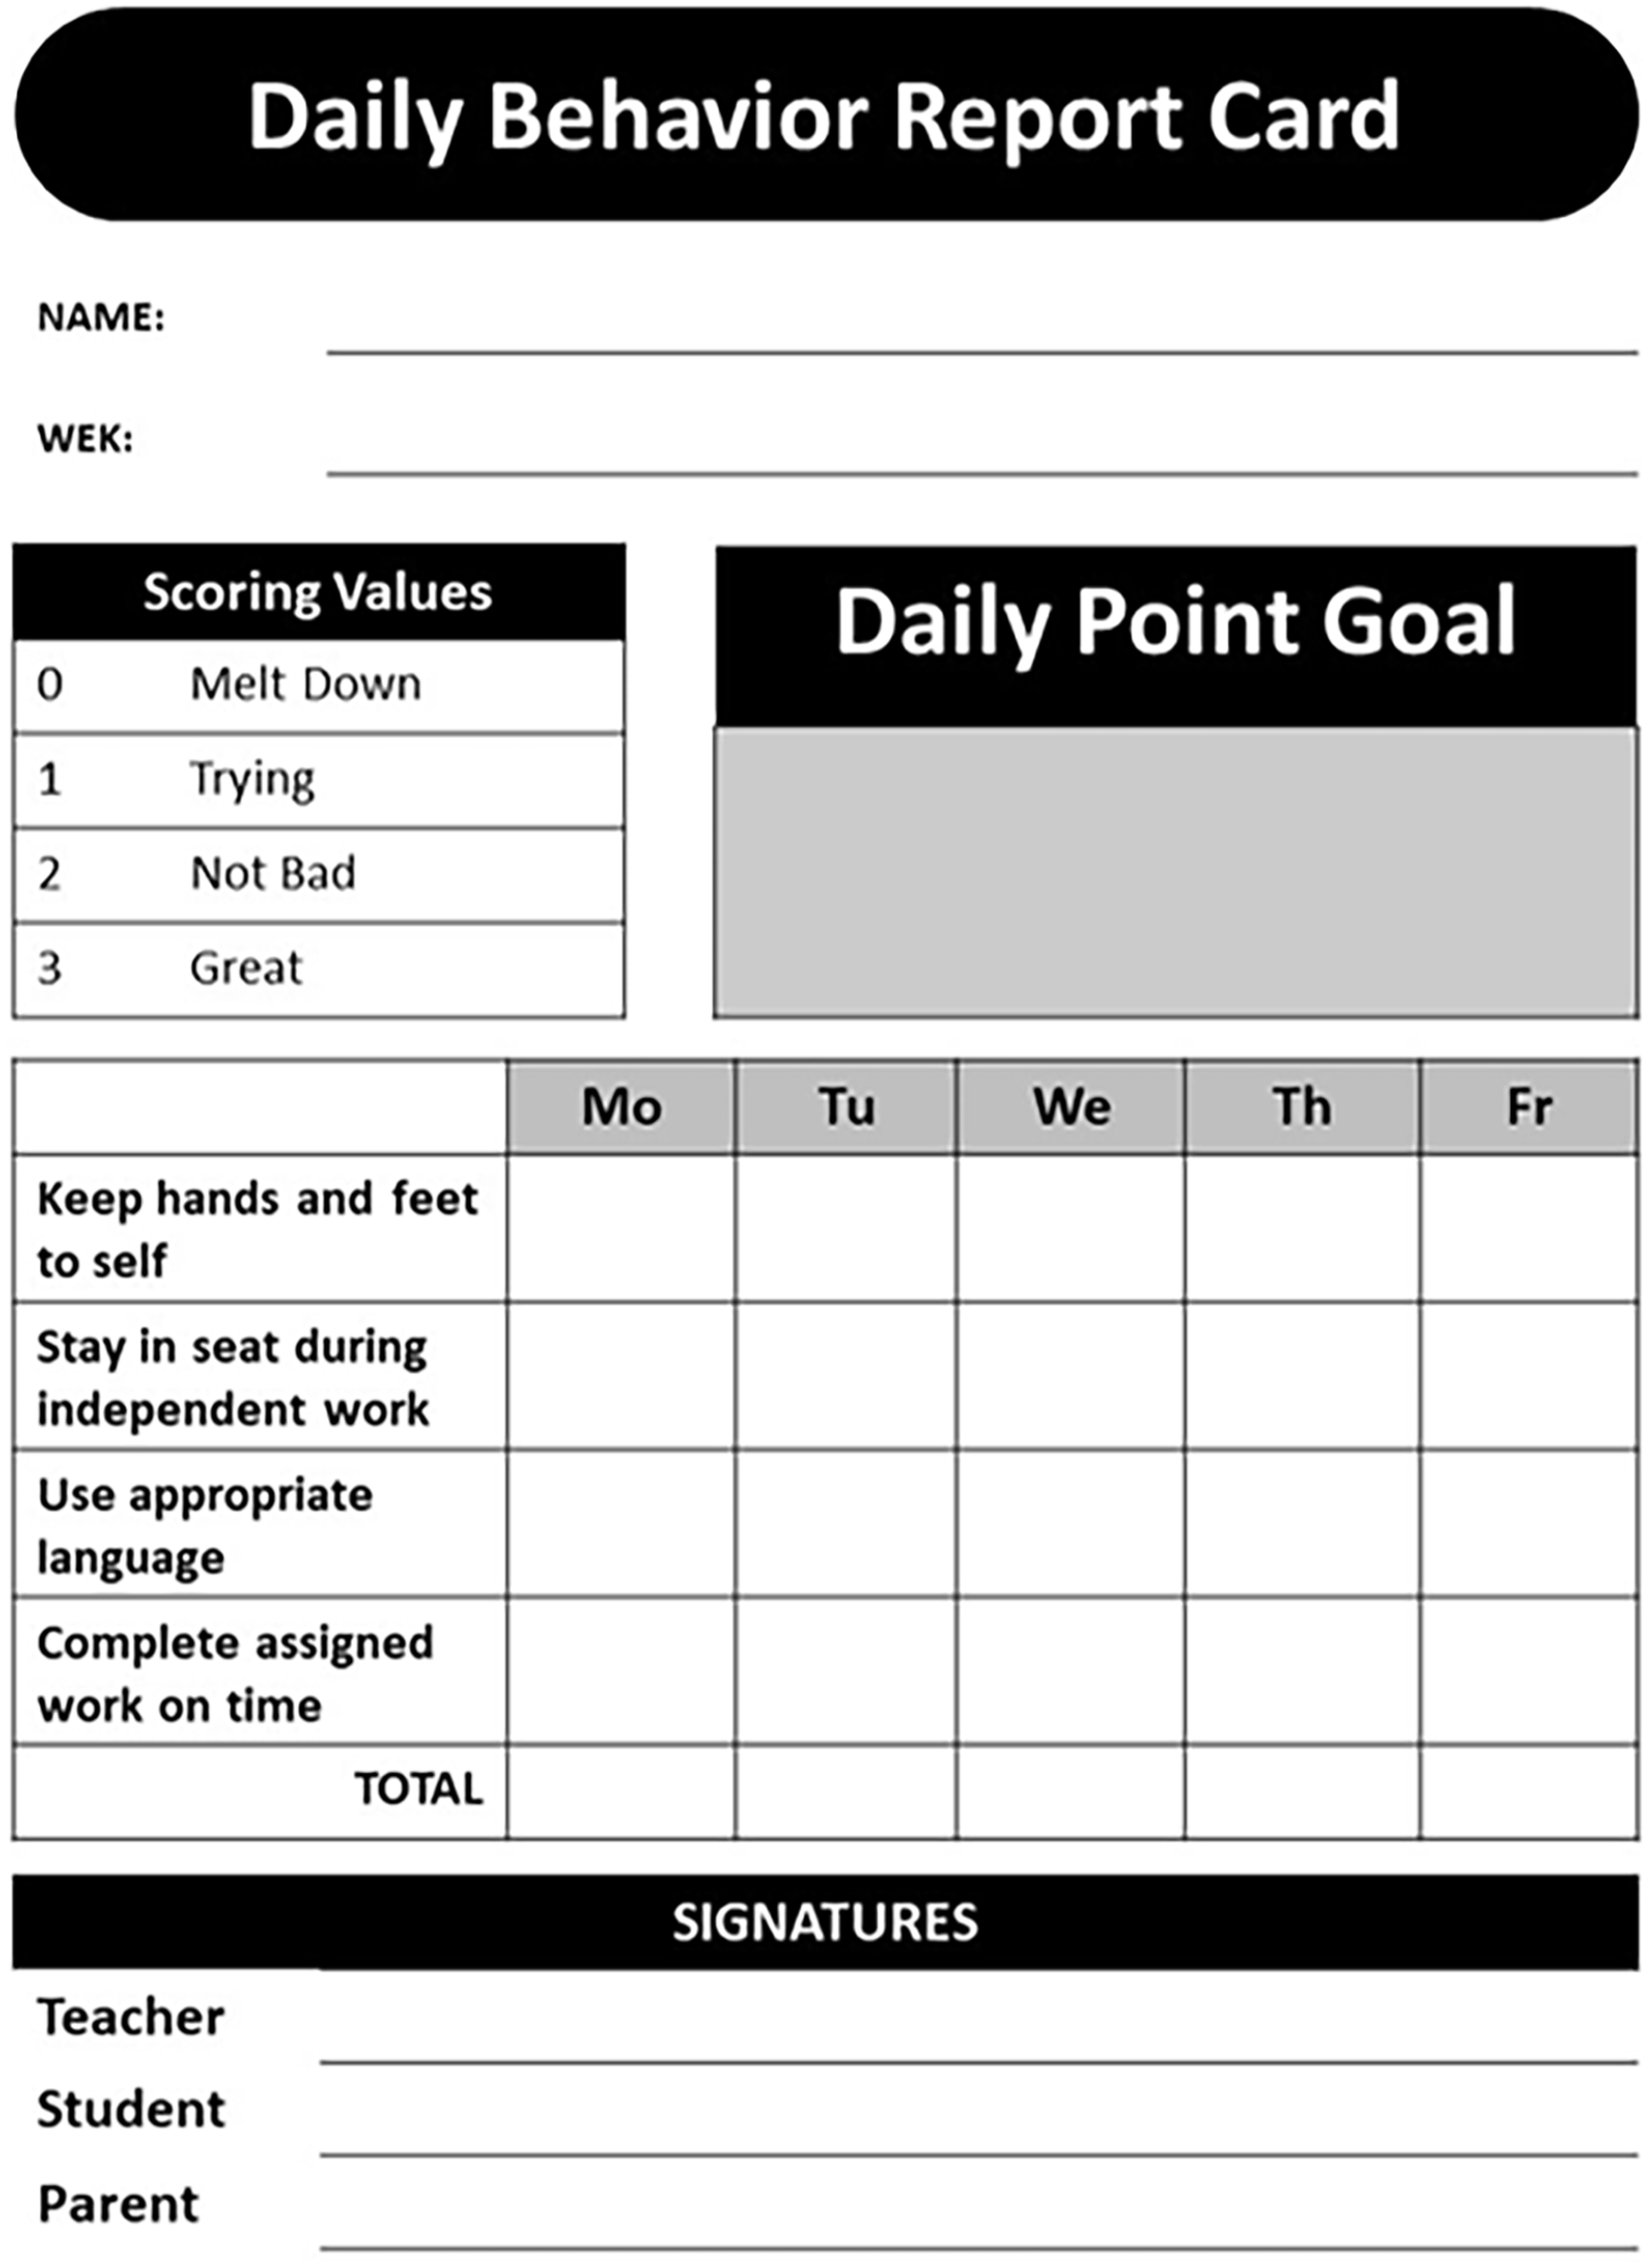
Sample Daily Behavior Report Card (DBRC).
Due to the likelihood of burnout in EBD classrooms the current study attempts to gauge indicators of burnout felt by teachers and paraprofessionals. Based on the reasons for teacher and paraeducator burnout (i.e., school support, emotional exhaustion, job interest, professional accomplishment), questions were developed to measure teaching burnout for the teacher and paraprofessional, a 5-point, five-question Likert-type survey (Stempien & Loeb, 2002) that assesses aspects of satisfaction/dissatisfaction directly related to teaching was used. The survey items ranged from 1 (strongly agree) to 5 (strongly disagree) and were:
I enjoy working with my students.
I feel that teaching is a rewarding experience.
I have the opportunity to express my creativity in my teaching.
If I had the option to change careers, I would not choose teaching.
I often feel frustrated when teaching my students.
Procedure
Pre-Intervention
Prior to the start of the PBL intervention phase, all participants were in a self-contained behavior support classroom with DBRC intervention as part of the classroom behavior management procedure. DBRCs were used with each student and included an academic goal, behavioral goal, and personal goal. Each academic and behavioral goal was determined based on the goals and objectives of each student’s IEP. Personal goals were determined based on weekly discussions with the classroom teacher. DBRCs were scored after each review period every day of the week per attendance (4 review periods per day). Point values of zero or one were awarded at the end of each review period based on individual student academic and behavioral success (i.e., 1 indicated compliance or demonstration of academic and prosocial behavior during activity; 0 indicated non-compliance or demonstration of inappropriate academic performance and behavior during activity). The teacher and paraprofessional were responsible for DBRC completion for each student after each review period. Prior to the start of the study, an implementation fidelity check was conducted for both the teacher and the paraprofessional by the researcher using a modified version of a DBRC Fidelity Checklist used by (Riden et al., 2021; Taylor & Hill, 2017). The 16-item checklist was categorized into three time periods for DBRC checks per student (i.e., prior to class/session; during class/session; after class/session). Both the teacher and the paraprofessional reached 100% fidelity.
PBL activities were reserved for 2 hours one day a week (Friday). All students in the class were given the opportunity to participate in the PBL activity time based on their outcomes related to their individual DBRC weekly averages. Students who averaged 75% (i.e., a daily point score of 9 out of 12) or better were allowed to participate. Students who did not reach that average were not allowed to participate during PBL instructional time and were separated from the teacher or paraprofessional to complete incomplete assignments from the week.
Intervention
The classroom teacher and paraprofessional were instructed on high-quality PBL instruction and its necessary components. A class-wide PBL topic was developed from a class discussion of a real-world problem related to two subject areas: business economics and the arts. The students initiated the goal of creating a student-run record label, producing a complete musical product (i.e., a mixtape), and selling that product for profit as class-wide PBL activity. Along with state and IEP required lessons and instruction, the classroom teacher and paraprofessional were responsible for evaluating the PBL activity based on established PBL gold standards. See Table 1 for a list of high-quality PBL components aligned with study specific PBL objectives.
Project-Based Learning Essential Elements Checklist.
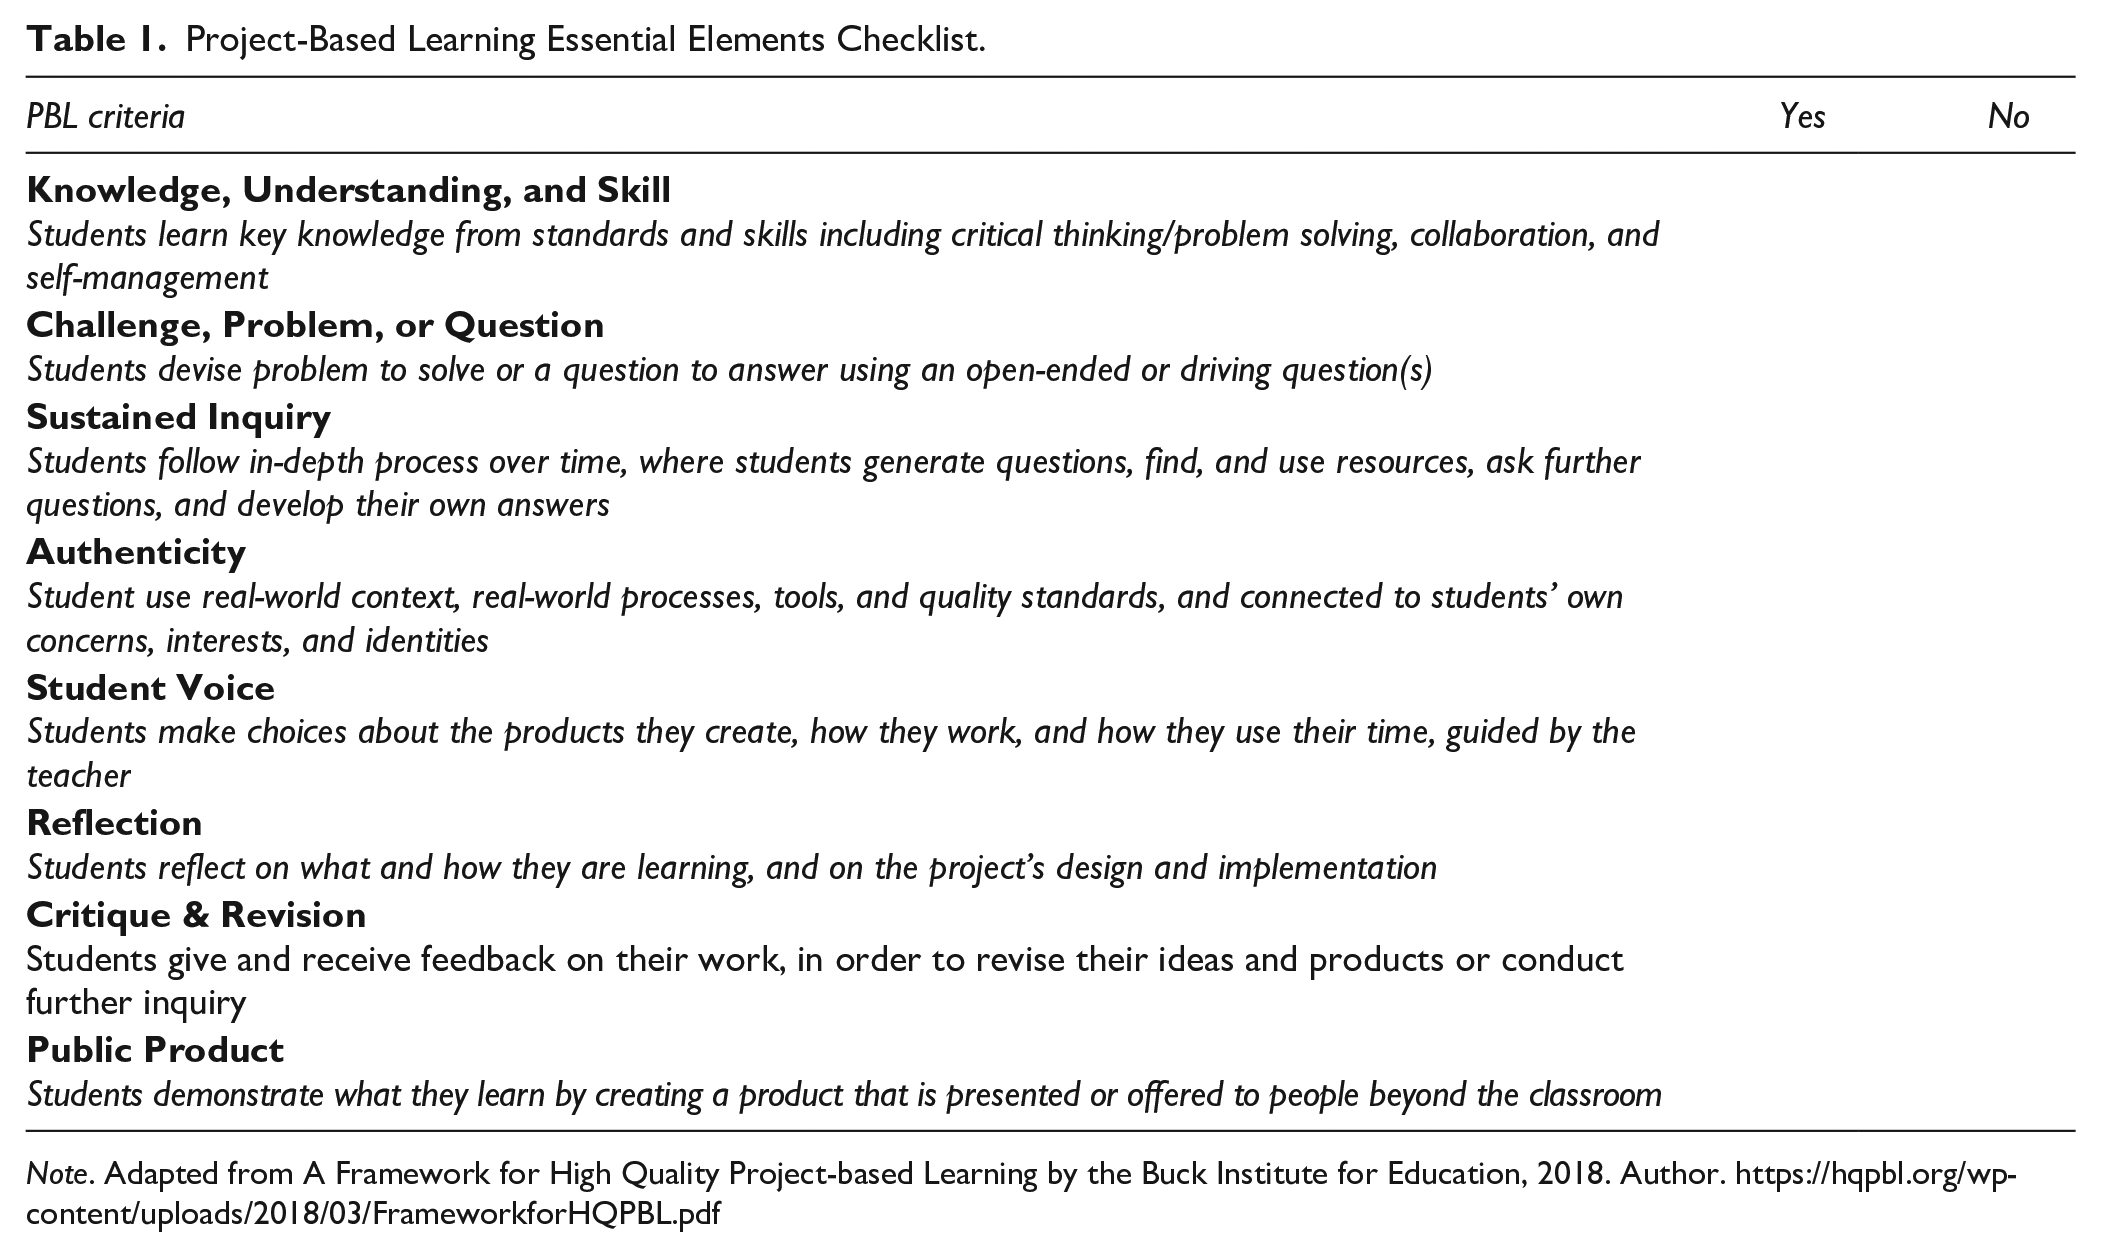
Note. Adapted from A Framework for High Quality Project-based Learning by the Buck Institute for Education, 2018. Author. https://hqpbl.org/wp-content/uploads/2018/03/FrameworkforHQPBL.pdf
The students developed the guiding questions of the following:
Can we produce a real mixtape that includes things we learned in class?
Can we create and implement a promotion and sales plan for the mixtape?
Can we get positive reviews of the mixtape from the other students in the school?
The teacher and paraprofessional taught and modeled the skills specifically needed to accomplish the goals identified by the student-produced guiding questions. For example, the students developed a guiding question (how do you create a successful mixtape?). To help the students answer this question the teacher and paraprofessional (a) help the students define success, (b) teach students how to use production and recording equipment, and (c) provide instruction on marketing and sales. Throughout the week, the researcher would review each student’s DBRC and track their behavioral outcomes.
Experimental Design and Data Analysis
A single-case, multiple-baseline-across participants design was used to evaluate the effects of PBL instruction on behavioral outcomes as measured by DBRCs. A multiple baseline design was chosen due to the nature of the intervention and measurement variable, as it is a widely used design for evaluating the functional relation between the independent and dependent variables (Cooper et al., 2020). As recommended by Kratochwill et al. (2013), the current study adheres to the following criteria: (a) systematic manipulation of the independent variable, (b) multiple individuals systematically measured the dependent variable with interobserver agreement collected for at least 20% of all sessions across all phases, (c) intervention effects demonstrated at three different times, and (d) at least five data points for each phase per participant. During the baseline data collection phase, each participant’s behavioral performance was recorded on their respective DBRCs. Typical classroom instructional practices (based on district and IEP requirements) occurred during baseline. Students were moved to the intervention (PBL) phase systematically based on baseline data stability and extended time in baseline phase per student (Cooper et al., 2020). The current study systematically used visual and effect size analyses to determine the impact of the intervention (PBL) on the dependent variable (daily DBRC percentage scores). Teacher burnout scores were also analyzed.
Visual Analysis
We followed the recommendations from Kratochwill et al. (2013) employing four steps of analysis including (a) patterns of predictability at baseline, (b) patterns of predictability during the intervention, (c) documentation of between phase effects, and (d) documentation of experimental control. Based on these four steps, we used the online tool for Systematic Protocols for Visual Analysis (Wolfe et al., 2020) to determine functional relation and basic effect using a six-point evaluation system whereas a zero score indicates no effects or functional relation and a five score indicates three effects, a functional relation, and large behavioral change. In addition, Kratochwill et al. (2013) suggested six variables of consideration for visual analysis including (a) level, (b) trend, (c) variability, (d) overlap, (e) immediacy of effect, and (f) consistency across similar phases. Lane and Gast (2014) provide guidance in calculating level (i.e., means for each condition per each student), trend (i.e., use of the split-middle procedure to determine if the hypothesized direction of the dependent variable is positive); and variability (i.e., calculated as 80% or more of the data falling within ±30% of the median). Overlap was calculated as a percentage using the inverse of percent of non-overlapping data (PND) as introduced by Scruggs et al. (1987). PND was calculated using an online calculator (Tarlow & Penland, 2016). Acceptable overlap is considered if less than 30% of the treatment datapoints overlap with the baseline datapoints for each tier (Wolfe et al., 2019). The immediacy of effect was calculated using the mean levels of the last three data points in baseline compared to the first three data points of intervention (Kratochwill et al., 2013) and consistency across similar phases was calculated using level, trend, and variability data (i.e., if the mean level is directionally appropriate as hypothesized, if the trend is positive, and variability is stable for each B phase of each tier of the design). Consistency will be determined to be absolute (i.e., indicators are 100% agreement across all treatment tiers), relative (i.e., indicators are 66% - 99%), or no consistency (i.e., indicators are below 66%). Analyses were conducted across all participants and conditions.
Effect Size Analysis
Two effect size metrics were calculated to determine the impact of the intervention on the dependent variable. The authors used within-case (Busk & Serlin, 1992; Gingerich, 1984) and between-case (Hedges et al., 2013; Pustejovsky et al., 2014) standardized mean difference (WC-SMD and BC-SMD, respectively) as parametric effect size measures. Specifically, WC-SMD and BC-SMD analyses consisted of consideration for pooled standard deviations (SD) across phases A and B due to assumptions of equal SD. All effect sizes were calculated using a 95% confidence interval. The online Single Case Effect Size Calculator was used to calculate the WC-SMD effect sizes (Pustejovsky et al., 2022b) with BC-SMD calculated using the Between-Case Standardized Mean Difference Estimator online calculator (Pustejovsky et al., 2022a). Previous authors (Harrington & Velicer, 2015; Pustejovsky, 2019; Zimmerman et al., 2018) have suggested interpretations of WC-SMD as small effect (0 to 1), medium effect (1 to 2.5), and large effect (greater than 2.5). BC-SMD effect size statistics are analogous to Cohen’s d metric (Cohen, 1988; Shadish et al., 2013; Valentine et al., 2016). As suggested by Cohen (1988), interpretations of Cohen’s d are as follows: small effect (d = 0.2), medium effect (d = 0.5), and large effect (d = 0.8).
Descriptive Analysis
The teacher and the paraprofessional were surveyed on teaching indicators of burnout as measured by satisfaction/dissatisfaction. The brief survey (Stempien & Loeb, 2002) was given during the baseline phase and again at the conclusion of the intervention phase. Pre- and post-intervention teaching burnout indicator scores (means and standard deviations) were compared.
Interobserver Agreement
Reliability data was collected and calculated via interobserver agreement (IOA) on the teacher’s and paraprofessional’s appropriate measurement of behaviors on the DBRC for each student included in the current study. We specifically examined the accuracy of (a) points awarded after each instructional session and (b) end-of-the-day point tallies. Two raters (the researcher and a trained graduate student) observed and scored at least 30% of the DBRC opportunities per student during baseline and intervention phases (number range of 8-12 occurrences). During both baseline and intervention phases, both the teacher and the paraprofessional had an IOA of 100% when compared against both the researcher and the graduate student. To protect against observer drift during the length of the study, IOA was calculated between the researcher and graduate student at six instances (3 baseline and 3 interventions; IOA = 100%).
Treatment Integrity
Due to the nature of the intervention, the implementation of PBL instruction was checked at the conclusion of the study (post-intervention) with two raters (the researcher and a graduate student). We used the Essential Project Design Elements Checklist (BIE, 2018) to assess the fidelity of PBL instructional implementation. The checklist components match the criteria for high-quality PBL instruction with 8 items and use a system of positive, negative, or questionable for each component. At the conclusion of the intervention, the researcher and a graduate student independently completed the checklist and found that the teacher and paraprofessional scored 100% on procedural implementation of PBL instruction.
Social Validity
To determine the social validity of PBL instruction, the teacher and paraprofessional were given the Usage Rating Profile-Intervention Revised (URP-IR; Chafouleas et al., 2011). The URP-IR used a Likert-type scale of one through six (i.e., 6 = strongly agree, 5 = agree, 4 = slightly agree, 3 = slightly disagree, 2 = disagree, and 1 = strongly disagree). Due to the nature of the intervention, only a portion of the survey was applicable. Therefore, 23 of 29 items were surveyed, representing four of the six subsets and focusing on (a) Acceptability, (b) Understanding, (c) Feasibility, and (d) System Climate. The teacher had a mean of 5.69 (SD = 0.47) and the paraprofessional had a mean of 4.78 (SD = 0.67).
Social validity for the students was measured using a 6-item survey. Five items used a five-point scale in which 1 = strongly disagree and 5 = strongly agree. The items were as follows:
I enjoyed working on the project.
I understood the project and how to get it done.
I learned new skills while working on the project.
I improved my behavior because of the project.
I would like to do another project for class.
The sixth question was open-ended for students to respond to.
6. Write anything you think and want to say about the project.
Results
We sought to analyze the effects of PBL instruction on EBD student behavior and instructor personal feelings regarding burnout. Results are presented in accordance with each research question using systematic visual analysis (Kratochwill et al., 2013; Lane & Gast, 2014; Scruggs et al., 1987; Tarlow & Penland, 2016; Wolfe et al., 2019, 2020), effect size analysis (Busk & Serlin, 1992; Gingerich, 1984; Hedges et al., 2013; Pustejovsky et al., 2014), and descriptive analysis. Analysis was conducted across four student participants and two instructional participants.
Visual Analyses
Visual inspection of graphed data suggests a functional relation was demonstrated in the use of PBL to improve behavior for all four students. (see Figure 2). Level analysis indicates that all students had a mean percentage increase from baseline to treatment. Each student had a positive or therapeutic trend as measured by an improvement in DBRC percentage of points earned. Based on the thresholds set, the data indicate stability over the time of the study. All students had below 30% of data points overlap from baseline to treatment phases. Based on the means of the last three data points in baseline and the first three data points during the intervention, all students had a visible immediate effect of using PBL to improve behavior. The results related to consistency across similar phases (i.e., intervention phase) indicate an absolute consistency of 100% across intervention phases for all students. See Table 2 for detailed visual analysis results.
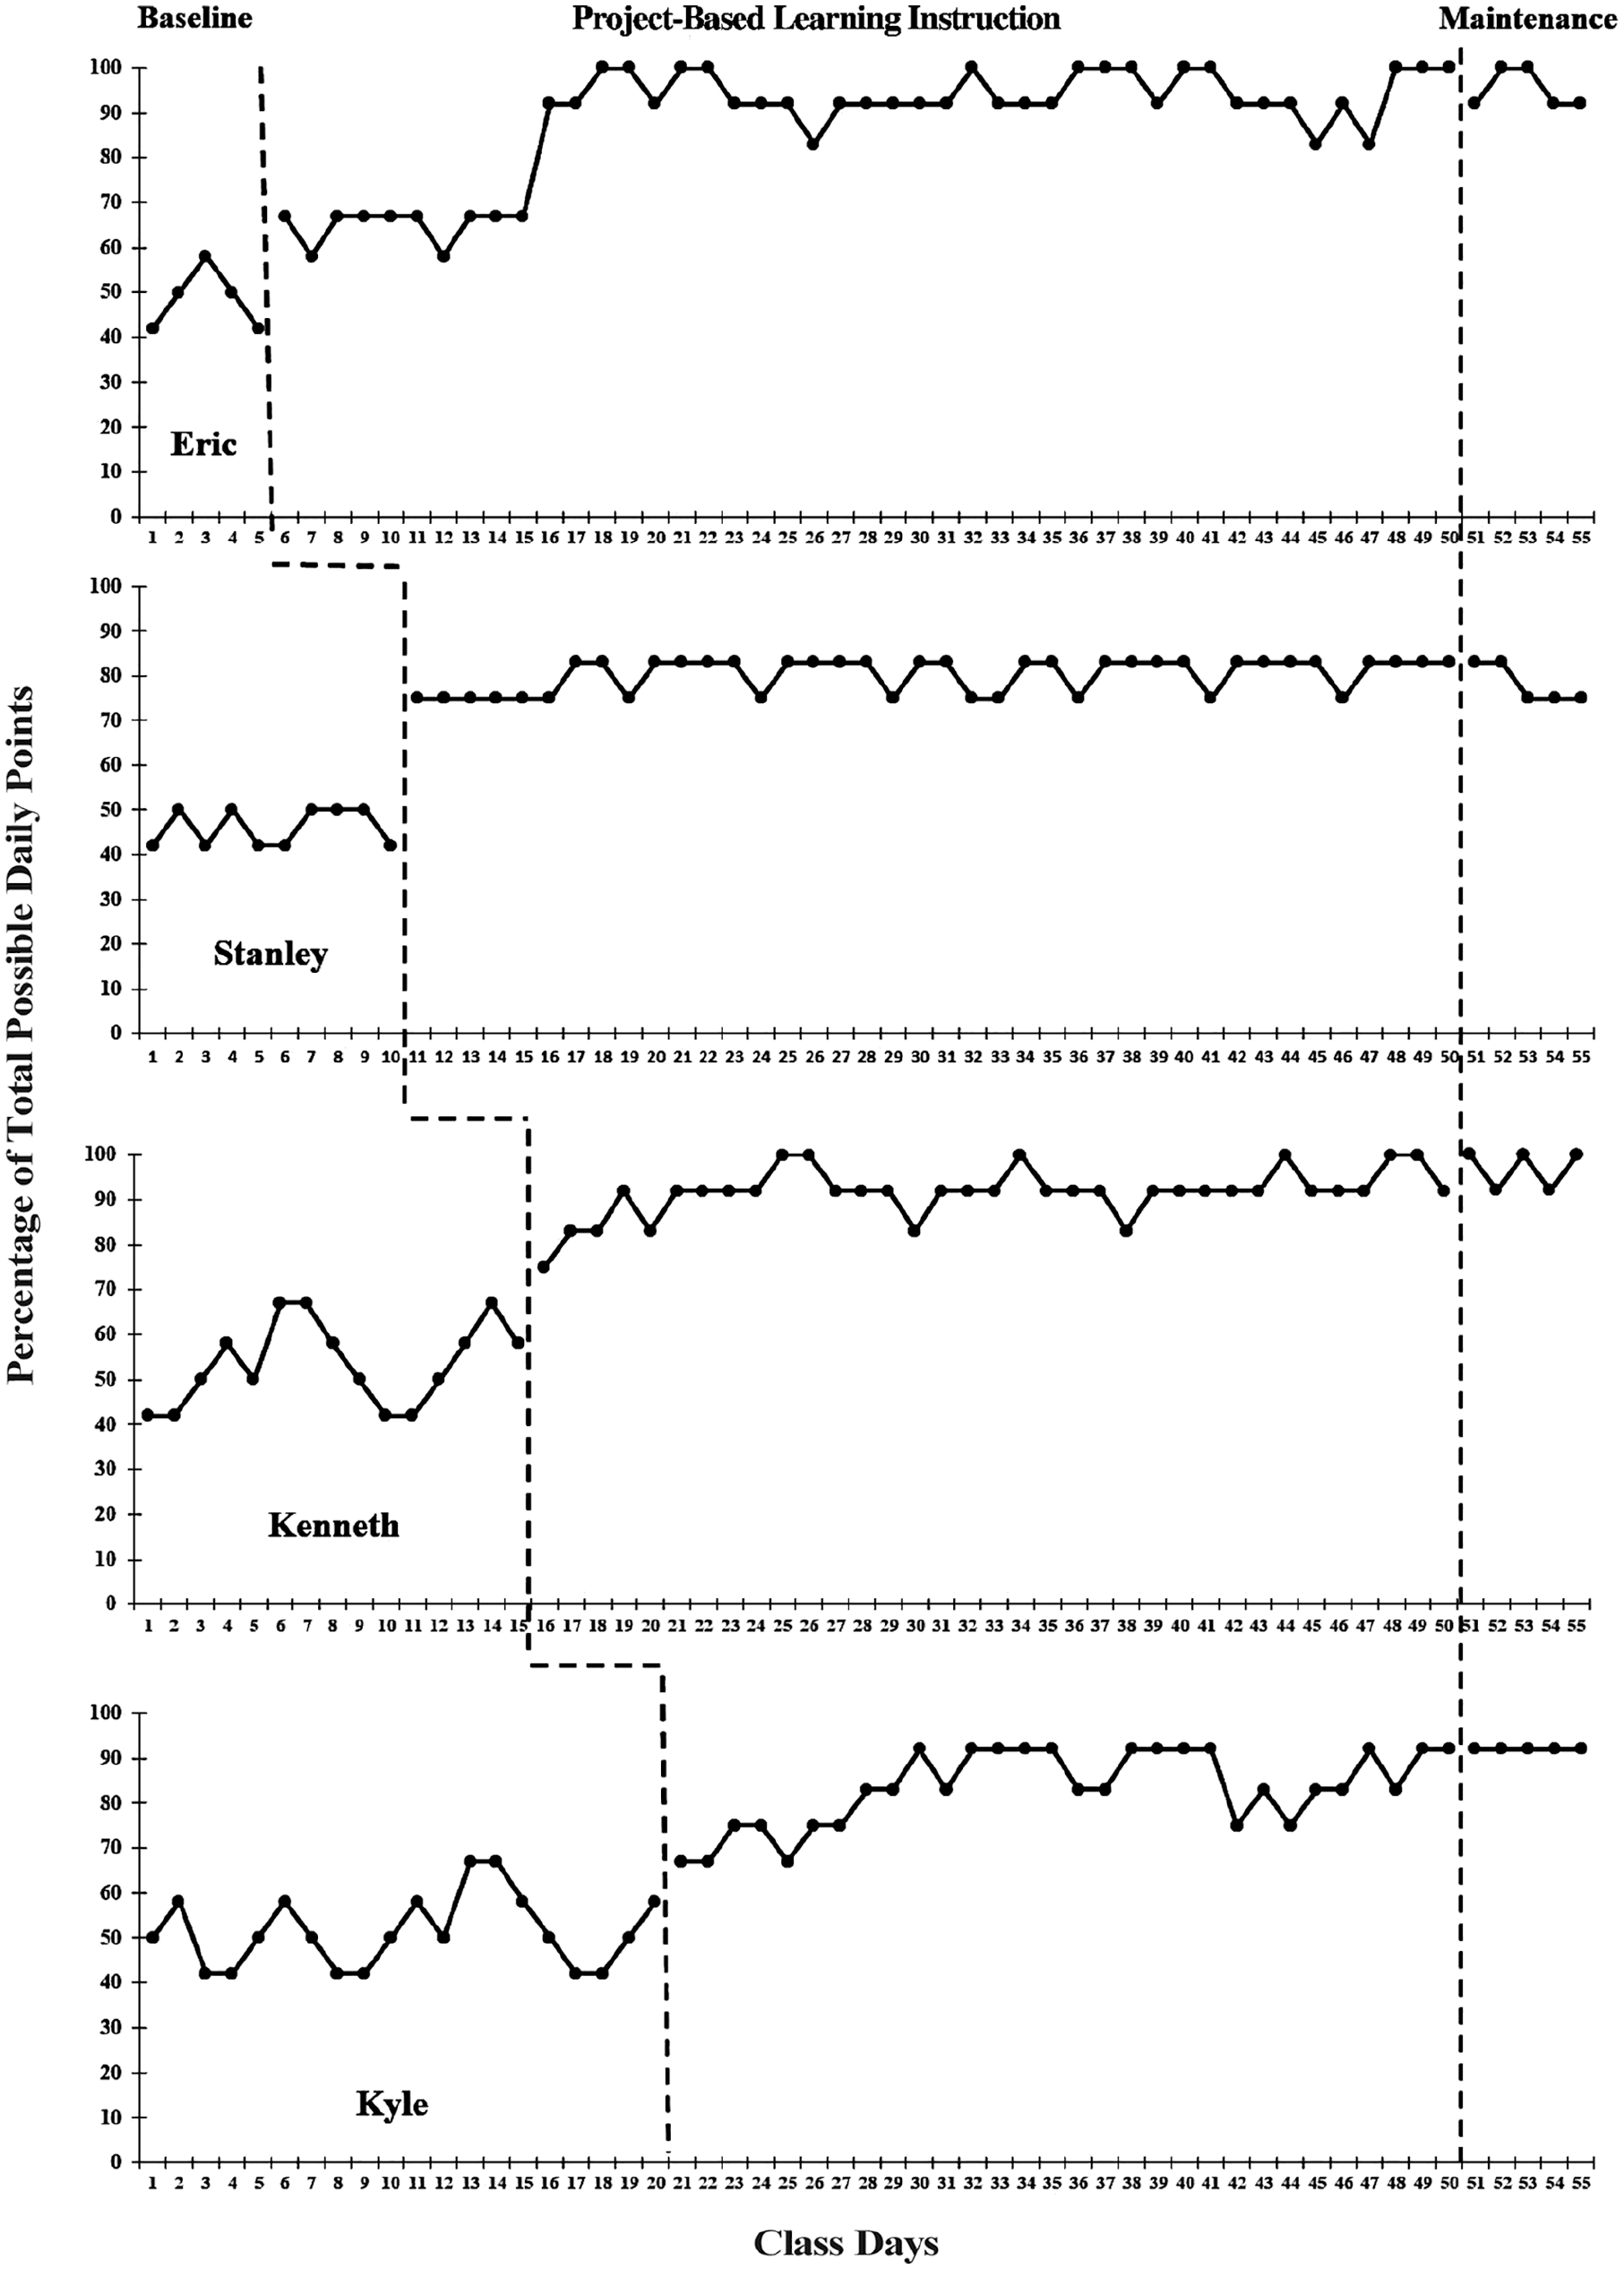
Percentage of Daily Total Points Scored on DBRC.
Visual Analysis Results for Study Participants.
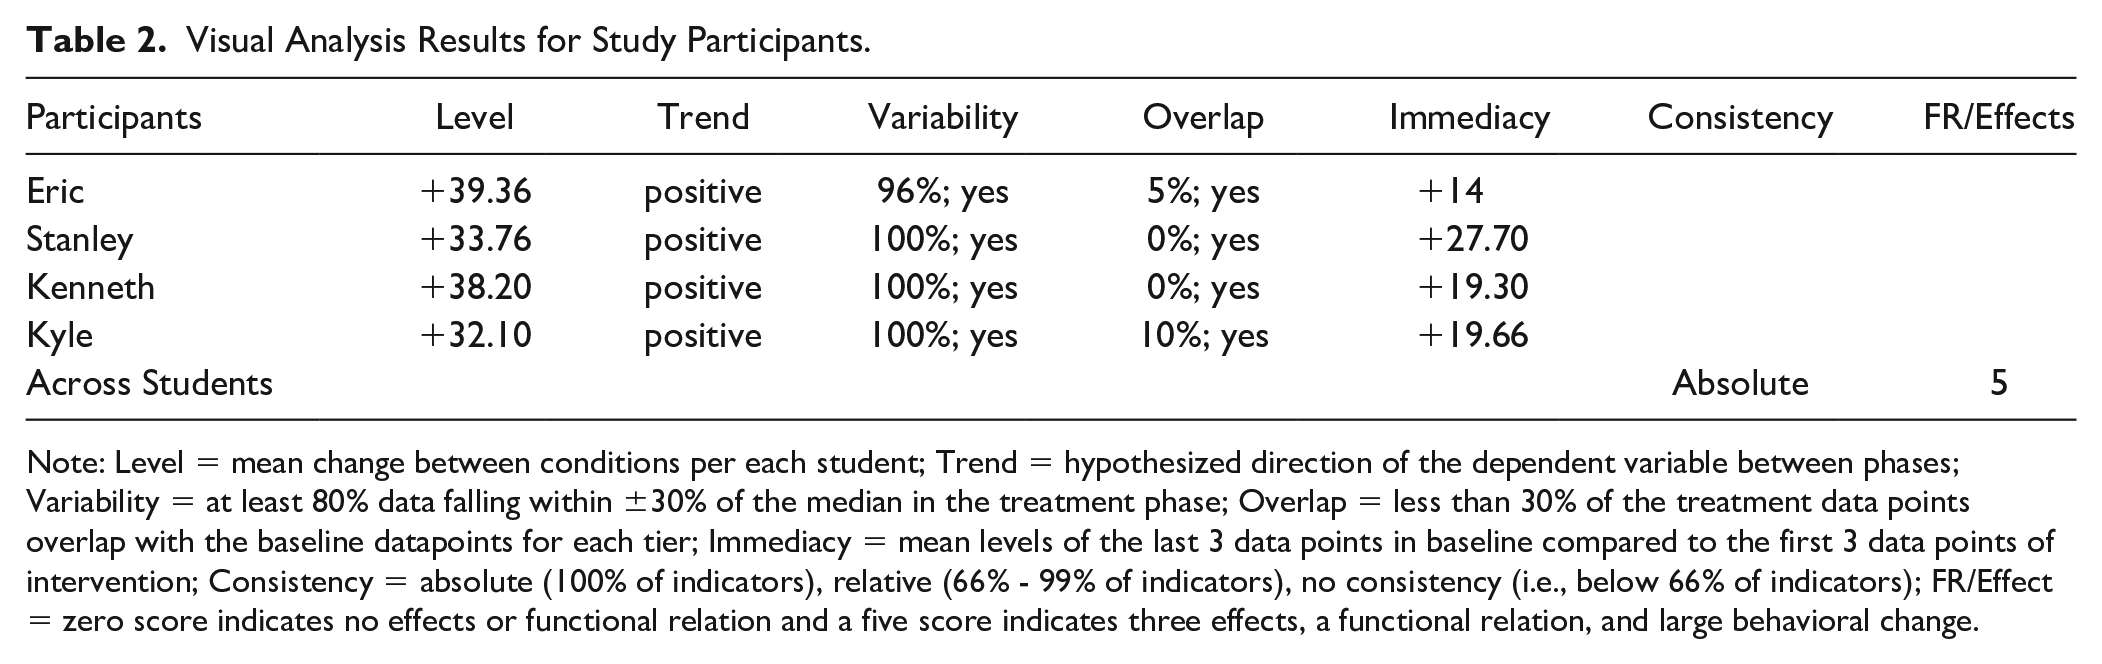
Note: Level = mean change between conditions per each student; Trend = hypothesized direction of the dependent variable between phases; Variability = at least 80% data falling within ±30% of the median in the treatment phase; Overlap = less than 30% of the treatment data points overlap with the baseline datapoints for each tier; Immediacy = mean levels of the last 3 data points in baseline compared to the first 3 data points of intervention; Consistency = absolute (100% of indicators), relative (66% - 99% of indicators), no consistency (i.e., below 66% of indicators); FR/Effect = zero score indicates no effects or functional relation and a five score indicates three effects, a functional relation, and large behavioral change.
Effect Size Analyses
WC-SMD and BC-SMD were conducted on the data with and across all four students on the impact of PBL on student behavior as measured by daily DBRC percentages. Both effect size measures were used to further investigate the impact of the treatment and to support the findings of the systematic visual analysis. All student results met the criteria for indicating a large effect. See Table 3 for each student's WC-SMD results. The BC-SMD estimate for PBL was 2.7553 (SE = 0.5085; 95% confidence interval [1.7030, 3.8076]). BC-SMD met the criteria for showing a large effect.
Within Case Standard Mean Difference Effect Sizes.
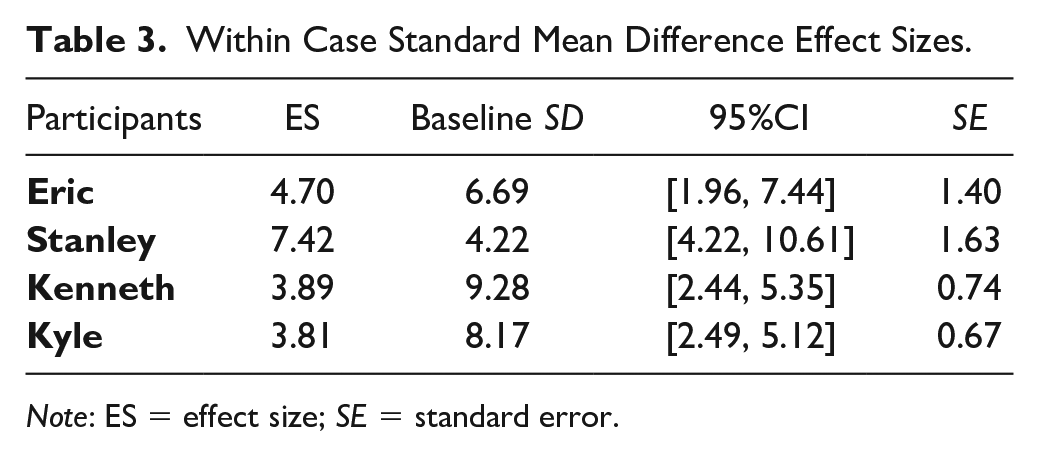
Note: ES = effect size; SE = standard error.
Descriptive Analysis
The teacher and paraprofessional answered a five-question survey on burnout indicators using a five-point Likert-type scale (1 = strongly agree to 5 = strongly disagree). Each question was presented to the teacher and paraprofessional prior to the intervention beginning and at the conclusion of the study. As some of the questions are inversely weighted, total means and standard deviations would not be appropriate. Scores were clustered as positively or negatively weighted. That is, lower ratings (1 or 2) for Question 1 (I enjoy working with my students), Question 2 (I feel that teaching is a rewarding experience), and Question 3 (I have the opportunity to express my creativity in my teaching) all indicate higher job satisfaction. Conversely, higher ratings (4 or 5) indicate higher job satisfaction for question 4 (If I had the option to change careers, I would not choose teaching) and question 5 (I often feel frustrated when teaching my students), respectively. Overall, both the teacher and the paraprofessional indicated increased job satisfaction from pre- to post-ratings. Prior to the intervention, on positive questions (1, 2, and 3) the teacher rated his job satisfaction M = 3 (SD = 1) and the paraprofessional rated his as M = 4.33 (SD = 0.58) with negative questions (4 and 5) rating at M = 2 (SD = 0) and M = 1 (SD = 0), respectively. Both the teacher and paraprofessional indicated low job satisfaction. At the conclusion of the study, job satisfaction showed marked improvements for the teacher (positive questions—M = 1.66, SD = 0.58; negative questions—M = 4, SD = 0) and the paraprofessional (positive questions—M = 2, SD = 0; negative questions—M = 3.50, SD = 0.71).
Discussion
The current study examined the impact of PBL on both student behavior and teacher burnout as measured by job satisfaction. The study used a multiple-baseline across-participants design to determine the effects of the PBL student's daily behavior and measured changes in teaching job satisfaction based on burnout indicators for the teacher and paraprofessional. Results of the study show a functional relation between the introduction of PBL and improvements of student behavior as measured by DBRCs for each student. Results also indicate an increase in teacher satisfaction. As evaluated by multiple raters, PBL was implemented with high levels of treatment fidelity and was rated as socially valid by teachers and students.
Project-Based Learning Instruction
The use of PBL showed a functional relation between the instructional method and students’ classroom behavior as rated on individual DBRCs. All participants’ behaviors improved daily as a percentage and demonstrated behavioral maintenance. Prior to the implementation of PBL, student behavior ranged from inconsistent to increasingly challenging. As indicated by visual analysis, the introduction of PBL support increases each student's pro-social behavior and task completion. Furthermore, positive behavior persisted as indicated by maintenance data. WC-SMD indicated that individually each student had demonstrated a large effect in positive behavior as attributed to PBL instruction. A BC-SMD of 2.7553 indicates that across all students PBL successfully supports student behavior. While previous research as shown that PBL has been successful instruction method for students with disabilities in STEM (Terrazas-Arellanes et al., 2018; Wei et al., 2021), the current study is first to specifically examine the effect of PBL on student behaviors. As students with EBD are traditionally missing instruction due to their behavior, the use of PBL may provide an instructional methodology that encourages positive prosocial behaviors and decreases missed academic instructional time. For teachers, the use of PBL allows for instruction in multiple content areas simultaneously, which may save time and provide connections for students on how subject areas are related. PBL also provides an additional opportunity for teachers to leverage resources and reinforcement in the classroom which may support encouraging student positive behavior.
Instructor Job Satisfaction
Prior to the implementation of PBL instructionally, the teacher and paraprofessional reported lackluster job satisfaction. As previous research has indicated, EBD teachers burnout and leave the classroom due to stress and lack of job satisfaction as caused by excessive problematic student behaviors (Adera & Bullock, 2010; Aloe et al., 2014; Gilmour & Wehby, 2020). After PBL implantation, post-test results indicate a marked difference in positive job satisfaction for both the teacher and paraprofessional. As this study is the first study to investigate the connection between teaching method (PBL) and teacher burnout (job satisfaction indicators), the results provide insight into the use of an alternative instructional practice and its potential impact for educators and students with EBD.
Limitations
There are a number of limitations of the current study. The first limitation relates to the data collection tools (i.e., dependent variables). The use of DBRCs has been established as a valid intervention method to improve behavior (Riden et al., 2021); however, research on their use as a dependent measure is non-existent. While this study makes novel use of the DBRCs as a dependent variable measure, more research studies examining their use as outcome measures are needed. The job satisfaction questions were used by other researchers, but their validity was not reported in the previous study. More standardized measures may provide corroborating evidence, thus increasing confidence in the findings presented.
The use of PBL as a means of behavioral improvement and teacher job satisfaction is a novel approach and examination. More research is needed to examine the use of PBL for students with disabilities, particularly for students with EBD. Similarly, the use of PBL to increase job satisfaction to stem burnout needs additional research. While the current study indicated high treatment integrity and social validity, the impact of PBL as an instructional approach for students with EBD requires significantly more research. Furthermore, research on how to stem EBD educator burnout and the connection to job satisfaction should be explored.
More research is needed with additional measures and controls. Future research questions should focus on the use of PBL in for science and math, subjects where PBL is more common, and how it impacts students with EBD. In addition, for EBD students in general education settings, how effective is PBL as an instructional method for academics and behavior? Studies should include additional single-case research designs (e.g., ABAB reversal) as well as collective group design analysis as appropriate. Finally, while the current paper attempts to contribute to the research sphere on EBD teacher burnout, the need for varied and robust examinations of strategies and practices that stem teacher burnout is needed.
Conclusion
Findings from the current study provide emerging evidence that the use of PBL can support student positive prosocial behavior for students with EBD and can increase teacher feelings of job satisfaction. Large effect sizes for students and marked improvements in job satisfaction for teachers are promising and warrant further research on the impact of PBL instruction for students and teachers. Furthermore, the current study used a novel method for the use of DBRCs as data collection tool beyond the typical use as an evidence-based practice. While limitations were noted, results from the study, high ratings of social validity and treatment fidelity suggest PBL may be a way to support positive behaviors for students who are traditionally considered challenging (i.e., students with EBD) and for keeping special educators in the classroom.
Footnotes
Declaration of Conflicting Interests
The author(s) declared no potential conflicts of interest with respect to the research, authorship, and/or publication of this article.
Funding
The author(s) received no financial support for the research, authorship, and/or publication of this article.