
Abstract
The purpose of this study was to examine the effects of a number line intervention with supported self-explanation on student understanding of fraction magnitude and quality of explanation. Participants were three U.S. middle school students with significant behavior problems. Participants were given eight lessons containing explicit instruction for fraction number line placement and self-explanation. A multiple-probe design was used to evaluate the effects of the intervention. Visual analysis and Tau-U showed the intervention was very effective for improving student placement of fractions on the number line and increasing the quality of student explanations for their answers. Discussion of results and implications for future research and practitioners are included.
Keywords
The National Mathematics Advisory Panel (NMAP, 2008) identified fraction proficiency as an essential goal for U.S. Grades K through 8 math instruction. They stated that by eighth grade, students “should be able to locate positive and negative fractions on a number line; represent and compare fractions, decimals, and related percentage; and estimate their size” (NMAP, 2008, p. 18). Not only is the importance of fraction knowledge stressed by NMAP, research has found that it is one of the most significant and unique predictors of high school algebra skills and general math achievement (Siegler et al., 2012). Without a strong foundation of fraction knowledge, students may struggle to succeed in more complex math courses and be limited in their opportunities to enter science, technology, engineering, and math (STEM) career fields (NMAP, 2008).
Despite the emphasis on the importance of fraction development, it continues to be a challenging topic for students. In a survey conducted by NMAP (2008), the panel found that poor performance in rational numbers, especially fractions and decimals, was reported as a main concern for high school algebra teachers. This poor performance is supported by nationwide data from the National Assessment of Educational Progress (NAEP). In 2017, 67% of fourth graders could not correctly compare fractions with a given fraction and 70% of eighth graders could not label two points between whole numbers on a number line (i.e., 0.8 or 4/5 between 0 and 1; U.S. Department of Education, 2017). These data suggest that students are not meeting the standards for fraction understanding, which could have a long-term impact on their education.
Why Students Struggle With Fractions
Research has identified several reasons that may explain why students struggle to learn fractions. The following sections outline the possible causes for fraction difficulties.
Whole Number Knowledge
Fractions are abstract, and students tend to revert to using their knowledge of whole numbers to work with them (Malone & Fuchs, 2017; Namkung et al., 2018; Siegler et al., 2011; Siegler & Pyke, 2013; Tian & Siegler, 2017; Zhang et al., 2017). This process leads to whole-number bias, which is defined as students focusing on the whole number concepts when working with fractions. Whole number bias can lead to students treating the numerator and denominator of fractions as separate whole numbers instead of as a single number (Braithwaite & Siegler, 2018; Ni & Zhou, 2005).
Whole number bias is evident in student errors. Malone and Fuchs (2017) investigated the error patterns in ordering fractions of fourth-grade students who were at risk for math difficulties. Results showed that the most frequent error (i.e., 65% of all errors) made by students was whole number ordering errors, meaning that the students ordered the fractions based on the whole number magnitude of the numerator or the denominator. For example, a student may answer that
Whole number bias, nevertheless, significantly decreases for students without disabilities from fourth to eighth grade (Braithwaite & Siegler, 2018). Examining the developmental trajectory of whole-number bias for students in Grades 4 through 8, Braithwaite and Siegler (2018) found that only 34% of eighth graders still relied on whole-number bias to solve fraction problems, compared with 59% of fourth graders. Although Braithwaite and Siegler (2018) did not investigate why these developmental changes in whole number bias occur, they hypothesized that fraction instruction relevant to fraction magnitude, typically occurring in fourth and fifth grades, could be responsible for these changes. Thus, instruction in fraction magnitude should support the reduction of whole number bias for students.
The suggestion to focus instruction on fraction magnitude does not mean that part–whole representations of fractions are inappropriate or unnecessary. In fact, a key component of fraction knowledge is understanding that a fraction represents a part or parts of a whole or a set, which can be best represented using the part–whole representation (e.g., number of shaded parts; Van De Walle et al., 2019). Limiting fraction instruction to area models, part–whole interpretations, and a lack of a precise vocabulary can lead students to continue to have whole number bias while working with fractions (Fuchs et al., 2017; Gersten et al., 2017; Tian & Siegler, 2017; Wu, 2011).
While applying whole number strategies to fractions can hinder performance, adequate understanding of whole numbers has been found to predict stronger fraction performance (Namkung et al., 2018). Namkung and colleagues (2018) found that students with severe whole number difficulty were around 32 times more likely to experience fraction difficulties than students with adequate whole number competence. An earlier study by Namkung and Fuchs (2016) found that whole number and fraction competence use the same cognitive resources, specifically attentive behavior, processing speed, and nonverbal reasoning. Understanding the underlying cognitive processes and executive functioning skills required to work with fractions is essential, as students with deficits in these areas have been found to be unresponsive to some fraction interventions (Krowka & Fuchs, 2017).
Math Difficulties for Students With Significant Behavior Problems
Deficits in cognitive processes and executive functioning, such as working memory and attentive behavior, are characteristics of students with significant behavior problems (Stoutjesdijk et al., 2012). Lane and colleagues (2008) found that students with significant behavior problems score well below the 25th percentile rank (PR) in math achievement and that this achievement gap worsened as students entered secondary grades. Therefore, the executive functioning deficits along with low academic performance indicate a need for targeted academic interventions for students with significant behavior problems. In addition, the comorbidity of significant behavior problems and language disorders is well documented; students with significant behavior problems are at a heightened risk for difficulties with receptive and expressive language that can coexist with number sense difficulties (Chow & Wehby, 2018; Jordan, 2007; Schmitt et al., 2014). Thus, the linguistic complexities and unclear definitions for fractions may put students with significant behavior problems at a higher risk for fraction difficulties (Berch, 2017; Jordan et al., 2017; Siegler & Pyke, 2013; Wu, 2011). Without appropriate instruction, students with significant behavior problems will continue to fall behind their typically developing and low-achieving peers (Hansen et al., 2017; Lane et al., 2008; Mazzocco et al., 2013).
Integrated Theory of Whole Number and Fraction Development
To address the issue of whole number knowledge impeding fraction learning, Siegler and colleagues (2011) proposed an integrated theory of whole number and fraction development. Their theory conceptualizes fractions as a continuation of whole number development instead of exclusive from it, meaning that fractions have a magnitude and value that can be found on a number line just like whole numbers. Therefore, an understanding of fractions would result in a deeper understanding of the number system. To apply Siegler et al.’s (2011) theory, teachers may use the number line to help students make direct connections between whole numbers and fractions (Fazio et al., 2016; Hamdan & Gunderson, 2017; Saxe et al., 2013). Previous research suggests that self-explanation can further support gains in the conceptual understanding of fractions and their relation to whole numbers (Fuchs et al., 2016; Rau et al., 2015).
The Number Line
A critical component of fraction knowledge is the understanding of fraction magnitude and the ability to locate a fraction on a number line (NMAP, 2008). The number line best supports fraction magnitude knowledge, as it allows for the representation of negative fractions and improper fractions better than part–whole representations. Number lines can represent whole number and fraction magnitude simultaneously, which support their use as an appropriate representation of fraction magnitude (i.e., conceptual knowledge) and adequately support the development of operational procedures for whole numbers and fractions (Gersten et al., 2017).
A few intervention studies have examined the effectiveness of the number line as the sole fractional representation for students at risk for math difficulties at the elementary level (Barbieri et al., 2020; Fazio et al., 2016; Hamdan & Gunderson, 2017; Saxe et al., 2013). In each study, the use of the fraction number line was more effective than control conditions and to other fraction representations such as area models, indicating the effectiveness of using the number line to support fraction magnitude knowledge.
Self-Explanation
Along with number line interventions, research indicates that self-explanation can help gain a better understanding of both student strategy use and their comprehension of the material (Schumacher et al., 2018; Siegler, 2002). Self-explanation within an instructional context is defined as “generating explanations for oneself in an attempt to make sense of relatively new information” (Rittle-Johnson et al., 2017, p. 600). Self-explanation has been shown to help students generalize the strategy they are learning and improve their recall of procedures (Crowley & Siegler, 1999). A meta-analysis by Rittle-Johnson and colleagues (2017) supported the use of scaffolded instruction for self-explanation in math, as it promotes a deeper understanding of math concepts and procedures. Of the 26 studies published between 1998 and 2015 included in their review, however, only one focused on self-explanation within fraction instruction (i.e., Rau et al., 2015), indicating a need for more research on the effect of self-explanation of the conceptual understanding of fractions. In addition to the study by Rau and colleagues (2015), only one other study was found to manipulate a supported self-explanation variable within fraction instruction (Fuchs et al., 2016). Fuchs et al. (2016) found that among at-risk fourth graders, supported self-explanation for fraction magnitude instruction was more effective for students with weaker working memory, and it may help compensate for deficits in that area. Considering the potential language deficits of students with significant behavior problems and the linguistic complexities associated with fraction understanding, these students may benefit from targeted language support within mathematical interventions.
The Present Study
The purpose of this study was to test the effects of a number line intervention combined with supported self-explanation on the fraction magnitude knowledge of middle school students with significant behavior problems. More specifically, this intervention included a sequence of lessons that focused on teaching students how to represent fractions on different numerical ranges of the number line (e.g., 0–1, 0–5, 0–10) with the aim of helping students conceptually understand the magnitudes that fractions hold. Research questions were as follows:
Method
Participants and Setting
Participants
The participants were middle school students attending an alternative education school for students with significant behavior problems. Participants were selected for this study based on the following selection criteria: (a) student had consistent errors on fraction items on progress-monitoring probes; (b) student’s math instructional level was lower than the student-enrolled grade level; (c) student scored lower than 25th PR on Wechsler Intelligence Scale for Children, 5th edition–Working Memory Index (WISC-V WMI; Wechsler, 2014); and (d) student had IEP goals in math computation and problem solving on their Individualized Education Program (IEP). Four students who met the selection criteria were included in this study. However, one student dropped from this study due to truancy.
The remaining three participants had instructional levels below their actual grade level in math as determined by curriculum-based measures: Derek and Oliver performed on the fifth-grade instructional level, and Jacob performed on the third-grade instructional level. Because all participants were beyond the grade level for the introduction of fraction concepts, researchers administered a Fraction Number Line Estimation (FNLE) test to determine whether they had already mastered identifying the location of fractions on the number line. All students scored lower than 20% correct on the FNLE test. The following specially designed instructions (SDIs) were specified in each student’s IEP to support working memory difficulties throughout the school day: visual aids, chunking of academic material, and small-group or one-on-one instruction.
The most relevant problem behavior for all students in the study was work refusal, as each had an IEP goal addressing this behavior. Students were provided with school-wide positive behavior intervention and support (SWPBIS) tickets for their participation during each phase of the session; expectations were reviewed prior to intervention sessions; and when behaviors were exhibited during intervention, students were reminded of the expectations and what they were working toward. Reinforcement was provided immediately following the intervention sessions. See Table 1 for participant demographics and screening tests results.
Demographics for Middle School Participants in Number Line Intervention Study.
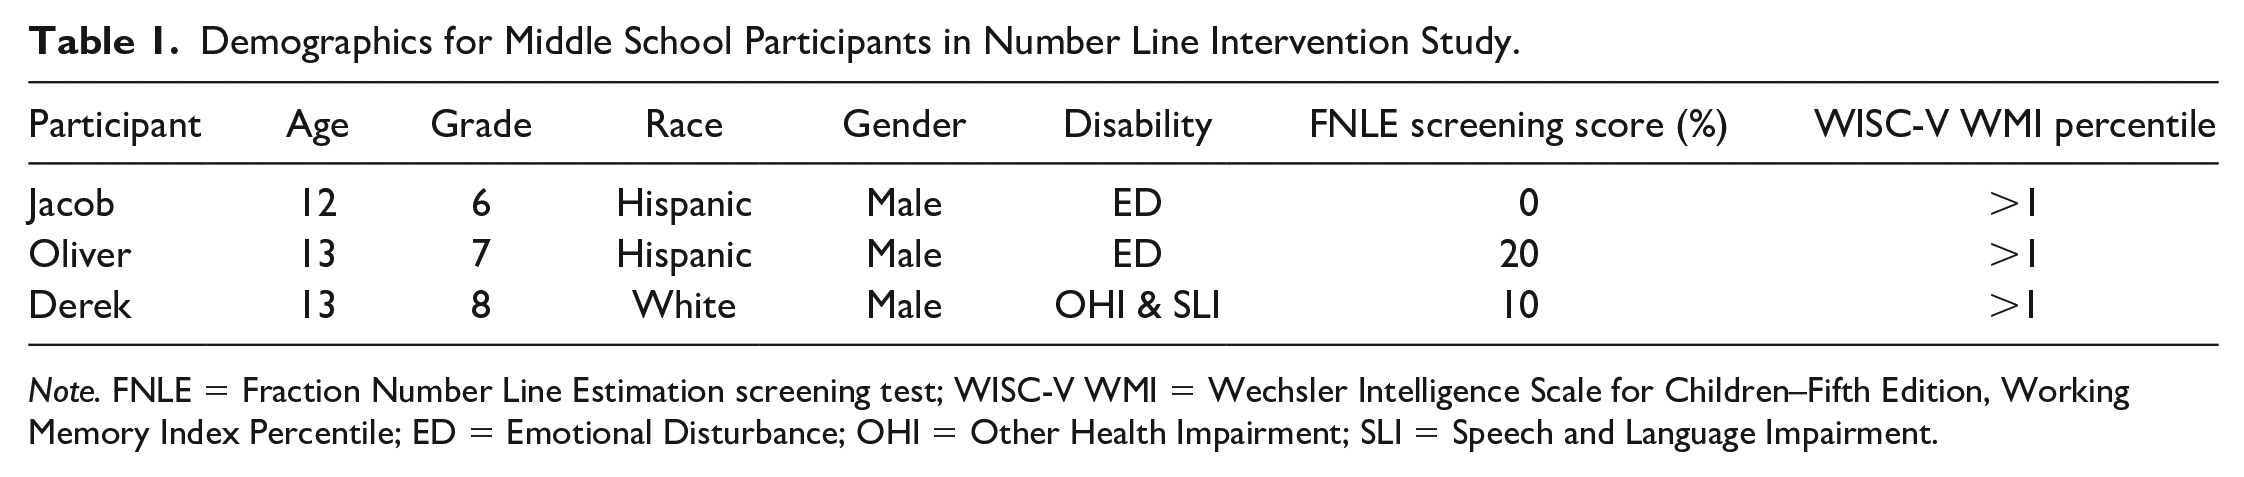
Note. FNLE = Fraction Number Line Estimation screening test; WISC-V WMI = Wechsler Intelligence Scale for Children–Fifth Edition, Working Memory Index Percentile; ED = Emotional Disturbance; OHI = Other Health Impairment; SLI = Speech and Language Impairment.
Setting
The intervention occurred in the spring of 2021 during an intervention period of the school day in the school library or conference room, which included round tables and chairs that allowed for appropriate social distancing and following of COVID-19 protocols. Located in eastern Pennsylvania, the school served 13 different districts in the area. Each student completed intervention assessments and lessons outside of their typical classroom.
The first author was the interventionist for the study and administered all intervention assessments and lessons. The first author had a special education teaching certification in Grades 7 through 12, was a full-time special education teacher for students with significant behavior problems at the school at the time of the study, and was a graduate student in special education.
Measures
Wechsler Intelligence Scale for Children, Fourth Edition (WISC-IV)
The Working Memory Index (WMI) of the WISC-V was used to screen students. The WMI WISC-V includes three subtests (Digit Span, Picture Span, and Letter Number Sequencing) and has an internal consistency score of .92.
Fraction Number Line Estimation With Self-Explanation
The dependent measure for this study was a fraction number line estimation probe (FNLE) adapted from Siegler et al. (2011). The original FNLE probe from Siegler and colleagues (2011) was given in electronic format. In the present study, the FNLE probe was adapted to a paper-and-pencil version that consisted of one fraction and one number line presented on each page, which is consistent with the electronic format. Each number line was segmented based on the whole number numerical range (e.g., 0–1, 0–2, 0–5, and 0–10). The FNLE measure requires presenting the student with one number line and a fraction placed above it. The fraction types used were unit fractions, proper fractions, and improper fractions. The student was verbally instructed to place the fraction on the number line and explain their answer. Each FNLE probe had 10 problems with one fraction and one number line per page. FNLE assessments have been reported to have an internal consistency of .87 (Resnick et al., 2016).
To ensure consistency across the probes, the numerical ranges of the number lines and fraction were randomly selected; the order of each numerical range and fraction type were controlled and consistent across each probe. FNLE probes were given after every other intervention lesson. Two maintenance probes were given 1 and 2 weeks after the final intervention lesson, following the same procedures.
Two dependent variables were calculated from the FNLE probes: percentage of absolute error (PAE) and student explanation quality (SEQ). PAE was the primary dependent variable of the study and was used to make intervention decisions (i.e., determine whether a student was able to move from the baseline to the intervention phase). PAE is the common measurement for fraction magnitude number line assessments (Fazio et al., 2016; Fuchs et al., 2017; Hamdan & Gunderson, 2017; Siegler et al., 2011). PAE computed the accuracy of the fraction placement on the number line by finding the absolute value of the difference of the student’s placement and the correct placement of the fraction on the number line. That result was then divided by the numerical range of the number line (e.g., 5, 10) and multiplied by 100 to get a percentage; the smaller the percentage, the more accurate the placement (Siegler et al., 2011).
Student explanation quality was the secondary dependent variable and was not used to make intervention decisions. It was calculated based on the information the student provided in their answer. The student could earn up to 4 points for verbally stating or pointing to each the following areas: 1 point for identifying the unit of measurement (i.e., segment from 0–1), 1 point for identifying the total number of units on the number line (i.e., 5 units total), 1 point for stating that the unit of the number line is segmented based on the denominator of the fraction, and a final point for explaining that they counted the unit fractions or used the numerator to reach the placement of the fraction on the number line. A checklist was used to code included information.
Each FNLE probe was given independently to the student outside of the classroom the day after every other lesson. The researcher administered each assessment. The researcher read the fraction out loud and instructed the student to place the fraction where they thought it belonged on the number line. After writing the fraction on the number line, the researcher asked the student to explain their answer. Each assessment administration was audio recorded. PAE for all 10 problems were averaged together, and the total number of quality explanation earned points were divided by the total number of possible points and multiplied by 100 to get a percentage. The researcher scored the FNLE probes for PAE and the SEQ, as described above.
Generalization
Two researcher-created generalization probes were given during the course of this study. The probe consisted of nine items on the following skills that were not taught during the intervention: ordering fractions, comparing fractions, and addition and subtraction of fractions with common denominators. Students were given the probes prior to baseline and after the maintenance phase. Number lines were provided to the students, but no prompts were given to use them. The probes were scored by percentage of problems correct.
Social Validity
The Kid’s Intervention Profile (KIP; adapted from Eckert et al., 2017) was used to assess social validity. The KIP consists of eight questions with responses on a Likert-type scale from 1 to 5 (1 = not at all to 5 = very, very much) that can be adapted to reflect a specific intervention. Answers to Items 3 and 8 were reversed to account for negative statements. Reliability of the original KIP is .789 (ranging = .66–.83 across cohorts; Eckert et al., 2017).
Design and Procedures
Design
A multiple-probe-across-participants design was used to evaluate the effects of this intervention. For baseline, 7 to 10 data points were collected for PAE and SEQ. Students entered intervention based on the stability of their baseline data on PAE. Students in extended baseline conditions completed three consecutive probes prior to entry into the intervention phase (Gast et al., 2014).
Baseline
During baseline, students participated in their business-as-usual math instruction during their assigned math period. No intervention lessons were given during this time. The school does not have a set curriculum; instead, the teachers are responsible for finding and creating their own curriculum based on student grade level and needs. The participants’ classroom teacher used error-based analysis to address gaps in student knowledge as well as curriculum resources such as Khan Academy and Edgenuity. Students did not receive any explicit fraction instruction in their regular math instruction during the time of this intervention. Topics covered in the student’s math class were geometry (e.g., finding the area and perimeter of shapes) and building early algebra skills (e.g., solving for variables). As part of the SWPBIS program, the behavior expectations are explicitly taught each year and reviewed each school day. Students also can earn tickets when they engage in expected behaviors, which can be used, along with their points, to redeem items from the school store. SWPBIS tickets were provided to the participants after each baseline session.
Intervention
This intervention consisted of eight structured lessons. The intervention occurred outside of their typical math class. SWPBIS was consistently implemented for each student throughout the entirety of the study. Each lesson used explicit instruction components of modeling, guided practice, and independent practice. Unique to this intervention, the lessons used different numerical ranges of number lines (e.g., locating 1/3 on 0–1 and 0–5 number lines) to assist with students’ conceptual understanding of fraction magnitude (see Table 2 for lesson topics and objectives). The first lesson consisted of introducing the student to units on the number line, and the second lesson taught students how to segment the number line based on the denominator of the fraction. The third through eighth lessons consisted of one fraction type taught, and the following lesson was a booster lesson. The lessons focused on locating unit fractions in Lesson 3, proper fractions in Lesson 5, and improper fractions in Lesson 7.
Instructional Scope and Sequence for Number Line Intervention.
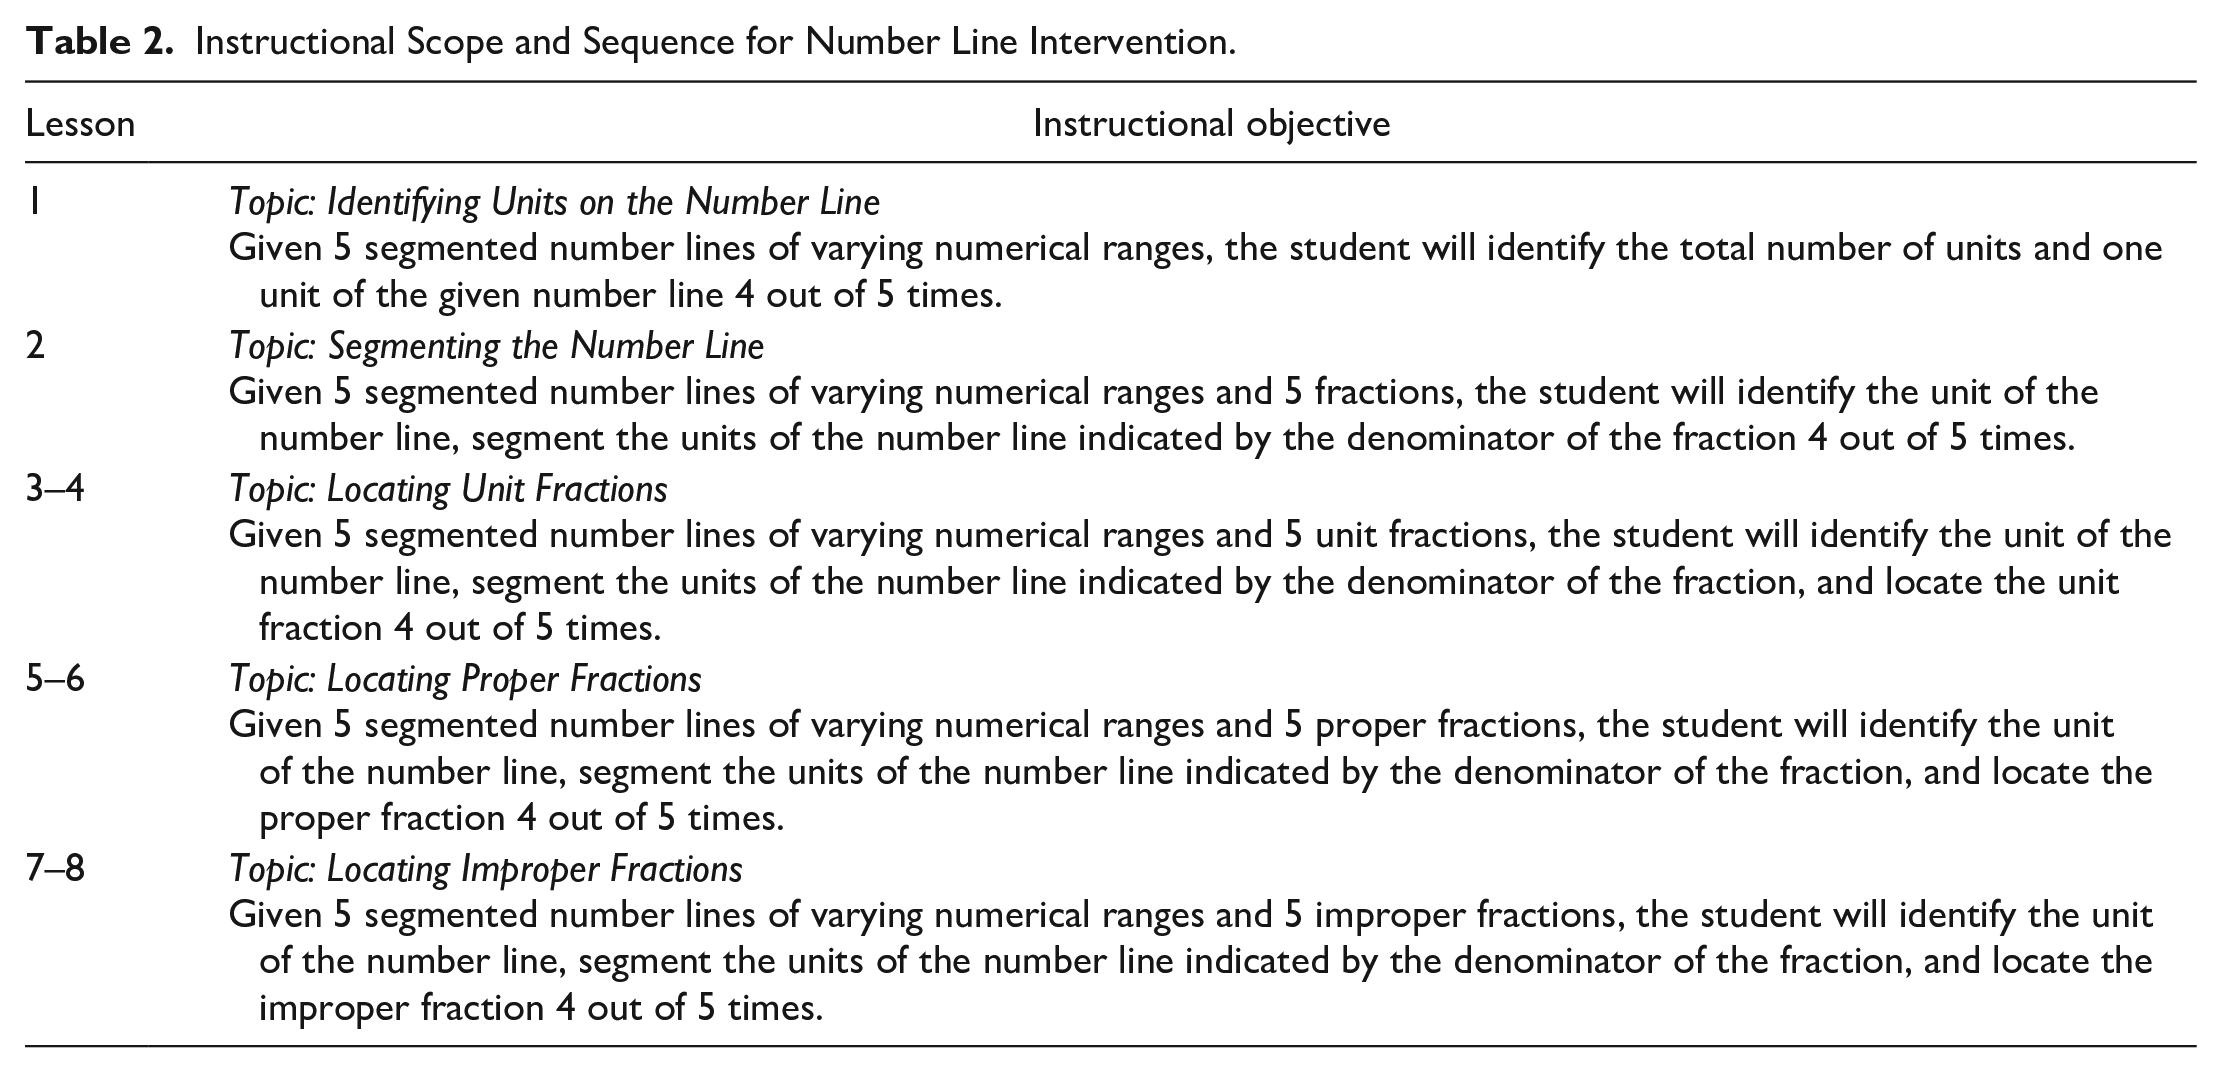
Each lesson also included explicit instruction for how to provide an explanation. For example, the interventionist modeled how to provide an appropriate self-explanation (e.g., “When you are asked to explain your answer, you will need to explain what the unit segment of the number line is and how many unit segments are in that number line”). The student was then prompted to state the requirements for a high-quality explanation as well as to provide the explanation throughout guided and independent practice (e.g., “What do we need to include when we are asked to explain our answer?”; “How many unit segments does this number line have?”).
Students received two to four lessons per week. Lesson duration ranged from 5 to 20 min with an average lesson duration of 12 min across participants. The shortest lessons were the booster lessons, which were administered to all students. Booster lessons were given to provide students with extra guided and independent practice with interventionist support. Booster lessons were given after the lesson that introduced finding a specific fraction type. For example, Lesson 3 introduced students to finding unit fractions on the number line, and Lesson 4 was a booster lesson with guided and independent practice on finding unit fractions on the number line.
Materials for each lesson included laminated number lines with the numerical ranges that were used during that lesson’s modeling and guided practice along with dry erase markers and an eraser; corresponding independent worksheets were printed, and pencils were provided to students. An audio recorder was used to record each lesson. The students received tickets toward the SWPBIS system as described above; the tickets could be traded in for tangible items.
Maintenance
The maintenance phase followed the same procedures as the baseline phase. Students no longer received intervention lessons and only participated in their typical math classwork. Maintenance probes were administered 1 and 2 weeks after intervention except for Derek, who only was able to complete one maintenance probe due to the school year ending.
Treatment Fidelity and Interscorer Agreement
Graduate students, who were not the interventionist, completed the treatment fidelity and interscorer agreement (ISA) measures. All graduate students received a 45-min training on the purpose of the study and review of the materials (e.g., fidelity checklists). The graduate students completed practice fidelity sessions with 100% agreement with the author, and the graduate students met at least 98% agreement for PAE and SEQ scoring practices. Treatment fidelity was calculated using a fidelity checklist that followed the structure of each lesson (Horner et al., 2005). Fidelity measures were conducted using the audio recordings from the lessons. For the FNLE probes, dividing the smaller PAE by the larger PAE and multiplying it by 100 to obtain a percentage was the calculation used for PAE ISA. The total number of checked items on the quality checklist agreed upon between the scorers divided by the total number of agreements and disagreements multiplied by 100 to calculate the ISA for SEQ (Kazdin, 2017).
ISA was conducted for 37% of baseline, 50% of intervention, and 50% of maintenance sessions. Mean ISA for PAE across participants was 96.6% with a range from 87.9% to 100%. The mean ISA for SEQ for all participants was 94.1% with a range from 67.5% to 100%. Both ISA average scores are within the acceptable range. Mean treatment fidelity was 98.8% across all participants with a range from 97.6% to 100% for 37.5% of lessons for each participant.
Data Analysis
The authors used visual analysis to evaluate the data. Immediacy was not expected on the students’ academic skills because it was expected that it would take more time for progress to be visible on these skills. Since immediacy was not expected at the start of intervention, the authors calculated Tau-U to account for undesirable baseline trend and to calculate an effect size (Parker et al., 2011). Effect sizes were interpreted as follows: ≤65 is questionable; between .66 and .92 is effective; and ≥93 is very effective (Rakap, 2015).
Results
Intervention Effects
Baseline
The visual graph of the results can be found in Figure 1. All participants showed high PAE in the baseline phase and low SEQ scores.
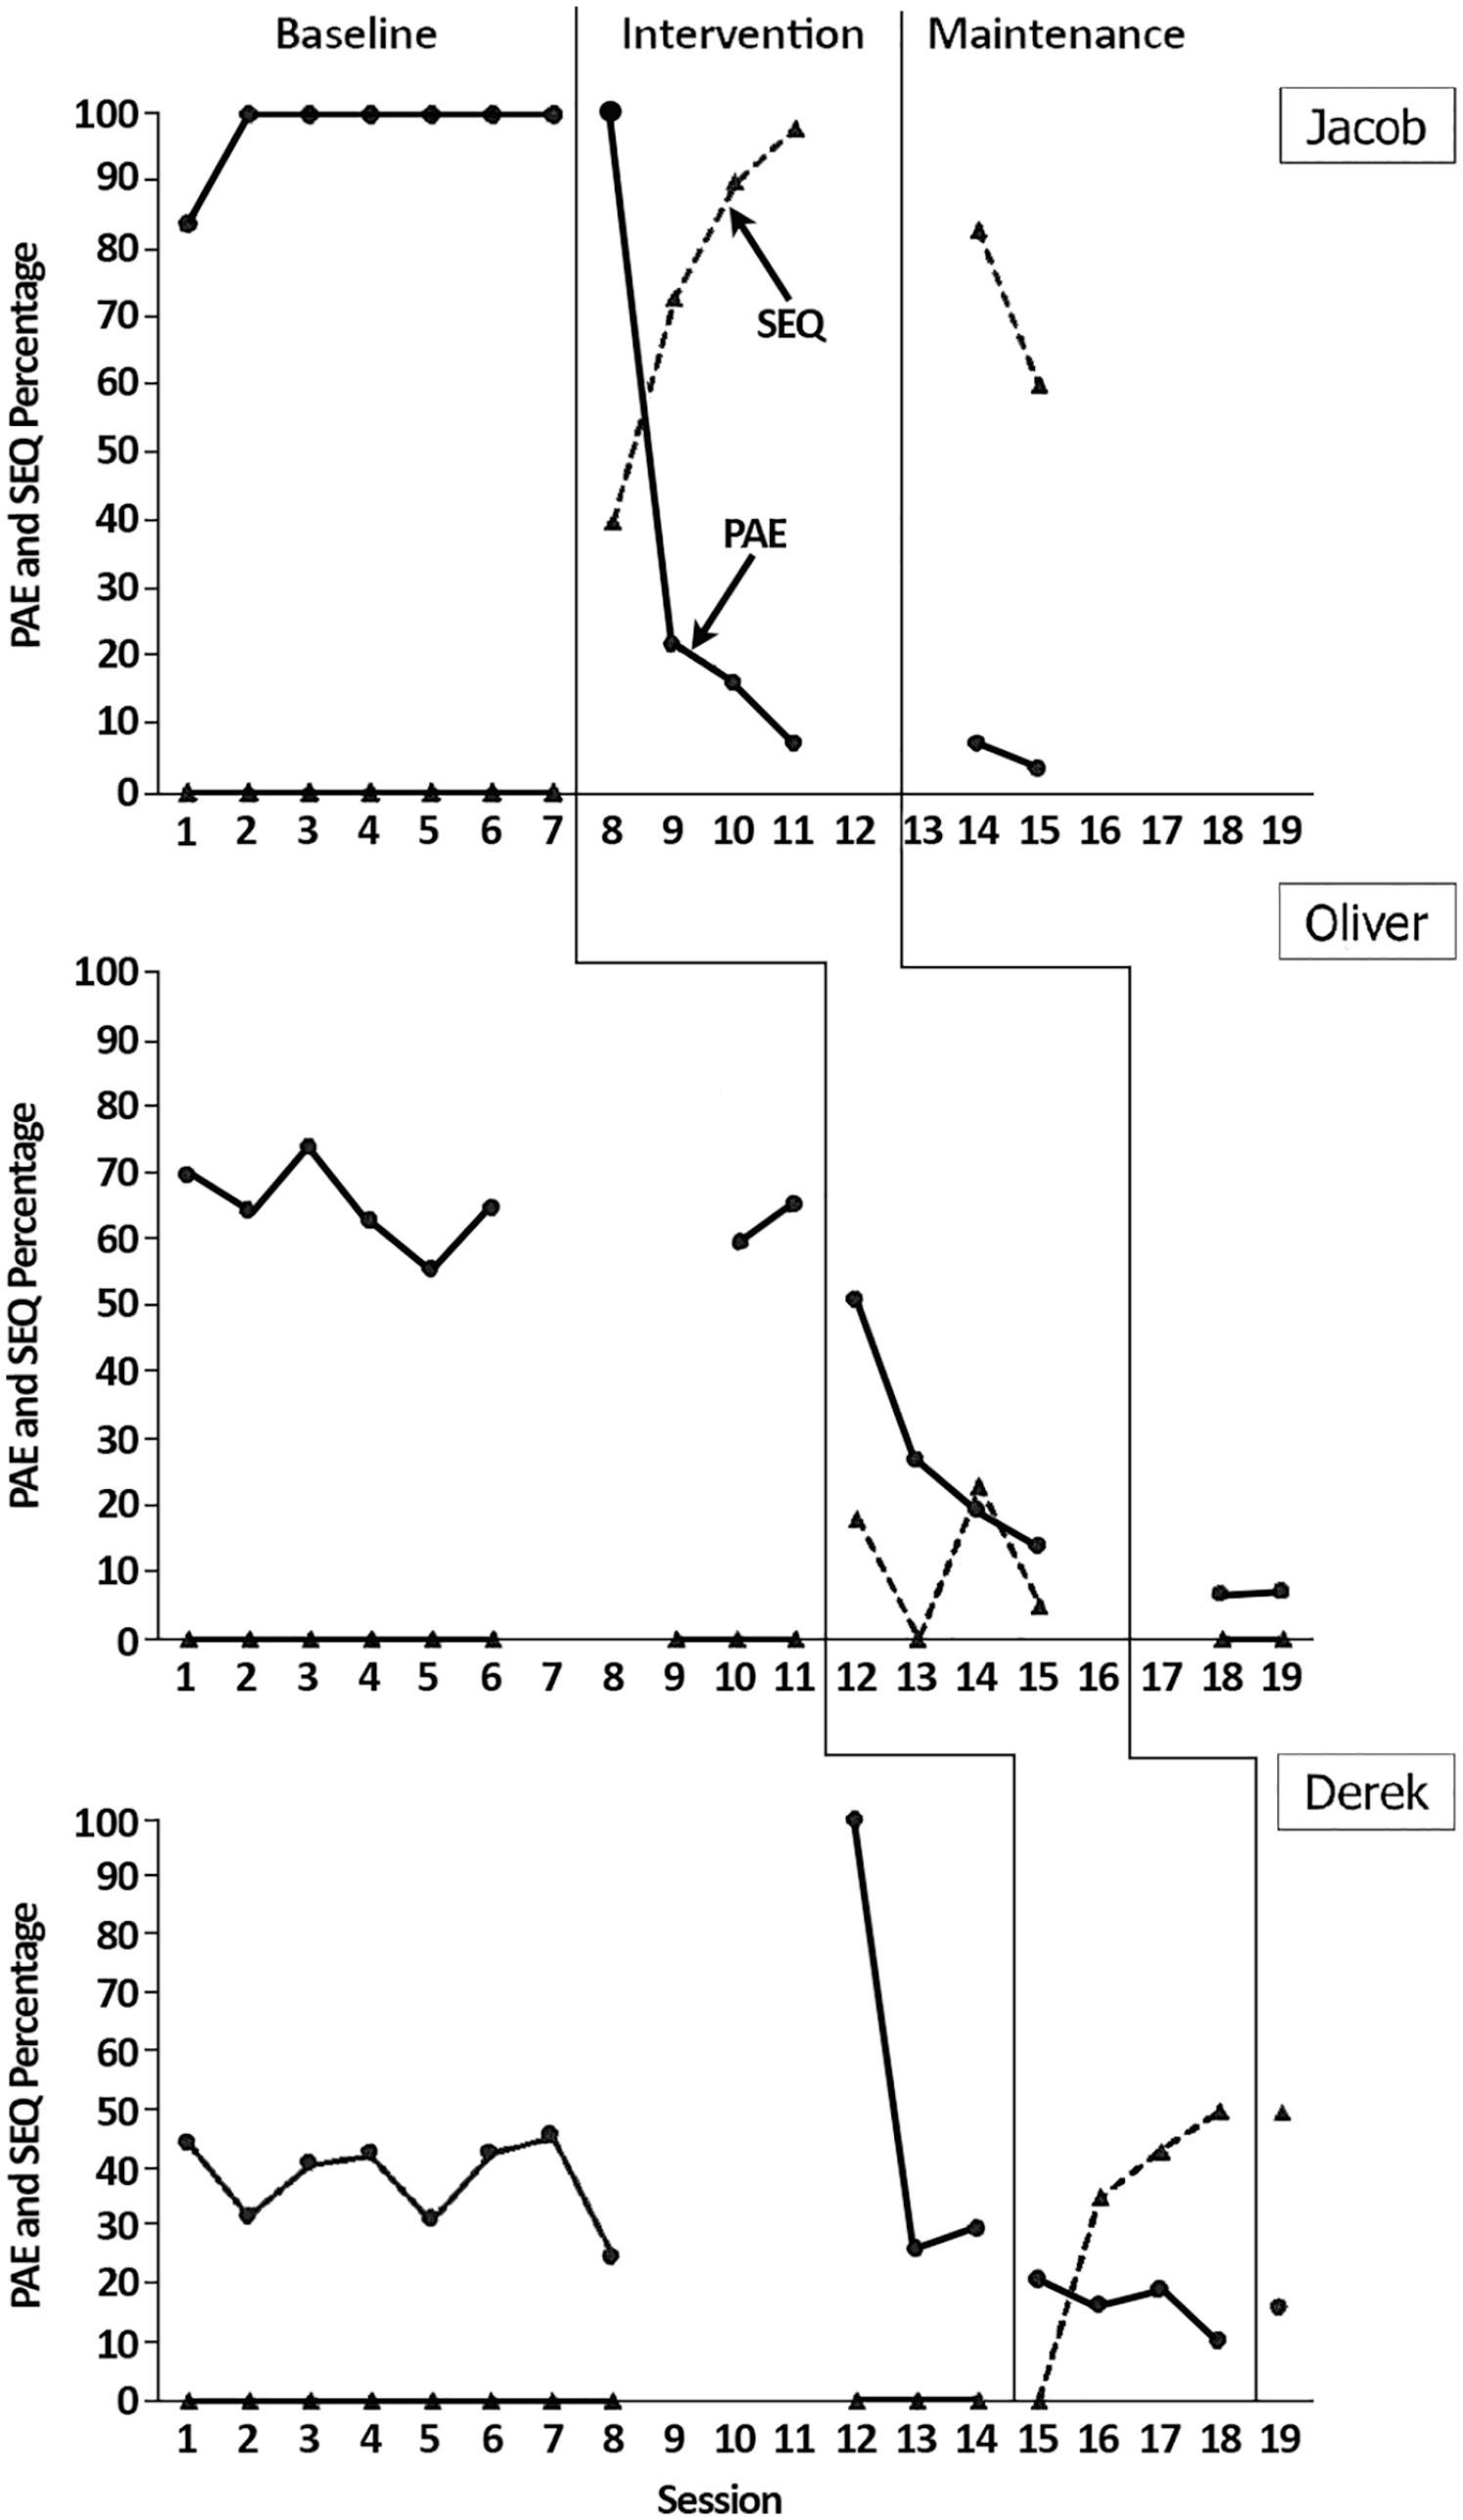
Multiple Probe Graph for PAE and SEQ Results.
Percentage of Absolute Error
Except for the first baseline probe, Jacob obtained a 100% PAE for all of the baseline assessments, indicating high percentage of error. When provided with the probe, he stated that he could not locate the fraction or did not know what to do. Oliver demonstrated a stable baseline ranging between 55.6% and 73.8% PAE. Derek showed variability within the baseline phase with a range of PAE of 24.5% to 100%. Most of his baseline PAE data were within a range of 24.5% and 45.5%.
Student Explanation Quality
All participants scored a 0% for SEQ on all baseline data points. Jacob did not attempt any explanations during the baseline phase and said that he could not locate the fractions on the number lines. Oliver and Derek attempted explanations but were unable to meet the quality criteria established prior to the intervention phase.
Intervention
After entering the intervention phase, student PAE decreased rapidly. Student SEQ increased during the intervention phase compared with the baseline phase. PAE and SEQ for each student improved as they began the intervention.
Percentage of Absolute Error
Visual analysis of all students’ PAE data indicated a visible decrease in PAE after beginning the intervention phase. Jacob’s first intervention data point indicated 100% PAE; he followed the steps of locating the units of a number line and segmenting the units but did not place the fraction on the number line. After the fourth lesson on locating unit fractions, Jacob’s PAE data steadily dropped to 21.83% and were 6.91% at the end of the intervention phase. His PAE data indicated only one overlapping data point between baseline and intervention phases and demonstrated a continuous downward trend.
Oliver’s PAE data indicated an immediate and steady decrease after beginning intervention lessons. His PAE decreased from 65.45% in his last baseline data point to 51.03% in his first intervention data point. His PAE decreased to 13.69% for his final intervention data point. His data showed no overlap between phases and a stable decreasing trend.
Derek’s performance resulted in immediate PAE decreases. Although his baseline was variable, his intervention data immediately decreased from a PAE of 29.4% in his last baseline data point to 20.41% in his first intervention data point. His PAE indicates a stable downward trend in his intervention data, with his final PAE of 9.1% at the end of the intervention phase. His PAE scores showed no overlap between baseline and intervention phases.
The authors calculated Tau-U indices for the PAE of each student: −0.92, −1.00, and −1.00 for Jacob, Oliver, and Derek, respectively. The weighted average Tau-U was −0.98, indicating intervention was highly effective for decreasing the student’s PAE (Rakap, 2015).
Student Explanation Quality
SEQ for all participants was variable after entrance into the intervention phase. Two of the three participants (Jacob and Derek) showed a steady and consistent increase in their SEQ. Jacob had the most immediate increase in SEQ. Jacob mostly pointed for his explanations instead of verbally stating them, and these gestures were counted toward SEQ. The researcher verbally stated where he was pointing on his sheet after the gestures. His SEQ increased from 0% to 98% by the end of intervention. Oliver had inconsistent progress on SEQ, which was mostly due to behaviors (e.g., stating, “I don’t want to”). Derek had a steady increase in his SEQ, but his explanations only included 50% of the criteria.
The authors calculated Tau-U indices for the SEQ of each student: 1.00, 0.75, and 0.75 for Jacob, Oliver, and Derek, respectively. The weighted average Tau-U for SEQ was .83. The individual Tau-U scores indicate that the intervention was effective for increasing the quality of student explanations (Rakap, 2015).
Maintenance
Jacob and Oliver’s PAE data showed continued decreases during the maintenance phase. Derek only had one maintenance probe due to school ending before the 2-week time frame after intervention, and his PAE increased from the end of intervention to maintenance but did not overlap with his baseline phase. SEQ remained steady for Derek and Jacob with a decreasing trend. Oliver refused to explain his answers during the maintenance phase.
Generalization
The authors gathered generalization data from the generalization probes. Results indicated minimal effect on generalization of other fraction skills. Jacob’s score increased from 0% to 11%; Oliver’s score showed no change and remained at 55%; Derek’s score increased from 0% to 22%.
Social Validity
All participants indicated that the intervention helped improve their fraction knowledge, selecting the options “very much” and “very, very much.” No participants believed their fraction knowledge had gotten worse, as they all rated if their fraction knowledge got worse as “not at all.” Derek and Jacob reported that that they liked using the number line to help with fractions “very, very much,” while Oliver stated he did “not [like it] at all.” When asked whether there were times they wished they could work on fractions more, Oliver and Derek chose “not at all” and Jacob chose “very, very much”; however, all chose that there were never times that they did not want to work on fractions. Both Oliver and Jacob indicated that they liked being told how to explain their answers with a 4 (“very much”) or 5 (“very, very much”) selection. Jacob reported that he did not like being told how to explain his answers (“not at all”). Both Derek and Jacob gave neutral responses when asked if they thought explaining their answers helped them solve fraction problems, whereas Oliver stated that he did not think it helped at all. Overall, Jacob’s social validity rating was 82.5%; Oliver rated the intervention at 65%; and Derek rated the intervention at 77.5%.
Discussion
This study examined the effect of a number line intervention with self-explanation on students’ accuracy of fraction placement on the number line. Our first and second research questions sought to investigate the effectiveness of a fraction the number line as well as the quality of self-explanation. The intervention increased student accuracy of fraction placements on the number line and improved the quality of student explanations for students with significant behavior problems. When evaluating the effectiveness of the intervention on other fraction skills (e.g., ordering, comparing), we found the intervention was not effective.
Prior Conceptual Misunderstanding
Like other students with disabilities, the participants in this study struggled with conceptual understanding of fractions despite the National Mathematics Advisory Panel’s expectation that the skill area is mastered by eighth grade. All students exhibited significant behavior problems that may result in lower academic performance. They also demonstrated difficulties with working memory, which can possibly affect responsiveness to math instruction.
During the baseline phase, all participants exhibited misconceptions in fraction magnitude and general understanding of fractions. For example, when presented with the screening probe, Jacob pointed to the fraction and stated, “What is that?” indicating that he had little to no conceptual or procedural knowledge of fractions. Both Oliver and Jacob highlight more specific misconceptions of fractions as they both treated the numerator and denominator as separate whole numbers. For example, they placed ⅔ on a 0–5 number line half of the distance between 3 and 4 and stated, “I went up 3 and counted 2.” In addition, Derek placed the fraction in two different places. Using the same example, he stated that the fraction was located at 2 and 3 on the number line. Thus, baseline data from student placement of fractions on the number line and their explanations for their answers suggested there may be interference of whole-number knowledge or bias in their conceptualization of fractions or that their working memory profile may be affecting their retention of previous taught fraction skills as shown in previous research (Malone & Fuchs, 2017; Namkung et al., 2018; Zhang et al., 2017).
Explicit Instruction in Fraction Number Line Estimation
This study aimed to incorporate the integrated theory of whole number and fraction development by teaching fractions as a continuation of whole number knowledge on the number line (Siegler et al., 2011). The results suggest that using the number line may have helped the students to make connections between fractions and whole numbers, as the participants were able to identify the whole number units of the number line and place the fractions among them.
The use of the number line as the representation for fractions seemed to help rectify the whole number bias the participants presented during the baseline phase. For example, during the baseline phase, Oliver would often state that the fraction was not on the number line if the digit in the numerator or denominator was larger than the number of units on the number line. After the intervention phase began, he was able to place the fractions on the number line. Our findings that the number line representation was more effective than the more traditional representations of fractions for instruction are consistent with those of other intervention studies for at-risk elementary-level students (Fazio et al., 2016; Hamdan & Gunderson, 2017; Saxe et al., 2013). The findings of the current study further suggest that the number line is an effective method for teaching fraction skills to students with significant behavior problems.
In addition, our observation of students’ performance throughout this intervention suggests there may be a possible advantage to providing instruction in fraction number line estimation in chunks of each sequential skill, as students in this study demonstrated difficulty in generalizing the unit fraction number line estimation to different types of fractions on the number line. For example, after Jacob’s fourth lesson of learning to locate unit fractions on the number line, he placed every fraction at the first segment he made and was unable to place other fraction types appropriately on the number line until he received explicit instruction in the fraction type. PAE data indicated responsiveness of study participants to explicit instruction in unit fractions, proper fraction, and improper fractions in sequence. This finding is consistent with the idea of fractions being built on unit fractions in that the proper and improper fractions are made up of that unit fraction (Wu, 2011). Finally, findings suggested that students did not generalize their ability to locate fractions on the number line to other fraction skills (e.g., ordering fractions) and operations, indicating the need for targeted instruction in those areas.
Self-Explanation as Conceptual Understanding
The findings of this study are consistent with those from previous research on the benefits of self-explanation for answers in mathematical interventions based on the results that showed when student PAE decreased SEQ improved (Fuchs et al., 2016; Rau et al., 2015). Two of the three participant’s SEQ increased after entering the intervention phase and remained stable through maintenance. The impact of self-explanation on student conceptual knowledge was showcased during the administration of intervention probes. For example, Derek often inverted the fraction when placing it on the number. When asked to explain his answer, however, he would identify and rectify the error he made in the placement of the fraction. Based on the student’s response, it is possible that the error would not have been fixed without the student being asked to explain their reasoning. This observation is consistent with the work of Rau et al. (2015), who stated that student conceptual knowledge of fractions can be enhanced if the student is prompted to self-explain that their answers represent the key concepts of the skill.
Another observation that is worth noting is that students may have relied upon the SEQ rubric to self-explain during FNLE probes without delving into their thought process. It seems that requiring self-explanation for each item in the FNLE probes may have led to rote memorization of the procedures of self-explanation instead of a reflection of actual deeper understanding of fraction magnitude itself. For example, Derek would recite, “I divided by the denominator and placed it because of the numerator.” It was also observed that the students’ self-explanation performance on the FNLE probes was different from what they presented during the intervention lessons. During lessons, the students demonstrated a higher level of conceptual understanding with more in-depth detailed explanation during the lessons with guided explanation prompts. The guided explanation prompts allowed for structuring the self-explanation task into smaller steps, which seemed to help students simultaneously process and store information (Gathercole & Pickering, 2001). Prompts during instruction seemed to be more beneficial for conceptual knowledge development as remembering components of the self-explanation strategy may have been affected by their working memory deficits. In addition, given the qualitative difference in students’ self-explanations that were observed during lessons as opposed to the FNLE probes, it is unknown whether the SEQ scores adequately reflect an in-depth understanding of fractions. The results suggest that, for SEQ to measure actual fraction understanding, a new rubric or procedures need to be developed.
Another point of interest for this study is the SEQ results for Oliver. As reported, Oliver’s low SEQ scores were believed to be the result of his history of engaging in work refusal behavior rather than his ability to explain his answers. When prompted to explain his answer, he would make broad statements such as “I just know it goes there” and “because that’s where it goes”; other times, he would refuse and say, “No.” When provided with shorter prompts during instruction, Oliver was able to answer them. This observation suggests that student’s low SEQ may not result from lack of knowledge to explain, but rather as a result of not wanting to perform.
Limitations and Future Research Suggestions
The findings of this study must be interpreted in the context of several limitations. One limitation of the study was the short intervention period. What Works Clearinghouse (WWC, 2020) requires five data points per phase to meet the single-case design standards without reservations. The intervention phase of this study only had four data points, meaning that it can only reach the WWC singe-case design standards with reservations. Although the intervention was brief, the improvement showed that the intervention was effective, and progress was able to be maintained after its conclusion. Second, the intervention was designed and administered by the participant’s classroom teacher. Thus, the rapport between the students and the teacher needs to be taken into consideration when interpreting the results. It is impossible to know whether the intervention would have been as successful with an unbiased interventionist. Another limitation was the lack of a second maintenance data point for Derek, as the school year ended before the allotted maintenance period. Finally, limitations also presented themselves within the self-explanation component of this intervention. As described earlier, the researchers found that requiring self-explanation for each item in the FNLE probes showed rote memorization of the procedures during self-explanation instead of an actual deeper understanding of fraction magnitude itself. Thus, future research should consider examining the effect of quality teacher prompts for self-explanations to measure conceptual understanding of fraction magnitude. In addition, the self-explanations proved difficult to score. The reliability of Jacob’s results was low because he pointed to each step and the interventionist had to narrate his movements. Videotaped sessions would have helped bolster the reliability of this method of explanation.
Future research should continue to focus on the development of fraction knowledge for students with significant behavior problems. As the results of this study show, students with significant behavior problems need intensive support to master fraction magnitude, which is a substantial predictor of future mathematics achievement. Research should evaluate different ways, such as supported or prompted self-explanation, to assess conceptual understanding for this population.
Practical Implications
Students with significant behavior problems may struggle significantly with fractions. Practitioners need to consider implementing in-depth and developmentally appropriate fraction instruction. Practitioners cannot assume that students will generalize their ability to work with one type of fraction to another, and lessons should be dedicated to each step and fraction type to ensure conceptual and procedural understanding. Finally, each participant showed improvement in their PAE scores after only four of the eight intervention lessons and maintained their scores after the intervention concluded. This study suggests that, with targeted instruction, students who exhibit difficulties in their fraction knowledge can make meaningful gains in a short period of time.
Footnotes
Declaration of Conflicting Interests
The author(s) declared no potential conflicts of interest with respect to the research, authorship, and/or publication of this article.
Funding
The author(s) received no financial support for the research, authorship, and/or publication of this article.