
Abstract
Lean manufacturing embraces the principle of doing more with less by removing non-value-added activities from manufacturing processes to preserve effectiveness, flexibility, and profitability. Predictive maintenance in production stages are more critical since it involves machines which are prone to failure and a post failure maintenance stagnates the production which creates bottlenecks due to machine failures. Hence in this work a novel intuitive fuzzy syncretic lean frame work has been implemented to incorporate the need of intelligent systems. The framework is divided into phases which employs Fuzzy logic with embedded smart sensors for effective utilization of man machine and materials in order to improve the effectiveness of a production floor. A novel time based forecasting is done in the design phase which implements the lean tool Takt time. The manufacturing phase uses the sensors to determine the predictive maintenance of the machines thereby implementing continuous flow as the lean tool and the inspection phase uses smart sensor system for real time continuous monitoring of the machining process thereby incorporating Poka-yoke as a lean tool. Thus by implementing the framework the overall equipment effectiveness is achieved which helps in achieving continuous flow of products and defect free products in any production firm.
Introduction
In the past few decades, companies have made an effort to increase the variety and quality of their offerings while also cutting expenses, boosting earnings, improving production processes’ efficiency to produce goods with shorter product lifecycles, and making investments in the well-being of their workforce and clients. (Goienetxea Uriarte et al., 2020). Industry has moved from one-of-a-kind manufacturing of specific products to a large scale manufacturing paradigm with quite stringent quality requirements across the last two centuries as a result of technical advancements (Bauza et al., 2018). These are pushed through mass manufacturing of intensely specialized goods while retaining economies of scale. The intense rivalry of today pushes businesses to modernise to more intelligent production systems than they had in the past (Craighead et al., 2020). Because of this, their production systems are now more adaptable, intelligent, and quick, and they are better equipped to handle the challenges posed by a changing global market. (Gallo et al., 2021). As a result, the competition stems from bulk customization options and rapid commodity growth, which necessitates creativity and innovative management tools (Palange and Dhatrak, 2021). In response to the heightened demand for personalised goods, more intense competition, and a greater focus on prompt and attentive customer care, businesses are being steered towards digital transformation and service-oriented approaches (Shahin et al., 2020). By resulting in “leaner” supply chains and processes that is, with less waste. Lean thinking has effectively challenged mass industrial practices. It seeks to bridge the gap between the real and digital realms of industrial production (Bittencourt et al., 2021). One of the most pressing concerns regarding the concept of human machine learning in the factories of the future is the division of labour between intelligent machines and human workers in a technologically advanced workplace (Ansari et al., 2018). Researchers recommend combining lean principles with flexible software technology specifically to enhance issue interpretation and approaches to overcome, and also to increase design focus (Dobrigkeit and De Paula, 2017). The aim of lean tools in design engineering is to implement new economic models that will assist the designer in quickly approaching the optimal design strategy (Kaswan and Rathi, 2020). Waste is described as any job that has no substantial added benefit in the design process (Sheldon, 2018). From constructing/analysing ideas to designing prototypes, preliminary plans, comprehensive design, tests & evaluation, and, finally, manufacturing start up, lean product creation encompasses the whole design phase. Continuous flow (Avelar et al., 2020), pull output, TPM (Total Productive Maintenance) (Suryaprakash et al., 2021), and TQM (Total Quality Management) (Saxby et al., 2020) are the best lean practices in the process and control aspect. Numerous innovative applications have been available to designers as a result of the emergence of information technology in recent decades, the most notable of which is Building Information Modelling (BIM) (Dossou, 2018). Despite the fact that these modern technologies have offered an efficient means of incorporating product knowledge into the design process, particularly when used in collaboration with Integrated Concurrent Engineering (ICE), they are still handled with a conventional perspective (Atilano et al., 2019). Manufacturers have previously made a deliberate attempt to reduce waste by the implementation of Lean standards, but the introduction of artificial intelligence (AI) into production processes has resulted in a significant increase in ROI (Return on Investment). (Ko and Kuo, 2019). However, putting the data into a single position so it could be processed is the first step. It’s a smart idea to begin by digitizing the manufacturing techniques (Shao et al., 2021). Manufacturers will get a broader understanding of what’s happening on in manufacturing and take action to build a more productive, lean manufacturing floor by connecting manufacturing record data, machinery specification data, specification analysis, and more (Dobrigkeit et al., 2019). Artificial intelligence (AI) improves how manufacturers optimize goods and processes by allowing greater communication between humans, information, and machines (Jordon et al., 2019). AI intends to become the ultimate revolutionary phase in productivity advancement along with Lean Management practices have helped producers with good efficiency (Hayhoe et al., 2019; Lee et al., 2018; Mcmahon et al., 2019; Perico and Mattioli, 2020; Yang et al., 2019).
A technique using fuzzy logic is applied to analyze the multi-level framework. The fuzzy logic analysis of the generalized sustainability lean model reveals the effectiveness levels and identifies barriers for small-scale enterprises (Gopi & PG, 2024). Lean manufacturing and fuzzy logic concepts have been implemented through quantitative modeling approaches in the US, UK, and India, particularly in the automotive and aerospace sectors, to reduce waste (Rojas et al., 2024). Lean manufacturing is integrated with Hesitant Fuzzy Linguistic Term Sets, combined with multicriteria decision-making, to prioritize action plans for managers (Chitiva-Enciso et al., 2024). A framework is developed for small-scale industries using the Fuzzy Analytic Hierarchy Process, integrated with lean manufacturing tools such as Kaizen and Kanban (Mittal and Shameem, 2024). Fuzzy Multicriteria Decision Making (FMCDM) has emerged as one of the most effective methods for determining whether an industrial organization is approaching or deviating from optimal lean concept utilization by measuring its lean efficiency level (Al-Baldawi, 2024).
As a result, in order to minimise waste and improve efficiency in a manufacturing setting, it is required to implement lean management systems that are integrated with intelligent systems. The work involves the integration of lean tools to a production framework in which a novel intuitive fuzzy syncretic lean frame work has been proposed for a manufacturing firm which is processed with a design phase followed by a manufacturing and an inspection phase incorporating smart sensors and fuzzy logic algorithm to decide the optimal time based forecasting, predictive maintenance and a real time continuous inspection through which lean tools are implemented. A novel intuitive fuzzy syncretic lean frame work having three phases has been proposed for a manufacturing firm by incorporating Smart sensors and fuzzy logic for automation and intelligence adapted industrial sector.
Intuitive fuzzy syncretic lean frame work
Lean production is a standard manufacturing mode with an aim to maximize the resource utilization and minimizing the wastes to satisfy customer demands for high quality and low cost. (Goshime et al., 2019). Another factor is the production of defective products which leads to more work or replacement, wastage of time, resources and materials, and can lead to lose customers due to customer dissatisfaction. Hence a novel intuitive fuzzy syncretic lean frame work has been proposed for a manufacturing firm by incorporating Smart sensors and fuzzy logic which provides decisive support for design engineering which is still unclear even though automation and intelligence adapted industrial sector (Yuik and Puvanasvaran, 2020). Designing phase, manufacturing phase and inspection phase are the three phases involved in the framework as shown in Figure 1 each phase is implemented with a novel fuzzy algorithm which carry out their own significance in incorporating the lean tools in the framework. The entire framework ensures the tracking progress in eliminating waste from a manufacturing process and ensures the implementation of the Overall Equipment Effectiveness which is considered to be an effective lean tool. Workflow in the proposed framework.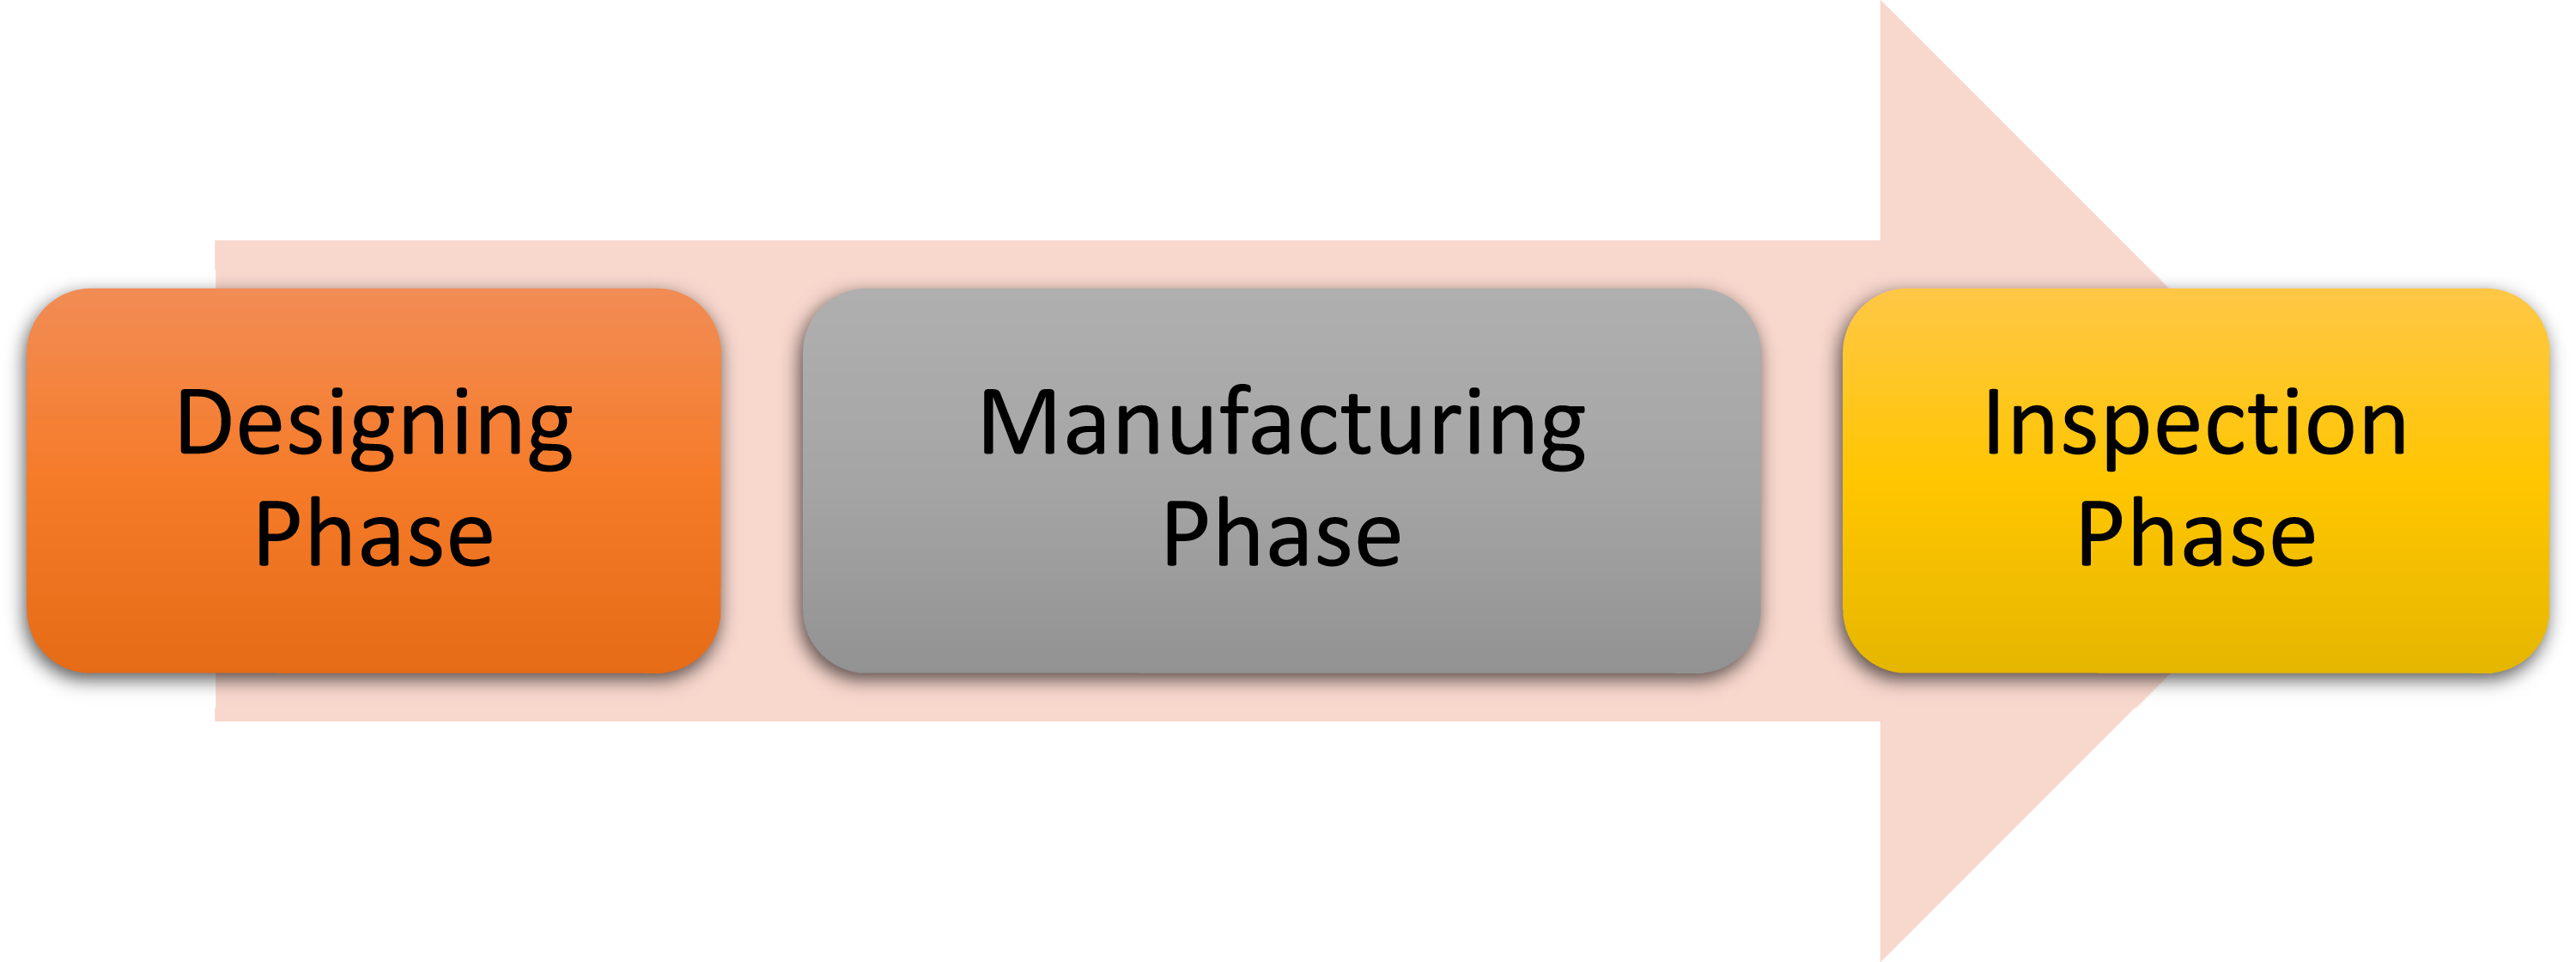
Working principle of fuzzy logic
Fuzzification is the first stage of fuzzy logic, where clear, crisp input values are transformed into fuzzy sets. The precise working concept of fuzzy logic is shown in Figure 2 This process involves using membership functions to define fuzzy sets by assigning each input a degree of membership between 0 and 1. In the fuzzy rule evaluation stage, fuzzy rules based on linguistic variables are applied. Fuzzy sets help establish the criteria and outputs of the IF-THEN logic that underpins these rules. The membership values of the input variables are combined to determine the degree of truth for each rule. The system then aggregates the outcomes of all the fuzzy rules that have been applied. Working concept of fuzzy logic.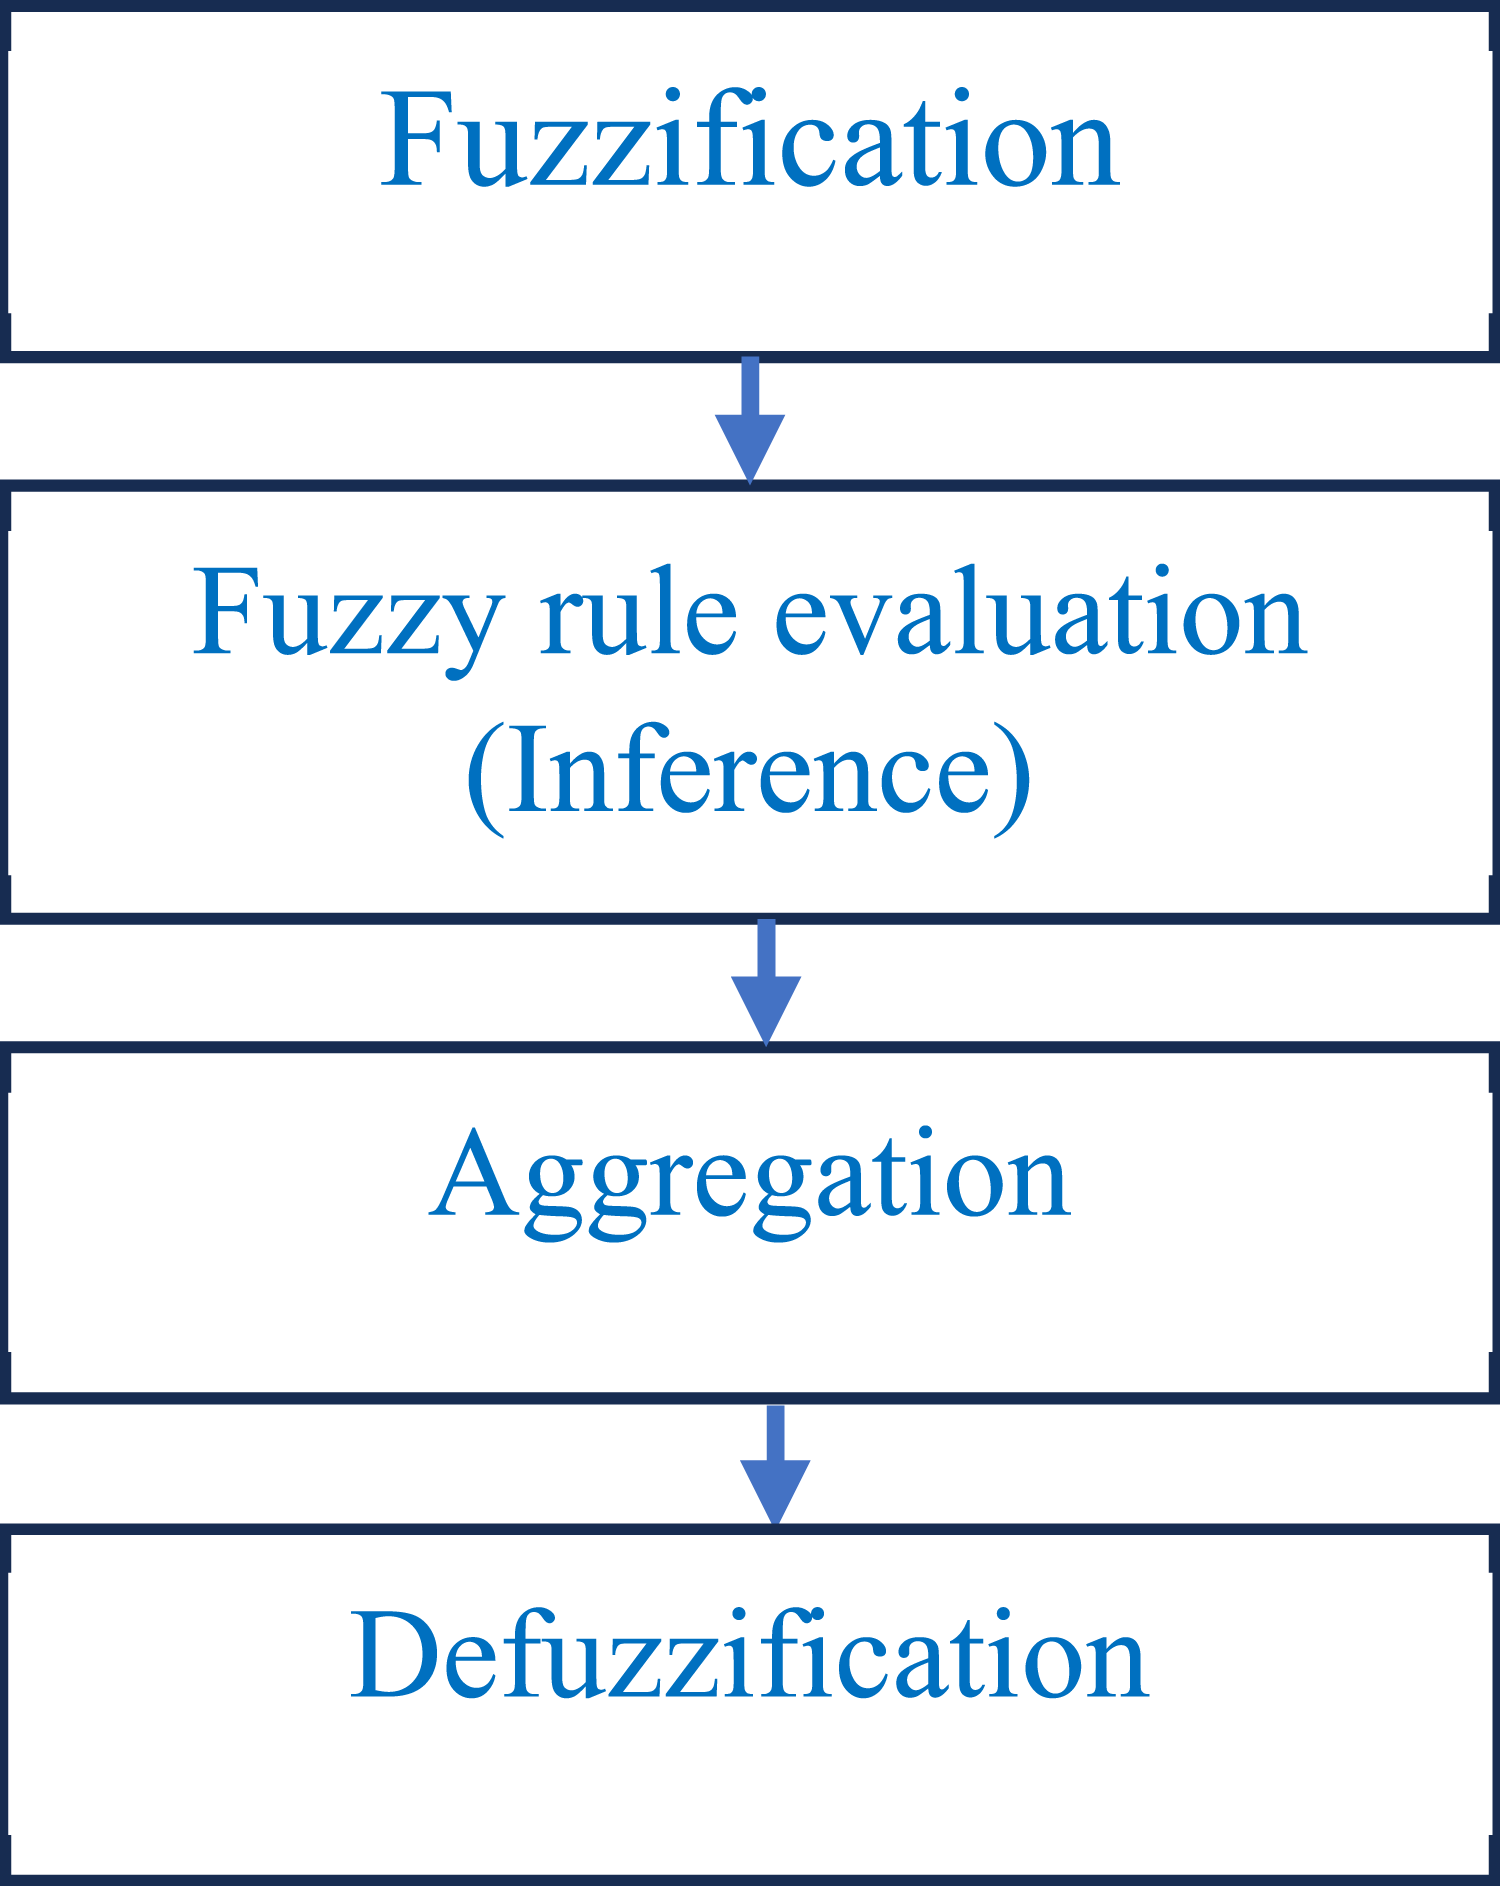
Since multiple fuzzy rules can produce different outputs for the same input, aggregation combines these results to generate a single fuzzy output. Techniques such as max-min or max-product are used for aggregation. In the defuzzification stage, the fuzzy output is transformed back into a crisp value. This step is crucial, as clear outputs are required for real-world systems. Two common defuzzification techniques are the Mean of Maximum (MoM) and the Centroid of Area (CoA).
Design phase
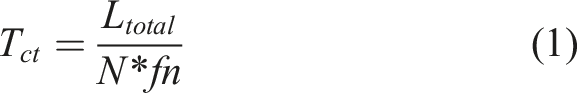
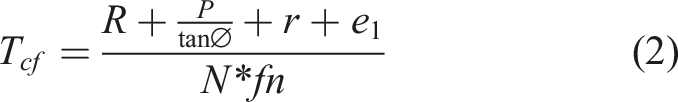
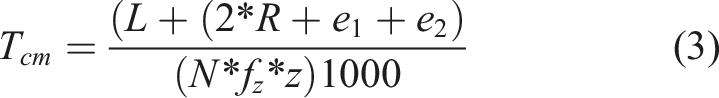
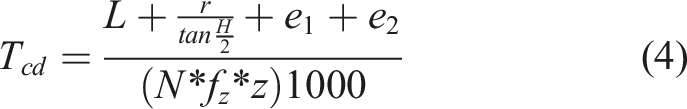
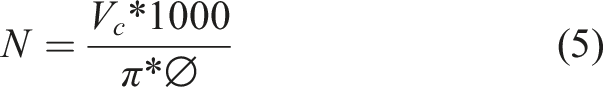
Designing phase is the initial phase in the framework and it is employed to determine a product based optimal time forecasting to estimate the time of completion of the product by fuzzy forecasted time algorithm using triangular fuzzy operations (Qattawi and Chalil Madathil, 2019). The total time calculation is very much essential in the determination of the manufacturing costs, the machine workloads, personnel loads and the delivery time. Total time is obtained by the summation of the setup time, manual operation time, Cutting time and the unforeseen time (Hofmann et al., 2020). Here the machining process is considered to be carried out in turning, facing, milling and drilling operations. The formula for determining the cutting time is given below (Taifa and Vhora, 2019).


The fuzzy forecasted time based algorithm uses the time determined by the machine run time, setup time, material movement time and inventory time (Tschätsch, 2010). Here in our forecasting the optimal time is determined using the summation of all the timely movements of the man, machine and material interactions. By incorporating the function, we are able to determine the forecast of the entire process, thereby scheduling can be allocated appropriately for timely completion. Therefore, the implementation of the design phase improves the Takt time which ensures pace of production which aligns with customer demand.
Manufacturing phase
After the forecast, jobs are scheduled in the shop floor and the machine is allocated as per required specifications. Thus the materials from the inventory is transferred to the shop floor within the scheduled time. The time forecast for the manufacturing phase is estimated by considering the product to be machined on various machines. Preventive maintenance can be scheduled or performed based on consumption. This strategy helps to reduce the number of failures, but it also results in unnecessary inspections and unforeseen failures, which raises maintenance costs. The predictive maintenance method relies on condition monitoring data to forecast future equipment health. This method attempts to anticipate when, where, and which components are likely to fail.
Predictive maintenance
Predictive maintenance (PdM) is preventative maintenance that monitors the performance and condition of equipment while it is in use to reduce the risk of failure. The purpose of predictive maintenance is to be able to forecast when equipment will fail based on a variety of parameters, then to prevent the failure through routine and corrective maintenance.
Condition monitoring, which is defined as the continuous monitoring of machines during process conditions to maintain optimal machine use, is required for predictive maintenance. Condition monitoring is divided into three categories: online, periodic, and remote. Continuous monitoring of machines or production processes with data collected on crucial speeds and changing spindle locations is referred to as online condition monitoring as shown in Figure 3 Periodic condition monitoring, accomplished by vibration analysis, “provides insight into changing vibration behaviour of installations” through trend analysis Finally, remote condition monitoring allows equipment to be observed from a remote place and data to be supplied for analysis. Architecture of predictive maintenance.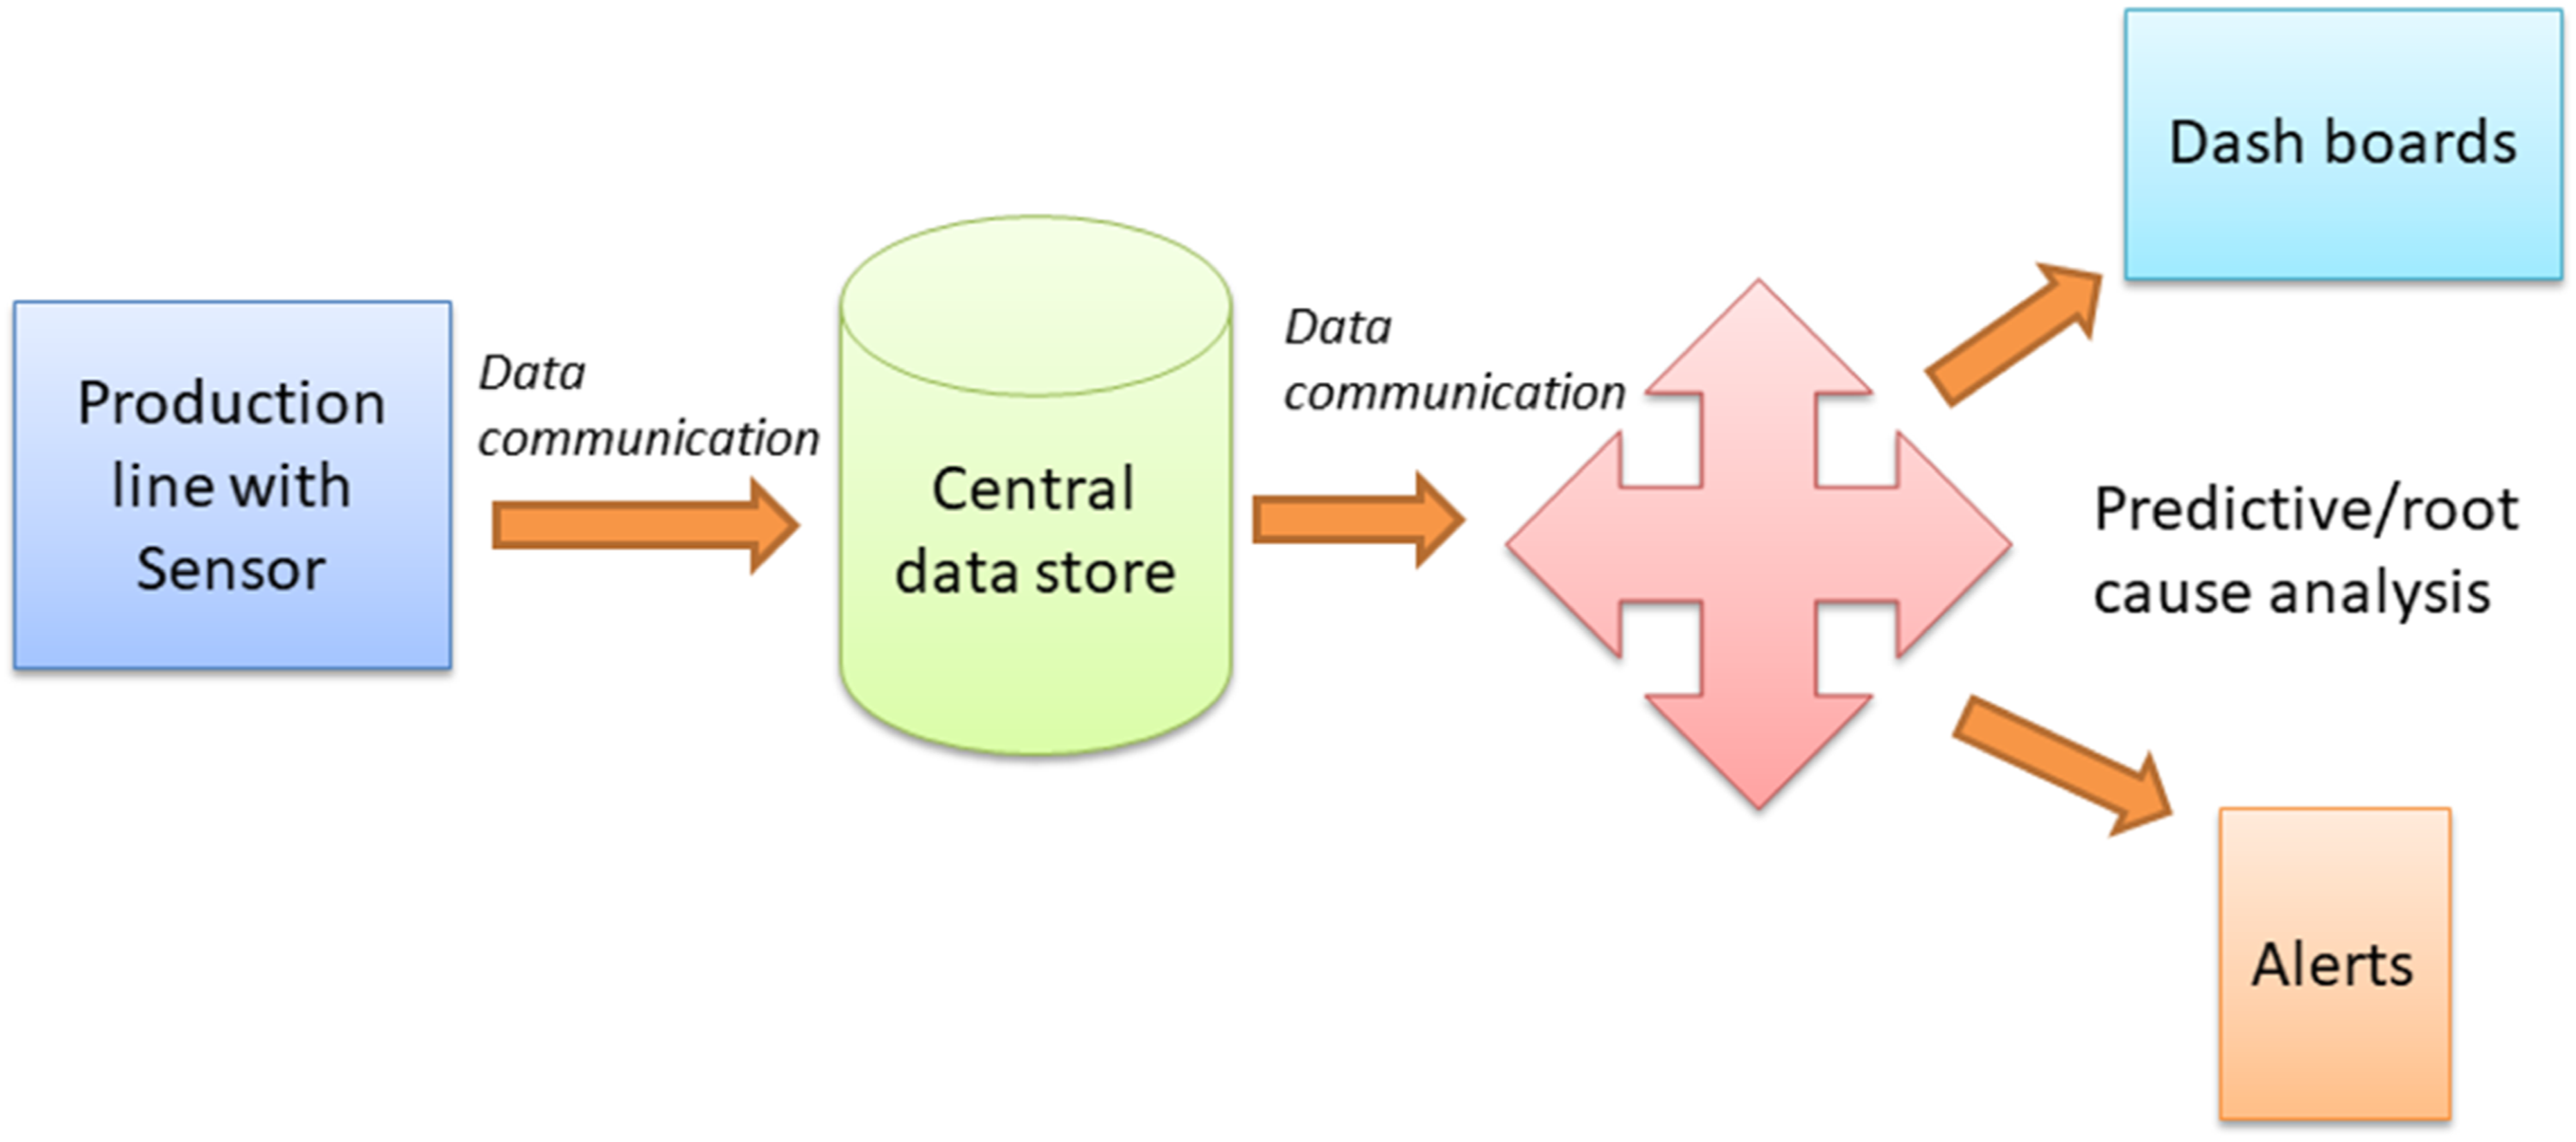
Sensor based maintenance
Smart sensors process aggregated data from production processes in real-time and enable self-determination of machines and other smart devices. Wireless sensors that continuously capture sensor data are used in modern solutions. The sensors maintain a close track on the machine’s critical factors, such as vibrations and temperature. The sensors transfer data to the cloud via a wireless gateway, such as Wi-Fi, Bluetooth, or several other wireless technologies available on the market, on a regular basis or when a threshold is surpassed. When the data is transferred to the cloud, it is processed to extract the important parameters needed to determine machine health. In case of deviation from the scheduled time the algorithm predicts the failure in any machine parts, which is obtained from the sensors display by comparing the error difference with standard values based on machining characteristics and thus helps in predictive maintenance.
Inspection phase
These sensors produce a lot of data in a short amount of time because of their high speeds and resolutions. Due to factors such as weariness, boredom, mood, and illness that may emerge during manual inspection, the use of automatic visual inspection is recommended. Furthermore, some applications required specific skills that necessitated the participation of a human inspector in a training programme. The design considerations related to the shape and size of the product being fabricated is compared with the sensor values. Once the parameters match with the expected design vales, the machining is ended. This real time monitoring based on sensor prediction avoids the manual quality inspection which is usually done at the end of the machining process. Thus the phase helps in attaining zero defects with good customer satisfaction thereby implementing the lean tool Poka-yoke which implies design error detection and prevention in the production process. The flow chart for the entire framework is represented in Figure 4. Step 1: Start Step 2: Give the inputs of various time involved in machining the products like machine run time, setup time and material movement time. Step 3: Calculate the overall time required for the completion of the products. Step 4: Give the product design as input details for manufacturing the product. Embed Nano sensors like vibration sensors, motion sensors, speed and flow sensors in places where machine failure is likely to happen. Step 5: Start manufacturing of products. Step 6: Check the completion time of the product by comparing with the predicted time. Step 7: If completed on time then proceed for inspection, else check the sensor values by comparing with standard values to determine any fault in the machine parts and carry out predictive maintenance. Step 8: After manufacturing monitor the real time inspection of the product. Step 9: If product matches the product design input value, then stop machining. If not carry out the machining process till required dimensions are achieved. Step 10: End Flow chart for the framework.
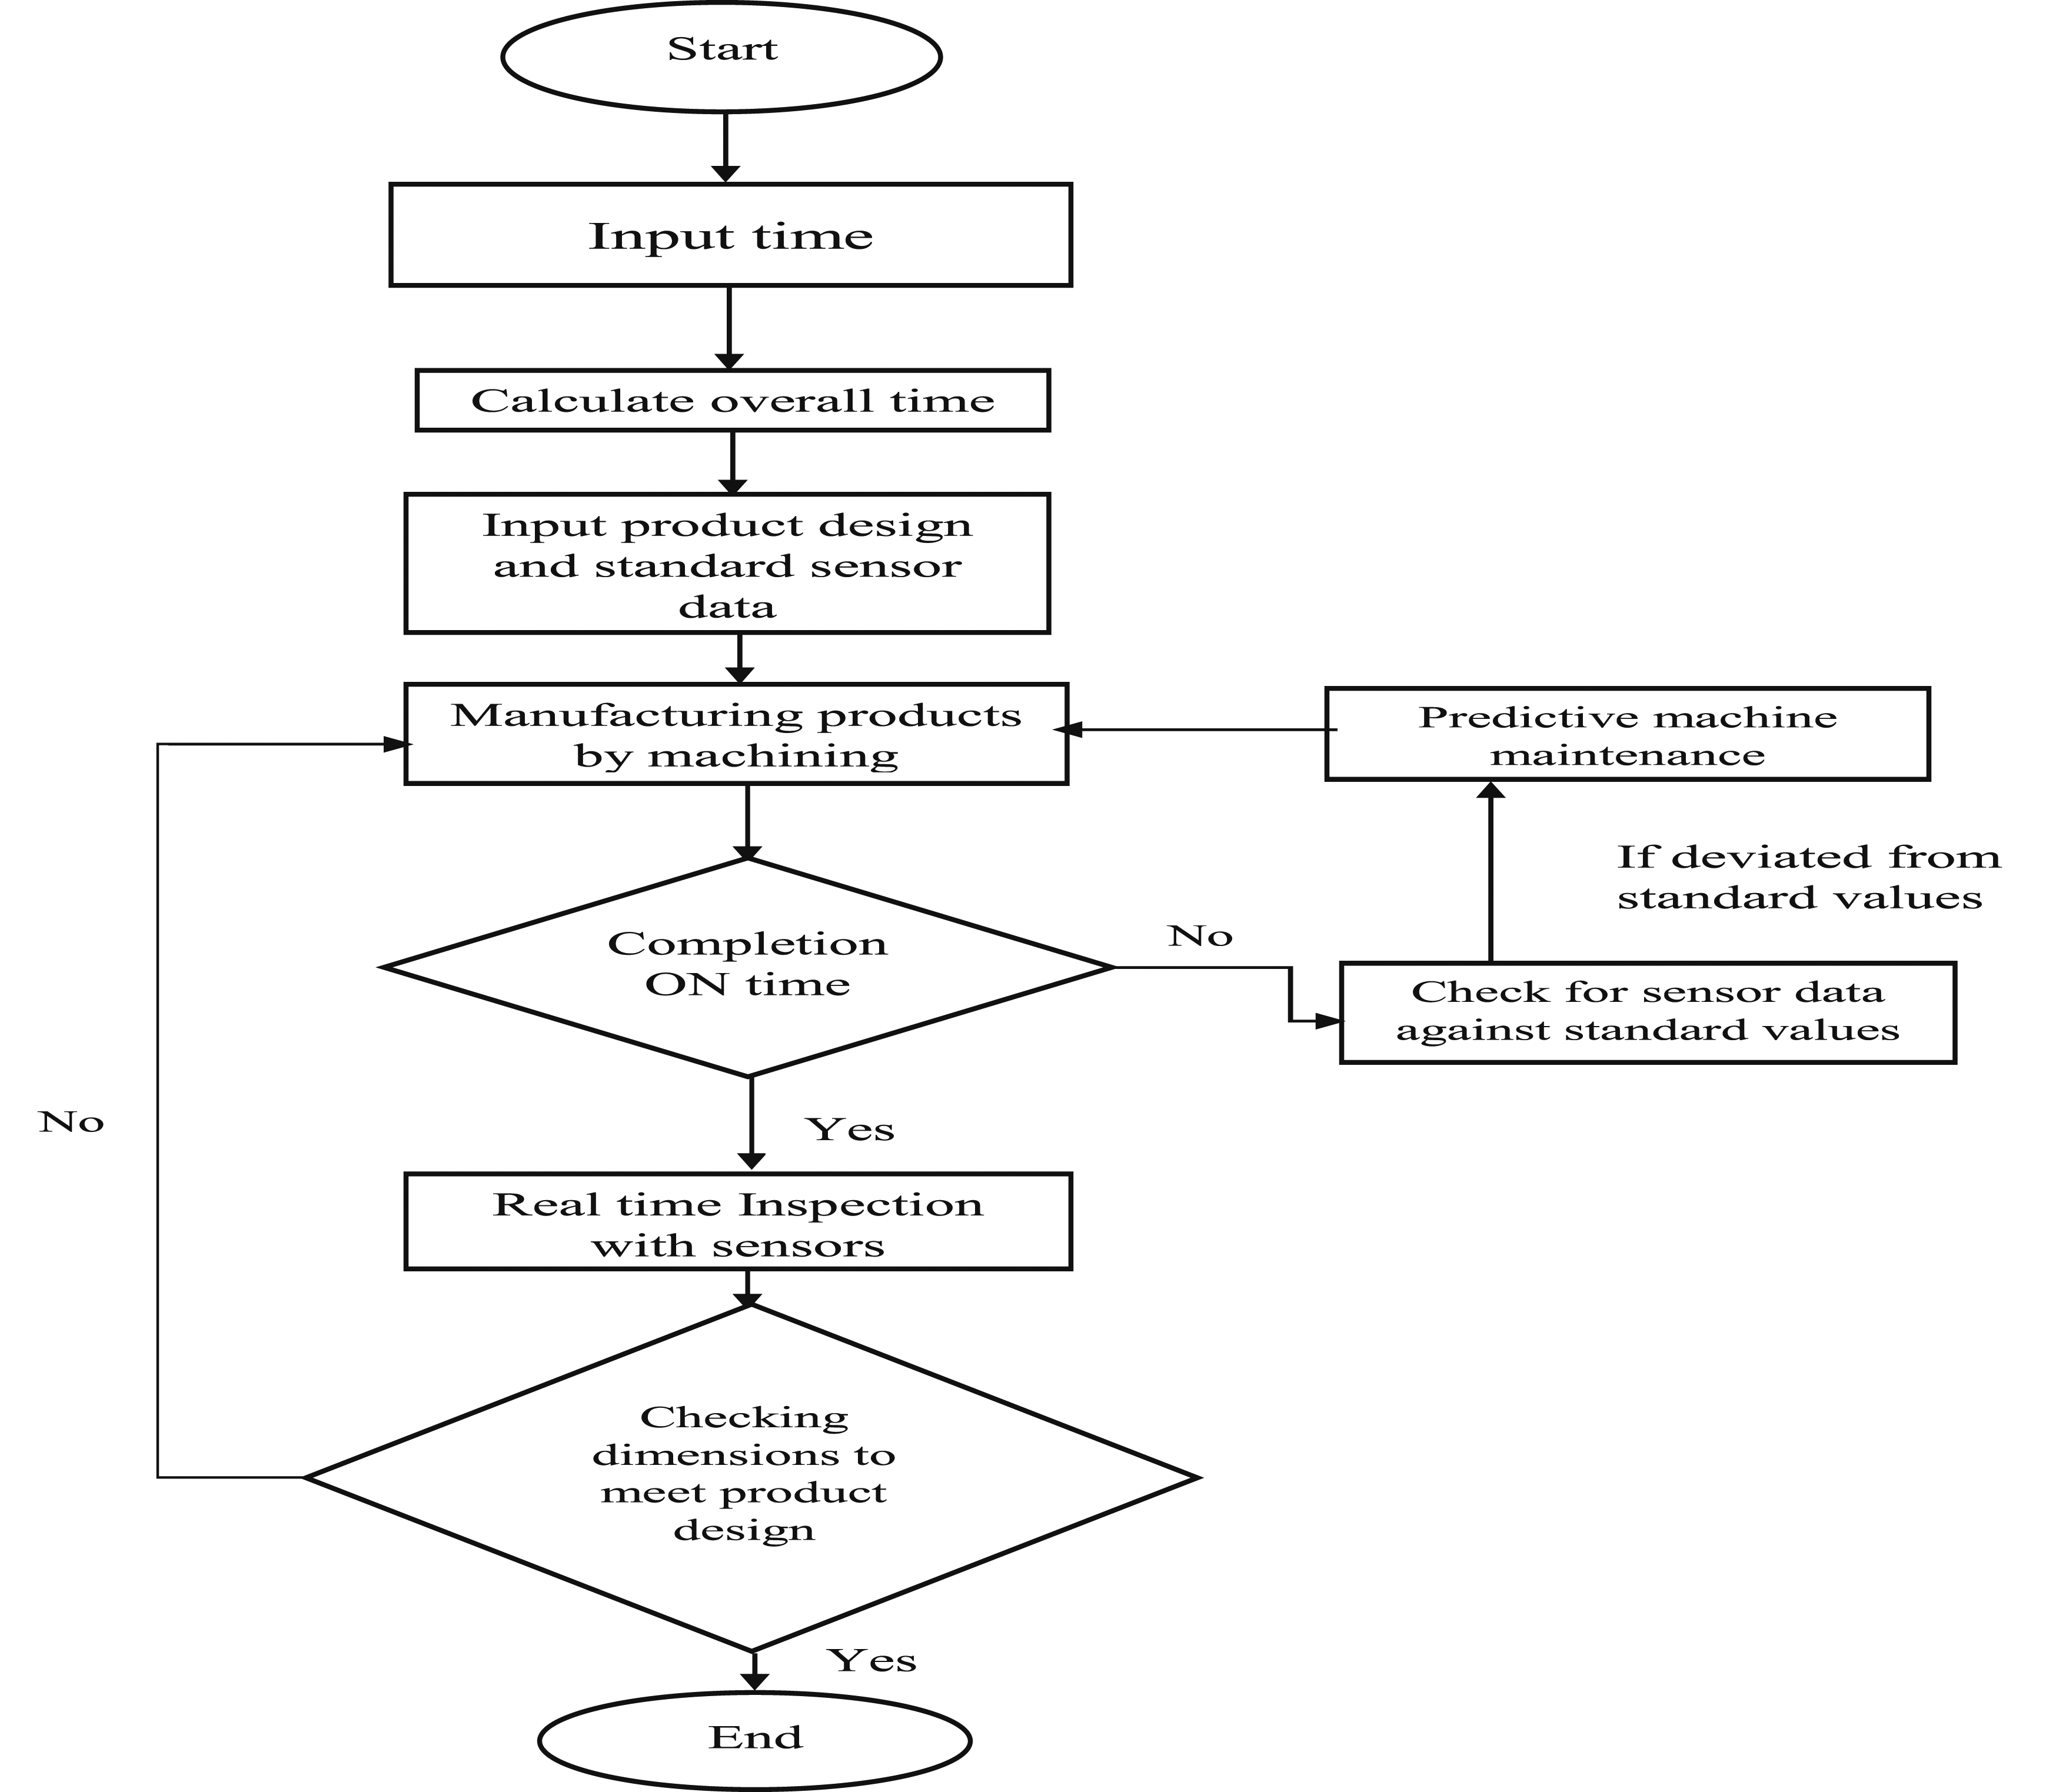
Hence by implementing the mentioned framework in the shop floor the products are manufactured just in time with good customer satisfaction by eliminating wastes in the production floor of any manufacturing environment.
Results and discussions
The results and comparison of the work are discussed in this chapter. This work has been implemented and the simulation of the system was then done using MATLAB with the following system specification and the simulation results are discussed below, Platform: MATLAB, OS: Windows 8,Processor: Intel Core i5,RAM: 8 GB RAM.
Initially the operation of a normal system is designed using Simulink software. Input pulse is given to the mechanical system and the output is generated as per required time which is denoted in Figure 5(a) The amplitude of the normal working system is indicated in the Figure 5(b) which implies the even amplitude of working range as a function of time. A normal system working under favourable conditions provides uniform output without any variation in output. Figure 5(c) denotes the working of a mechanical system under damaged conditions. The output of the system varies according to the damage involved in the system. The variation is observed by the sensing devices which are provided in the machine. The output obtained from such a damaged system is indicated as below in Figure 5(d). It is clear that at the start of the process, the amplitude is normal and at once the damage is identified, there occurs a variation in the output amplitude obtained as a function of time. (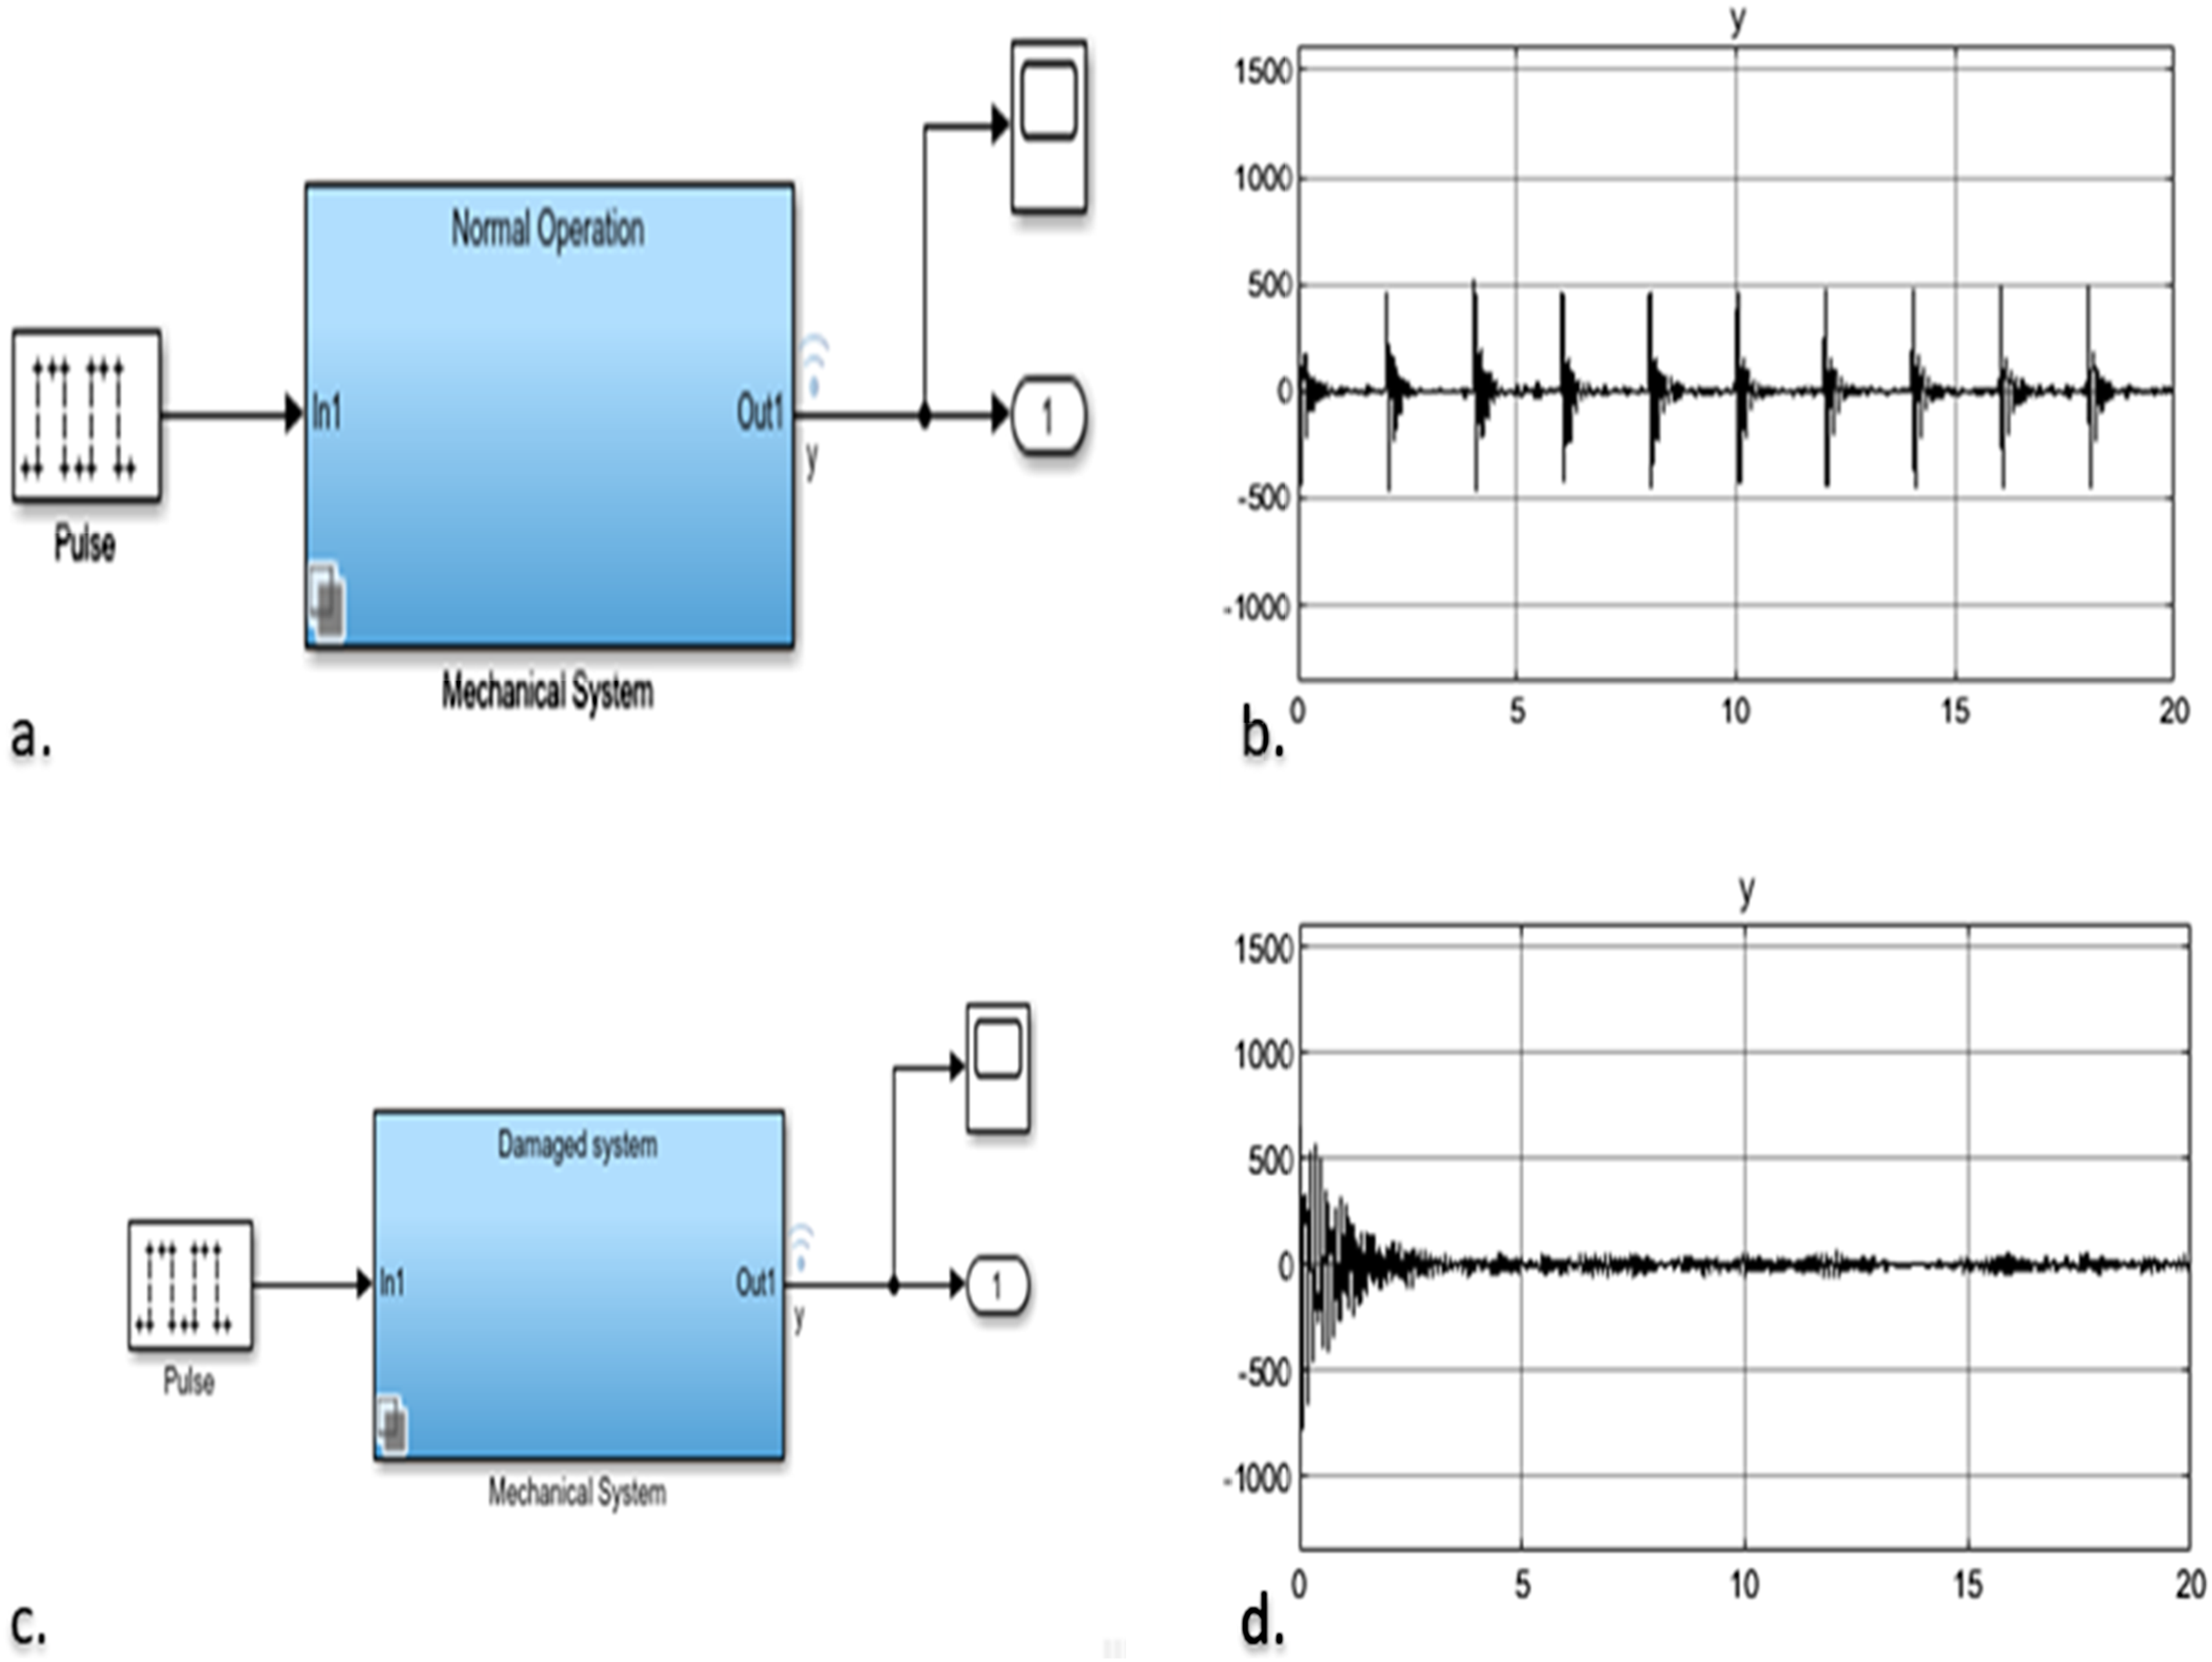
The Figure 6(a) below depicts a deteriorating system with a coupled sensor arrangement in the manufacturing phase. The input pulse is given to the system and an output is obtained. From the arrangement, the sensor compares the working condition of the system as a function of time by predicting the failure of parts under which it is placed for identification. The output image indicates that as the system is initially working under normal condition, the output amplitude obtained is normal as a function of time. Figure 6(b) shows the over a period of time, if at all any damage occurs in the parts of the machine, the sensor detects it and gives the signal to the operator. The variation in the amplitude of the system is obtained from the output obtained. It can be seen that the amplitude under normal working conditions are under 500, once any variation in the normal range is predicted the frequency of vibration is increased beyond the limit value that is 500. Under such conditions the vibrations beyond the said value are identified by the sensors. Figure 6(c) A fault creates changes in the system dynamics, either as a result of steady wear and tear or as a result of rapid changes due to sensor failure or broken parts. When a failure occurs, the model developed under normal operating conditions is incapable of predicting the observed responses. The disparity between the observed and expected response (the residuals) increases as a result of this. A big squared-sum-of-residuals or the presence of correlations are frequently indicators of such deviations. Simulate with the Simulink model in the damaged-system form. Because the residual test requires white input with the possibility of a transient due to beginning conditions, we utilize a single bump as input. (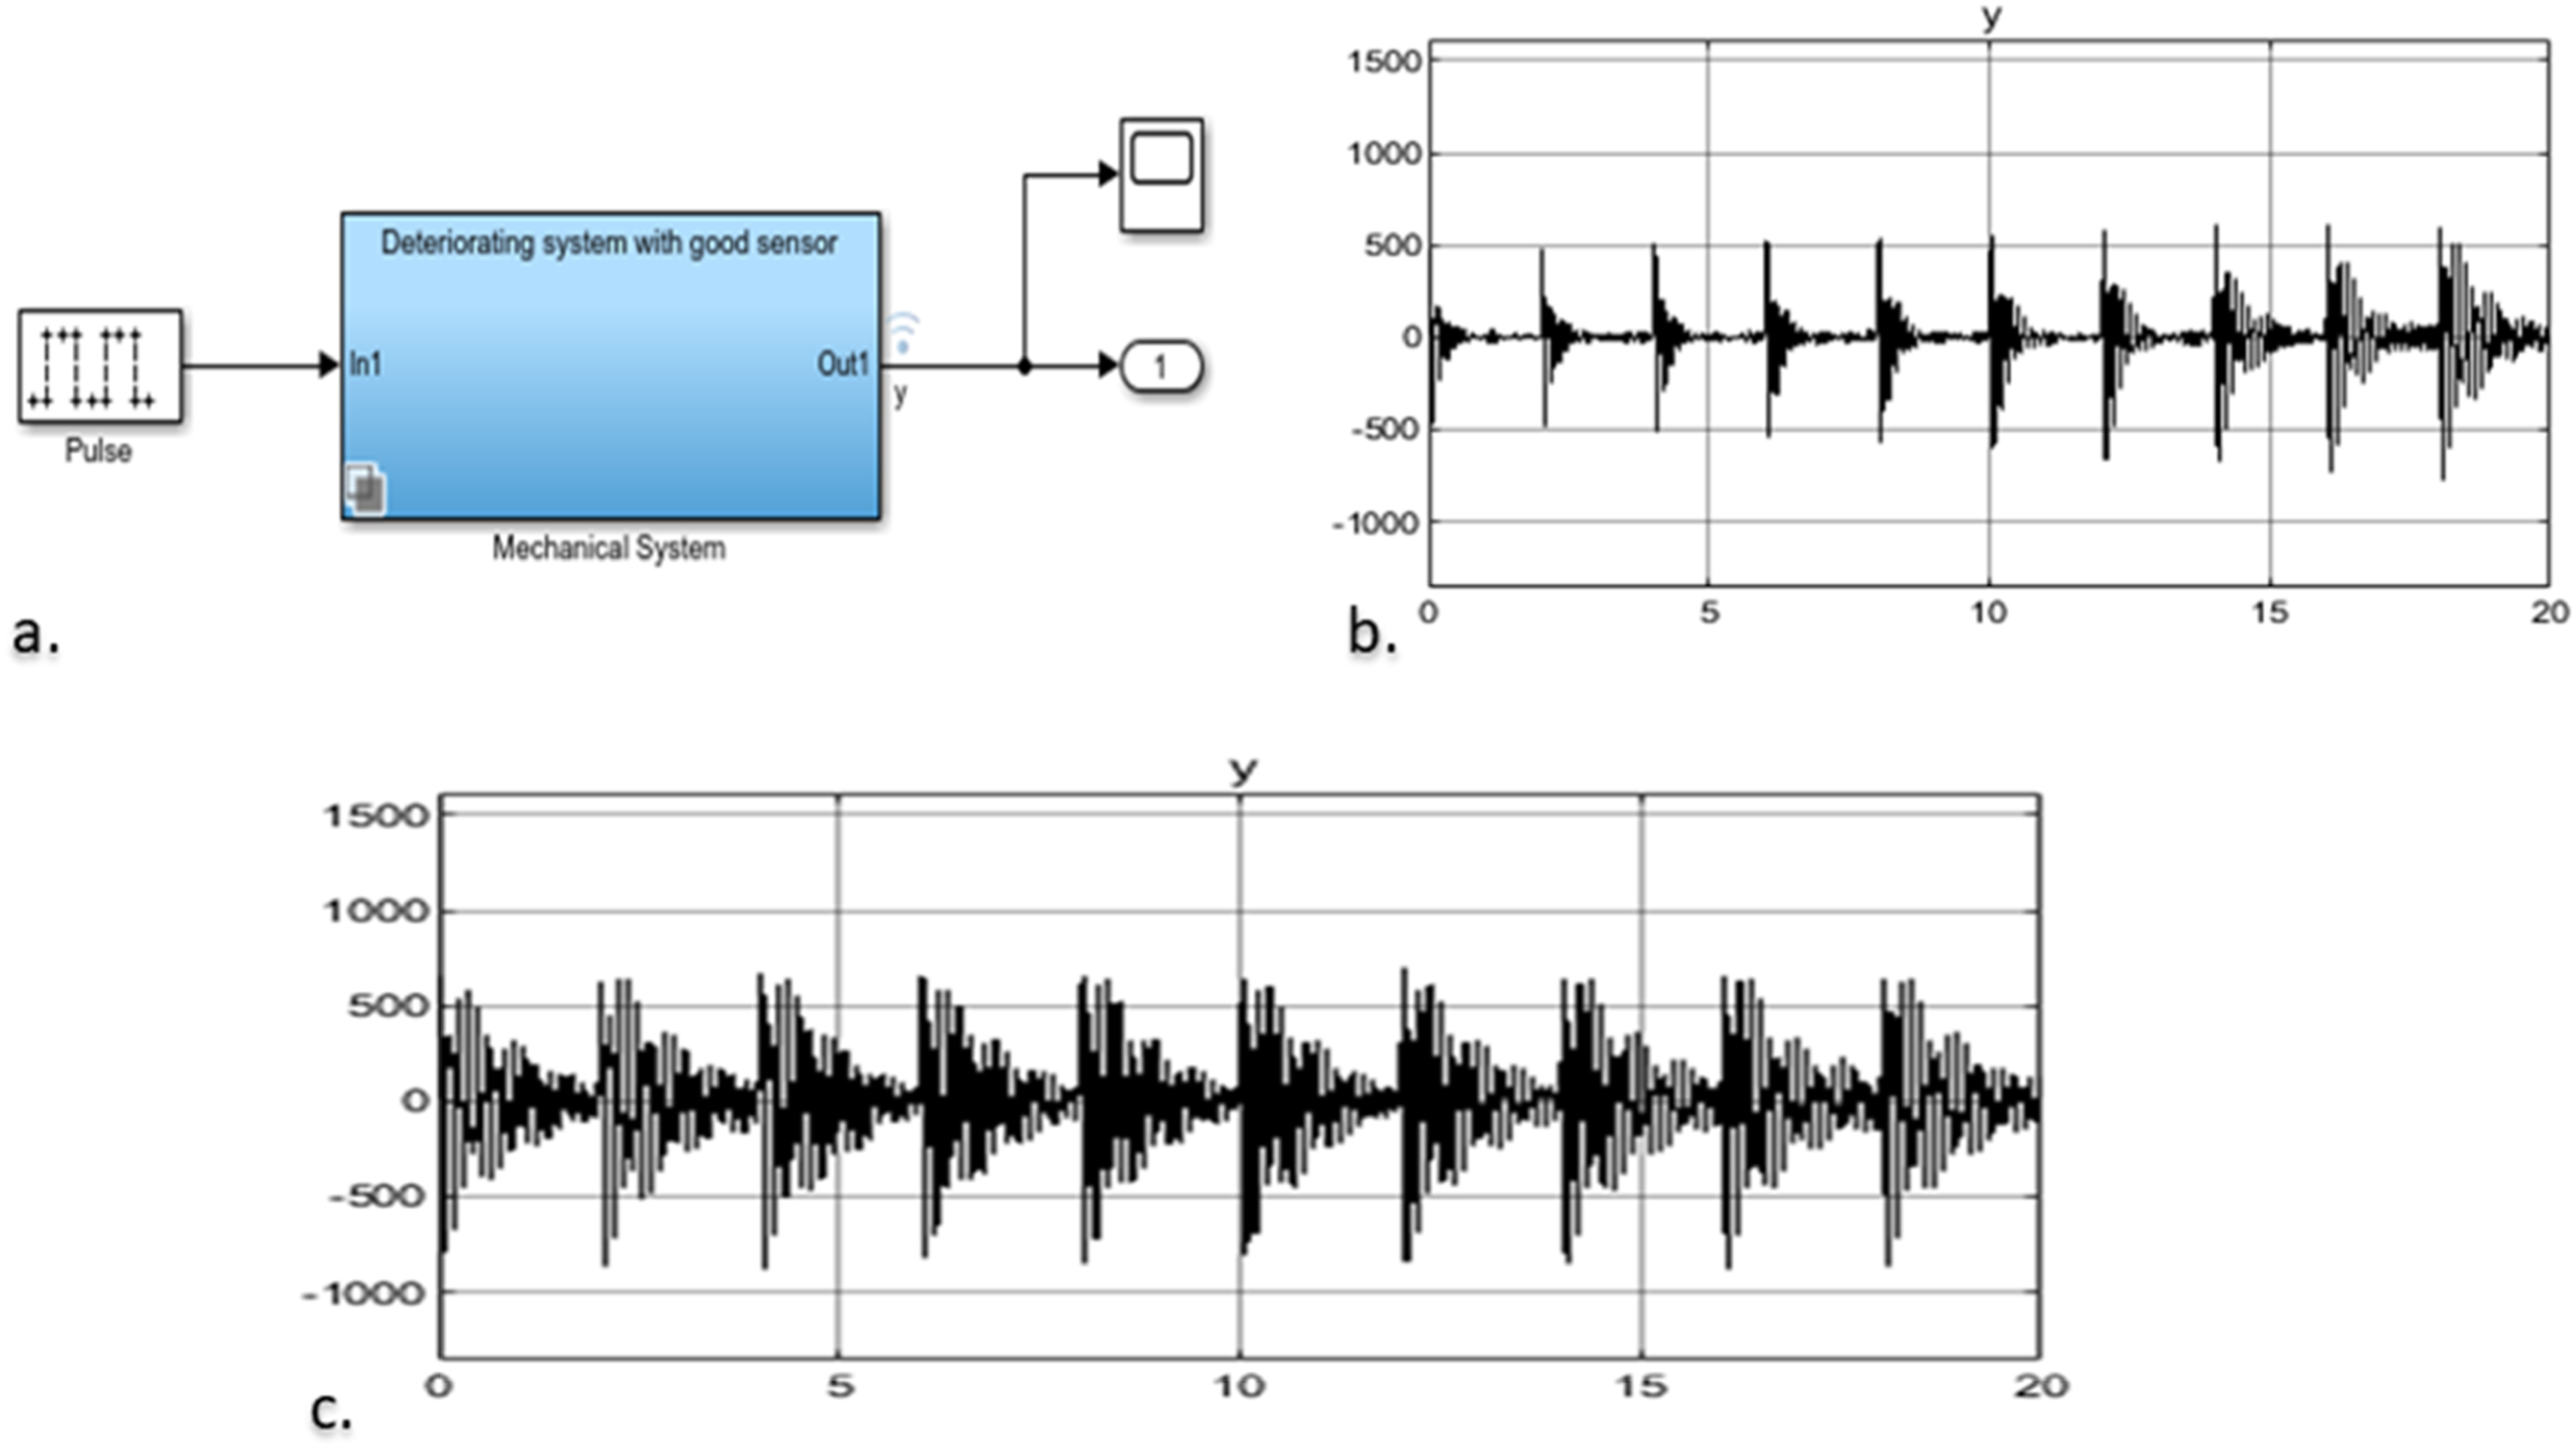
The measured response of the system is indicated in the Figure 7(a) Till the point y the system is said to function normally, beyond which damage is predicted from point y1. Hence the response of the normal movement is greatly reduced which shows the reduction in amplitude of the sensed data. A reduced data corresponds to a slower system or a faulty system and hence maintenance has to be done by identifying the damaged parts in the manufacturing phase as a part of predictive maintenance. The comparison of output of a normal and damaged system are depicted in Figure 7(b) using the output spectra as a function of power and frequency. From the plot the blue colour indicates the normal working range and the green colour indicates the faulty working condition of the system. It is found that the peaks of the faulty system vary abruptly indication a large variation in frequency as a result of vibration occurring due to the damaged part of the machine. The prediction of the state of the system by the sensors as a function of time is shown in Figure 7(c) below. Till time 10 s, the condition is good beyond which the failure occurs. Hence the sensor system immediately identifies the fault system and indicates the shop floor about the condition of machine. The usual working condition is denoted by blue colour and the faulty condition is symbolised by black. The total time of cutting for the number of products is determined in the design phase and is used as a reference for the further phases. From the Figure 7(d) the time for manufacturing each product is shown and this is the optimal time for production which is determined by the fuzzy based time forecasting. This predicted time is to be compared with the time of manufacturing of the products. When the production time exceeds the predicted time, the sensors are to be monitored to determine any fault in the system. (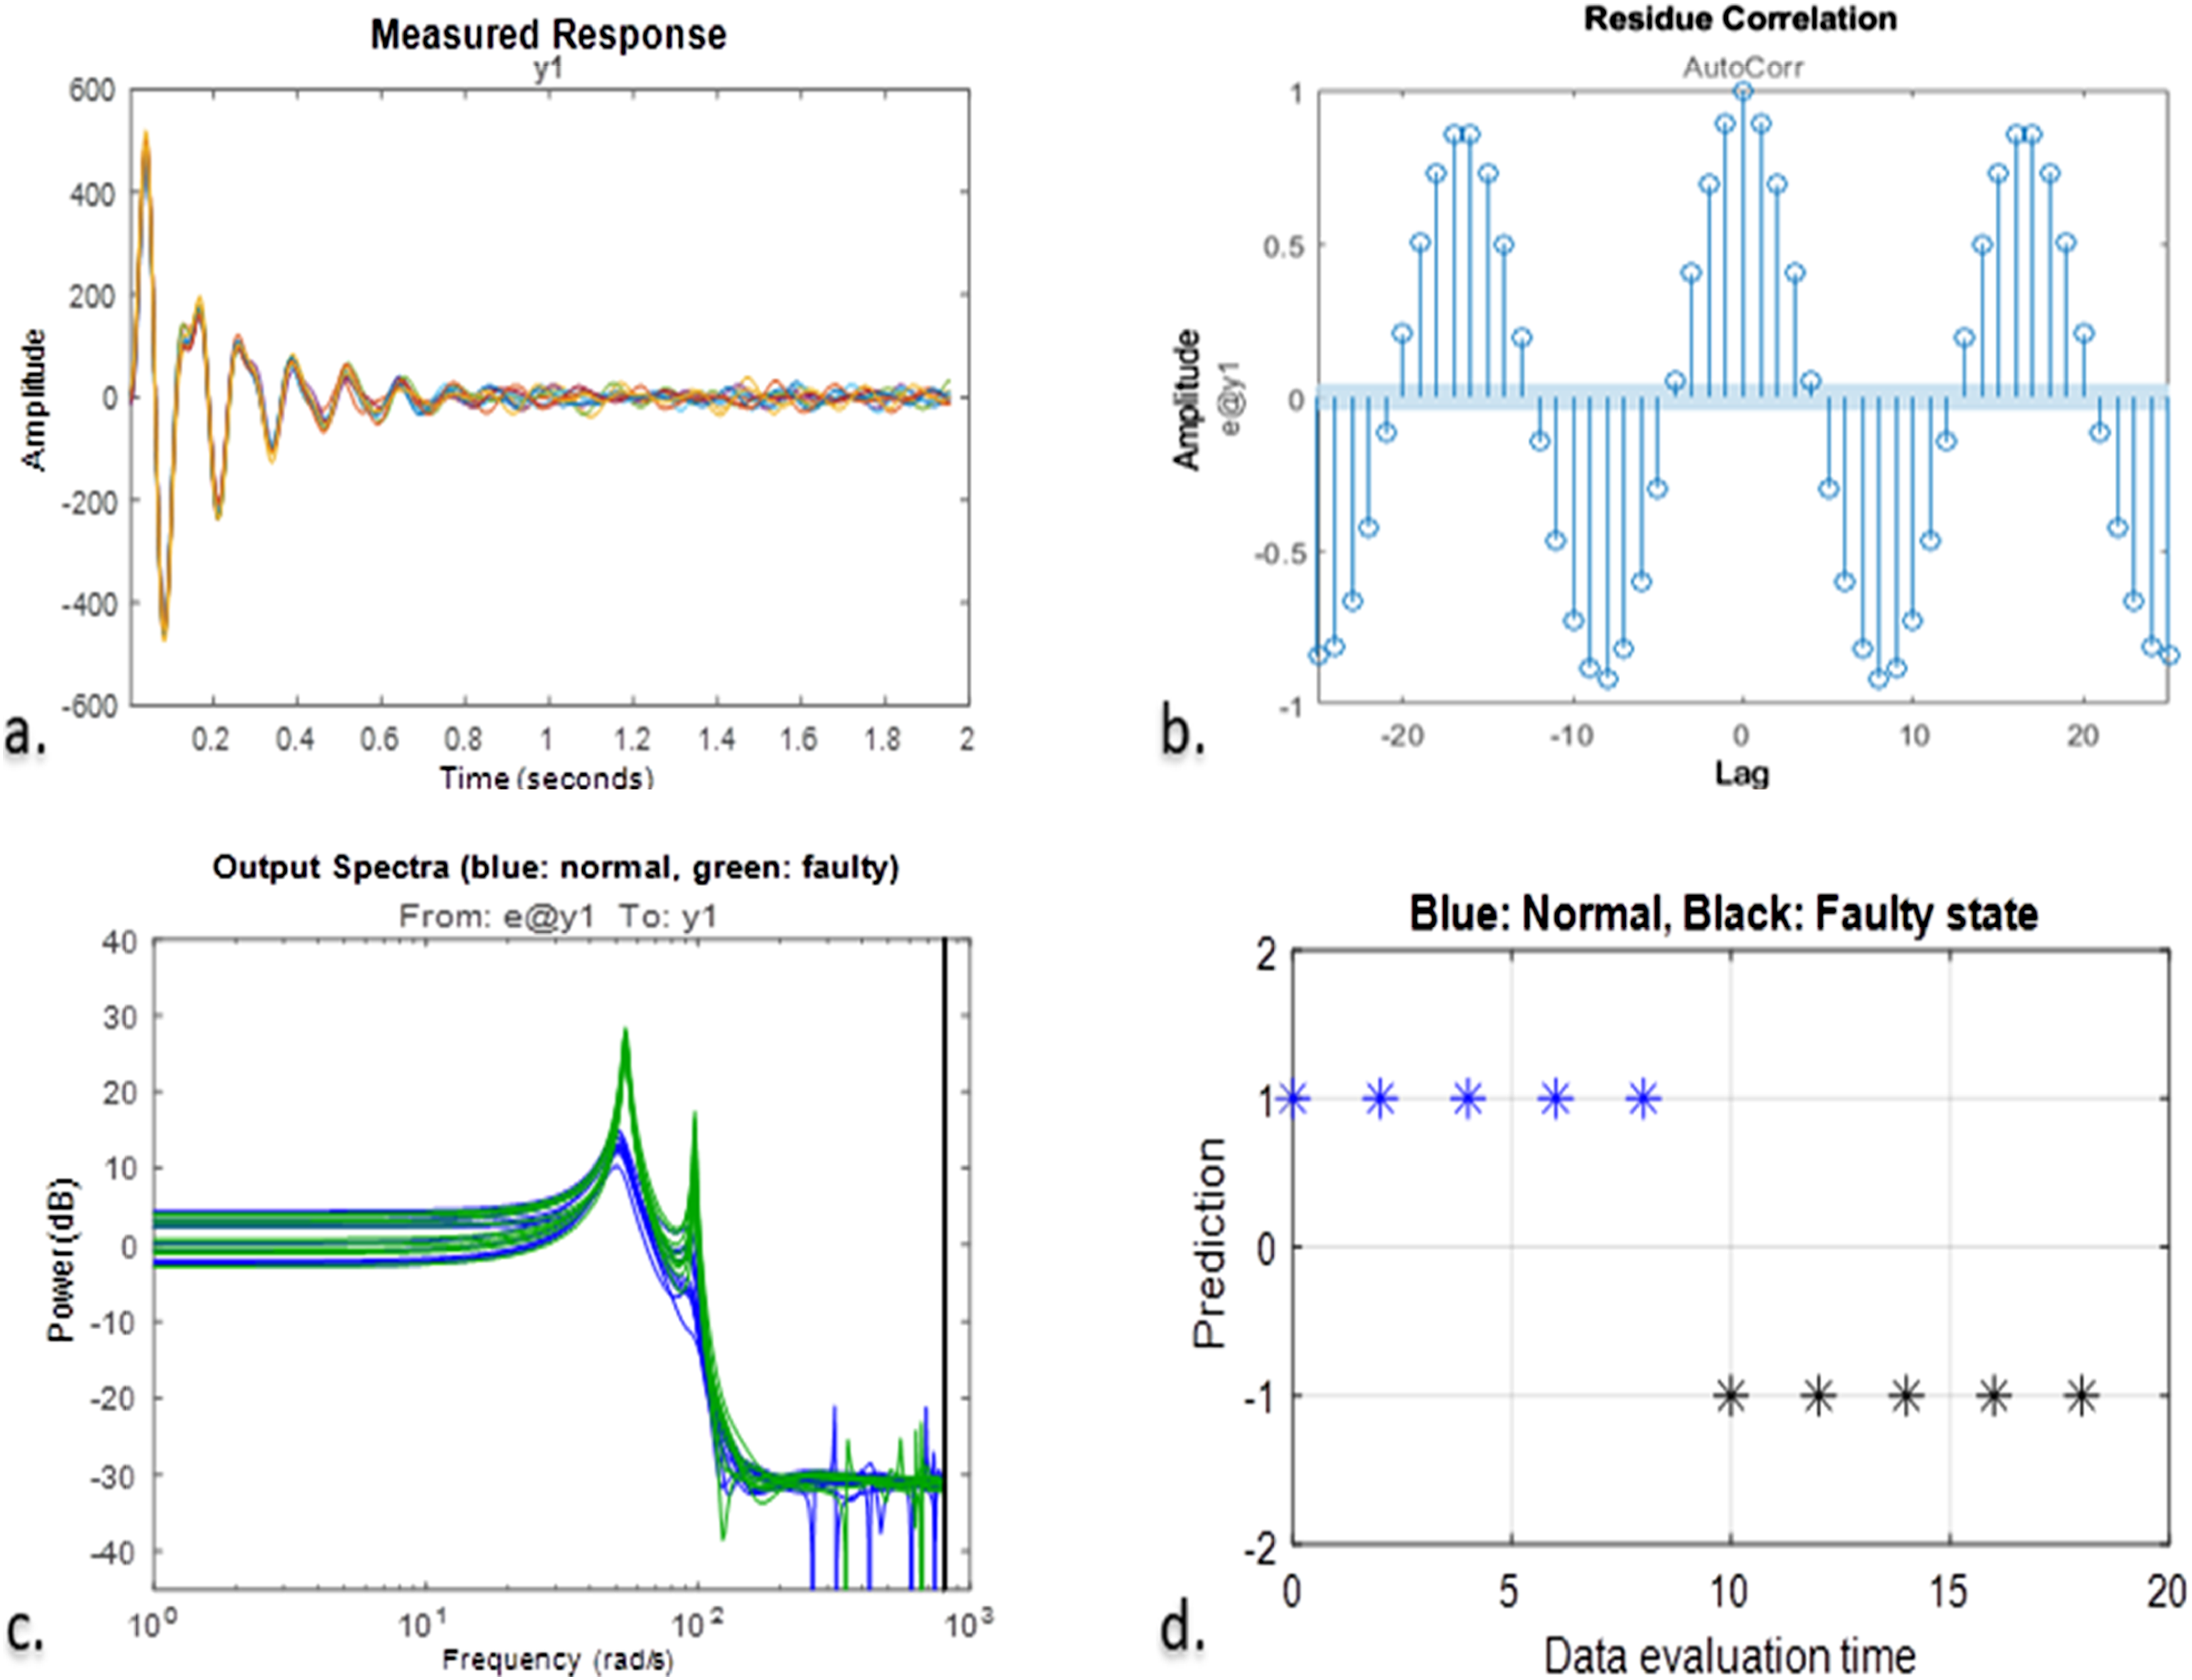
In the manufacturing phase the time of products exceeds the predicted time which indicates that the machining is slower than the expected rate which was determined by using the predictive fuzzy algorithm as shown in Figure 8(a). Hence it is understood that the machine is subjected to some faulty environment and the location is identified using the embedded sensors. As example operations like turning, facing and milling operations of the products fabricated in the shop floor are taken into account as shown in Figure 8(b). The predicted overall time for the production of products in the phases are determined for the products. From the predicted values of time and the actual time, the values are compared and if the actual time exceeds the predicted value, then the sensor data are checked to determine any fault in the machine parts in order to carry out maintenance. The comparison of the time in the phases is depicted in Figure 8(c). It indicates that some products are exceeding the estimated time and they need to be taken for consideration. The design of the product made as a CAD model is used to determine the inspection of the products. The real time dimensions are gathered from the continuous monitoring sensors and the value is compared with the required value with a function of time. When the accuracy is within limits, the process ended. (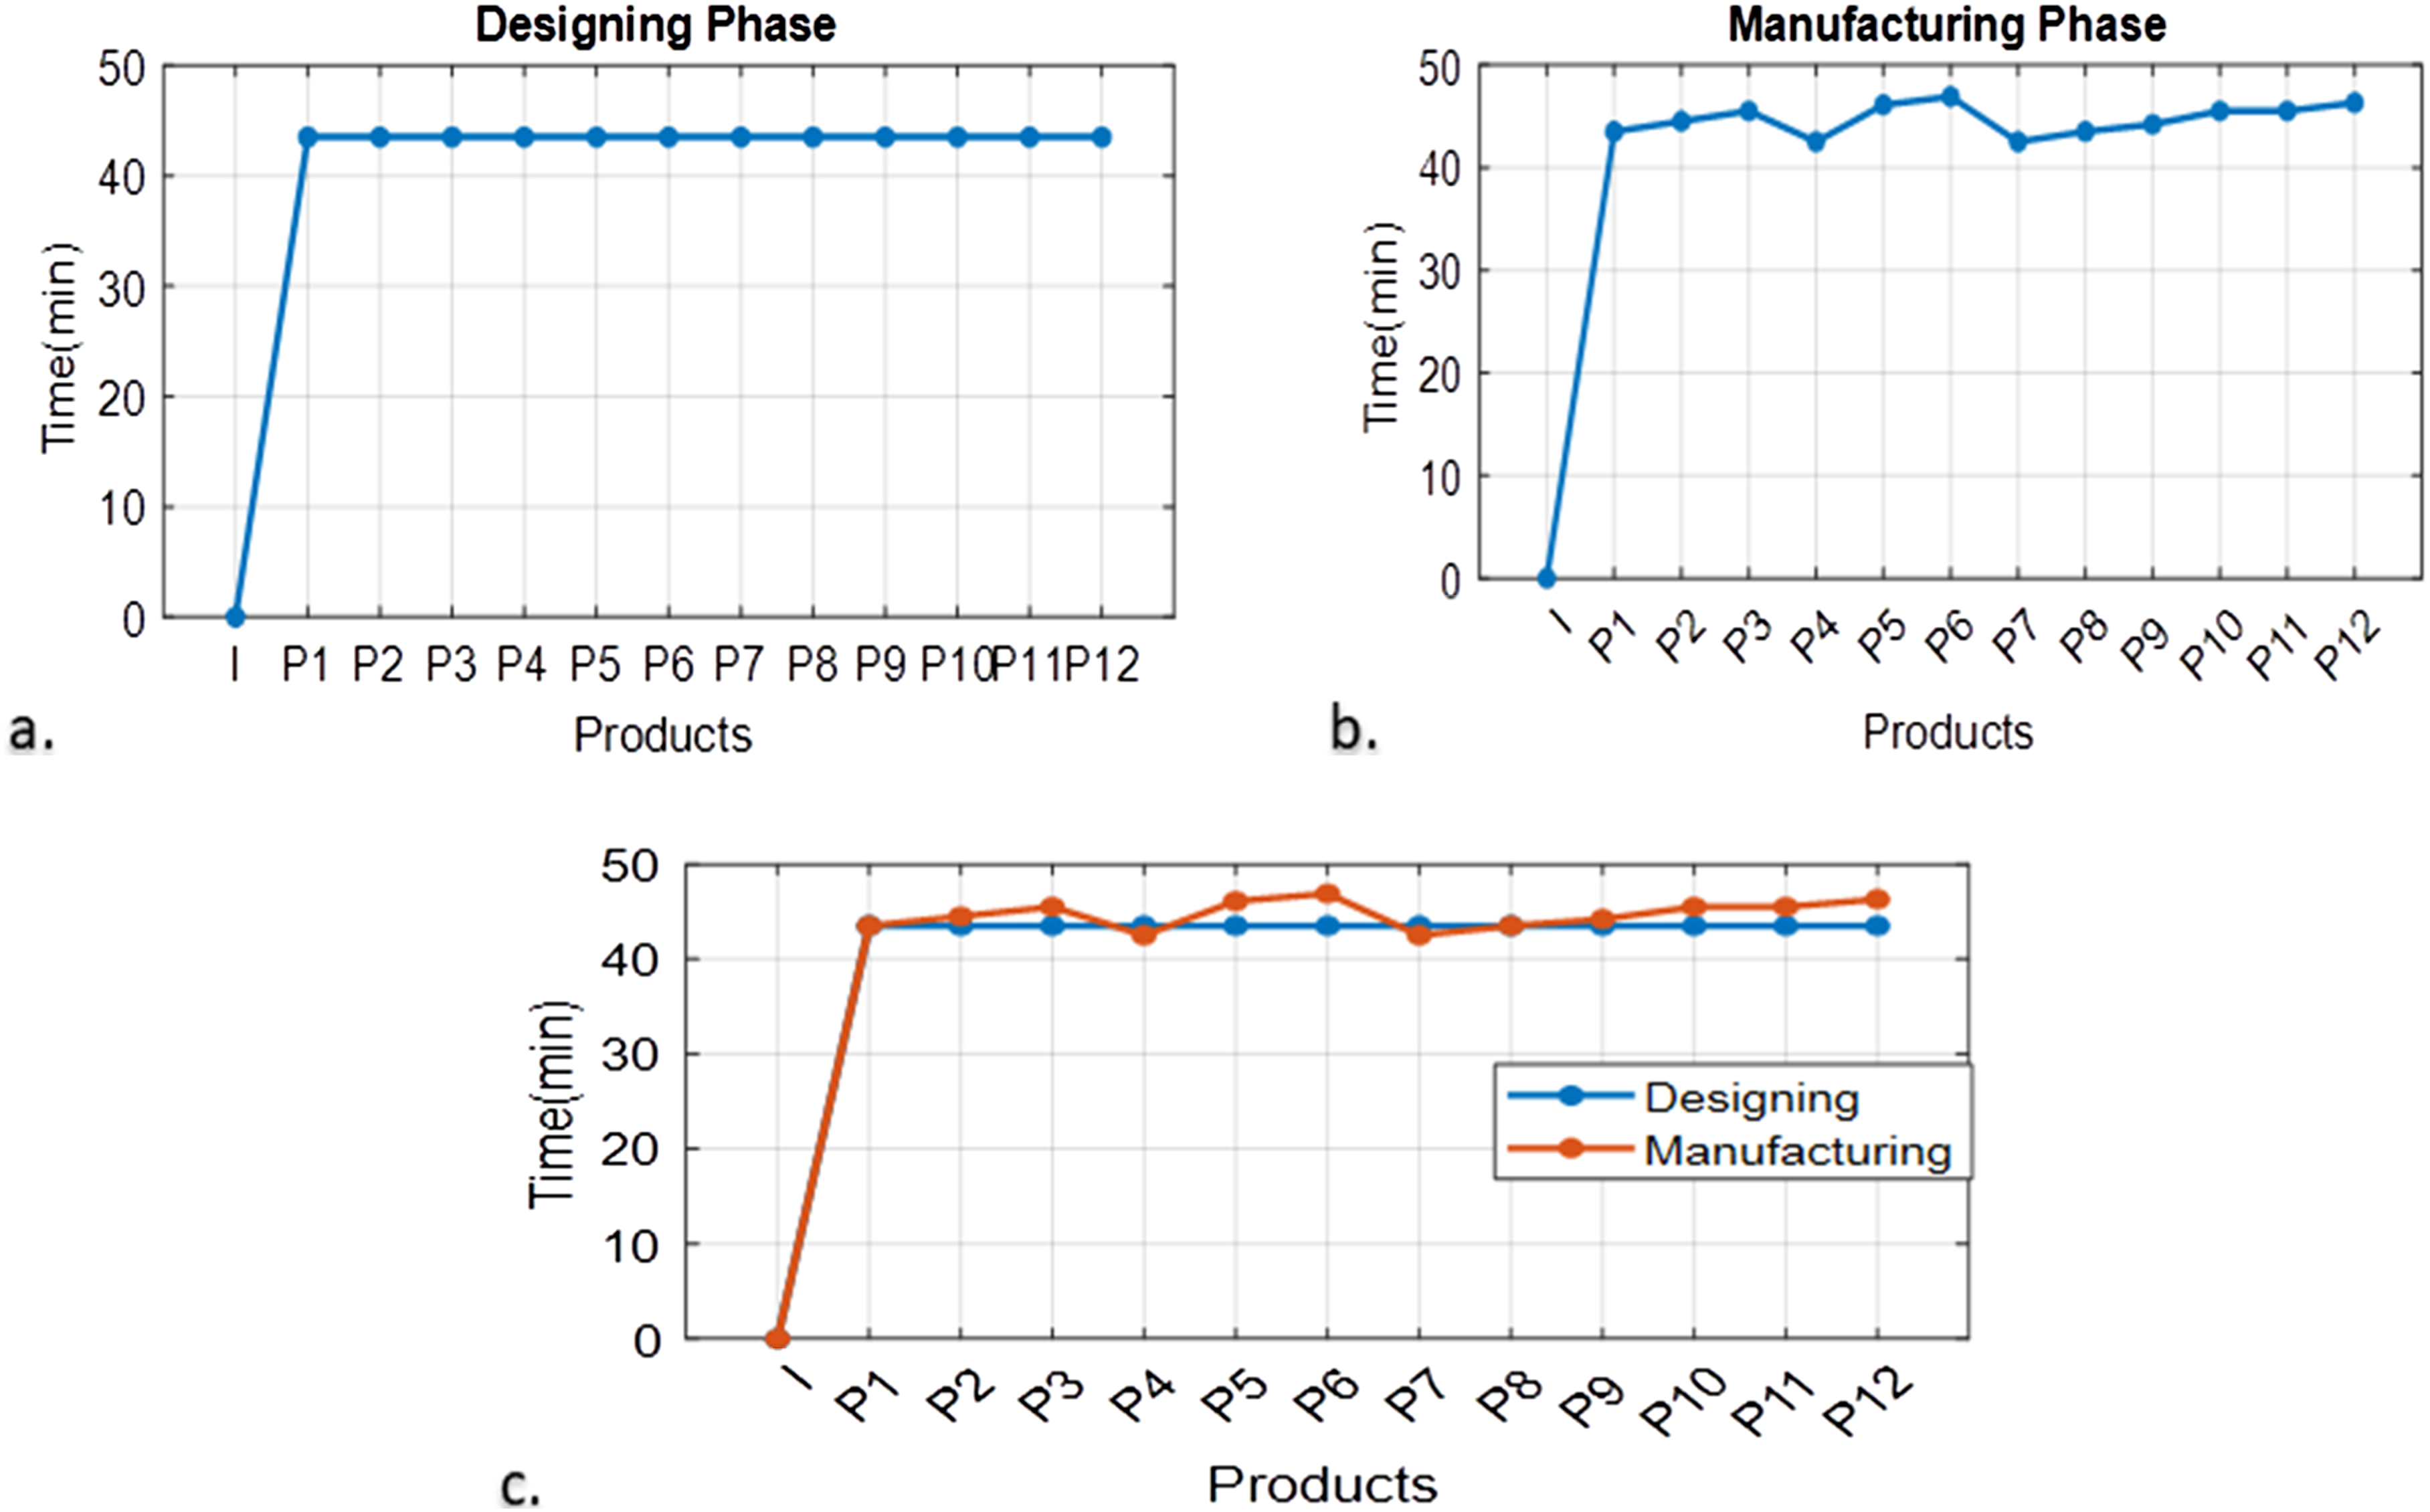
Comparison
The comparison of the proposed method with the various other existing techniques is presented in this section. The comparison of the response time of the sensor is compared in the plot shown in Figure 9(a) It indicates a 2.3 times reduction in the timely response. This indicates that the sensor responds quickly to any fault occurring mechanism in the machining process. a. Comparison of time with various methods 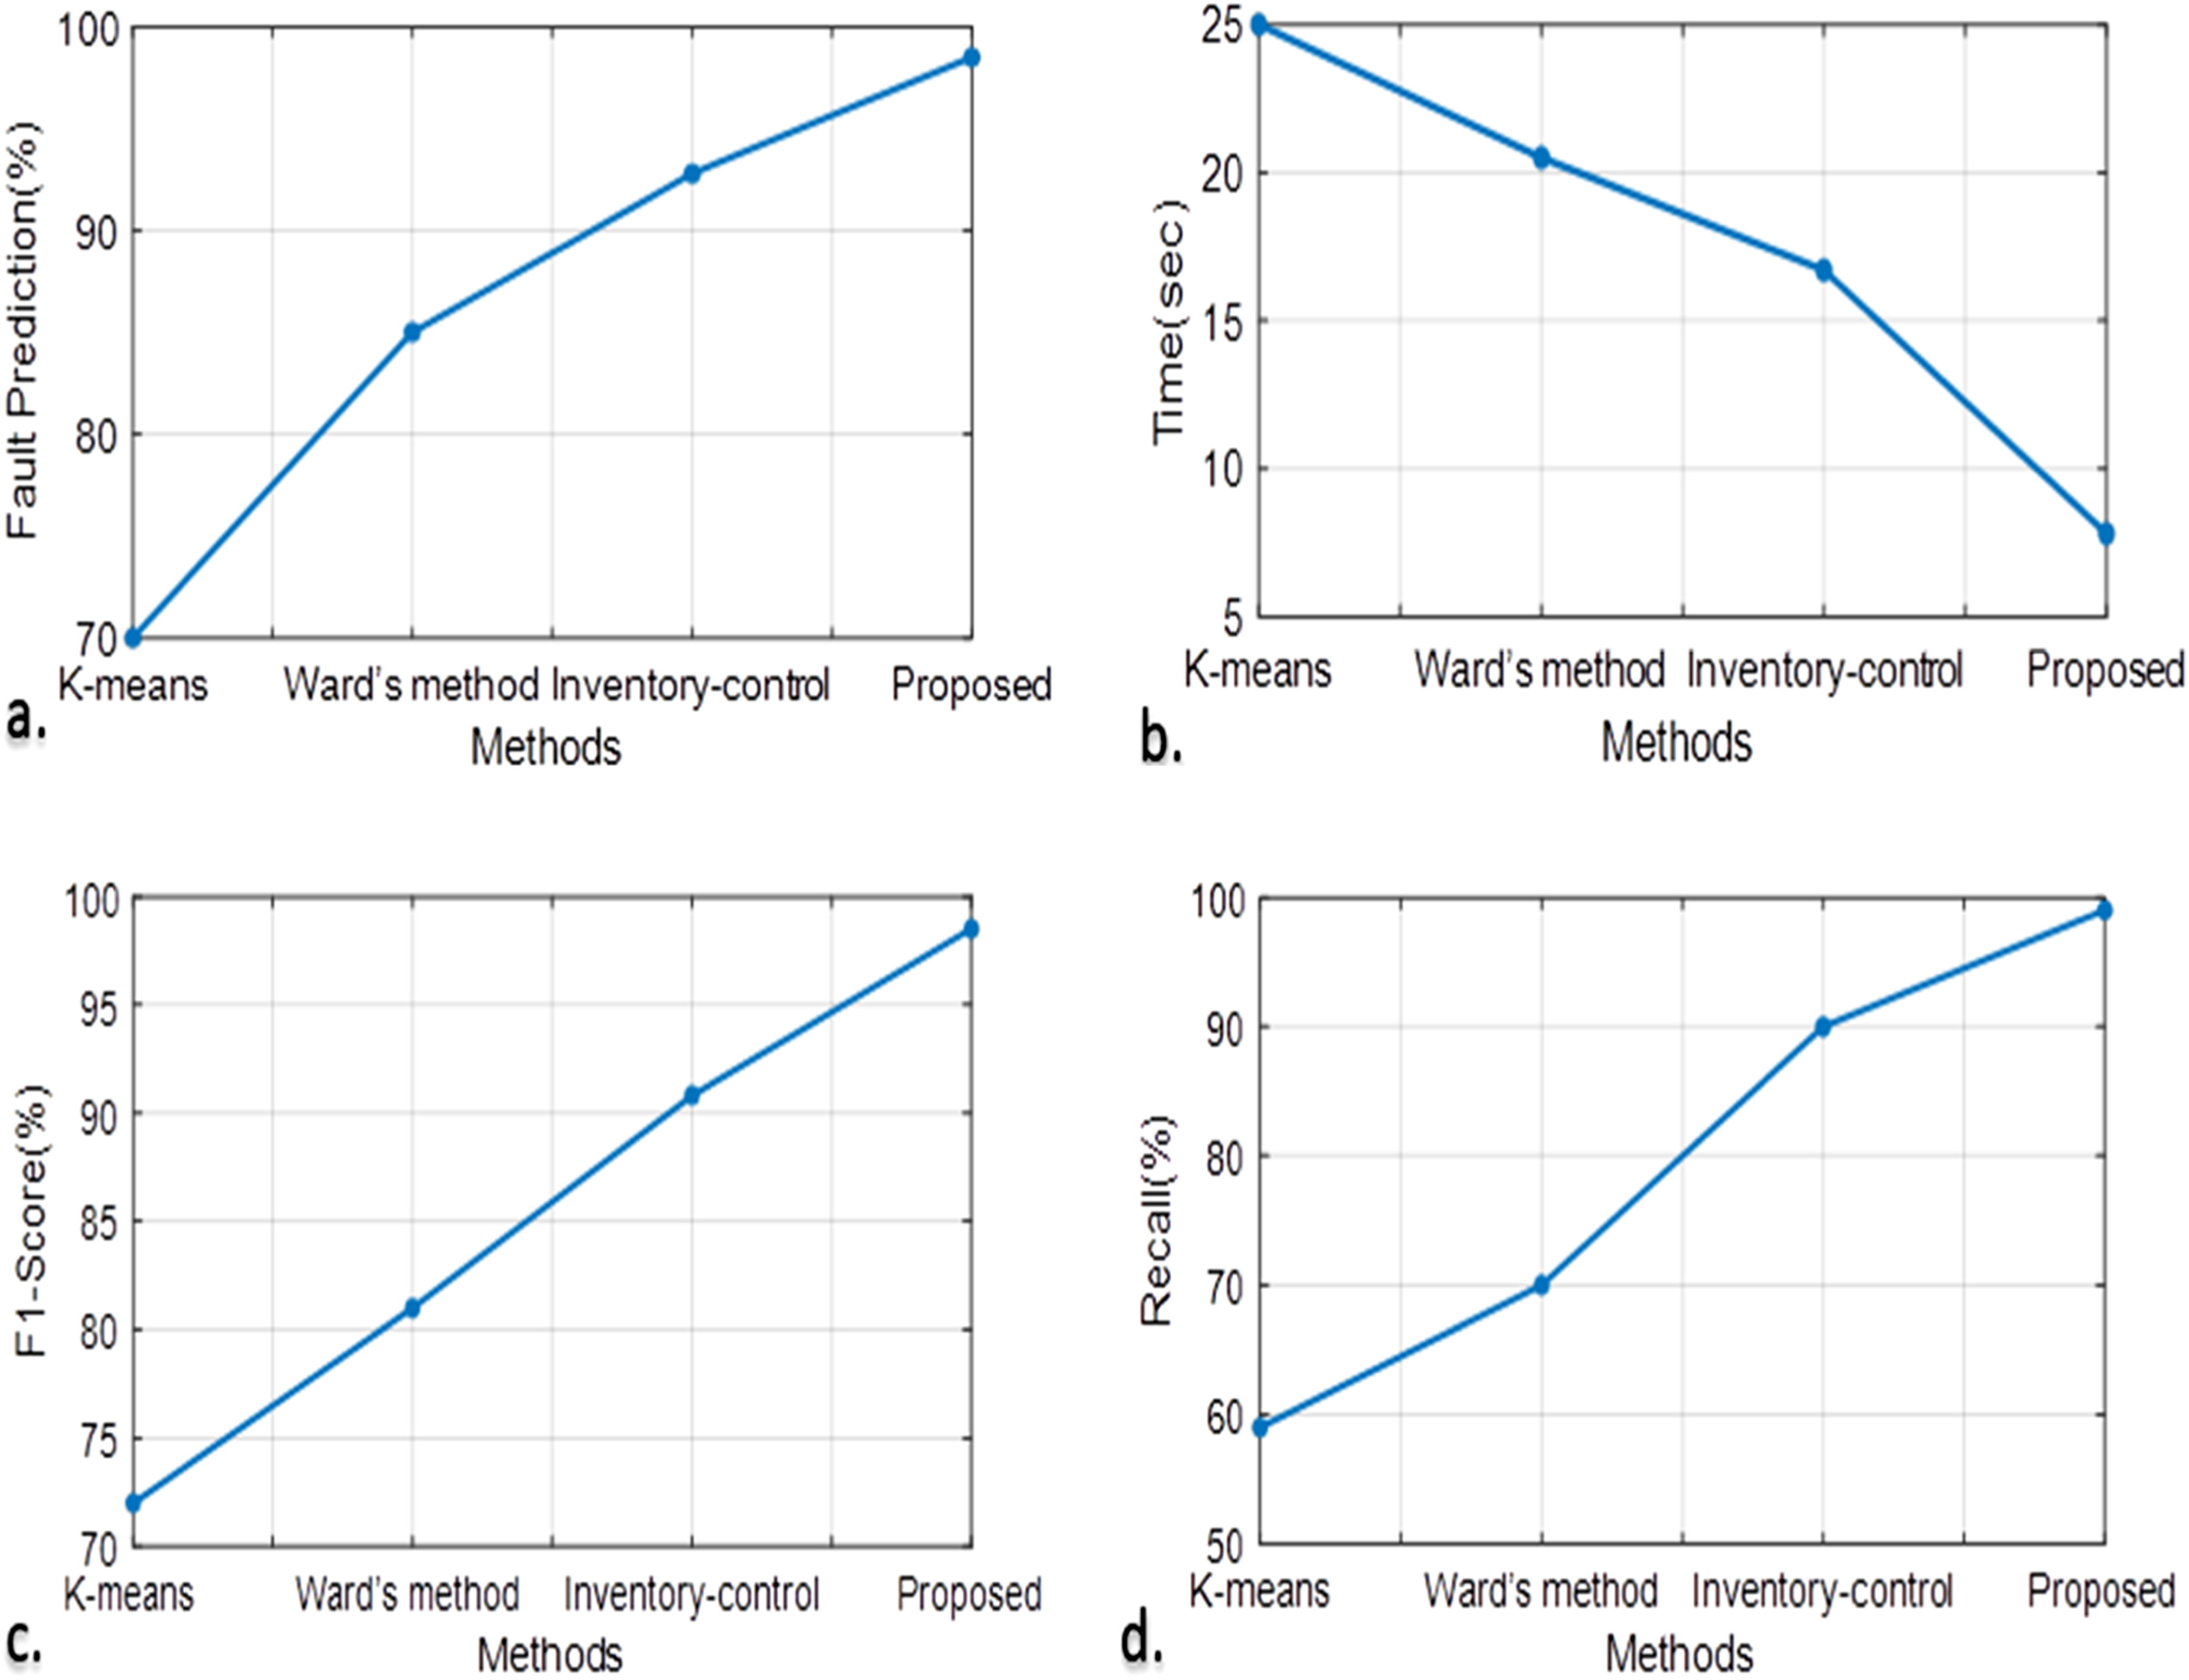
The comparison of fault prediction is being analysed in this plot depicted in Figure 9(b). Various methods like K means, wards method and inventory control are discussed here. It showed that the proposed method is 40% more effective in fault prediction than the other existing methods which is mainly due to the real time detection of early prediction of failure by the nano sensors in the failure prone zones. The F1 score for the proposed method is compared with the existing methods in Figure 9(c). From the comparison it is clear that the proposed method has a 31.57% improvement in the F1 score than the other methods.
The comparison of the recall percentage is discussed in the Figure 10(a) with methods like K means, wards method and inventory control. From the plot the recall percentage for the work is found to be 81.6% more effective for the proposed method. The precision for the work is compared against the existing techniques. It is clear from the plot that the proposed method is more precise than the other compared methods. It showed an improvement of 8.08 percentage precision for the proposed method which is possible mainly due to the placement of sensors in the system. K means, wards method and inventory control methods are compared for accuracy in Figure 10(b) with the proposed method. The plot indicated that the proposed method is 30.6% accurate than the K means method which has the lowest accuracy in the comparison. The embedded sensors provide information about the process and condition of the machine parameters and thus help in improving the accuracy of the system. (a). Comparison of Precision (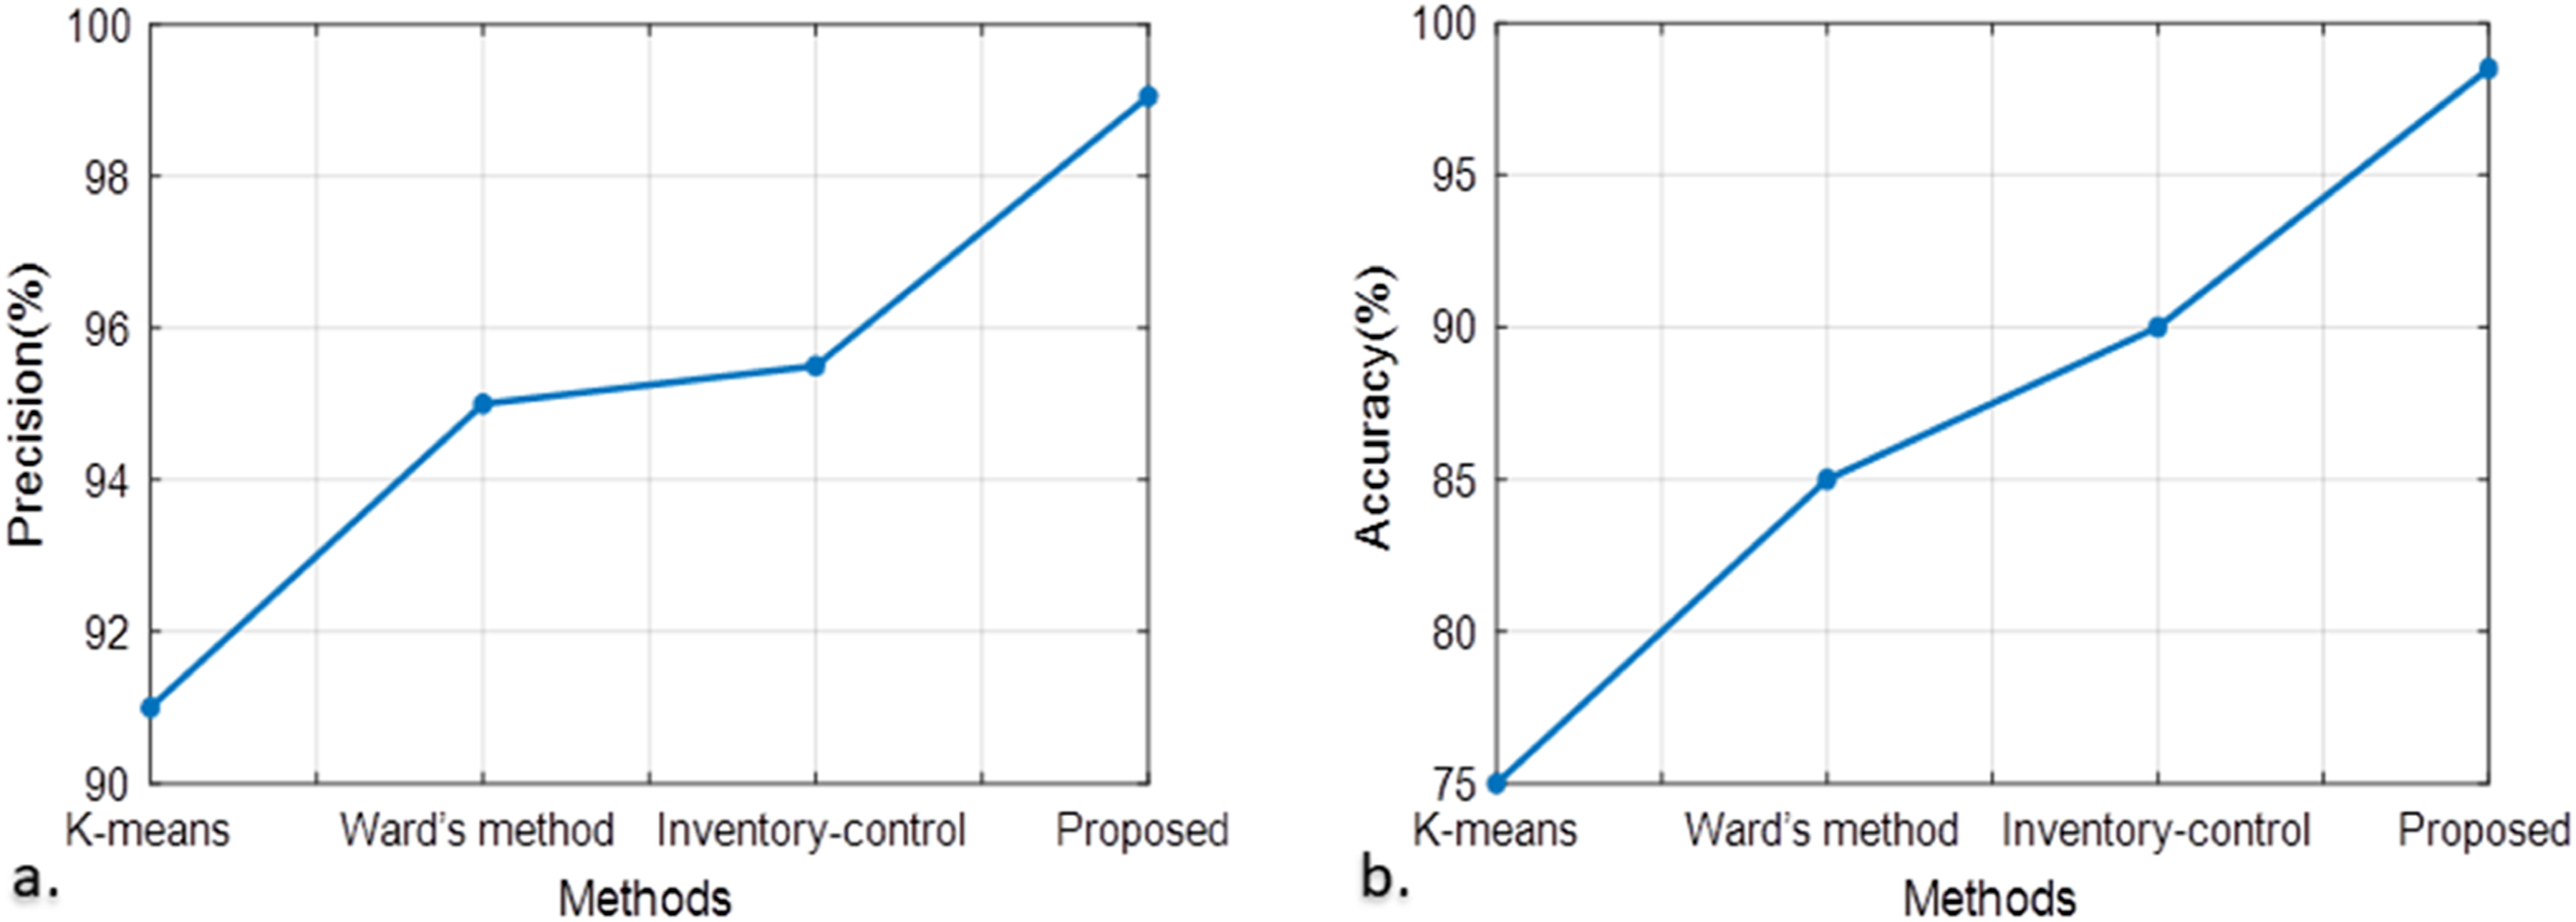
Conclusion
This work proposed a technique for integrating lean approaches and manufacturing process objectives. This methodology is ideally suited for industrial use inside manufacturing businesses due to the use of well-known target variables, modified variables, and lean processes. Here by using the intuitive fuzzy syncretic lean frame work and by employing the sensors with algorithm the frame work determines a time based forecasting which helps in effective completion of the products within optimal time. The manufacturing of products is done and the predictive maintenance is carried out in a manner by comparing the product manufacturing time with the predicted time in the design phase. The inspection of the products is carried out in a real-time manner with the help of smart sensors which eradicates the need of manual quality control thereby improving customer satisfaction by reducing and eliminating defective products. Comparisons were also done with various methods which indicated a 2.3 times improvement in the response time, and a 40% increase in the faulty prediction. It also indicated an 81.6% improvement in recall percentage and a 31.5 percentage increase in F1 score. The precision of the method was found to be 80.8 % improvement and the accuracy was improved by 30.6% when compared to the other methods. Thus by implementing the fuzzy syncretic lean frame work the lean tools likes Overall Equipment Effectiveness, Takt time, Continuous flow and Poka-yoke are implemented with an overall improvement in the shop floor with good quality and customer satisfaction thereby improving the performance and effectiveness of maintenance by incorporating intelligent systems with lean tools to eliminate unnecessary costs and production losses improving total productive maintenance of any manufacturing environment.
Future scope and limitations of the work
This fuzzy, syncretic framework aims to enhance efficiency and quality while allowing flexibility in decision-making when precise data is either unavailable or too complex to interpret rigidly. By combining Lean’s waste reduction with the nuanced decision-making of fuzzy logic, this approach improves both speed and quality. It is particularly valuable in industries that frequently face change, uncertainty, or variability in their processes. The Fuzzy Framework helps reduce costs by increasing efficiency, minimizing waste, and optimizing resource allocation in uncertain and dynamic environments.
However, there are Limitations in implementing this framework. Introducing fuzzy logic into Lean processes can complicate decision-making, as it requires a deep understanding of fuzzy systems. It may also be more difficult to explain and implement in organizations accustomed to traditional Lean methods. Despite these challenges, the Fuzzy Framework plays a crucial role in balancing cost efficiency and sustainability in modern industries, making it a vital tool for future industrial strategies focused on both profitability and environmental responsibility.
Footnotes
Declaration of conflicting interests
The author(s) declared no potential conflicts of interest with respect to the research, authorship, and/or publication of this article.
Funding
The author(s) received no financial support for the research, authorship, and/or publication of this article.
Data Availability Statement
The data that support the findings of this study are available from the corresponding author, upon reasonable request.
Appendix
Author biographies