
Abstract
This paper describes a decentralised smart grid system containing renewable energies, storage systems and distributed generation with human control and intervention. The importance of each element and the interaction between them leads to think about a decision-making strategy. In fact, the integration of a Photovoltaic Panel (PVP) is used due to its availability and its participation in the carbon emissions reduction. Also, a battery is required to fill a power gap or absorb extra generated energy. Moreover, an optimal sizing is needed to get an efficient system with minimum cost. Also, an energy management strategy (EMS) is essential to ensure the power resources scheduling in order to keep a continuous equilibrium supply-demand of electricity and avoid instabilities in the grid, with guaranteeing a minimum cost of electricity. In the first part, the proposed smart grid optimal sizing is determined under real weather data (solar radiation) of the city of Sousse, Tunisia, using the Hybrid Optimization of Multiple Energy Resources (HOMER) software technique. This approach is chosen thanks to its simplicity, effectiveness, and high precision compared to traditional techniques. In this paper, several configurations (Grid, (Grid-battery), (Grid-PVP), (Grid-PVP-battery)) are studied. The obtained results prove that the (Grid-PVP-battery) system configuration is the most efficient and economical solution. In the second part, a robust energy management strategy (EMS) is proposed for two smart grid configurations (grid-battery, grid-PVP-battery). This strategy is based on Fuzzy Logic Control (FLC) thanks to its non-linear modelling and its ability to make decisions relating to energy management. The primary goal of the suggested (EMS) is to ensure the energy resources scheduling in order to keep a continuous equilibrium among the production and consumption of electricity and avoid instabilities in the grid, with guaranteeing a minimum cost of electricity. As input data, (FLC) used time-varying price electricity (Price (t)) to solve an instant decision problem by choosing, at each instant, the optimal energy source (which provide electricity at the cheapest price possible). The obtained results, carrying out Matlab simulation, prove the efficacy of the proposed strategy, not only, in the energy resources scheduling to meet the load, but also, for the system cost reduction since the PVP has been used as much as possible since it is inexpensive relative to the costs of battery capacity and the grid.
Keywords
Introduction
Over the last decade, the smart grid presents a promising solution for improving the traditional grid reliability, increasing its flexibility, maintaining its sustainability, and minimizing the energy losses. Furthermore, one of the smart grid objectives is to reduce the carbon emissions, thus, it allows the involvement of renewable energy sources like solar and wind power (Dan et al., 2020; Olfa and Mohamed, 2016). Besides, batteries, super capacitors, and other forms of distributed energy storage are required to handle extra or deficient electricity (Lu et al., 2021). Moreover, and compared to the traditional grid, the smart grid can provide electricity at the cheapest price possible. Indeed, the smart grid consists on optimization techniques based on real time data and dynamic energy prices to achieve the reciprocal relation control between the energy demand and supply (Khalid et al., 2019). In fact, customers can reduce their consumption, store energy and reuse at a later time or delayed some appliances operation according to a time-varying price signal (Alam et al., 2014). Despite the advantage of the smart grid in meeting various electric needs (ventilation, heating, air conditioning system, water heater and pump), this type of grid requires a large advanced information, communication, and devices. Also, the incorporation of sustainable power generators and systems storage generates the addition of new technologies to power systems operations. Therefore, an optimal sizing is needed to get an efficient system with minimum cost. Also, an energy management strategy (EMS) is essential to ensure the power resources scheduling in order to keep a continuous equilibrium supply-demand of electricity and avoid instabilities in the grid, with guaranteeing a minimum cost of electricity (Zeng and Berti, 2019). Furthermore, to guarantee its optimization, smart grid dimension and price need to be addressed. For the sizing issue, many approaches have been proposed. In fact, authors in (Mohammadzadeh and Gharehchopogh, 2020) have used the flower pollination algorithm for a hybrid smart grid cost reduction, nevertheless, this algorithm presents an excess of time consumption. In (Chokri et al., 2015), particle swarm optimization algorithm (PSO) is the technique employed. When faced with complicated scenarios, the PSO algorithm may reach convergence too quickly and get stuck in a local optimum. A mine blast algorithm has been adopted in (Fathy, 2016) for a hybrid smart grid system in Egypt, the disadvantage of this algorithm is its neglect of reliability factors. In (Sufyan et al., 2019), a firefly optimization genetic algorithm is used to determine a smart grid components size. This technique is simple, but it was stuck in local optima. To overcome these approaches shortcomings, the Hybrid Optimization of Multiple Energy Resources (HOMER) software technique is proposed thanks to its simplicity, effectiveness, and high precision compared to traditional techniques. It has been developed for both off-grid and on-grid systems and it is known for their user-friendliness (Tozzi and Jo, 2017). Indeed, in (Ramli et al., 2018), the HOMER software has been adopted for a smart grid optimal sizing in Algeria and in Saudi Arabia, respectively. Its effectiveness has been proven in reducing the cost when meeting the load. For the energy management strategy issue, several approaches and tools have been proposed to meet the challenges of integrating electricity production from renewable sources as well as energy storage. In (Kandaswamy et al., 2023), an EMS for a photovoltaic panel (PVP)-gas turbine system and for an Electric Vehicle Powered by a Hybrid Energy Storage System, respectively has been presented. Load and power forecasting, done a day ahead, have been taken into consideration in order to ensure an optimal operation of the system. In (Radhakrishnan and Srinivasan, 2016), authors have proposed a multi-agent system based on distributed energy management strategy for smart grids including renewable sources and distributed energy storage. Atheoretical algorithm, based on “Tit for Tat” game (GTFT), has been adopted in (Reka and Ramesh, 2016) in order to give for the customer an idea about his consumption cost.
The cuckoo search algorithm, known for its reduced computation time (Nadjemi et al., 2017), has been applied to a PV–wind–battery system. On the other hand, in (Singh et al., 2022) a reinforcement learning method, based on the “Q_learning” algorithm, has been adopted. It uses real data of the smart grid environment. The grasshopper optimization algorithm, recently developed and inspired by the food-seeking behavior of grasshopper swarms (Saremi et al., 2017), has been applied to a hybrid system located in Nigeria (Bukar et al., 2019). Furthermore, diverse algorithms have been combined and used for the sizing problem. In fact, in (Essa et al., 2019), a combination of non-dominated sorting genetic algorithm (NSGA) and multi-objective particle swarm optimization (MOPSO) was adopted to simultaneously minimize carbon dioxide emissions and system cost.
However, the most above-mentioned EMS need long computing time and some essential data such as every node measured power. Also, some EMS are centralized, which leads to single point failure. Thus, the adopted EMS could make undesirable decisions and generate instabilities in the grid. Therefore, and to guarantee a continuous balance between the supply and the demand of electricity, fuzzy logic control (FLC) could be considered as a successful solution thanks to its ability to make decisions relating to energy management as suggested in (Singh et al., 2022). Indeed, an energy management strategy, based on (FLC) has been adopted to ensure the combination of energy storage technologies with sustainable power sources. Based on the average power generated, authors make decision about the appropriate Solar Panel (SP) to use by taking into account the various standards of the 11 SPs utilized as reference panels (Justin Raj et al., 2022). In (Ben Naceur et al., 2022), authors have introduced a neuro-fuzzy technique for the energy optimization and the production management. A multi-objective fuzzy stochastic programming approach, adopted by a Vietnamese electricity company in the residential sector, is presented in (Tsao et al., 2019) to reduce the expenses of the smart grid on the economical, ecological, and social scale under unpredictable situations. The purpose is to identify the ideal quantity, position, and performance of integrated sustainable energy resources among with their variable energy prices. The study, presented in (Derrouazin et al., 2017), focuses on designing an effective multi-input fuzzy logic control system for managing the flow of electricity of a smart grid based on PVP and a wind turbine with storage system.
In this work, an intelligent EMS, based on Fuzzy Logic controllers, is proposed to implement a control strategy for smart grids. (FLC) have been chosen due to their non-linear modelling and its ability to manage uncertain data and control and the scheduling of the energy resources. Moreover, the adopted Fuzzy systems are used to reduce the system cost with taking into account economic, social, and environmental factors.
In this paper, the HOMER is used for several configurations (Grid, (Grid-battery), (Grid-PVP), (Grid-PVP-battery)) in order to determine the most reliable and costless one. Then, the energy management strategy is studied for the (grid, battery) and (grid, PVP, battery) configurations. For both types, the FLC is proposed to solve an instant decision problem by choosing, at each instant, the optimal energy source (which provide electricity at the cheapest price possible) to supply the demand.
This paper is structured the following way: In Smart grid modelling section, the models of each smart grid components (grid, battery, PVP) are given. In the smart grid optimal sizing section, the smart grid sizing based on the HOMER technique is studied, its simulation results have been illustrated. In the energy management appraches section, the proposed energy management strategy is described for both configurations ((grid, battery) and (grid, PVP, battery)). The Fuzzy Logic Control algorithms, its modules and simulation results are developed in section 5. Section 6 gives the conclusion.
Smart grid modelling
The adopted smart grid, presented in Figure 1, contains the electrical grid as the principal energy source, the PVP as the renewable energy source, the battery as the energy system storage, and the load. The studied smart grid.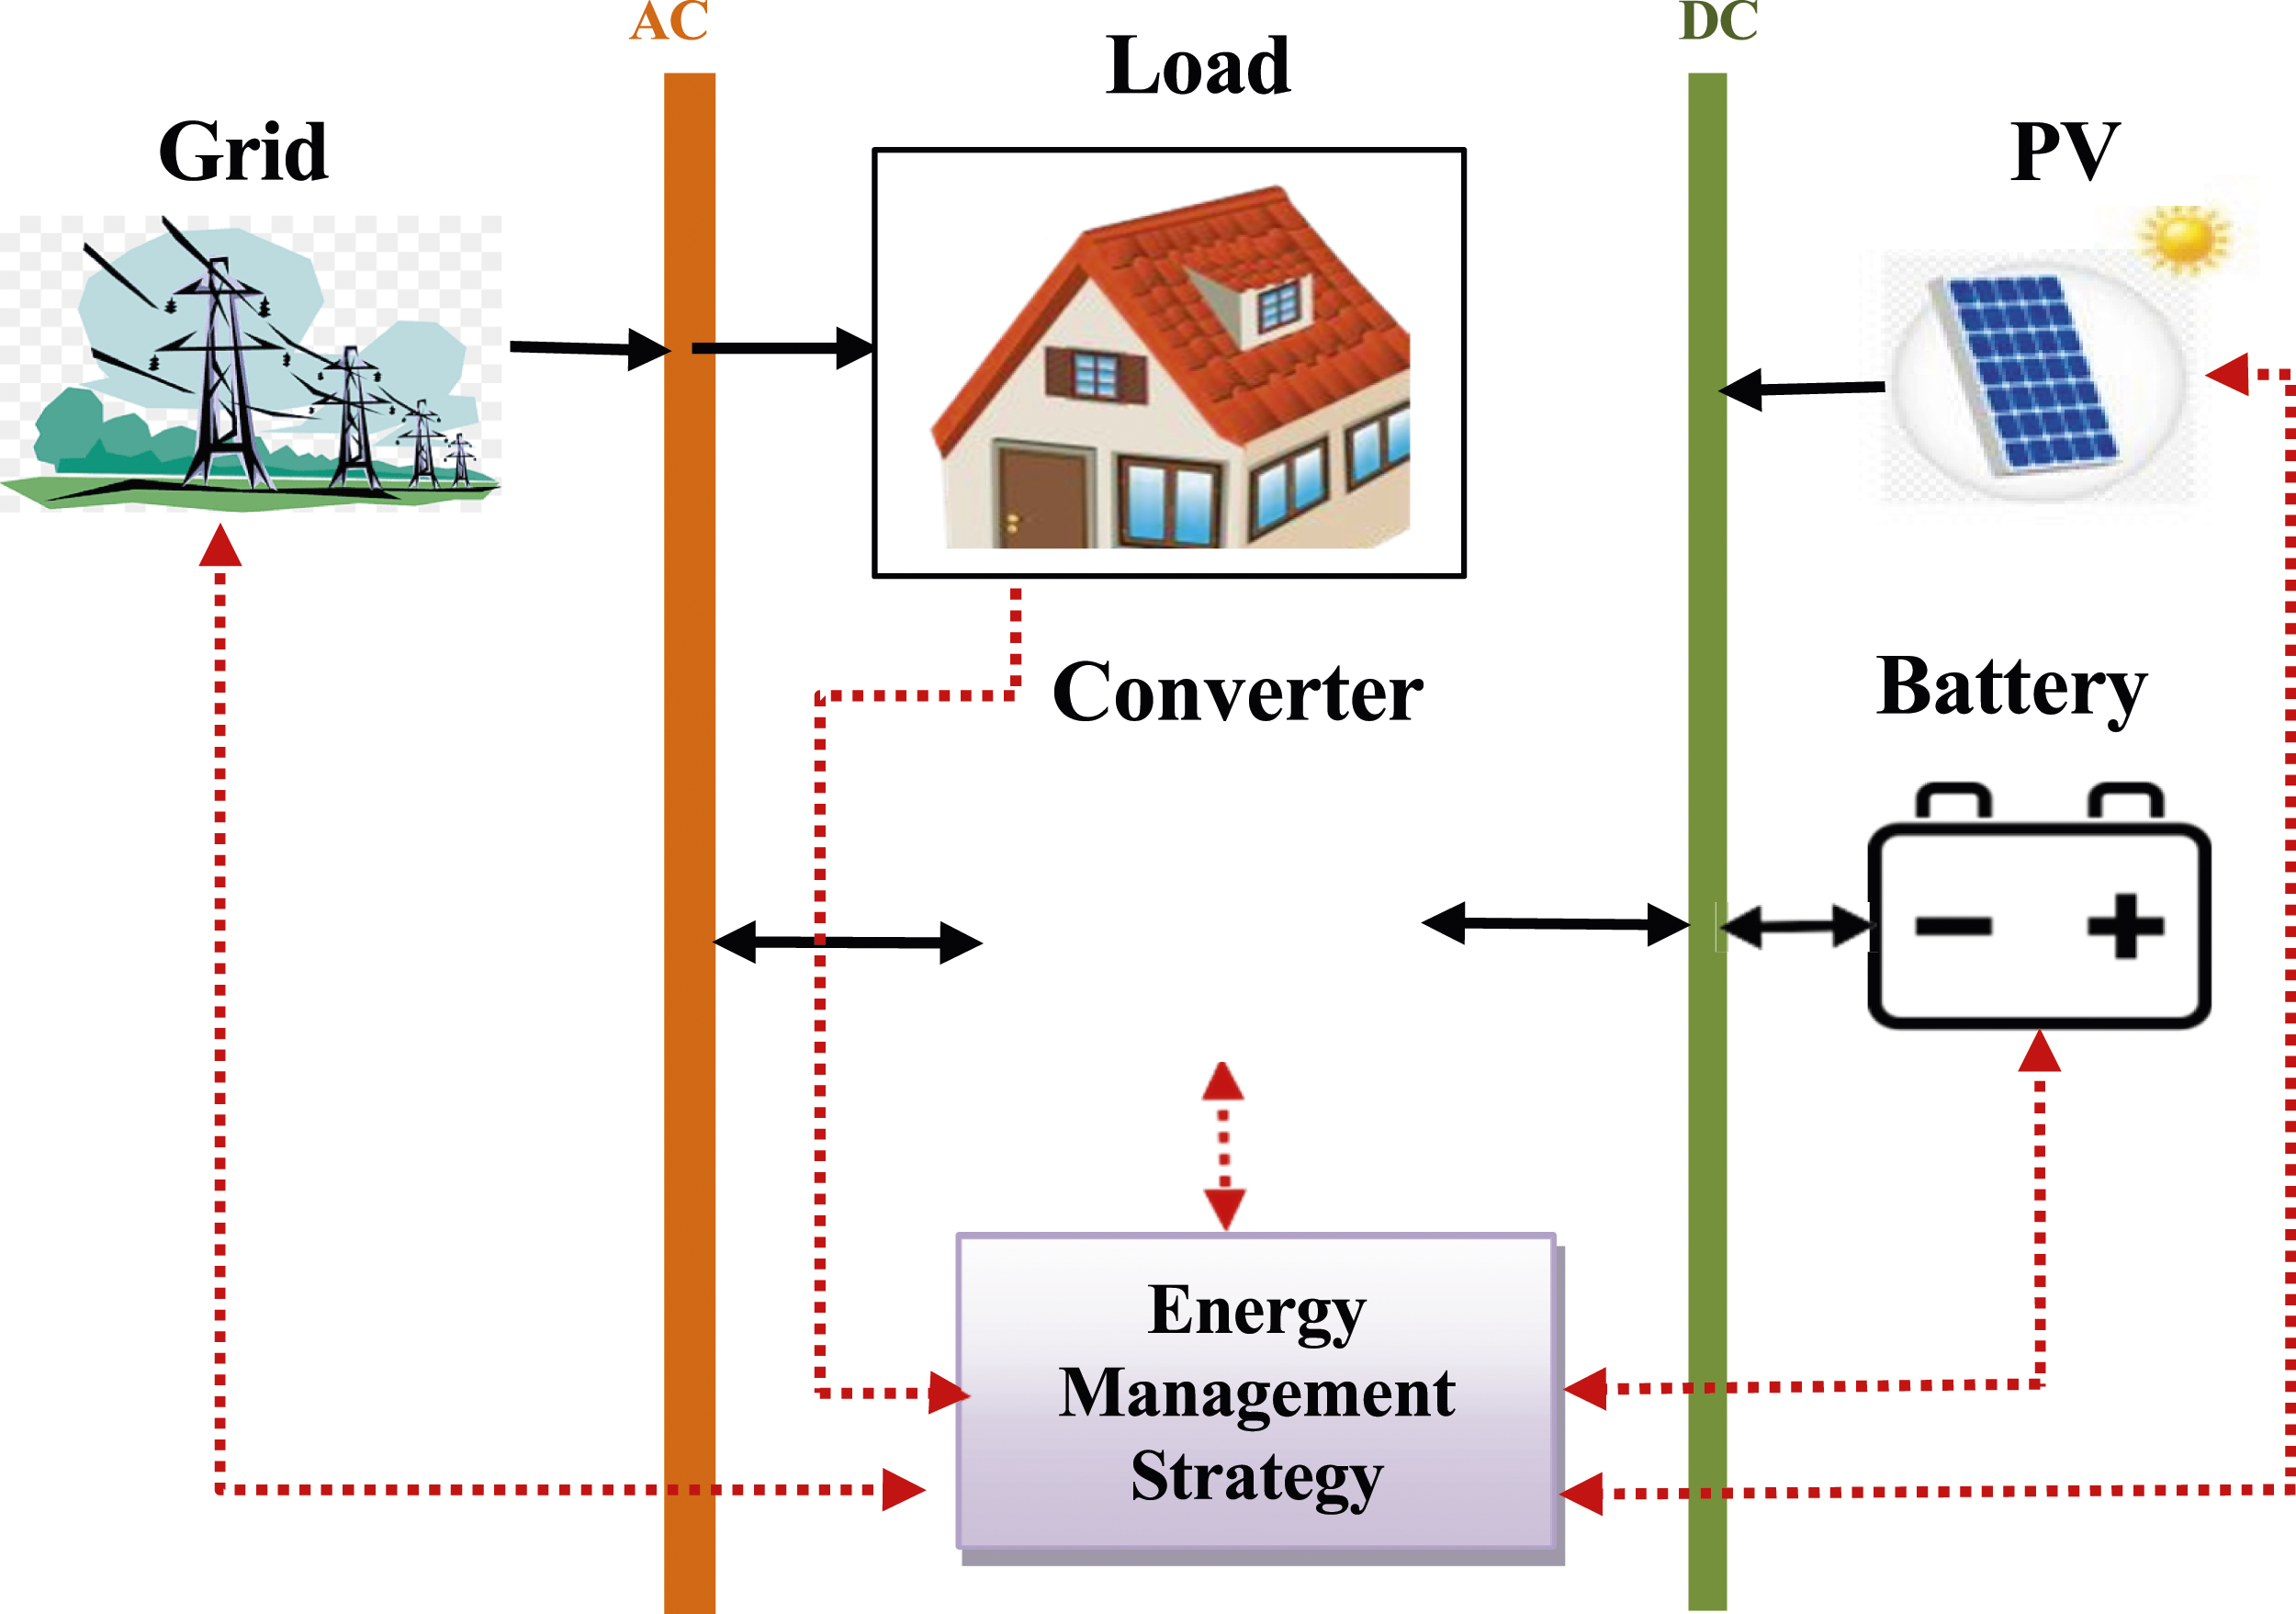
Electrical grid modelling
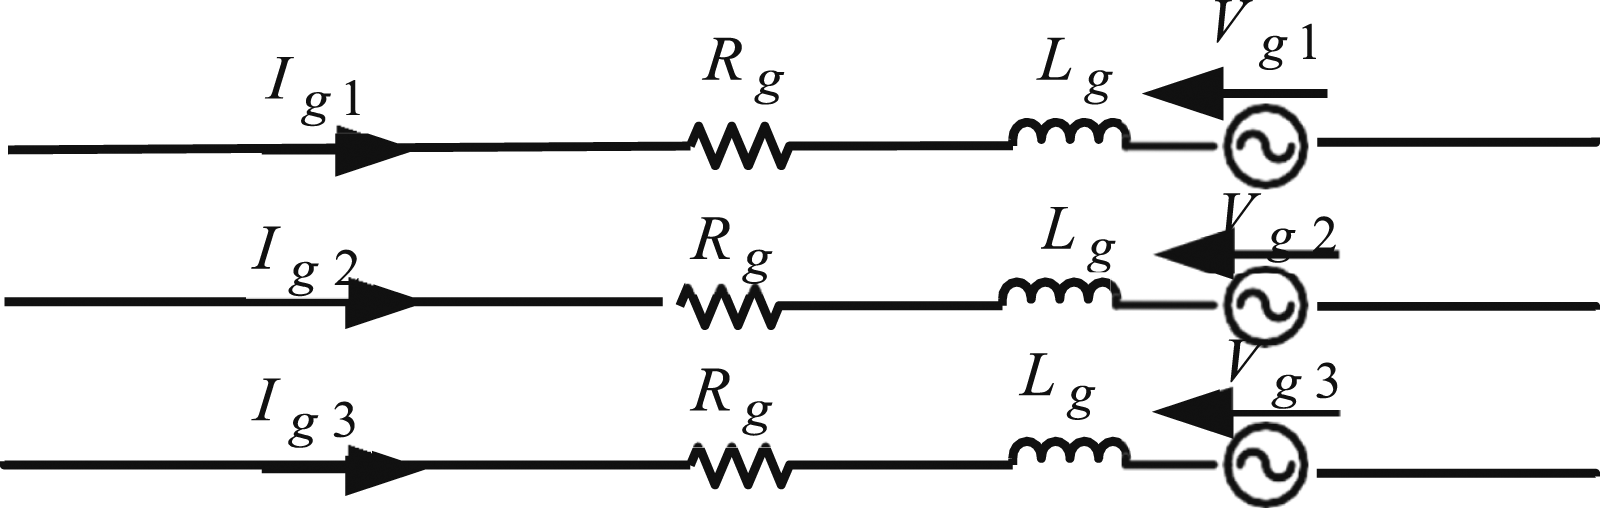
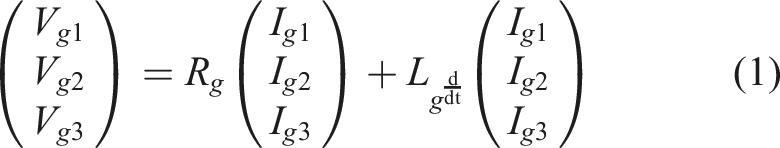
The electrical grid is given in Figure 2. Its modelling can be expressed as follows (Toumi et al., 2020) • V
g123
: the grid line voltages. • I
g123
: the grid line currents. • (R
g
, L
g
): the grid filter. Grid topology.
Battery modelling
The battery is adopted as an energy system storage to fill the consumption gap created when the PVP’s energy generation is lacking. Its modelling can be given as follows (Amara et al., 2022; Chokri et al., 2015): • C
Bat
: the battery capacity (Ah). • E
L
: the energy load. • V
Bat
, IBat, R
Bat
: the battery voltage (V), current (A), and resistor (Ω), respectively. • D
aut
: the number of autonomy days. • E
D
: the electricity consumption per day (Wh). • η
Bat
: the energy efficiency of the battery. • DOD
max
: the maximum depth of discharge of the battery (80%).


Photovoltaic panel modelling
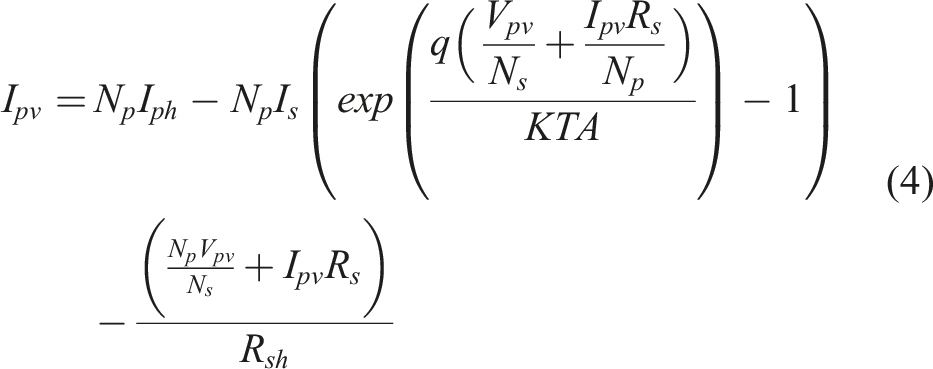
The modelling of a photovoltaic panel is giving by the following equation (Amara et al., 2021; Geleta et al., 2020). • I
pv
, Vpv: the PVP Current and voltage, respectively. • I
s
: the saturation current. • I
ph
: the photo-current. • K: the Boltzmann constant. • q: the electron charge. • N
p
, N
s
: the number of cells in parallel and in series, respectively • R
s
, R
sh
: the series resistance and the shunt resistance, respectively.
Smart grid optimisation
Smart grid optimization steps are summarized in Figure 3. Different steps of optimisation.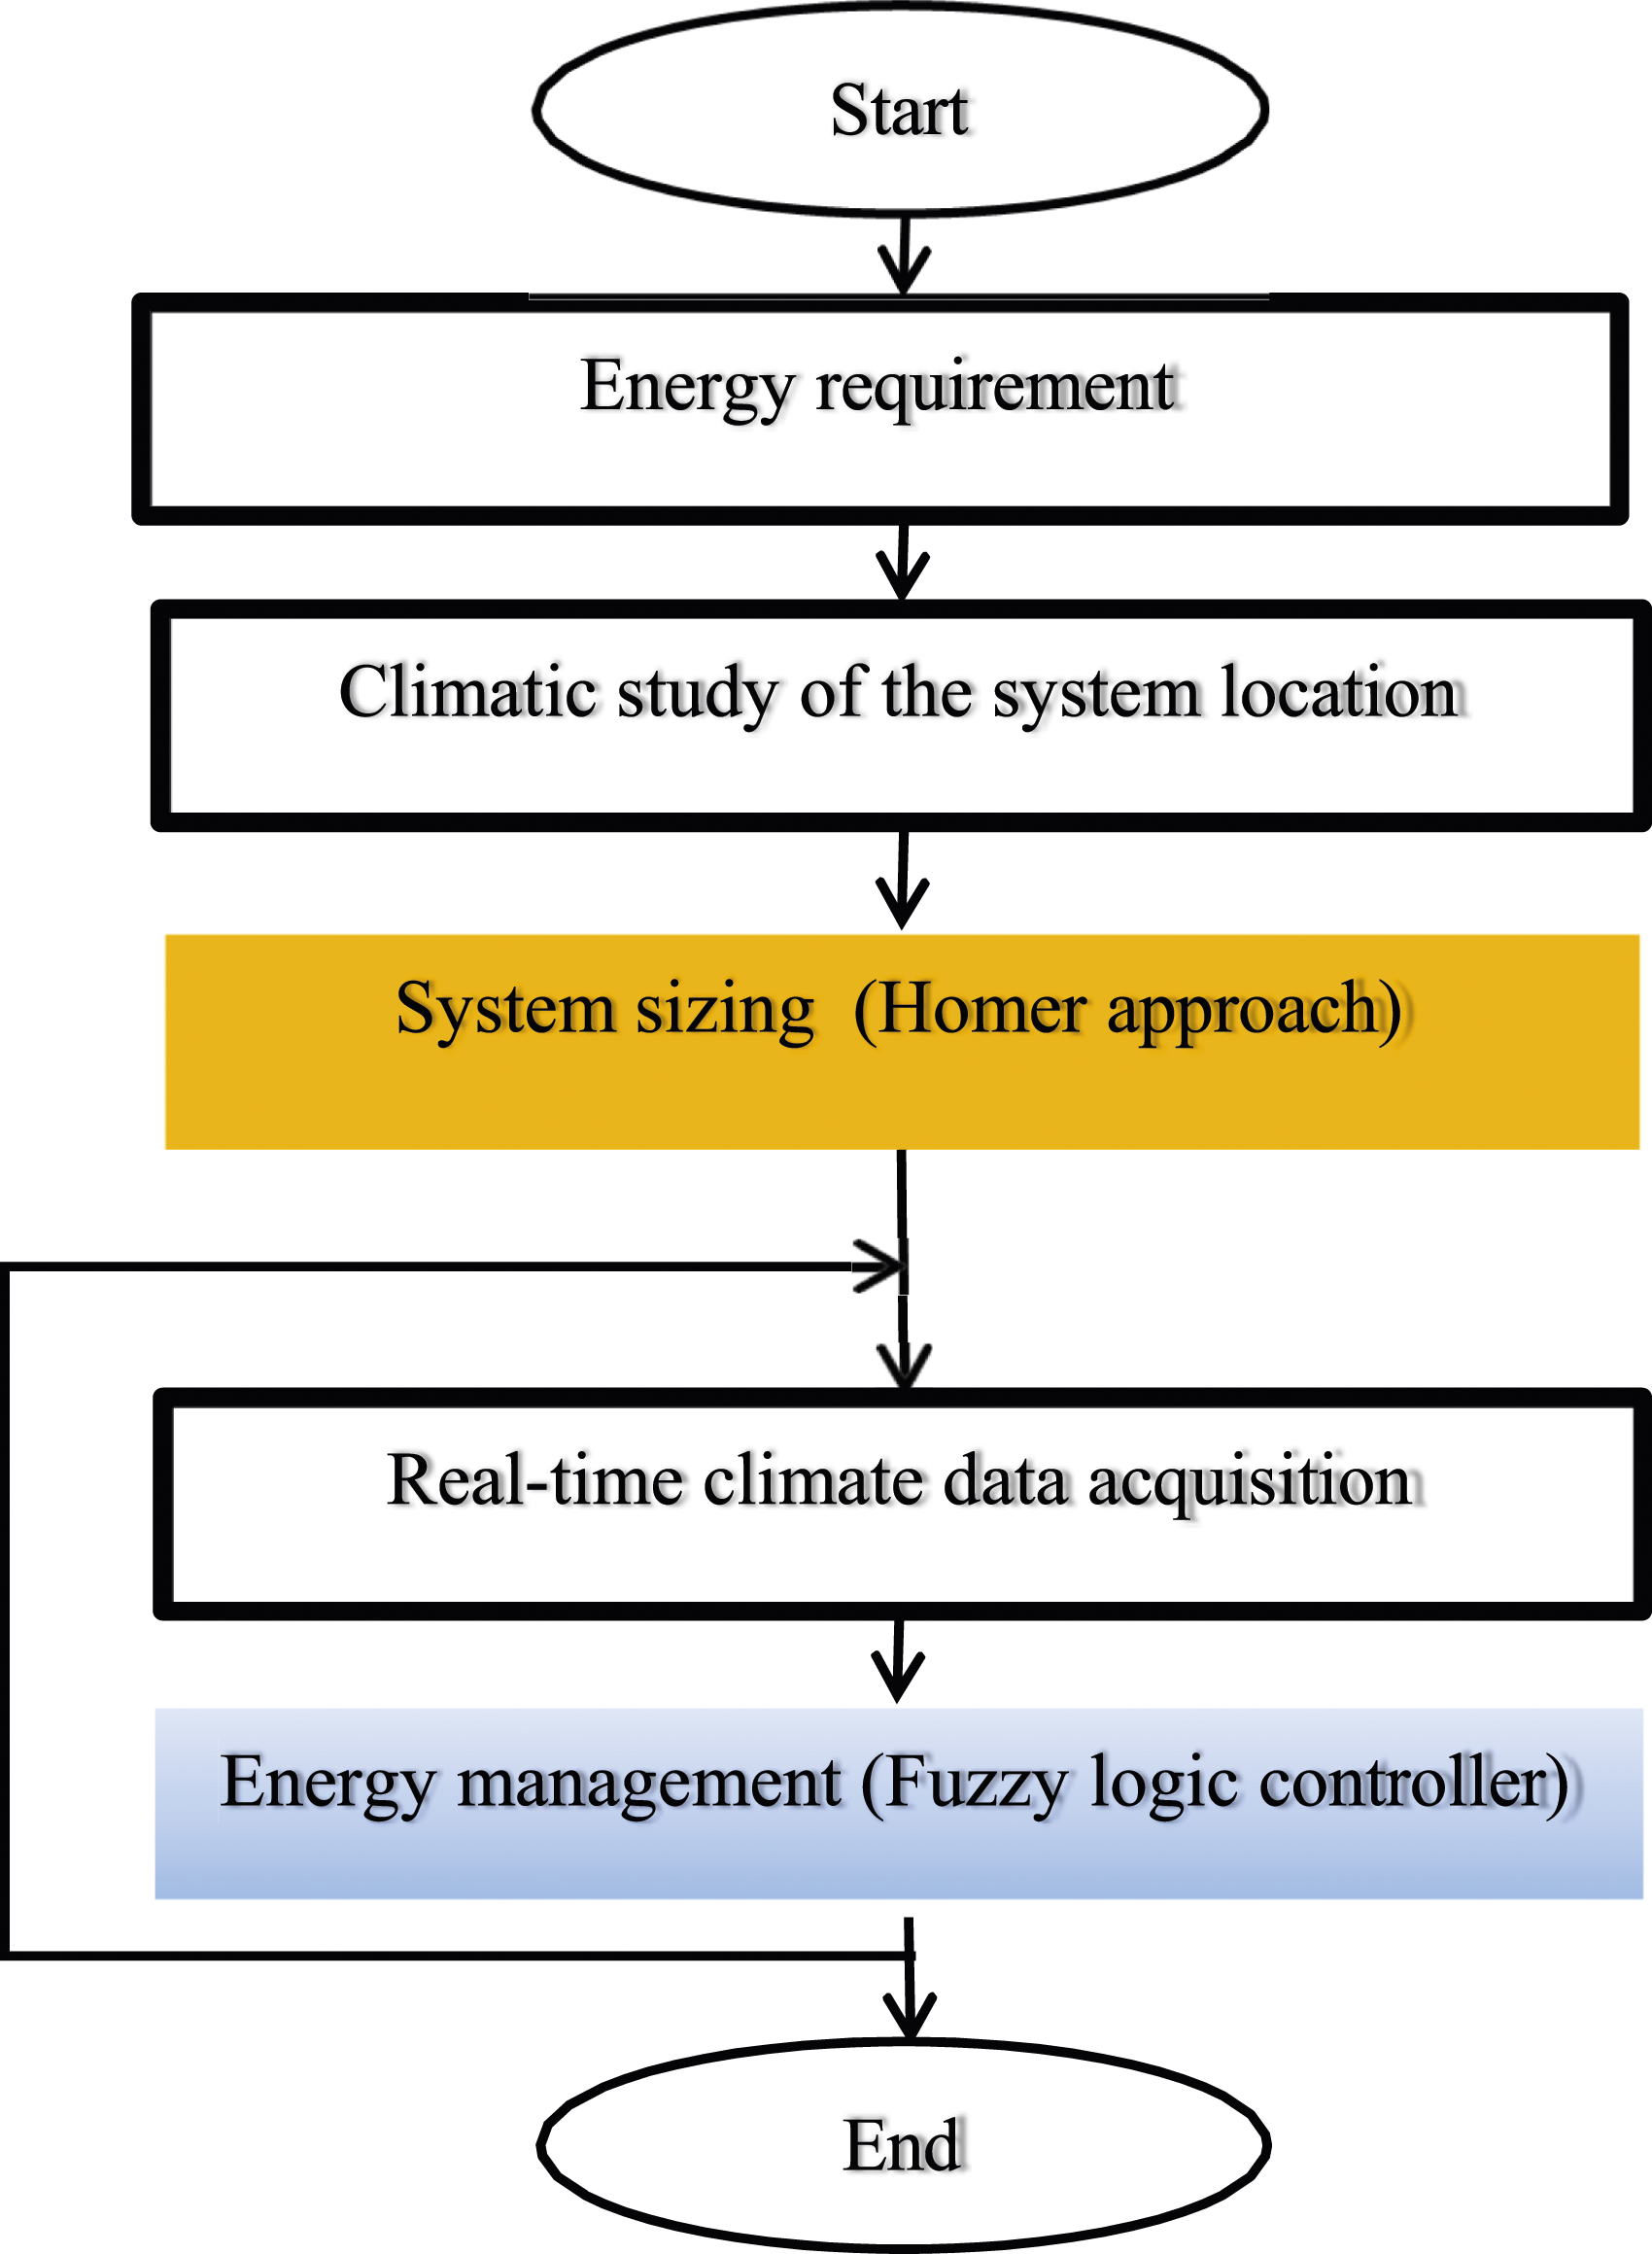
The optimization process can be described according two important steps: • Before setting up the system, a sizing step is necessary: This is the first step where the design and size of the system are established according to the precise objectives and established constraints. Modeling, simulation, and analysis of potential system performance are typically required during this step. The objective is to define the optimal parameters of the system before implementing it. • Stage of management and verification of the proper functioning of the system after its implementation: After installation of the system, this stage involves monitoring its operation in real time, collecting information on its real performance and adjusting the parameters if necessary in order to improve its effectiveness. Methods such as closed-loop control, real-time data analysis and continuous optimization can be used to ensure optimal system operation under varying conditions.
In the combination of these two steps, it is possible to ensure that the system is optimally designed from the start and that it continues to function efficiently throughout its operation.
Smart grid optimal sizing
The proposed technique to optimal dimension is centralized on the HOMER software thanks to its simplicity, effectiveness, and high precision. The main objective is to study the two configurations already mentioned in order to determine the most cost-effective one.
HOMER software description
The HOMER (Hybrid Optimization of Multiple Energy Resources) software tool is used to improve the design of microgrids. The different steps of sizing a renewable energy installation are summarized in Figure 4: Different steps of sizing.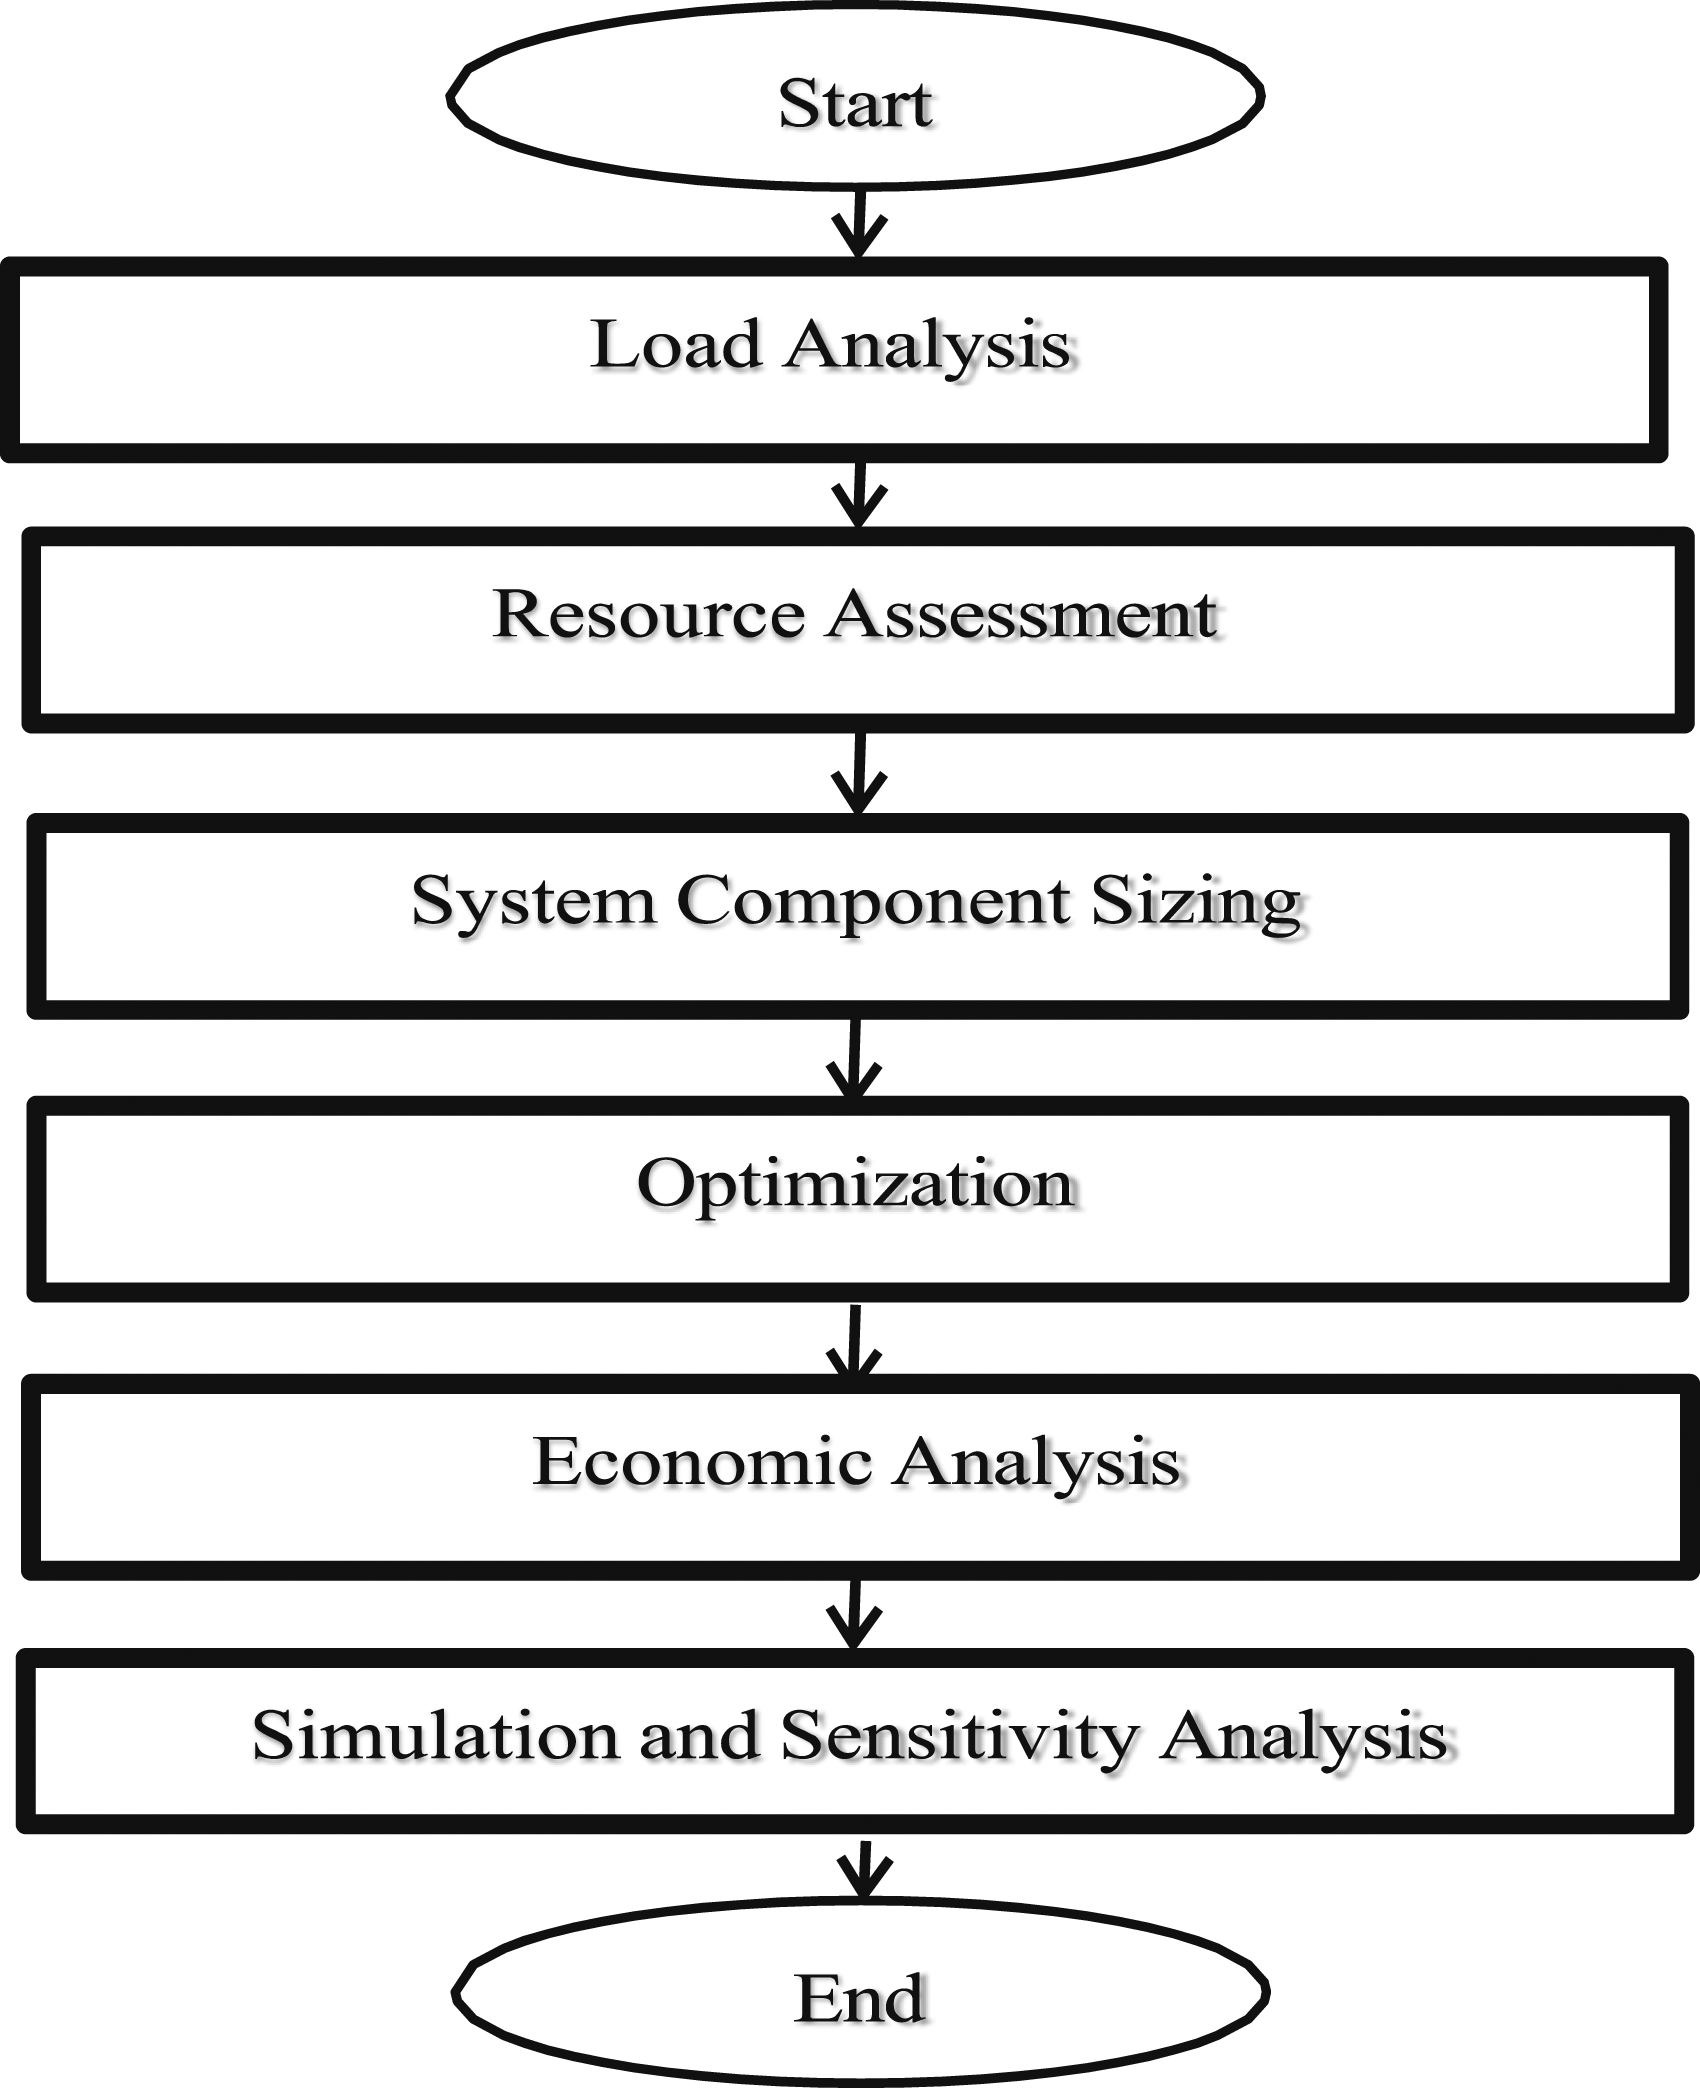
The HOMER software function is based on five steps as follow (Jayachandran and Ravi, 2019): • Step 1 (Load study): Consists of examining the energy demand or load that the system is expected to meet. Total energy requirements over a period of time can be measured using load analysis, which is typically expressed in kW hours (kWh) or MW hours (MWh). • Step 2 (Resource Assessment): This step involves analyzing the various renewable energy resources available at the site, such as solar radiation, wind speed, and so on. It is essential to take this information into account in order to define the potential renewable energy production capacity of the system. • Step 3 (Calculation of system sources): Based on the load analysis and resource assessment, the system elements (such as solar panels, wind turbines, batteries, etc.) are set up in a manner reliable to meet energy demand. • Step 4 (Optimization): Optimization methods are frequently employed to determine the most cost-effective configuration of system elements while satisfying energy demand and taking into consideration other constraints such as system reliability, available space, budget, etc. • Step 5 (Simulation and sensitivity analysis): Once a system configuration is established, it is essential to simulate its performance over time to assess its quality and resilience in various situations. The sensitivity study provides an understanding of the impact of variations in input parameters (such as energy prices, component costs, etc.) on system economics and performance.
HOMER software economic criteria
As economic criteria, the Net Present Cost (NPC) and the Cost of Energy (COE) are used.
Net present cost
The NPC, expressed as follows, is defined by the component overall expenses during its entire lifespan (Lau et al., 2018)

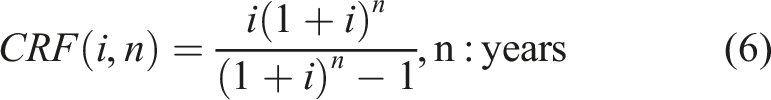
Cost of energy
The COE, given as follows, is defined by the estimated price per kW hour (kWh) of the system produced electricity (Lau et al., 2018). • 𝐸𝑡𝑜𝑡: the annual quantity of electricity transported to the grid (kWh/year).

Sizing simulation results
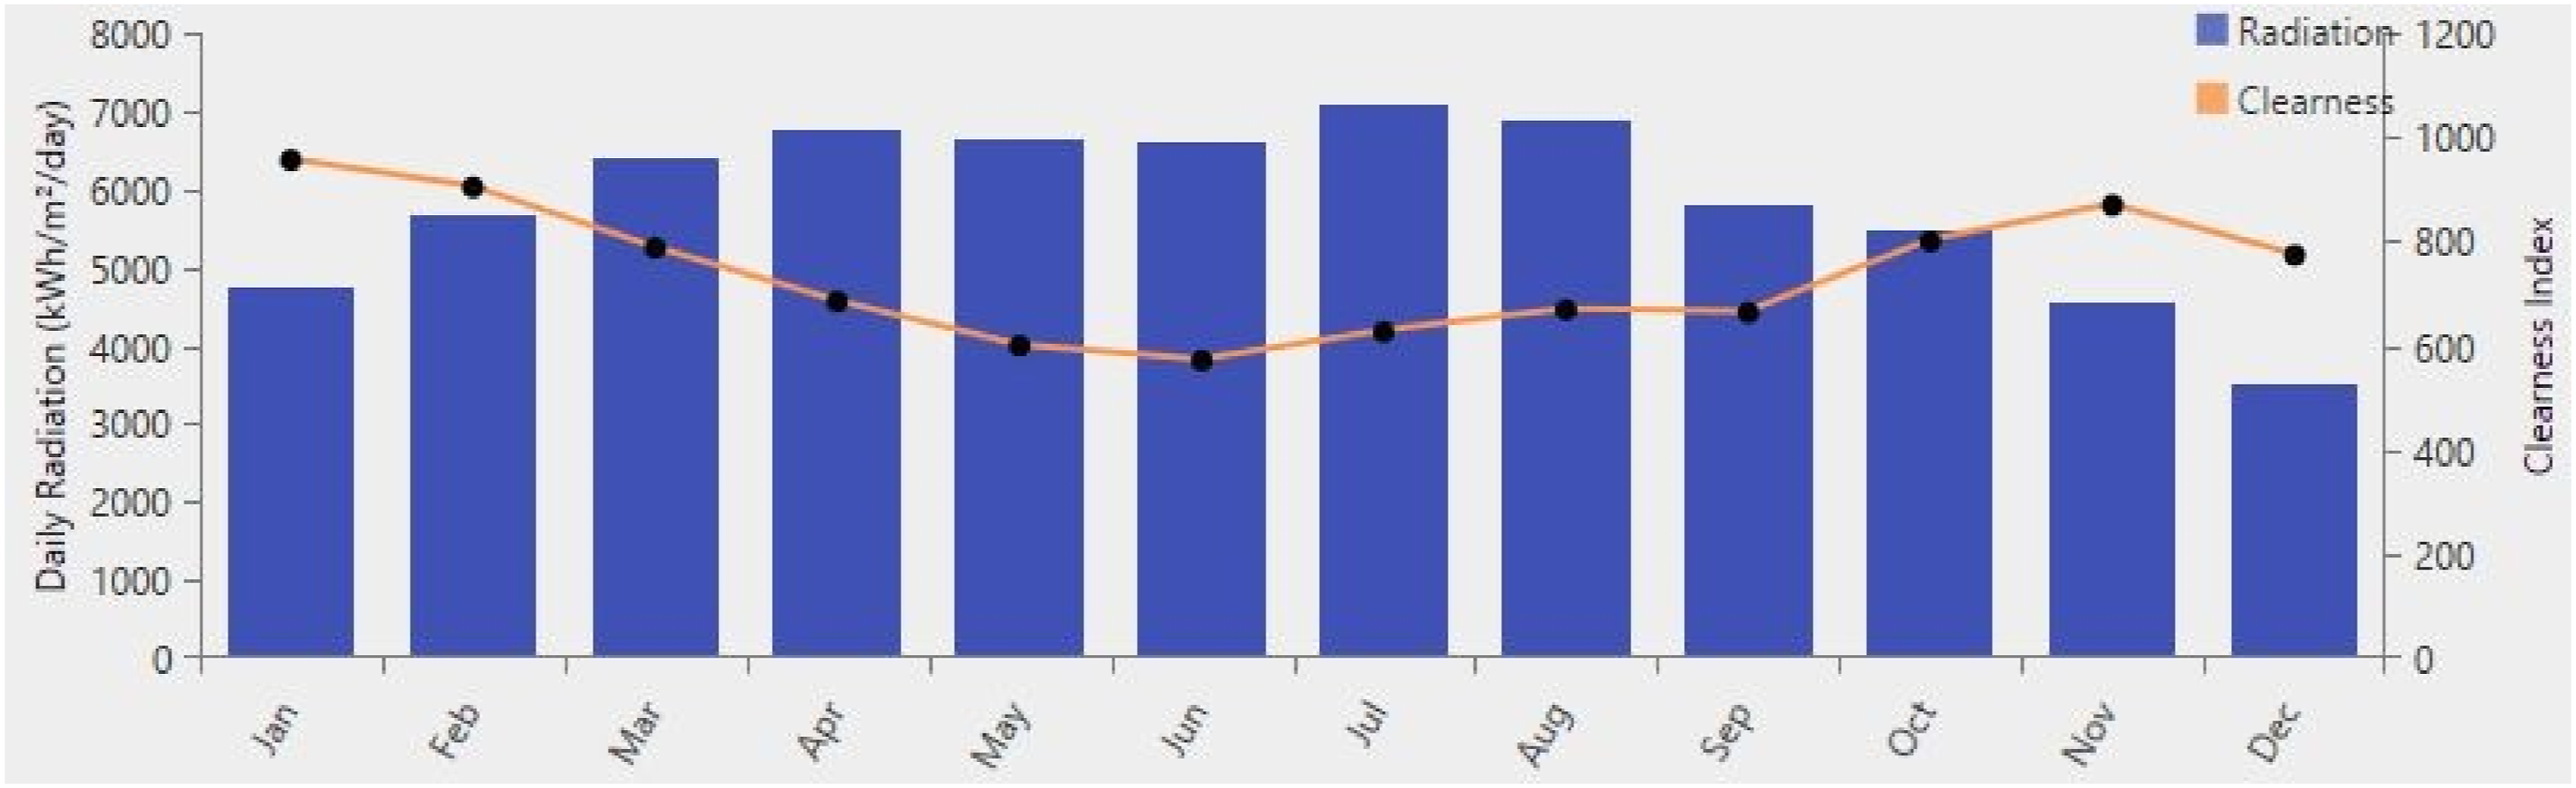
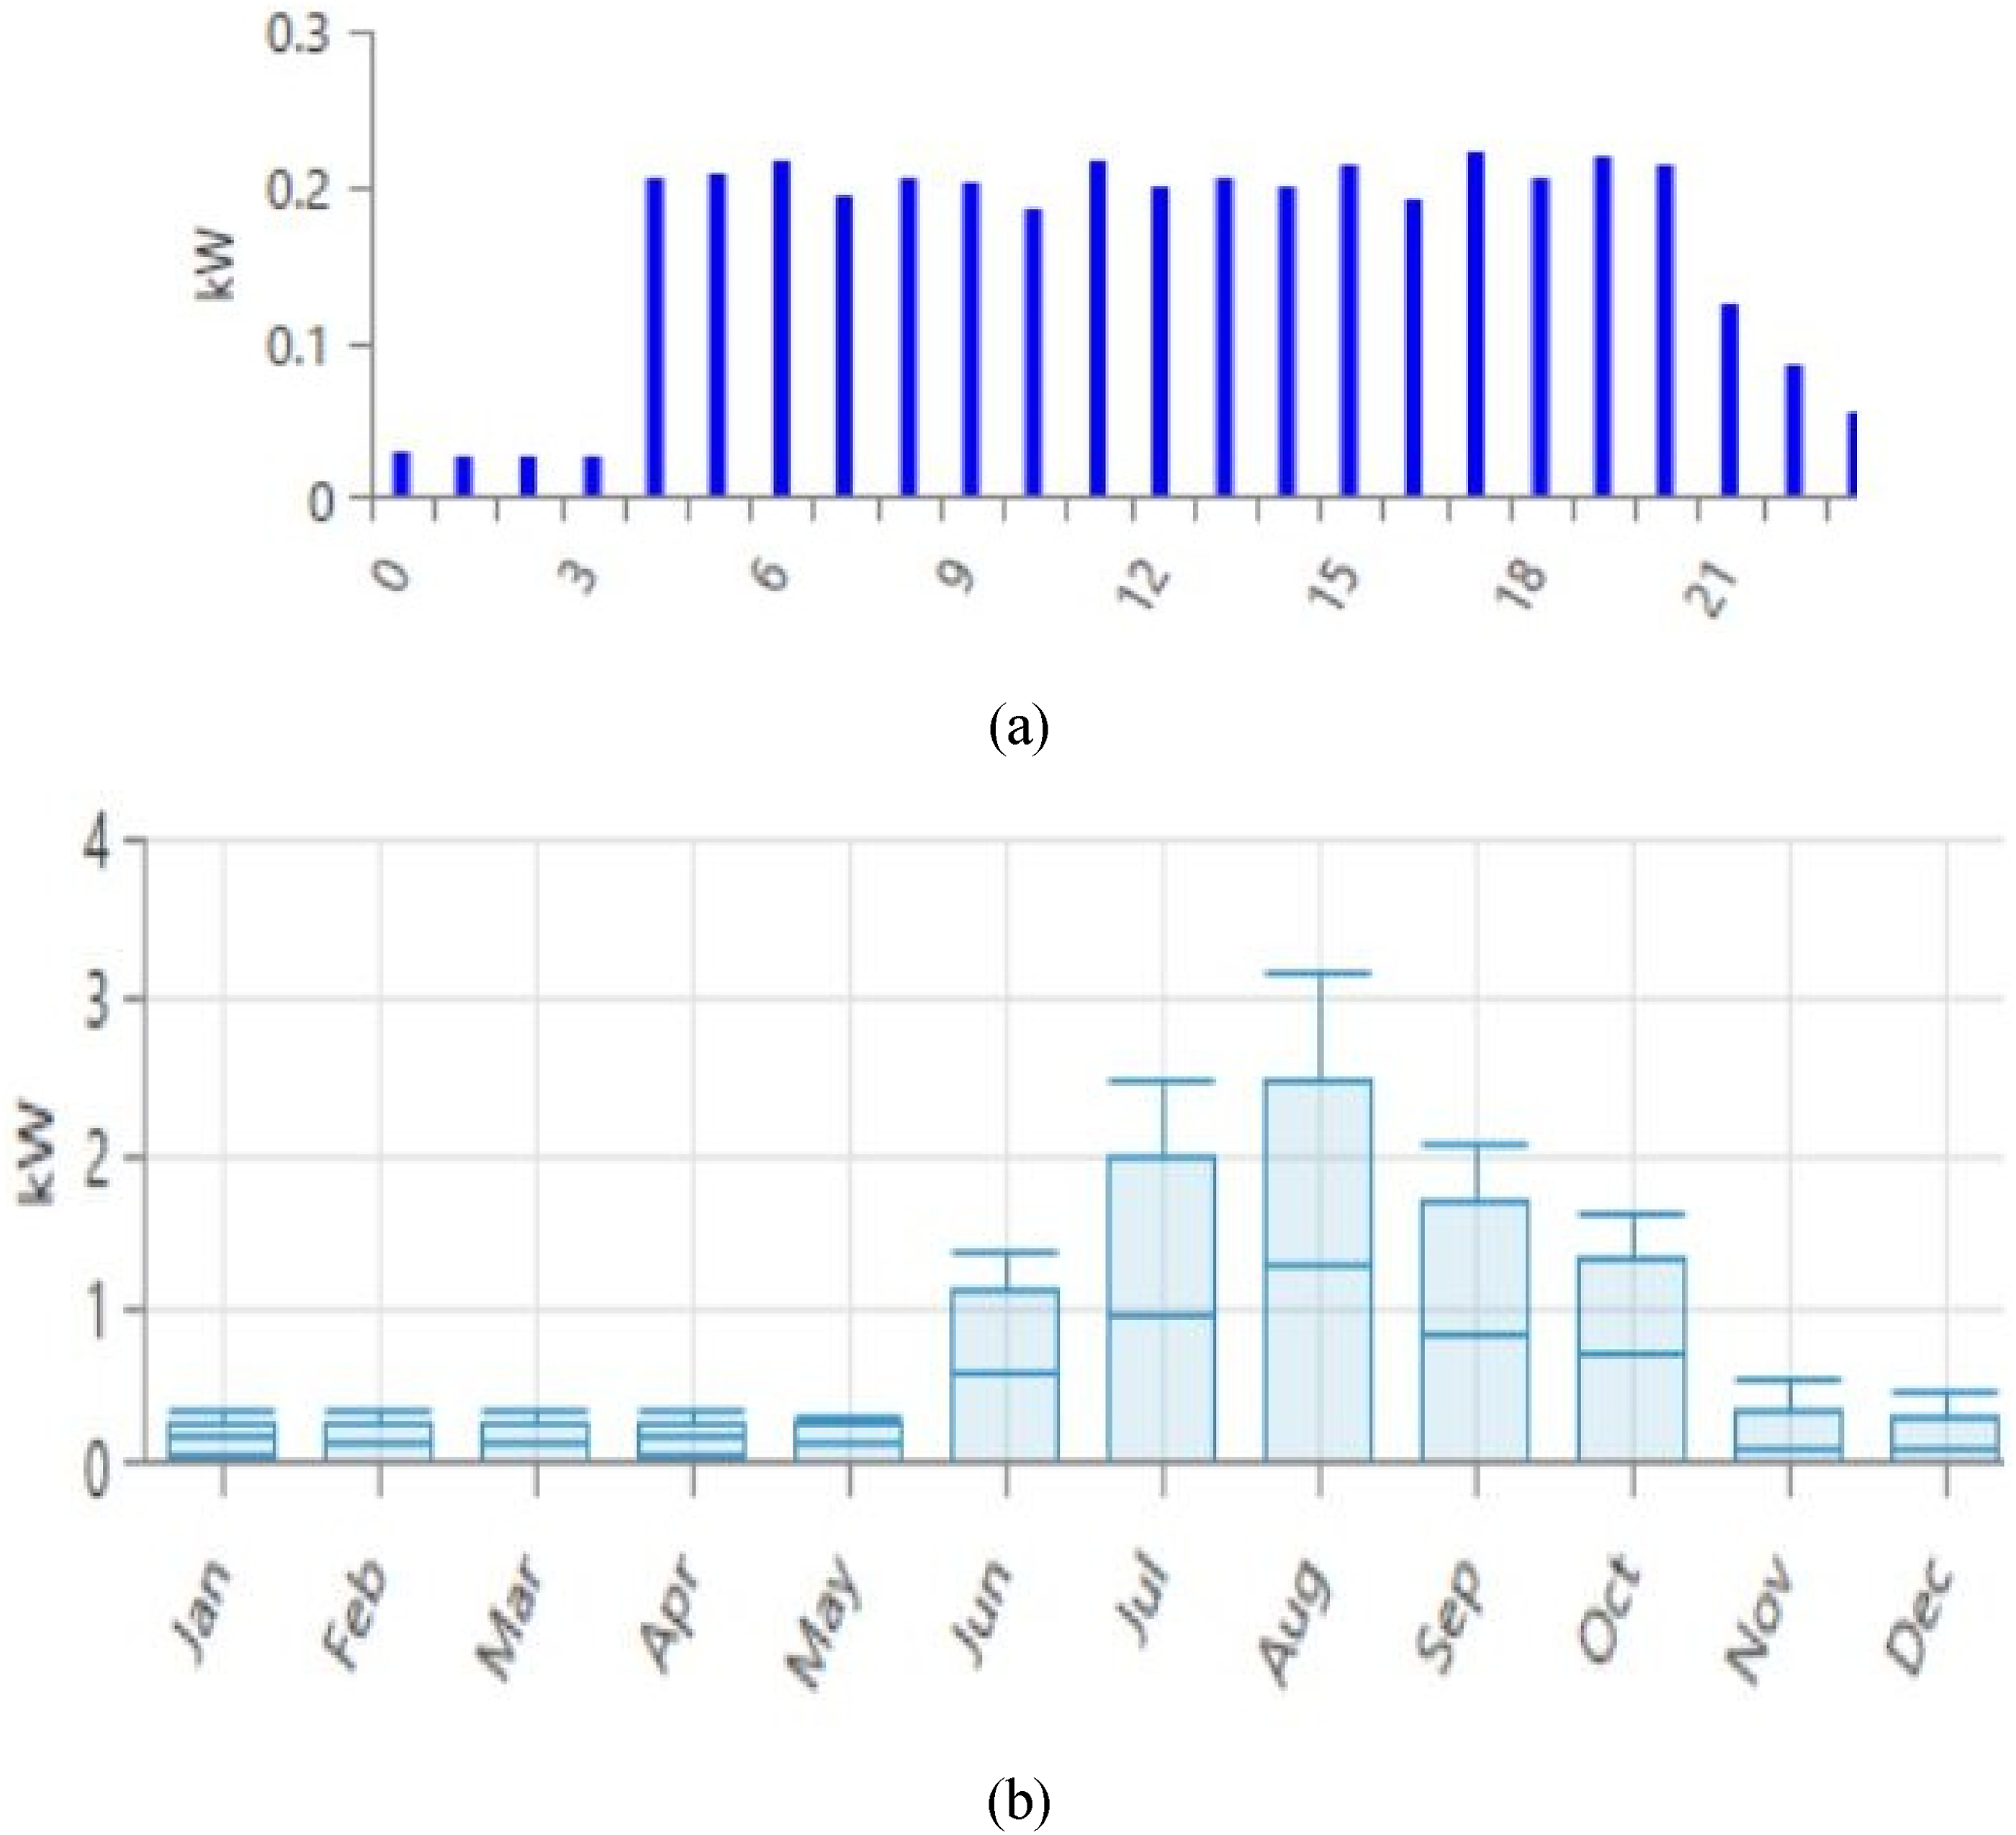
The studied smart grid simulation is carried out using real weather data of the city of Sousse in Tunisia. Indeed, Sousse is a sizeable city of around 173,000 inhabitants, about 140 km south of Tunisia’s capital city, Tunis. It is located on the coast in the central east of the country. As shown in Figure 5, Sousse is positioned at longitude 10°6.0′E (East) and latitude 35°82′.4 (North). Figure 6 presents the monthly solar radiation and clearness index of the city of Sousse. In fact, the highest value of the solar radiation is observed on July with 7000 kWh/m2/day. The daily and the load demand is illustrated in Figure 7. It proves that the consumption of energy is highest during working hours (between 6:00 and 18:00). Also, August is the month with the highest consumption (3.169 kW). Tunisia solar radiation (Rekik and El Alimi, 2023). Sousse’s monthly solar radiation and clearness index. (a) Daily load demand, (b) monthly load demand.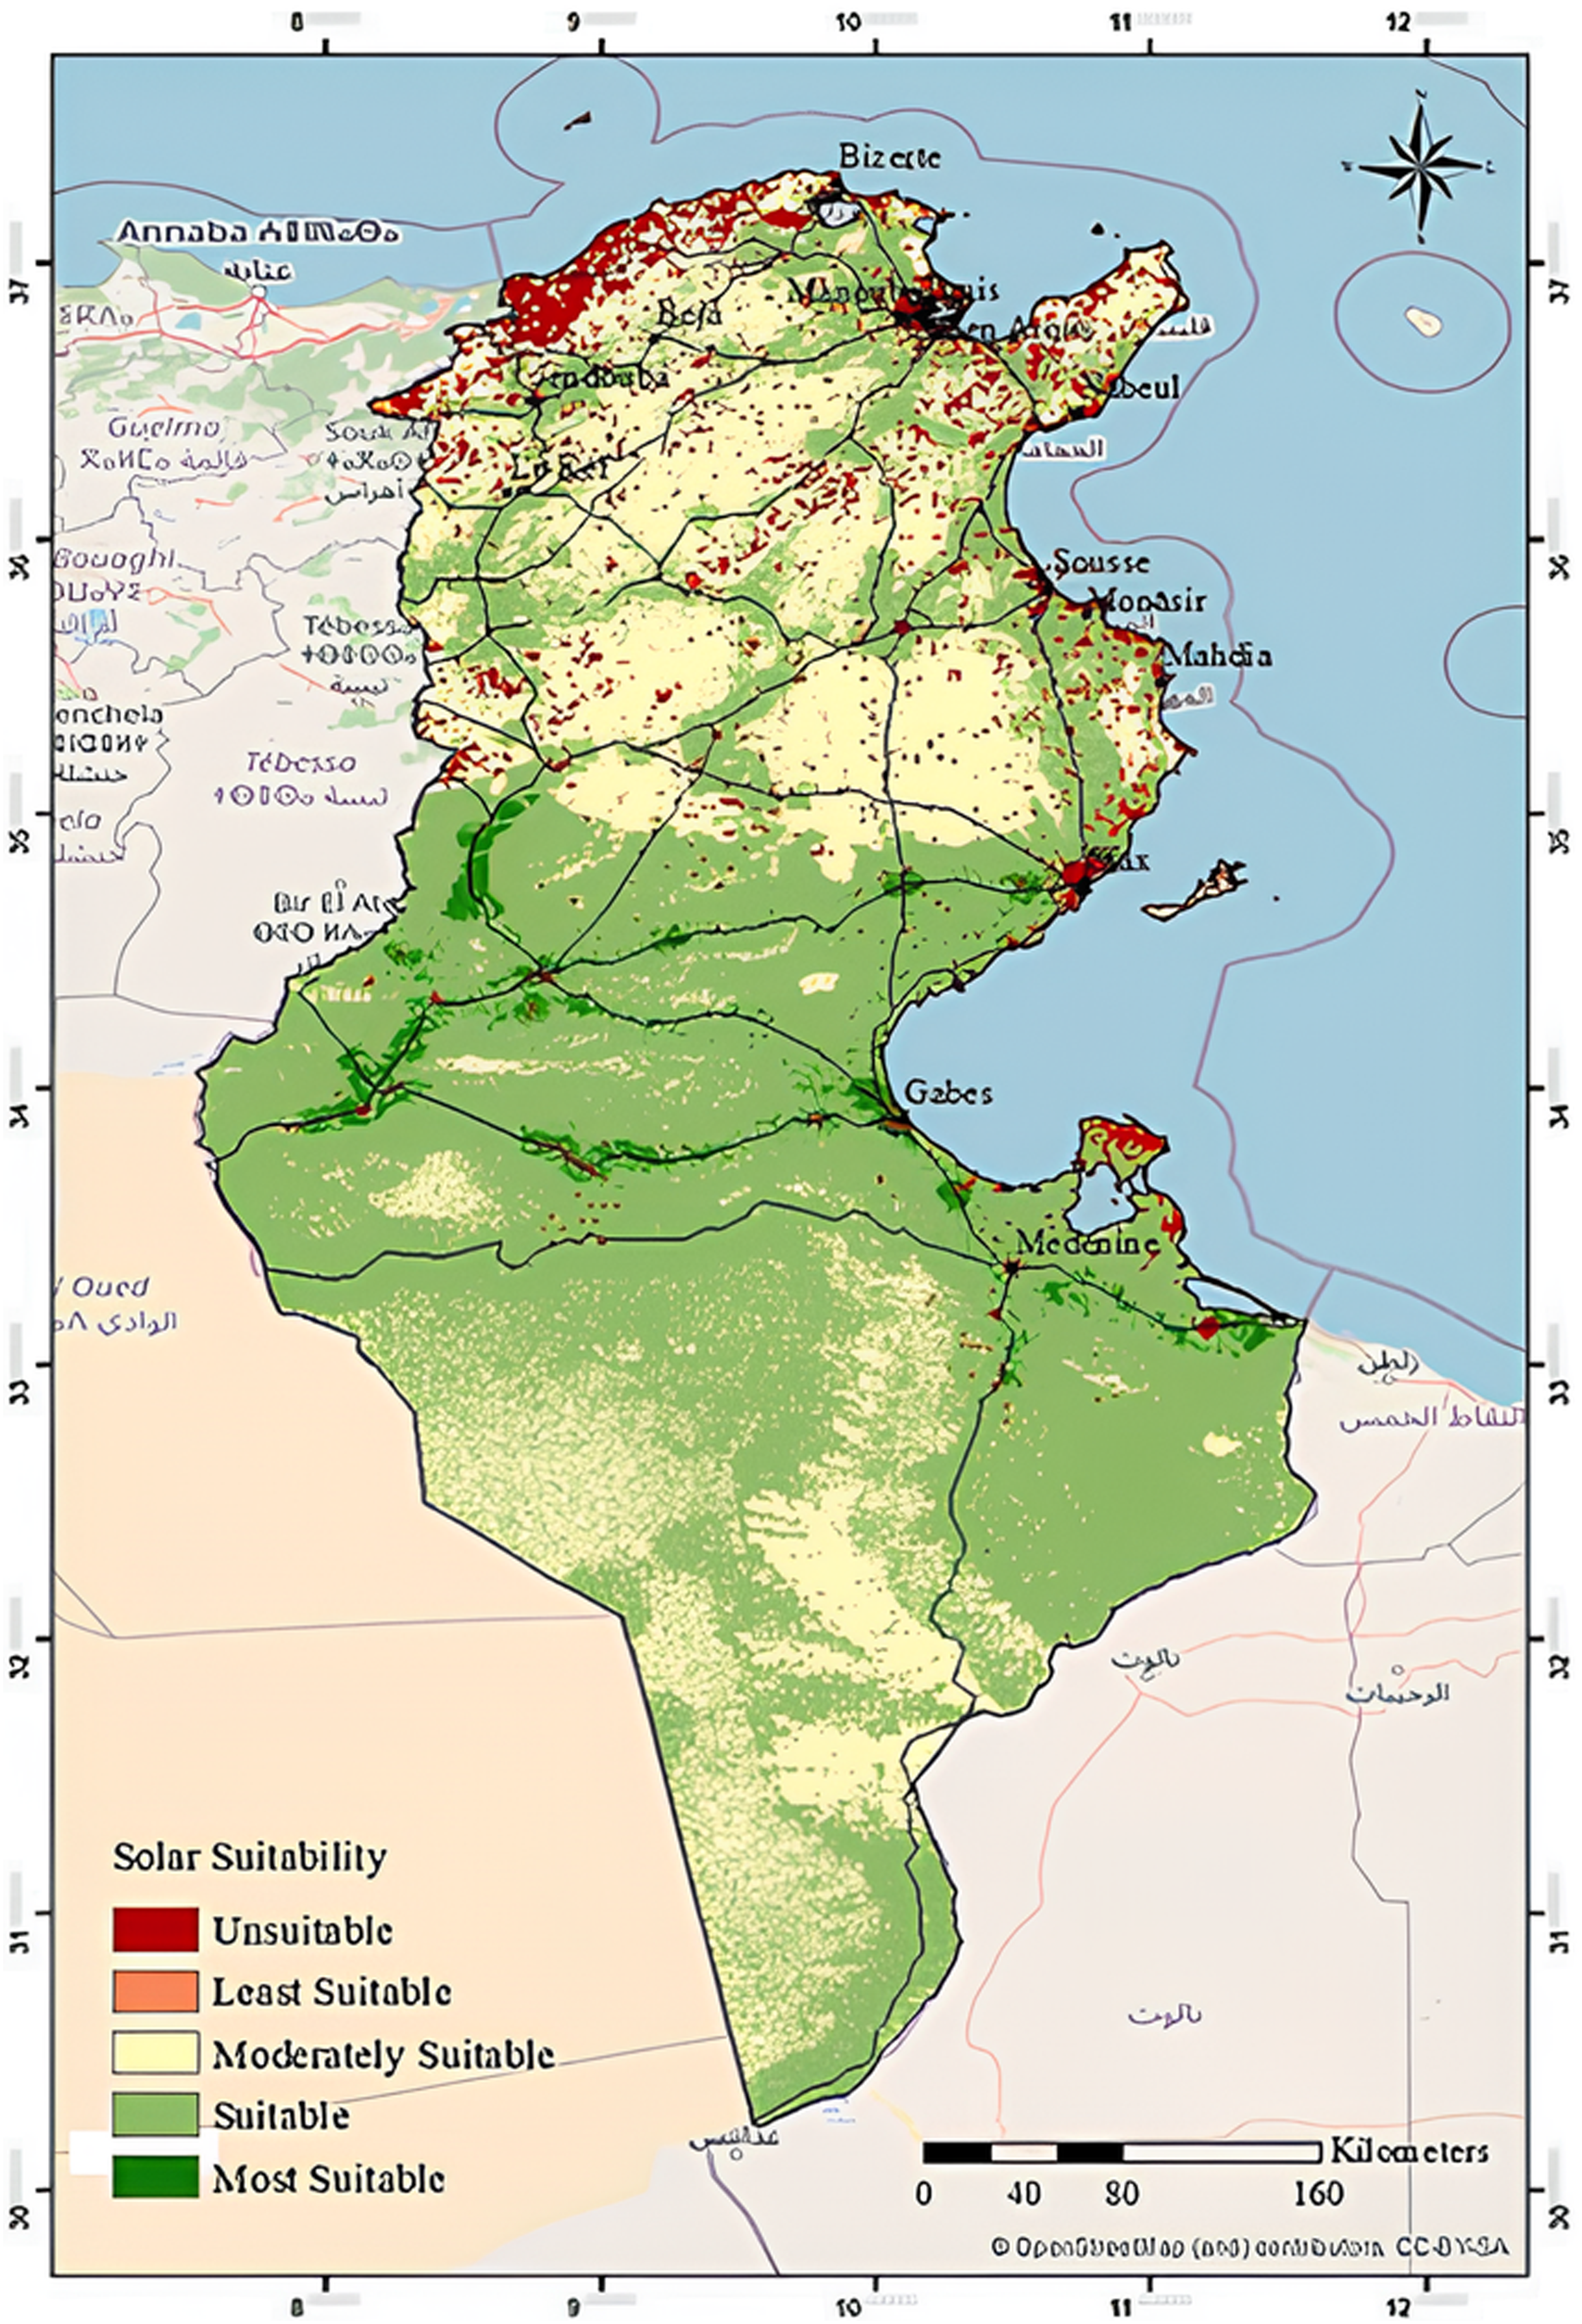
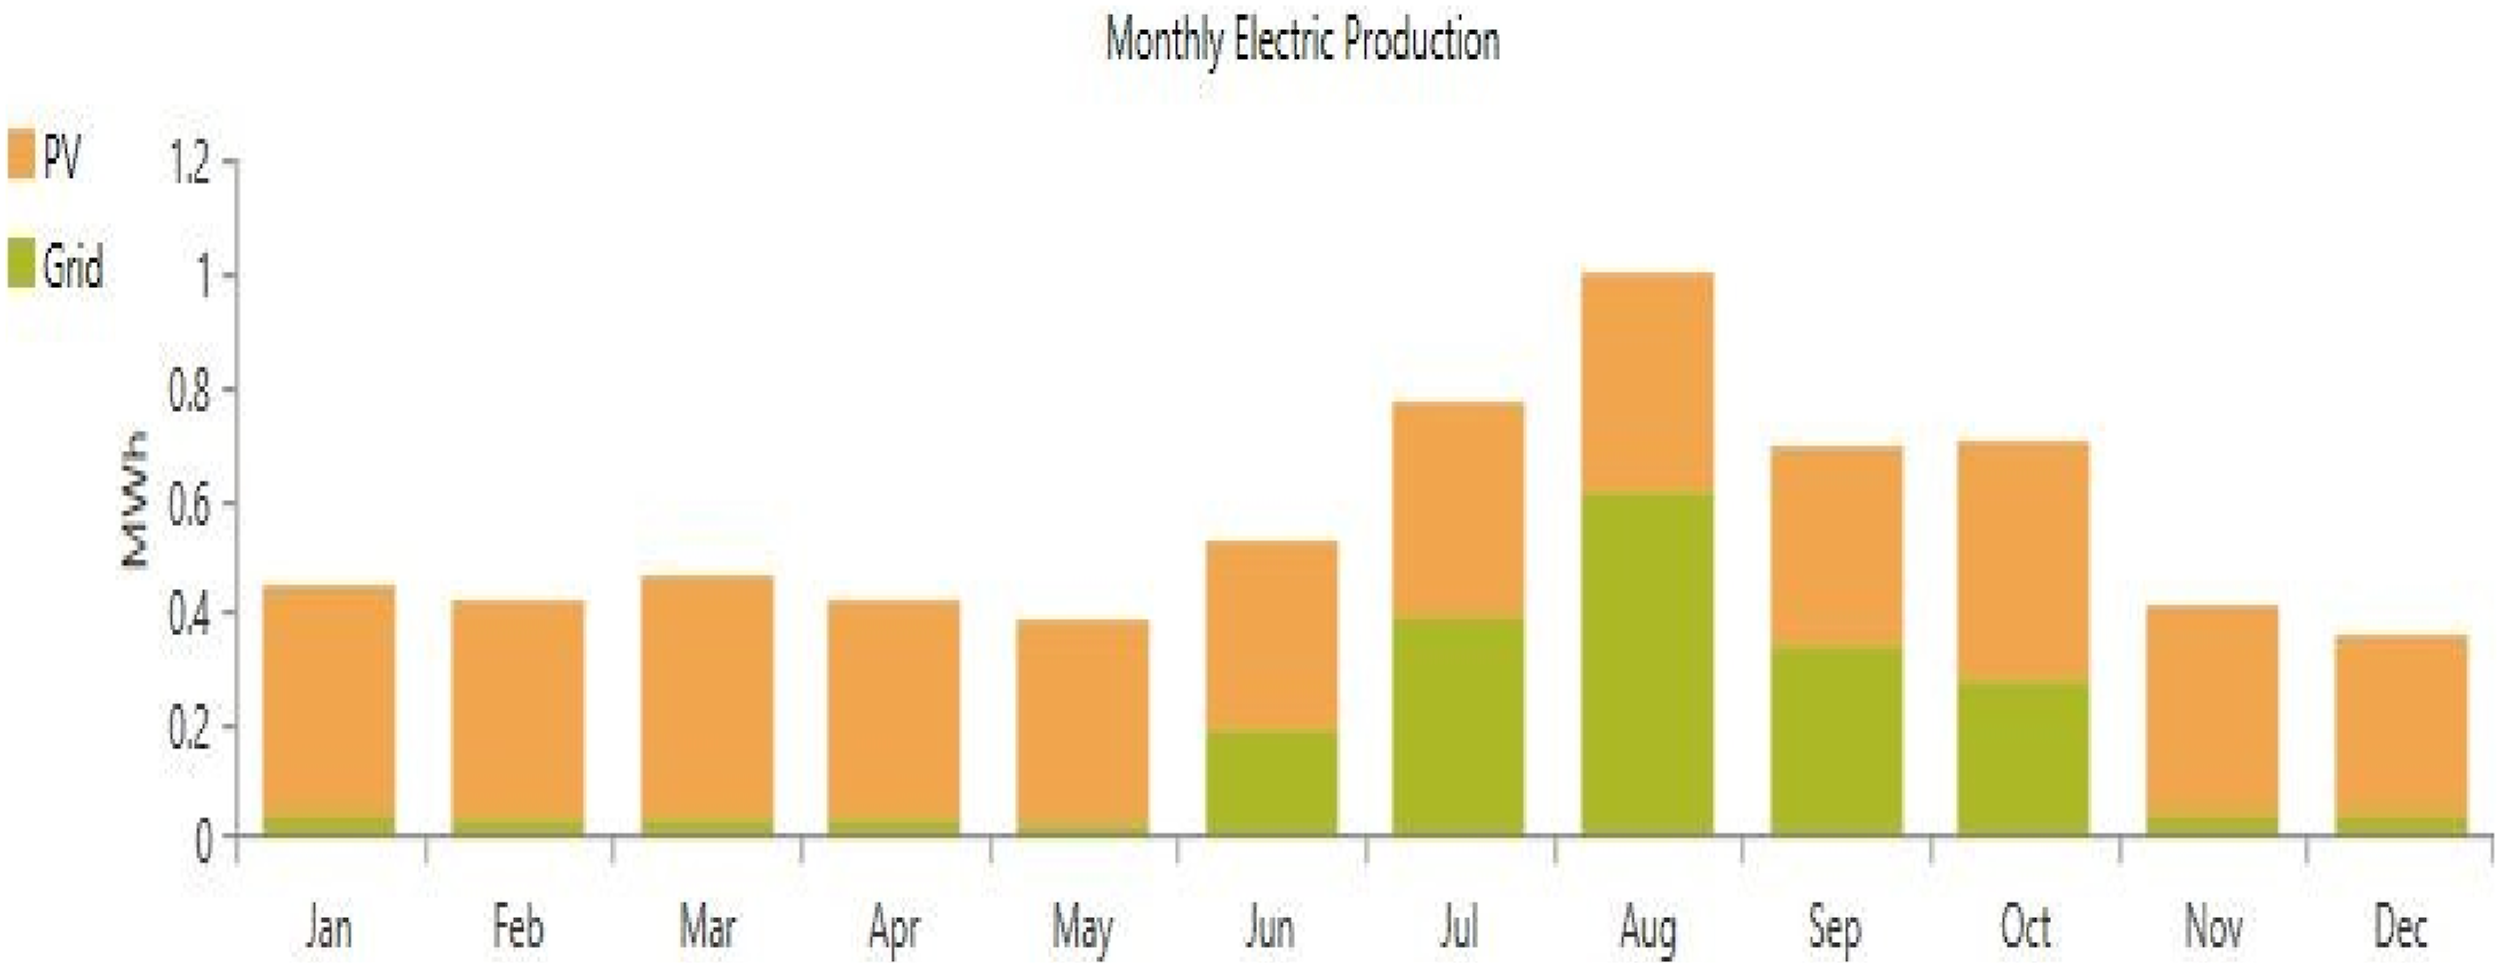
The proposed system components (grid, PVP, and battery) parameters are mentioned in the Appendix. The HOMER software is used for the system sizing. Figures 8 and 9 and Table 1 present all the possible configurations sizing. It is clearly seen that (Grid-PVP-battery (case (1)) is the most cost-effective configuration (NPC = 10,640.65 MDT, EC = 0.1357 DT). In contrast, without integrating the PVP, the NPC is high (14,479.91 in case (3) and 14,868.76 in case (4)). Furthermore, HOMER software allows the pollution reduction by minimizing the CO2 emissions (1319.73 kg/year in case (1)). Thus, the HOMER not only allows effective in optimal sizing but only in reducing environment pollution. Battery state of charge. Monthly grid power and PVP power. System optimal sizing.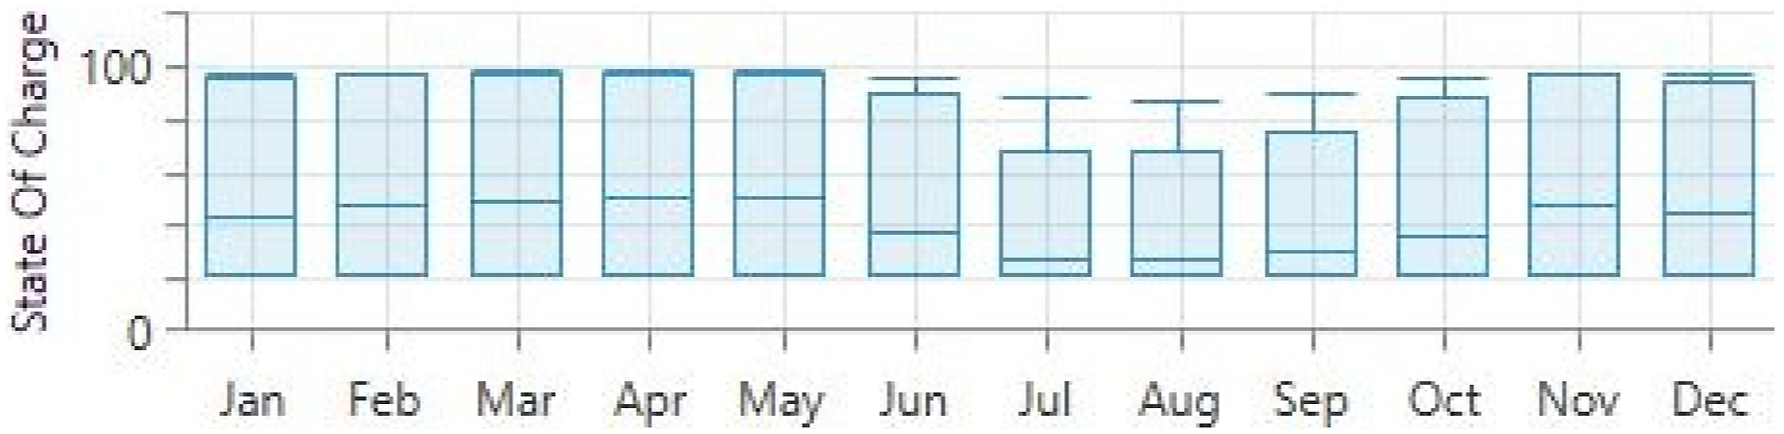
Energy management approaches
Electricity consumption has been increased as a result of population explosion in the majority of the world’s countries, and the great diversity of residential and industrial development. All around the world, there are several power stations and a vast network of transmission lines that serve numerous clients, but the scenario has become too large especially after the addition of photovoltaic and wind power supplies. Therefore, it is become important to increase the responsibility of users to stay current with load control trends thanks to the integration of a digital control enhancing the electric network.
The proposed control relies on fuzzy logic to create two energy management strategies in a house. The first one is founded on the installation of power storing elements and the second one by integrating a photovoltaic source. To determine an adequate management strategy, it is important to understand the system’s behavior according to the input data. Indeed, for a smart grid system, the real-time electricity price environment presents the most important data. The produced electricity can supply the consumer according to his requested amount of energy or also can be stored in the battery and reused later. In fact, the total cost of electricity can be reduced by recharging the battery from the electricity grid when the electricity price is low and using it during the period when the electricity price is high.
The two configurations of a smart grid have been given by Grid-Battery-Load and Grid- PVP-Battery-Load.
Grid-battery system
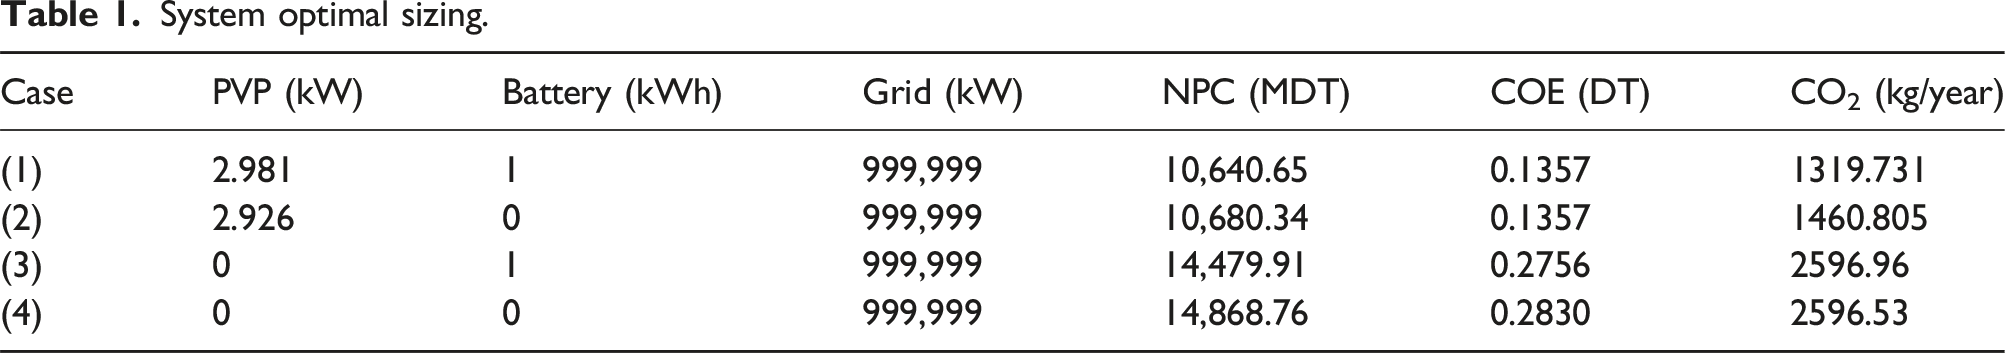
This combination is completed in a generic system design model for users with power storage services shown in Figure 10, which is constituted by an energy management system, a load, the electrical network and a battery. The energy management system operates like the brain of the framework and controls the electrical power supply needed for the load. In this energy management system, the cost controller and data collection unit based on fuzzy logic are important elements. Grid-battery system.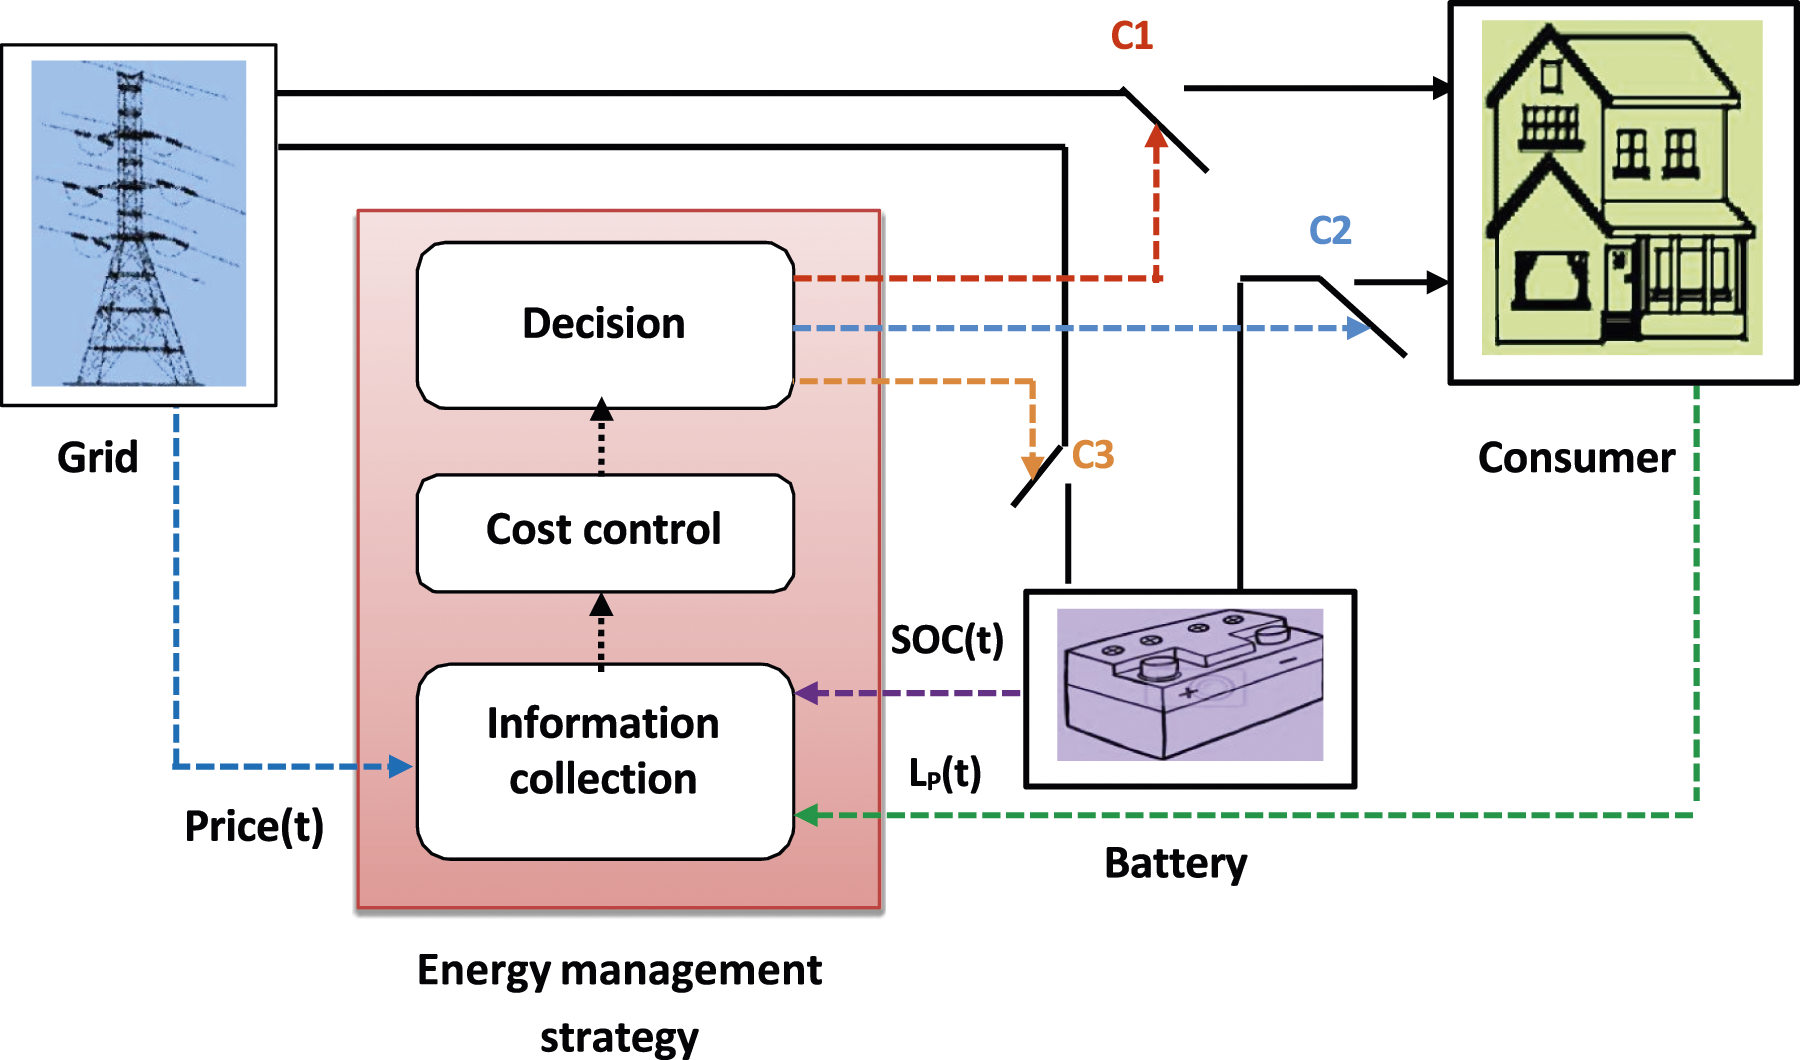
The information collector periodically gathers energy price data, the battery state of charge (SOC) and the power demanded by the load, while the cost control unit makes the decision to supply the load with the suitable energy source based on the price of electricity from the network and the state of charge of the battery. For the grid-battery system, the energy management strategy includes: a. The information collector: it collects, at each instant, the battery state of charge (SOC (t)), the electricity price (Price (t)), and the load power (LP). b. The cost control unit: it is based on the Fuzzy Logic Control (FLC). It makes the optimal decision to supply the load with the appropriate energy source (grid or battery). c. The decision bloc: the decision will be given by the three switches C1, C2 and C3, as follows: • ‘C1’ closed: The grid supplies the load. • ‘C2’ closed: The battery supplies the load. • ‘C3’ closed: The grid recharges the battery.
Grid-PVP-battery system
The total cost of electricity can be reduced by adding the photovoltaic panel to the first defined system. As its cost is considered zero, it is recommended to exploit it as much as possible to keep the load supplied. In this case, the produced energy can be stored by the battery then used when the photovoltaic power is not available and when the electricity price is high. Figure 11 shows the Grid PVP-Battery-Load system. As in the first energy management system functions as the principal component and manages the power supply for the load. The PVP is used as a renewable energy source thanks to its reducing cost and its participation in decreasing the carbon emissions (Toumi et al., 2020). Grid-PVP-battery system.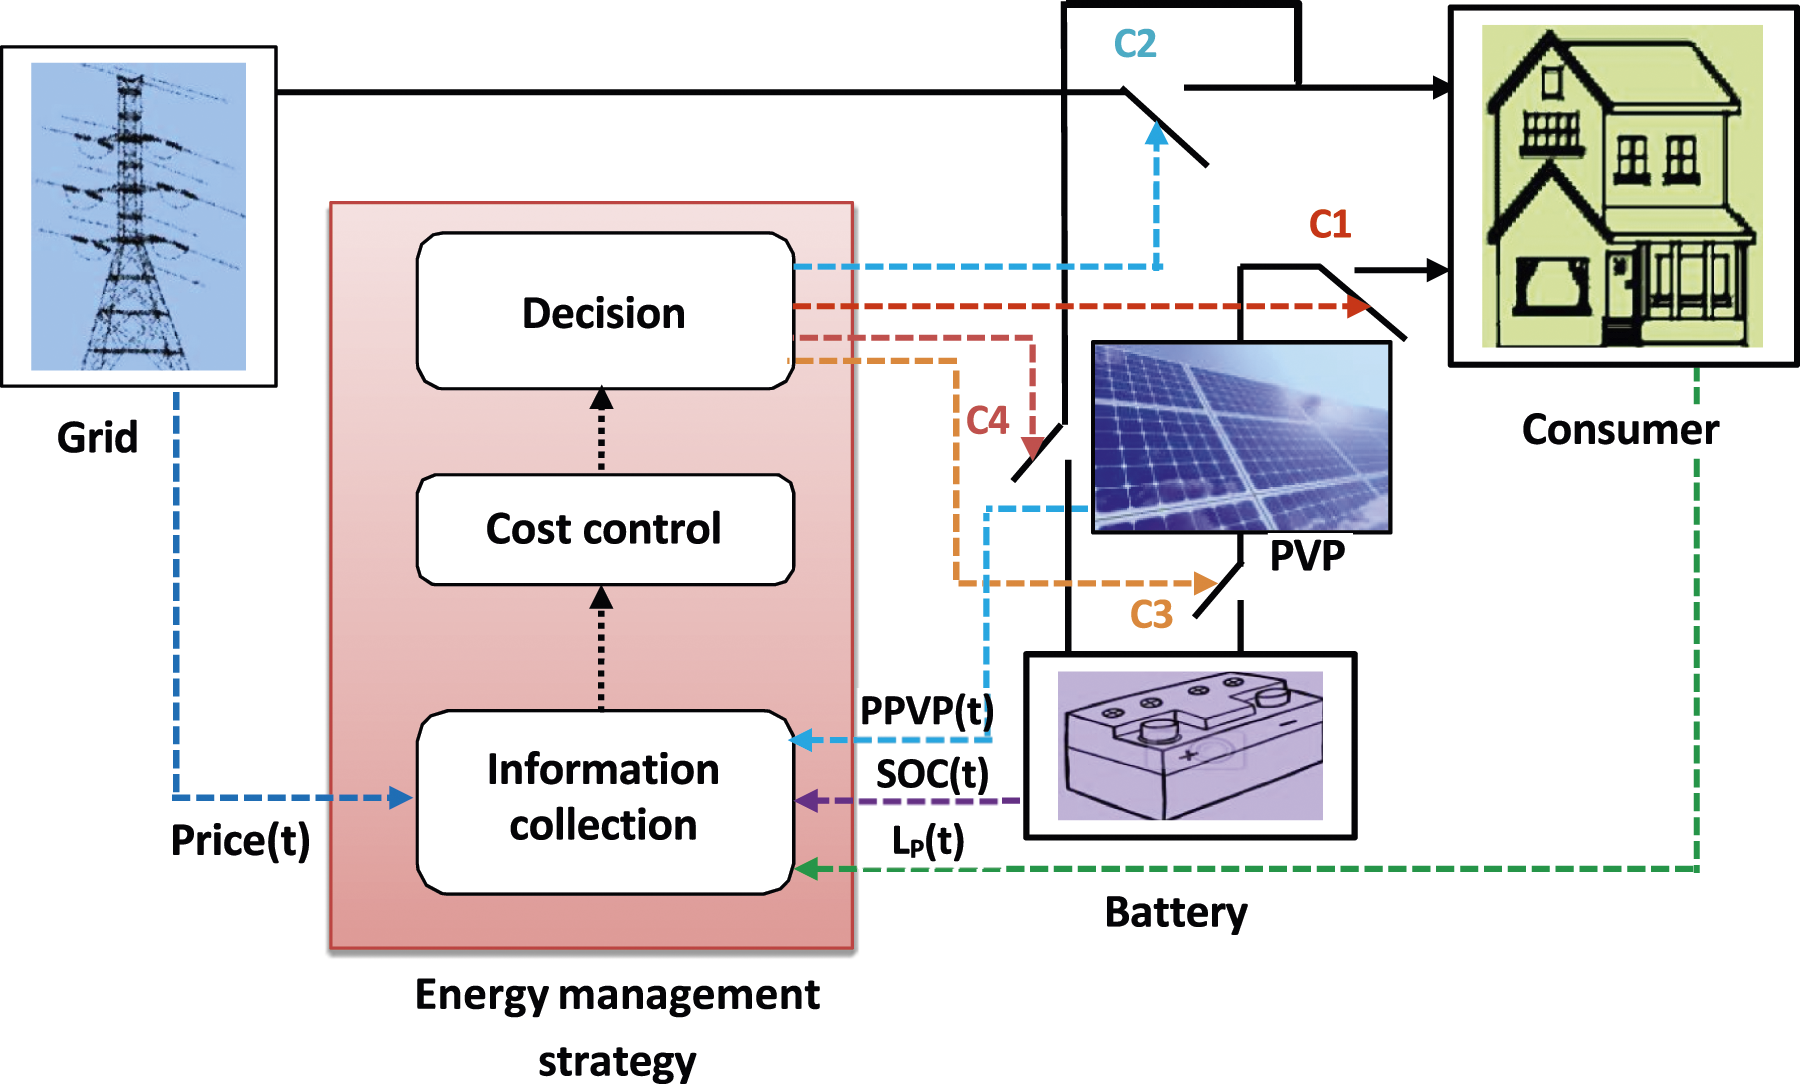
In this case, the information collector consists of periodically collecting the battery state of charge (SOC (t)), the photovoltaic panel power (PPVP (t)), the electricity price (Price (t)), and the load power (LP). The cost control unit makes the optimal decision to supply the load with the adequate energy source (grid, PVP, or battery). The decision bloc, based on the four switches C1, C2, C3, and C4, generates the following decisions: • ‘C1’ closed: The PVP supplies the load. • ‘C2’ closed: The grid supplies the load. • ‘C3’ closed: The PVP recharges the battery. • ‘C4’ closed: The battery supplies the load.
Energy management approaches details
This work proposes two energy management approaches in a lighting system with variable grid electricity prices.
The first approach consists of integrating a storage element into the systems connected to the grid.
In the second, the first system has been improved by integrating a priority renewable source for powering the system and charging the battery.
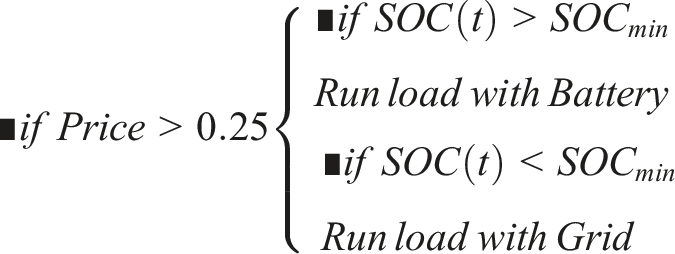
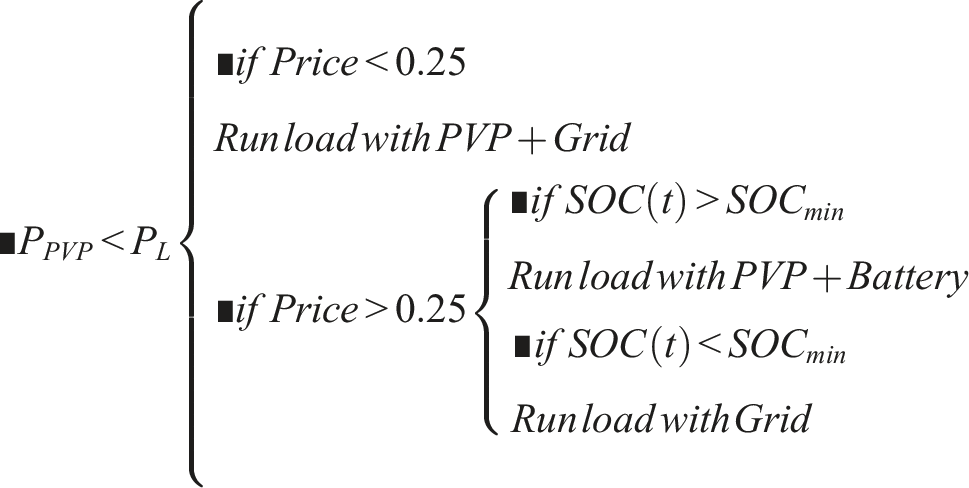
For both configurations, if the Price (t) exceeds 0.25€/kWh, it will be considered high.
Energy management of grid-battery system
The Fuzzy logic algorithm, proposed for a grid-battery system, is shown in Figure 12. As input data, SOC (t) and Price (t) are used. (a). Energy management strategy of grid-battery system main flowchart. (b). Battery charging operation. (c). Battery discharge operation.
The following steps can describe the algorithm. • Read (Price (t)) and battery (SOC (t)) at each instant.
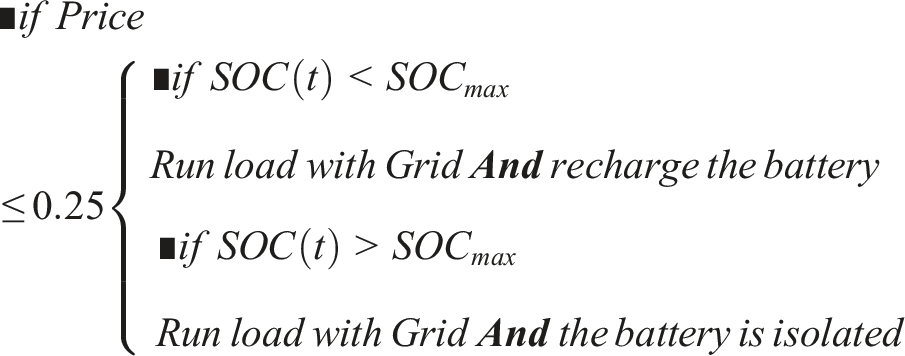
Energy management of grid-PVP-battery system
For the grid-PVP-battery system, the Fuzzy logic algorithm is given by Figure 13(a)–(c). (a). Energy management strategy of grid-PVP-battery system main flowchart. (b). Battery charging operation. (c). Battery discharge operation.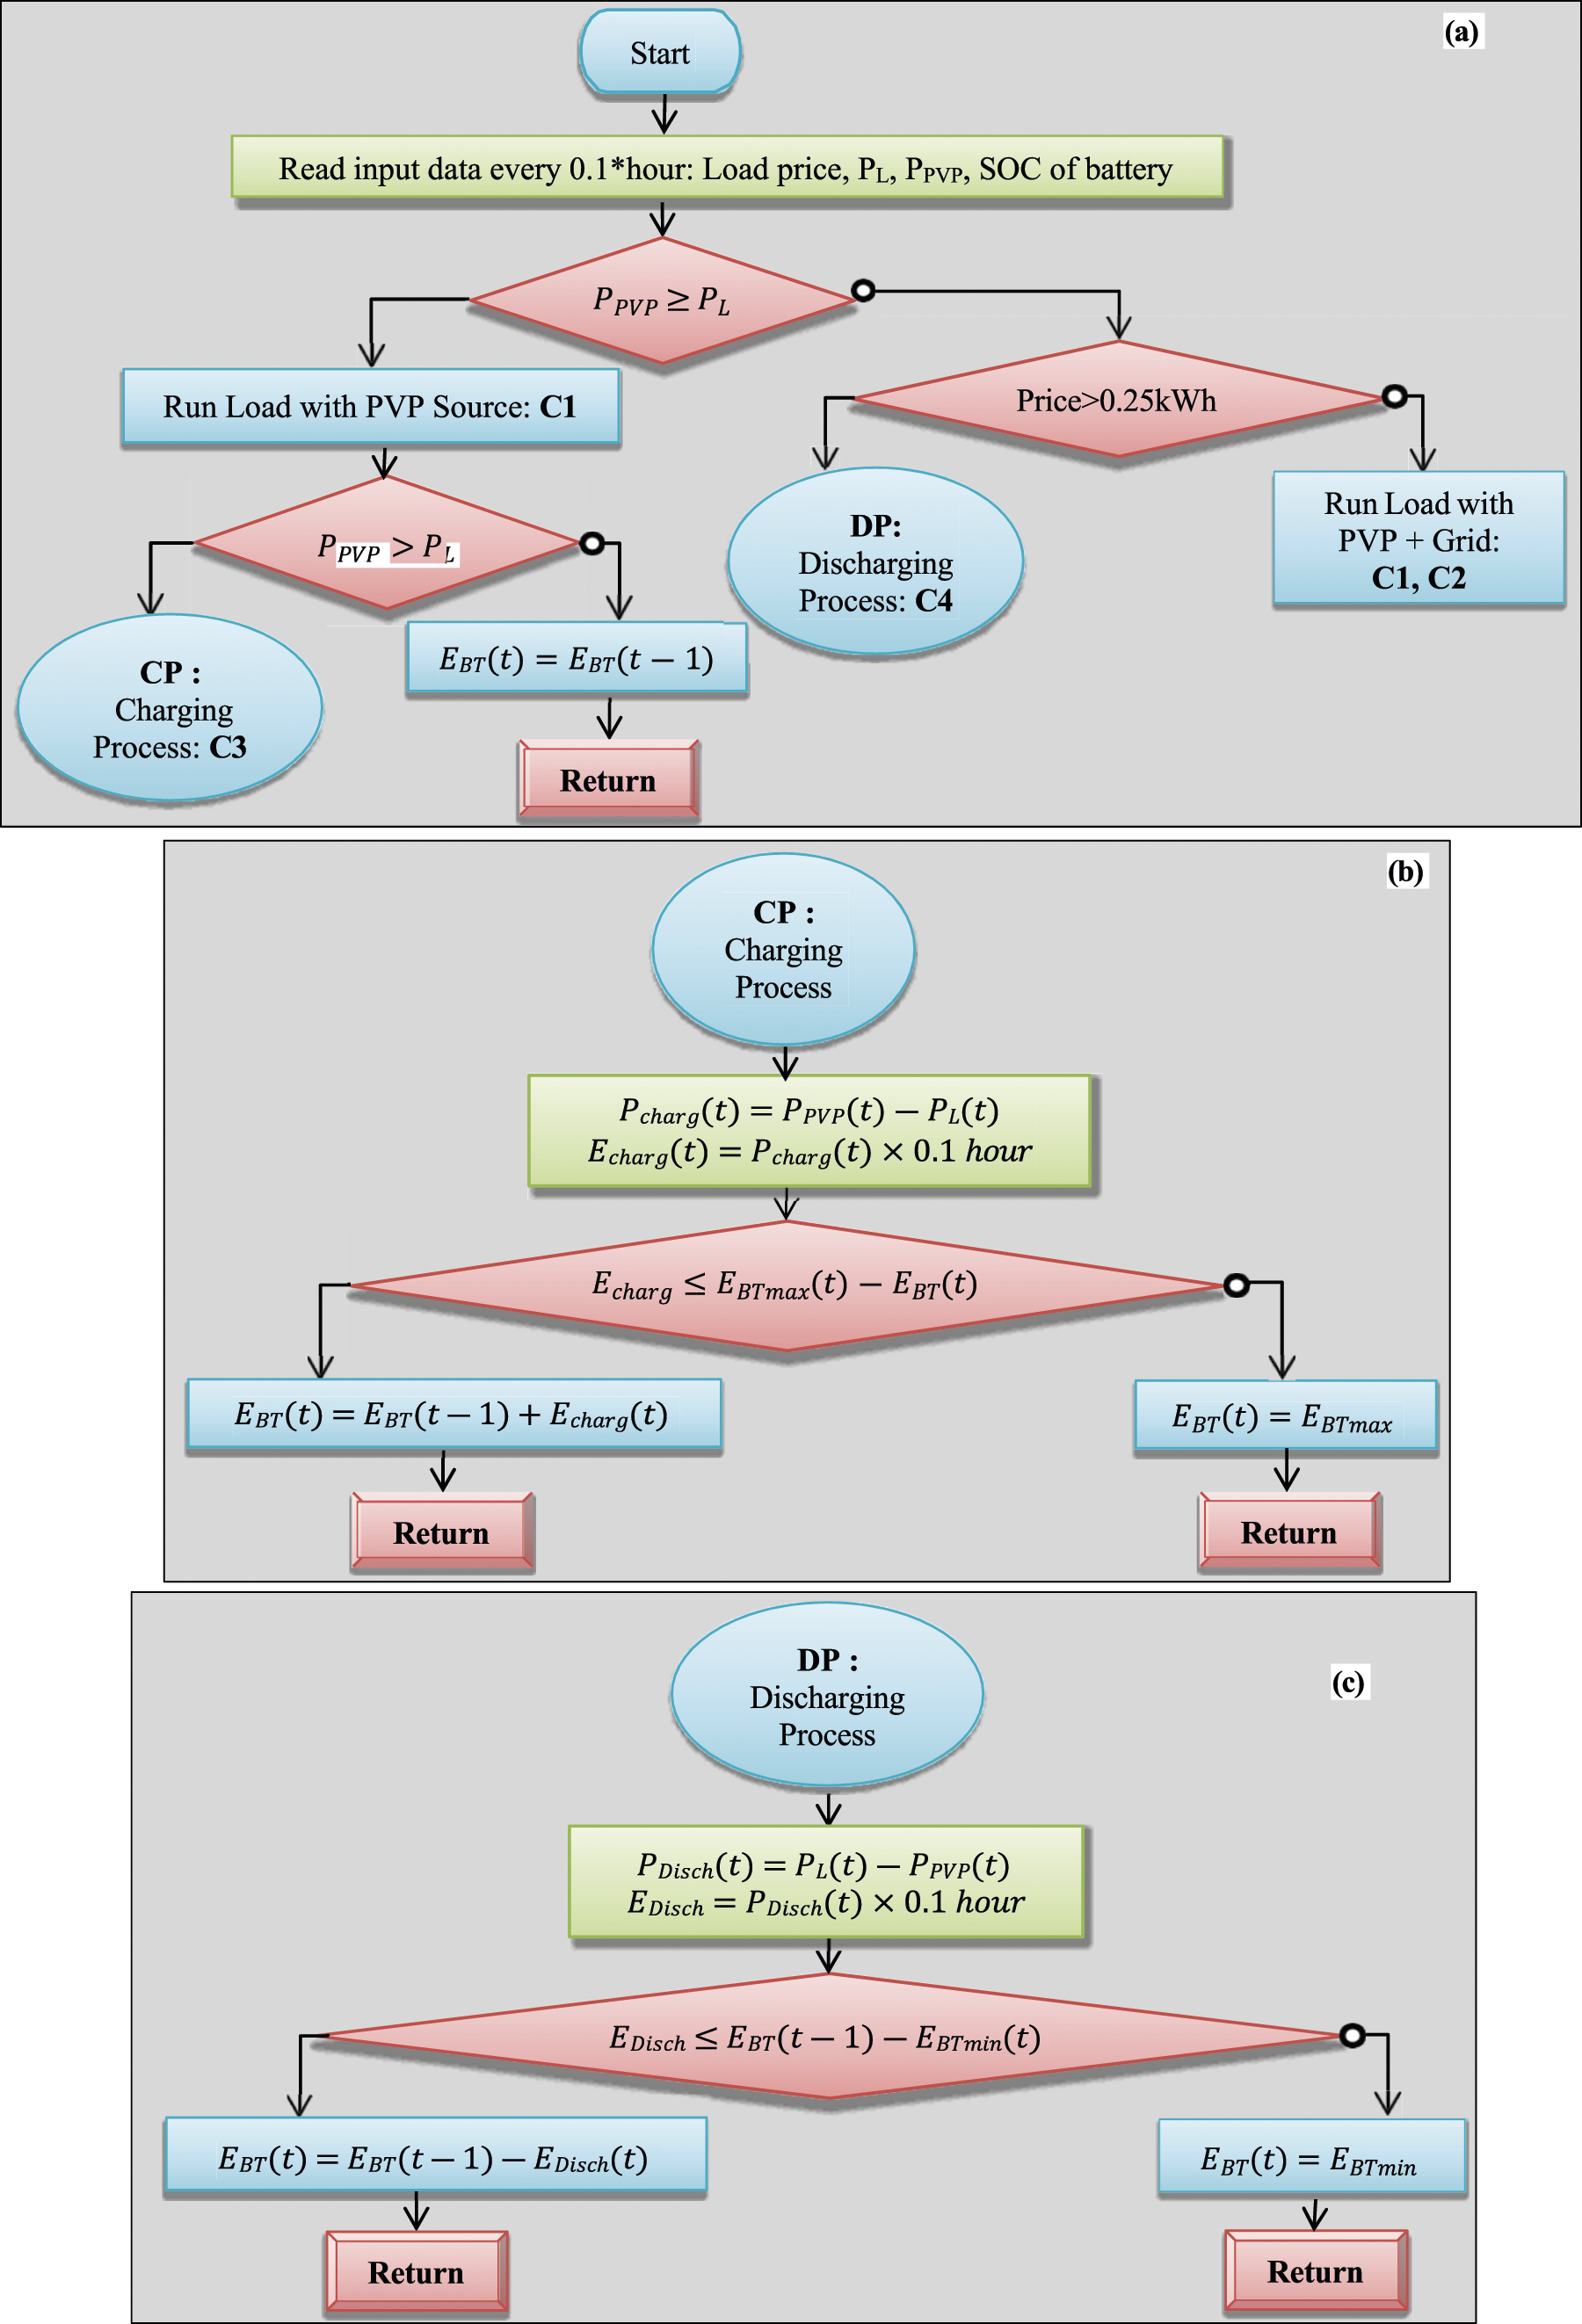
It mainly consists of controlling the PVP power as follows: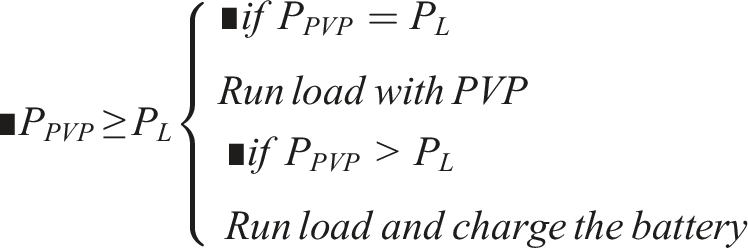
Discussion
The role of energy storage has a significant impact in grid-connected systems where the price of electricity is variable: The first approach in this work shows that a storage element plays a very important role in minimizing the cost of consumption when the price of grid electricity increases.
The 2nd approach shows that the integration of renewable energy sources such as solar panels in the first system (the first approach) gives greater efficiency to the connected systems, especially in the northern regions of Africa, which are characterized by high solar radiation that lasts throughout the year. The use of these sources also reduces the cost of consumption, not forgetting the advantages of solar panels in terms of cleanliness and reduced CO2 emissions.
Fuzzy logic control modules
Two fuzzy algorithms have been developed to an optimal operation control of the Grid-battery and Grid-PVP-battery systems.
Grid-battery system
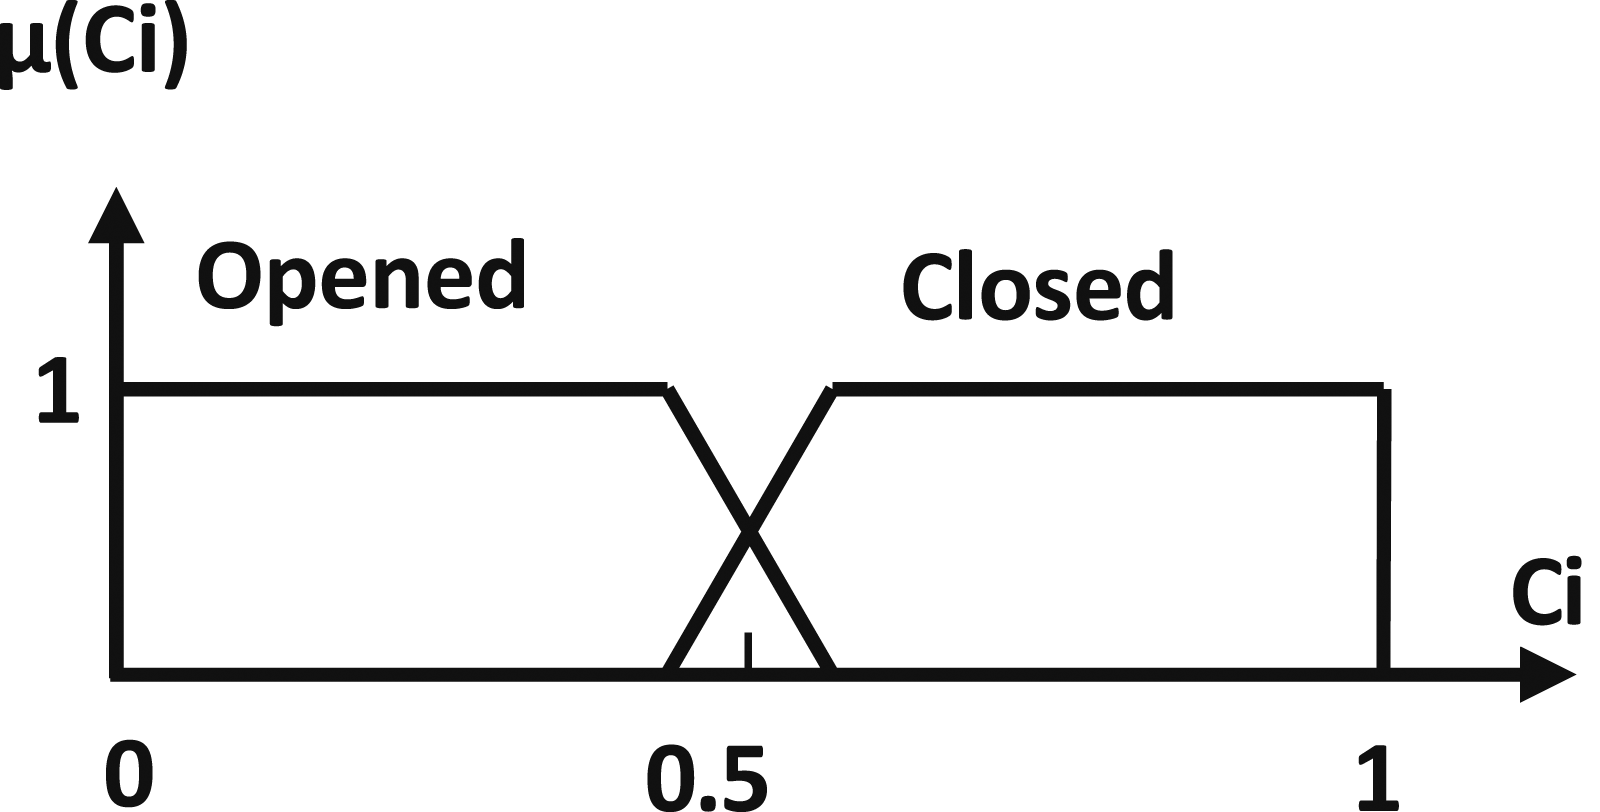
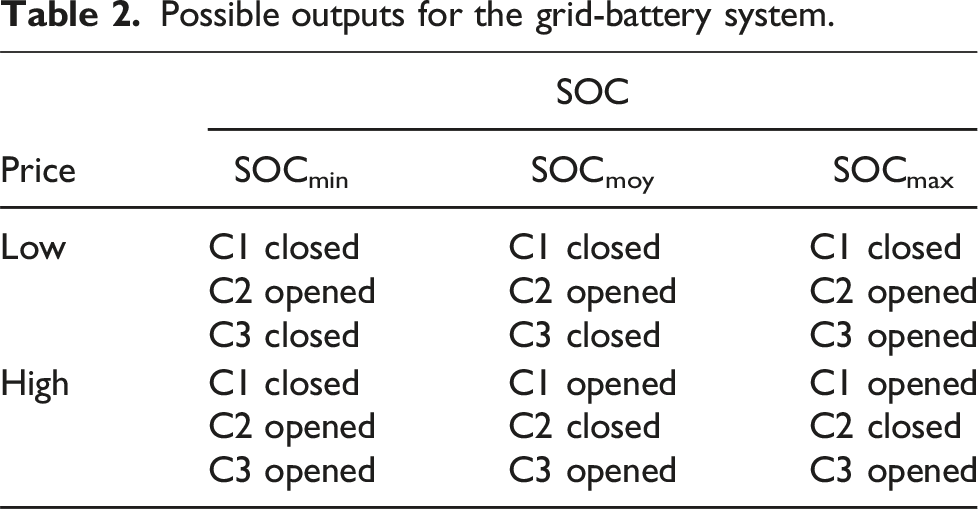
The fuzzy logic control is based on input and output modules. The input functions modules, presented in Figure 14, are the battery state of charge (SOC (t)) and the electricity price (Price (t)). The output functions module, presented in Figure 15, allows to take the right decision (choose the grid or the battery to supply the load). Table 2 gives all the possible decisions. Input functions modules (a) price, (b) SOC. Output function module (Ci). Possible outputs for the grid-battery system.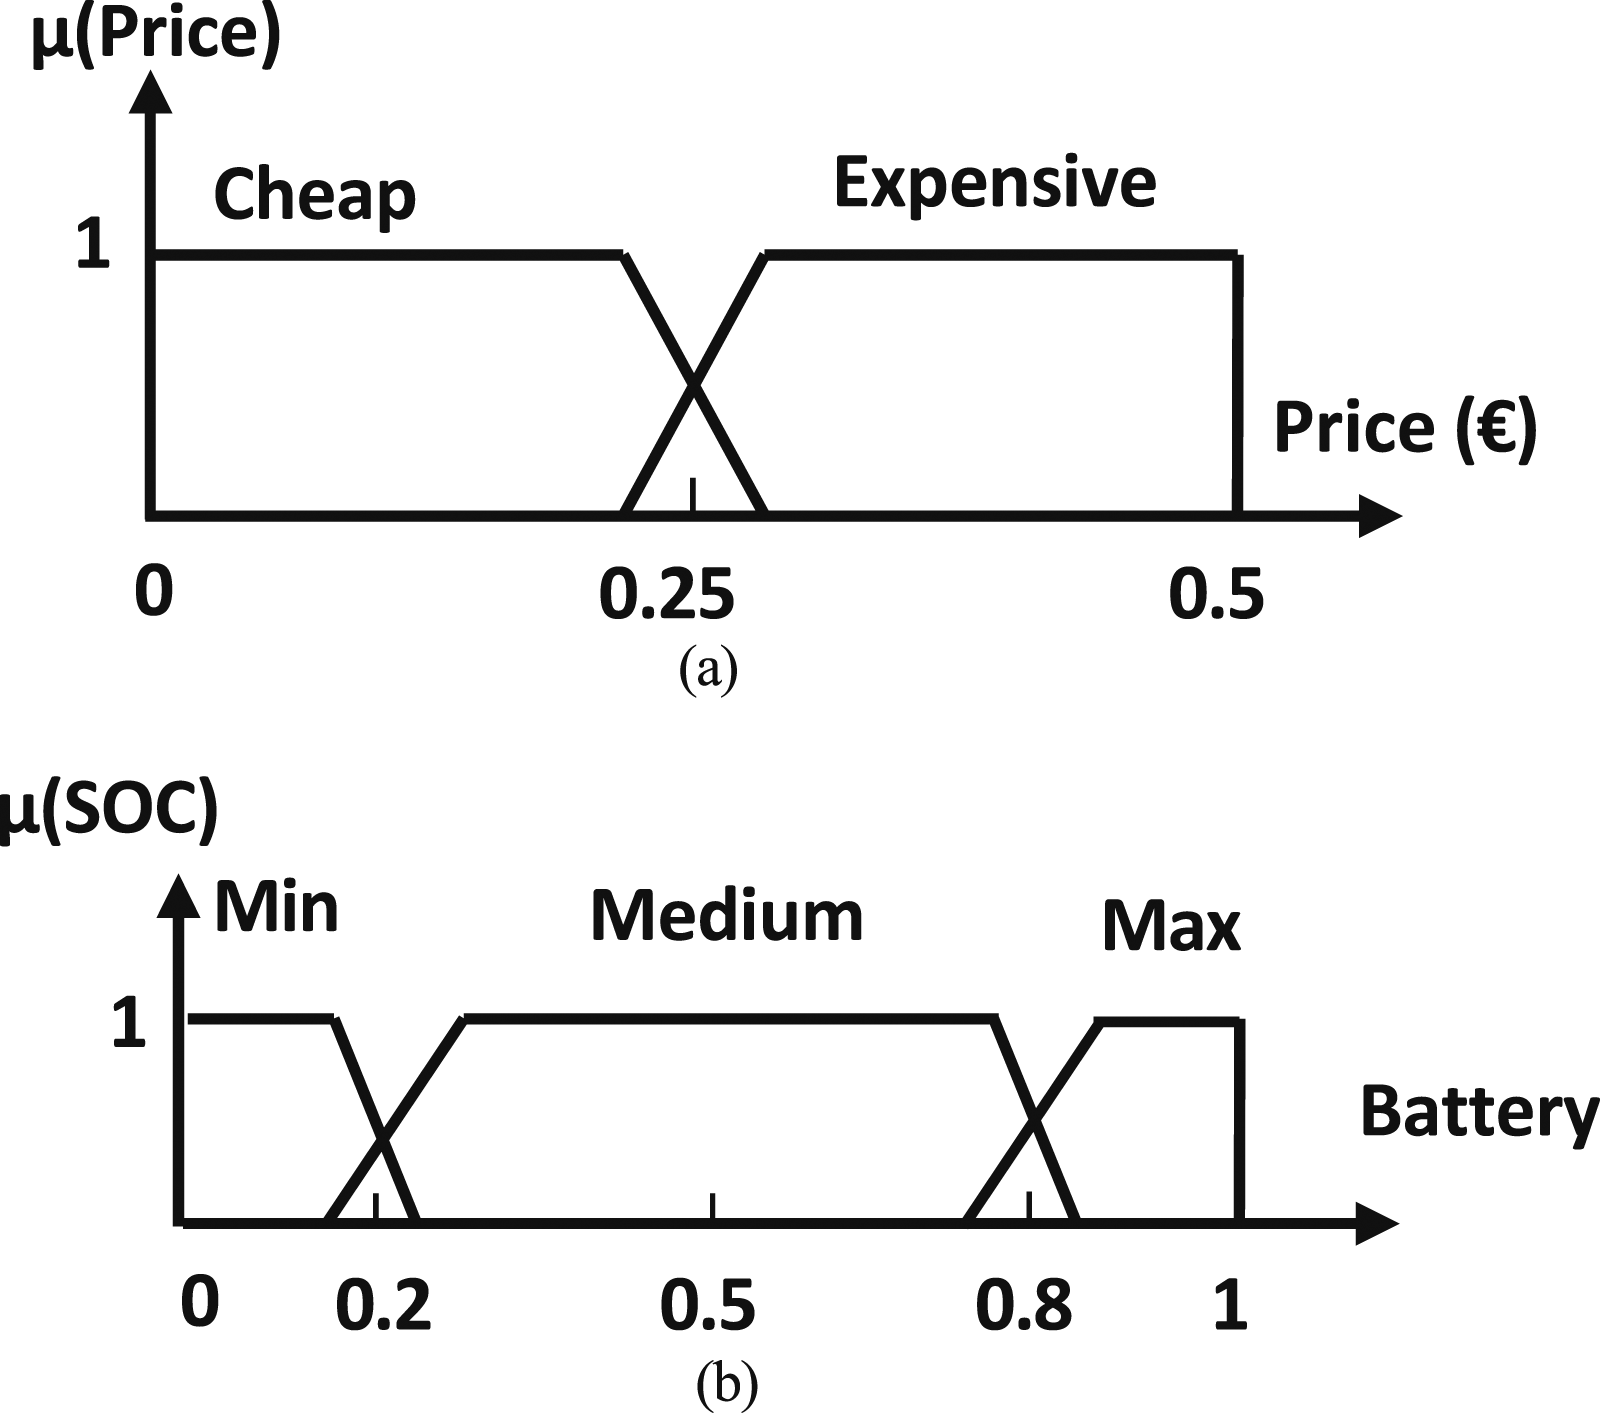
Grid-PVP-battery system
The fuzzy logic control is based on input and output modules. The input functions modules are the battery state of charge (SOC (t)) and the electricity price (Price (t)) (presented in Figure 14) and the normalized difference power index, DP, between the PVP power, PPVP, and load power, PL, (Figure 16). Input function module (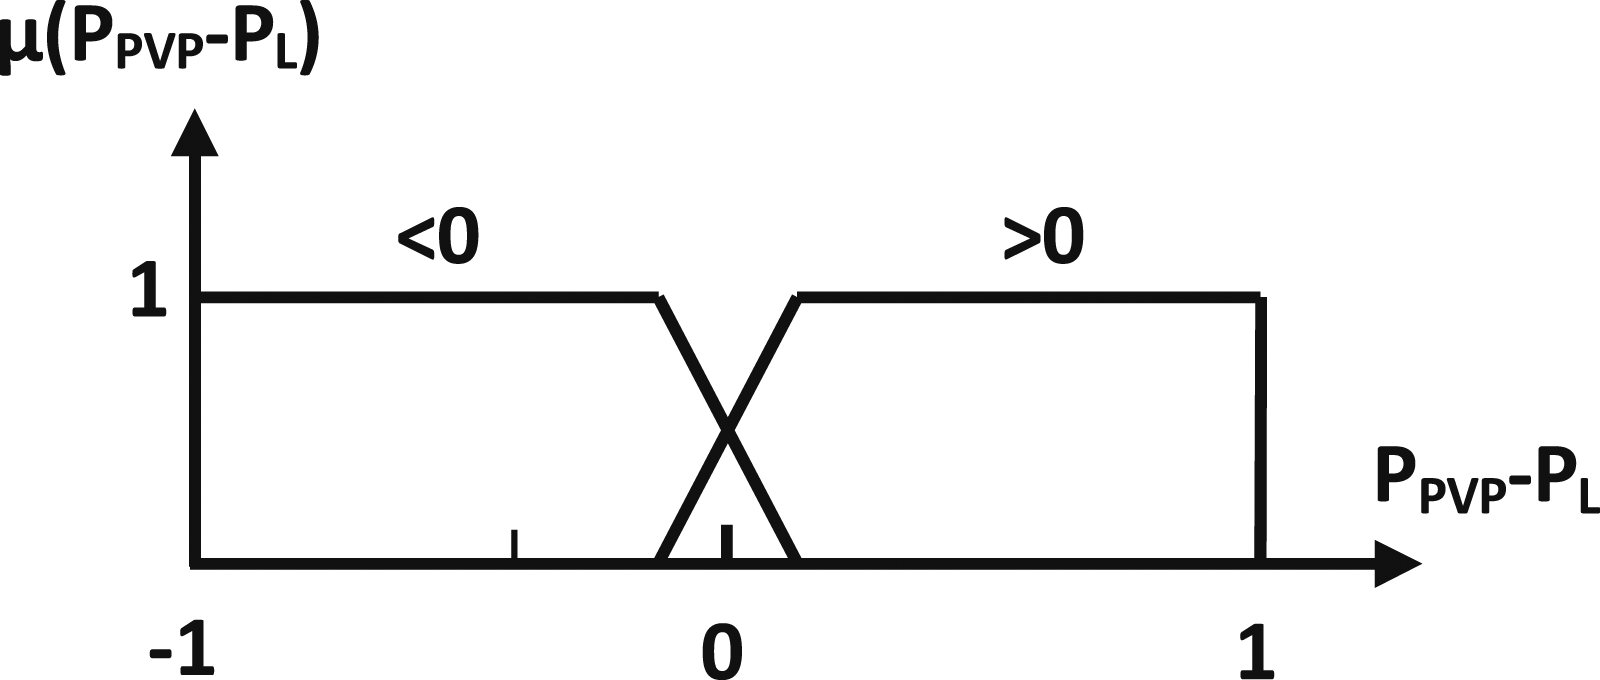
Where DP is the normalized difference power index.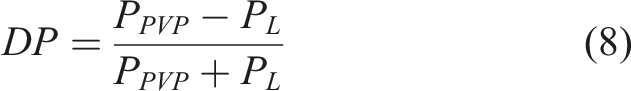
Possible outputs for the grid-PVP-battery system.
Simulation results and discussion
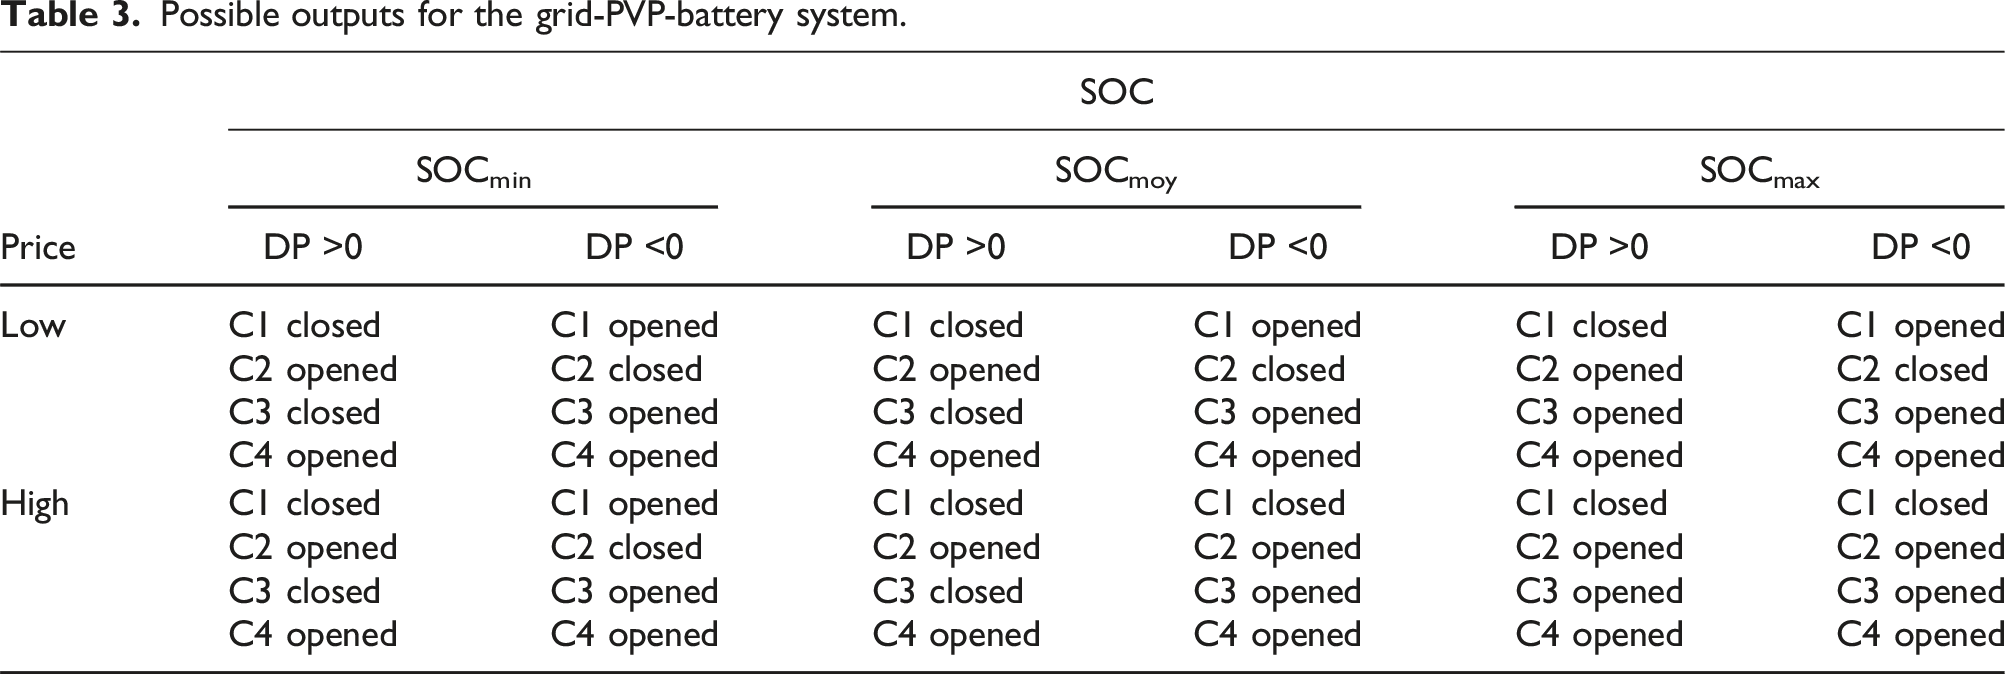
The input-output fuzzification phase is generated based on an annual database collected from a measurement station. Which consists of an acquisition chain connected to two wind speed and sunlight sensors of an hybrid PV/wind turbine system located in the Department of Energy of the Higher Institute of Applied Sciences and Technology in Sousse, Tunisia and catches for each 15 min (Figure 17). Measurement station located at ISSAT of Sousse Tunisia (a): hybrid PVP/WT system; (b): solar radiation sensor; (c): wind sensor.
In this section, the grid-battery and the grid-PVP-battery systems will be studied and discussed.
Grid-battery system
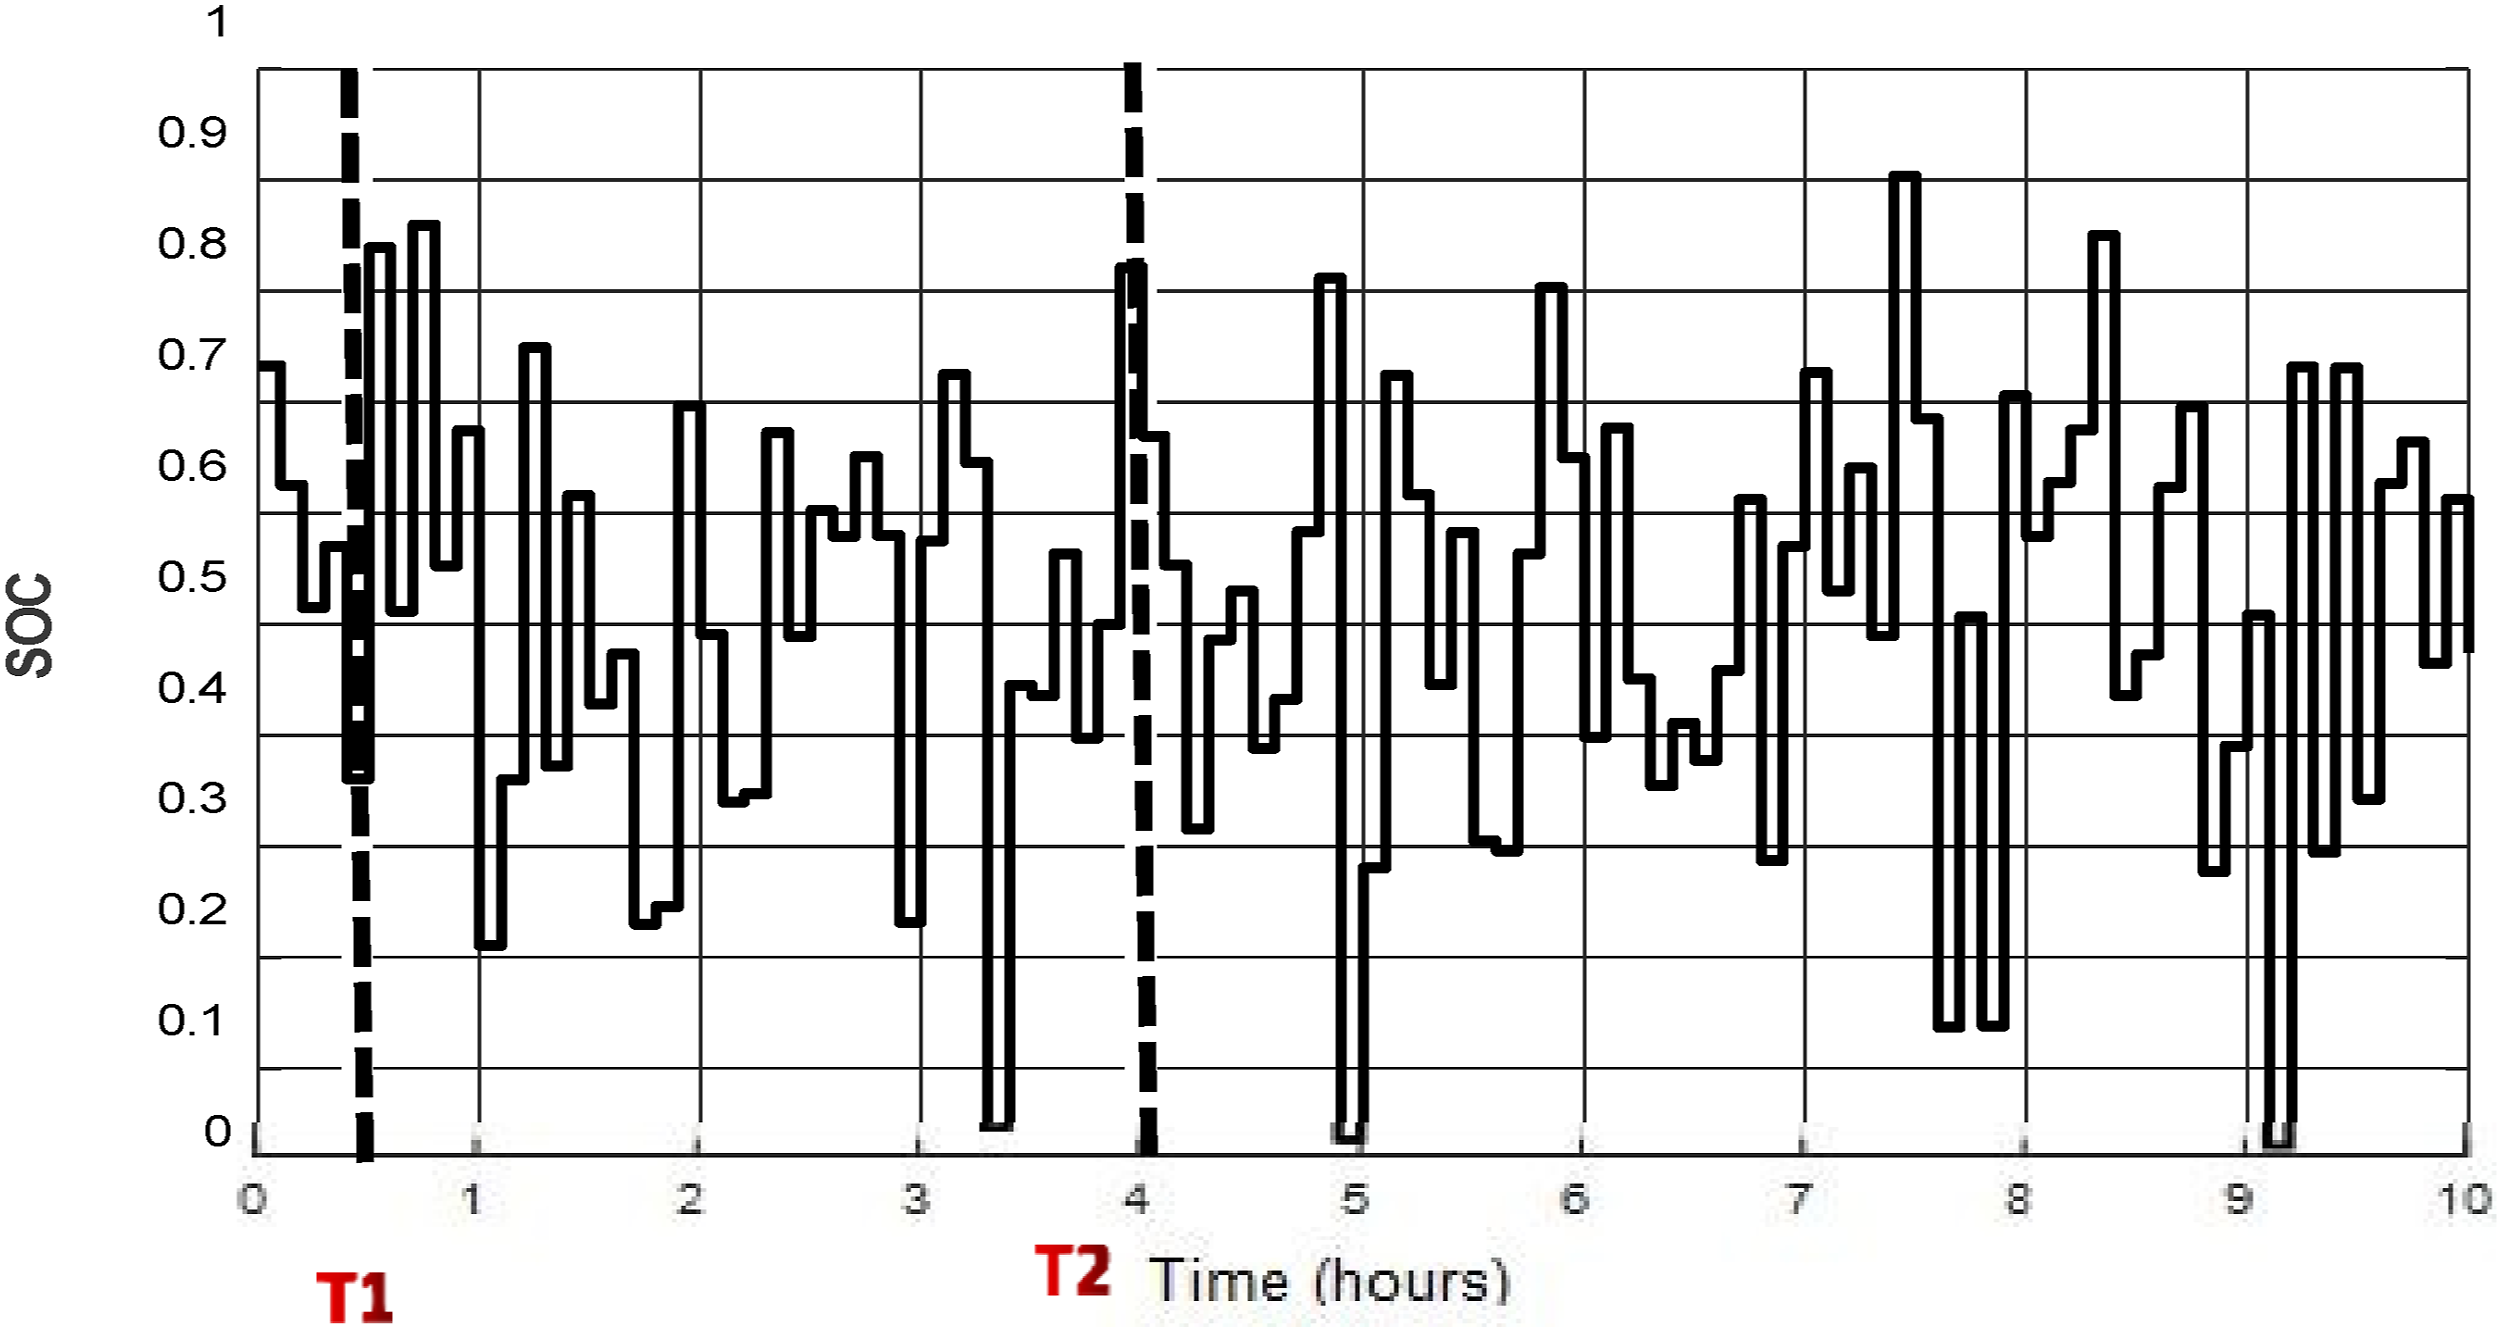
As input data of the first system grid-battery, the electricity price (Price (t)), varies from 0 to 0.5€/kW, is illustrated in Figure 18. Figure 19 presents the battery state of charge (SOC(t)) variation from 0 to 90%. Electricity price (t). State of charge of the battery SOC (t).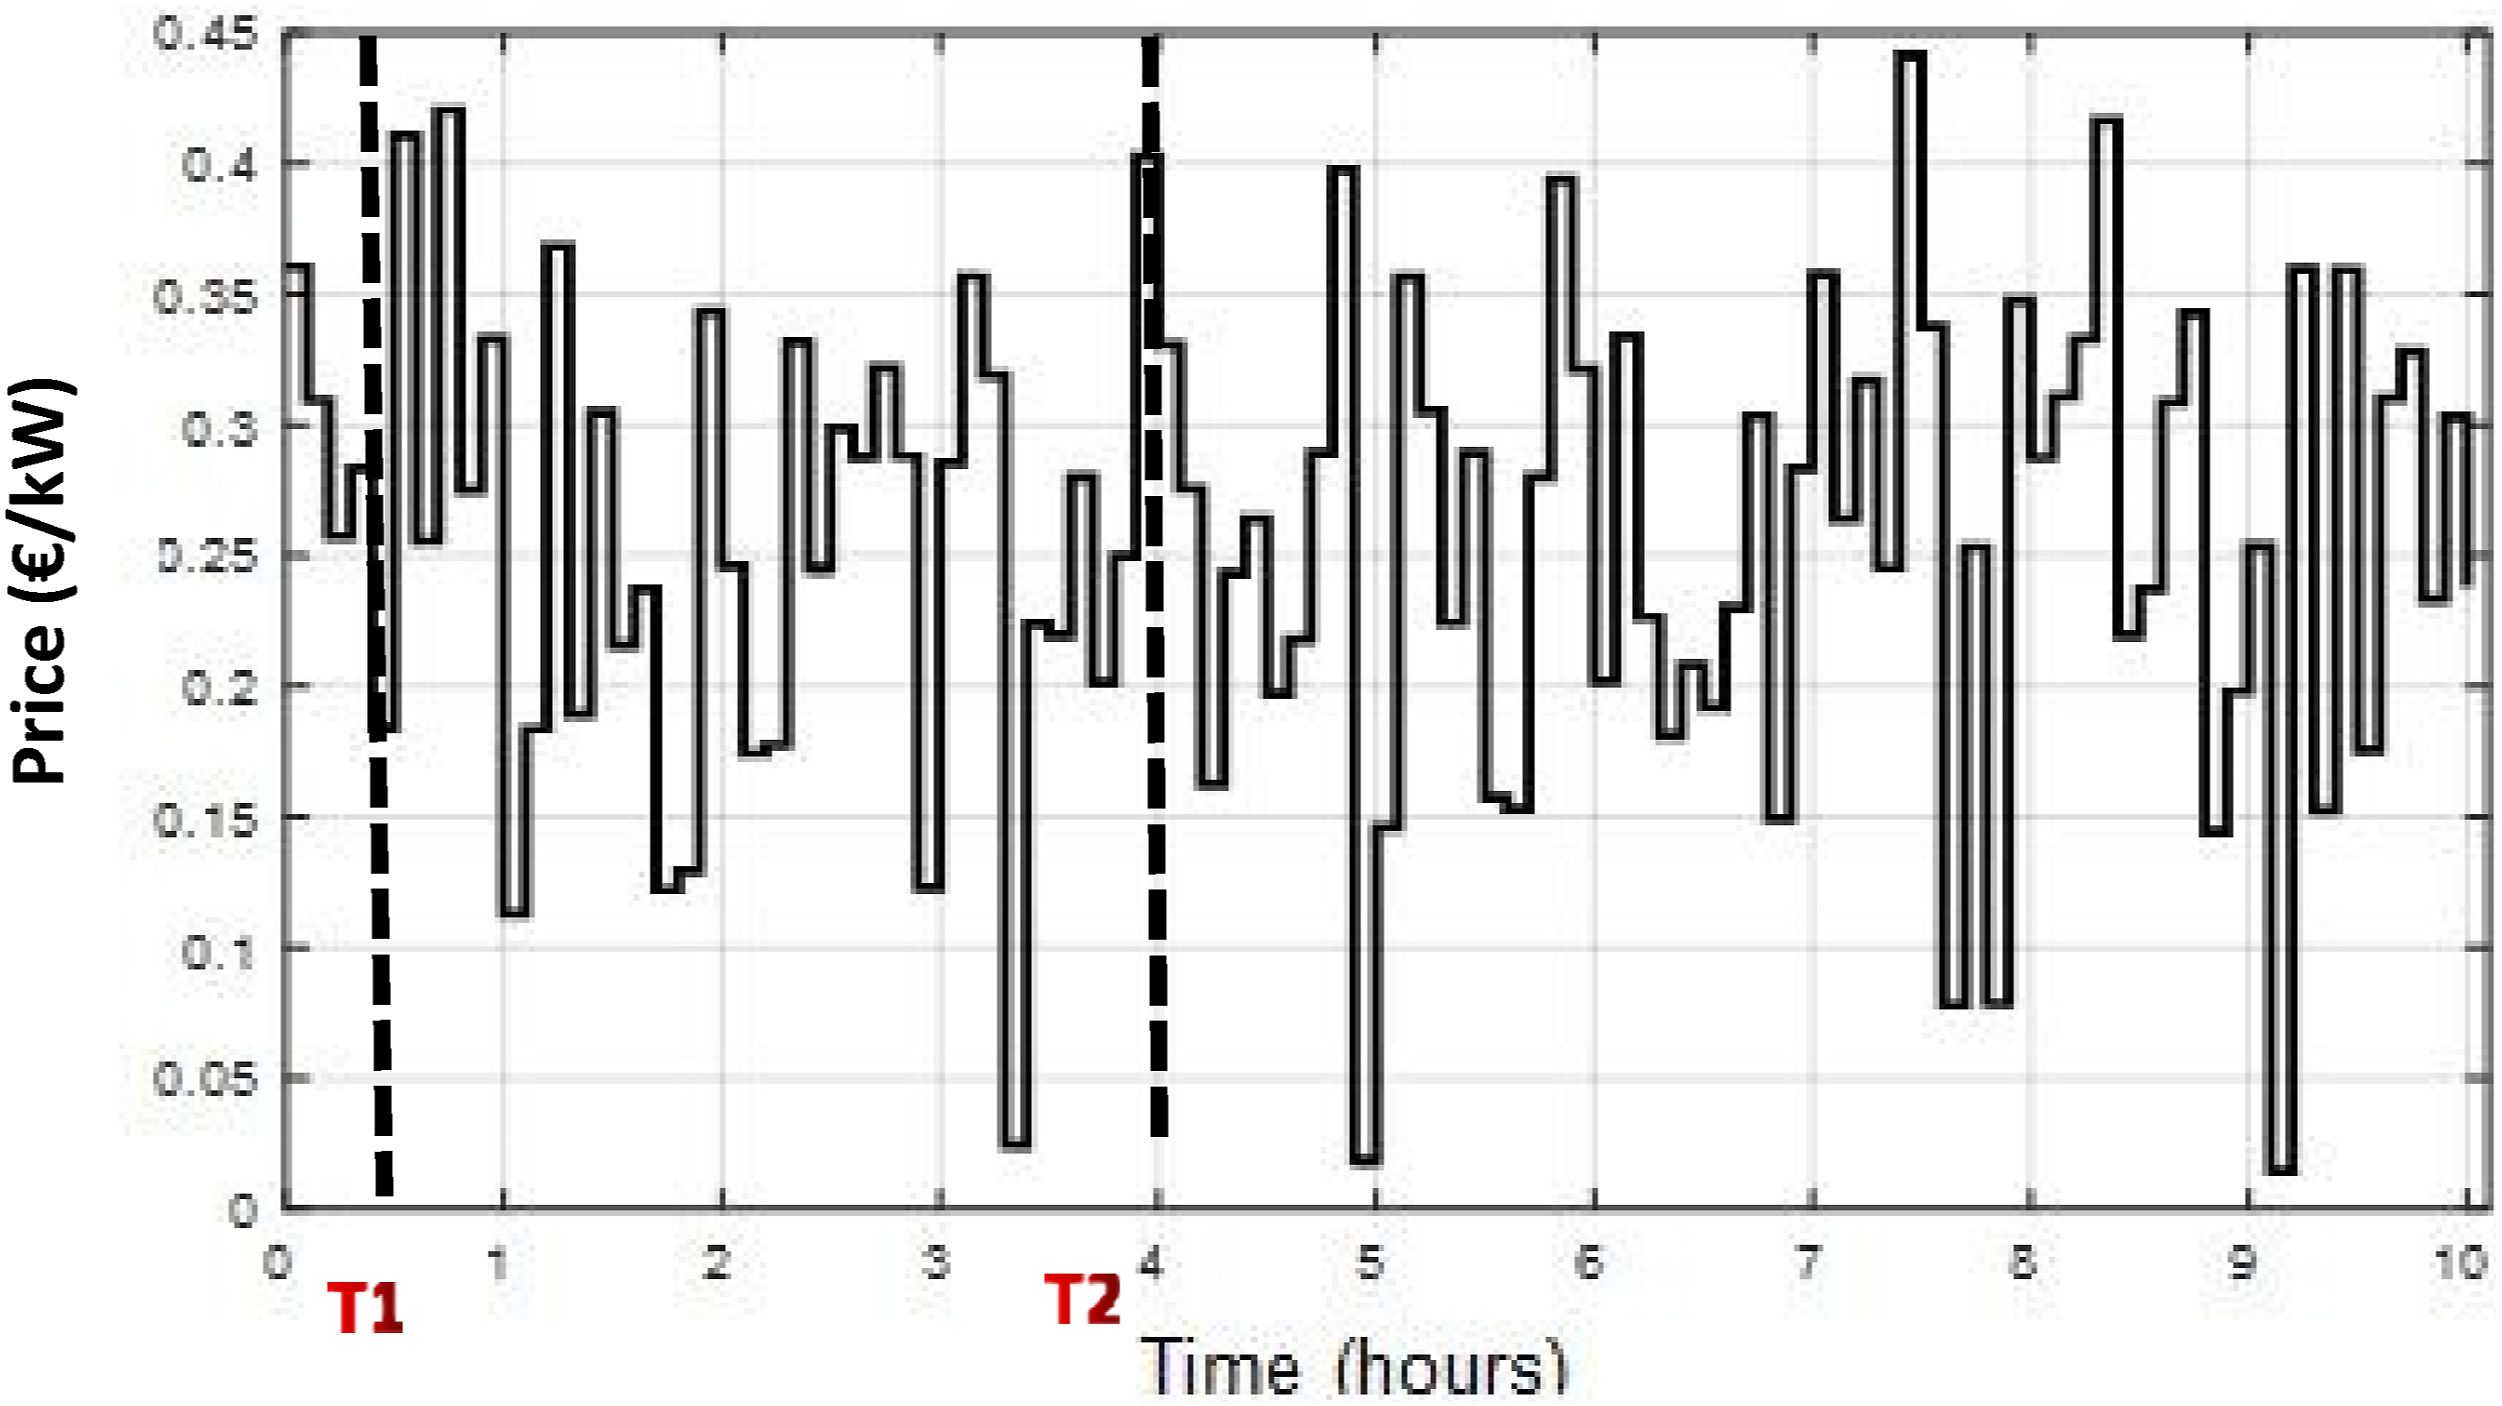
The energy management strategy in the grid-battery system pursue the following approach, if the grid electricity price is less than 0.25€/KWh then the grid is the source of power for the load and research of the battery if its state of charge is not maximum so C1 and C3 are closed and C2 open. And if the grid electricity price is greater than 0.25€/KWh then the battery is the power source for the load if its SOC is greater than 0.5 (50%), if not (SOC <0.5) then the load is powered by the grid to increase battery life.
The states of switches C1 (grid-load), C2 (battery-load) and C3 (grid-battery) are given by Figs 20–22, respectively. Unlike C1, C2 and C3 are opened and closed simultaneously. These results confirm our objective (choose, at each instant, either the grid or the battery to supply the load). Switcher 1 (C1) evolution. Switcher 2 (C2) evolution. Switcher 3 (C3) evolution.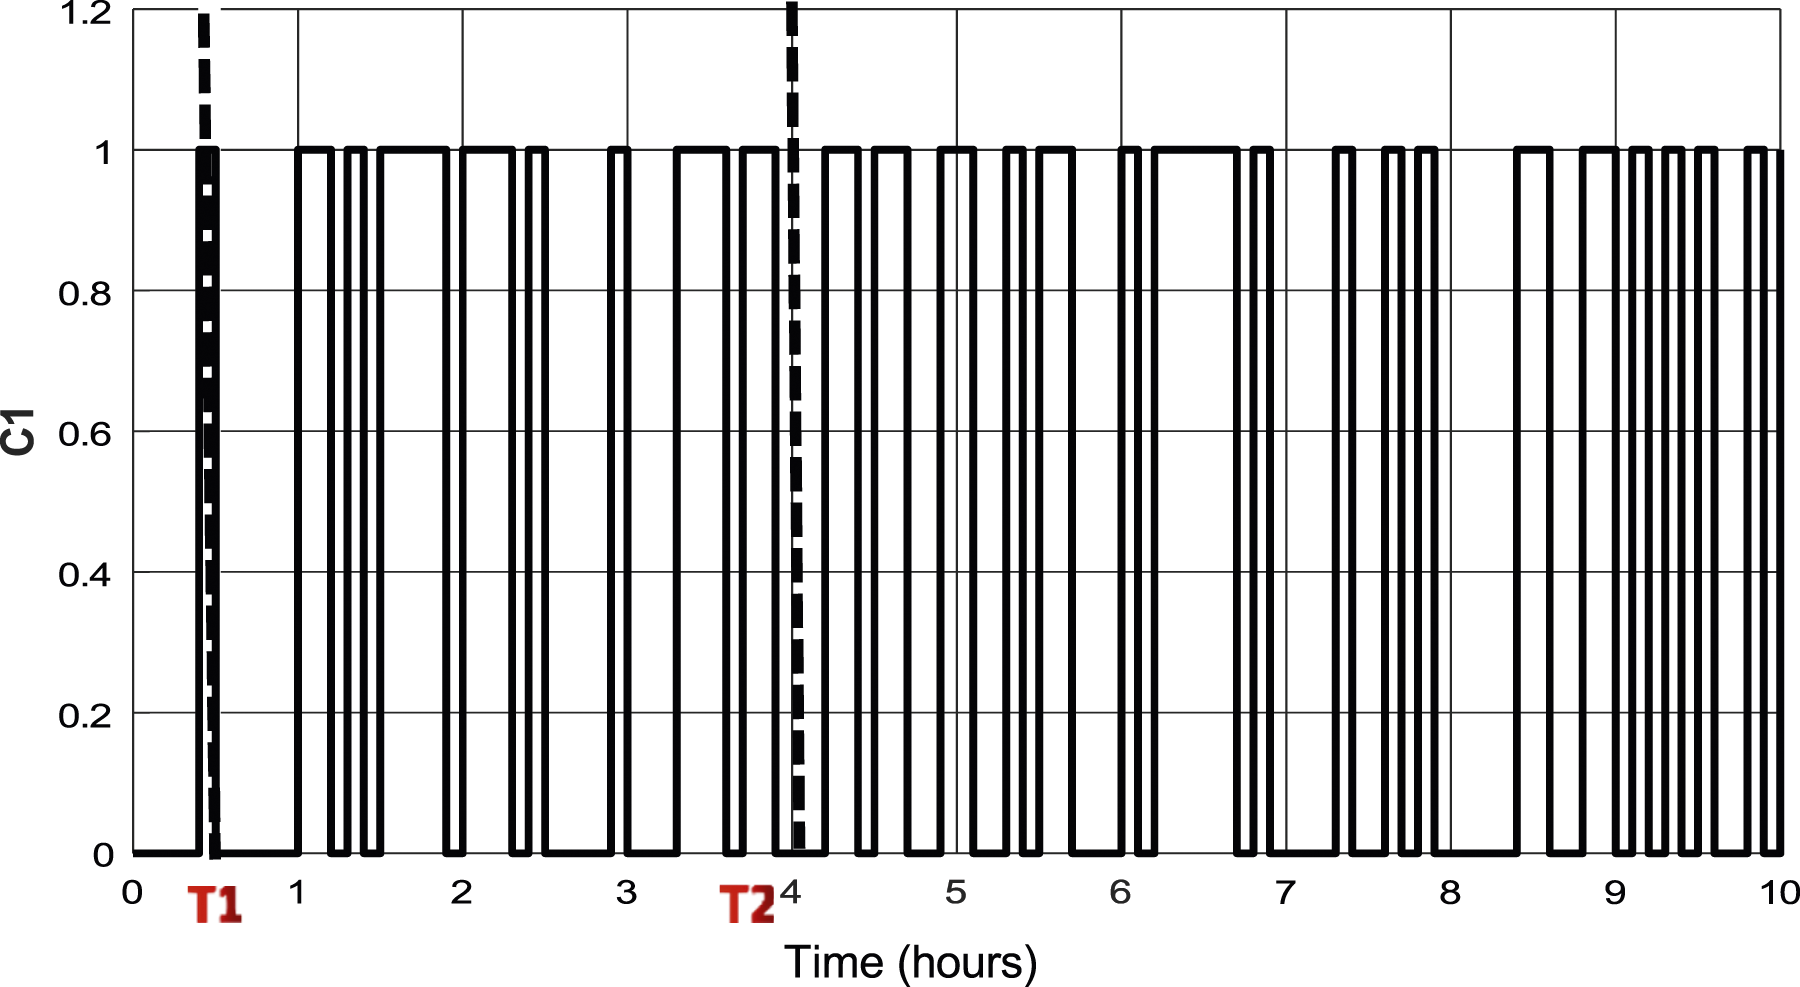
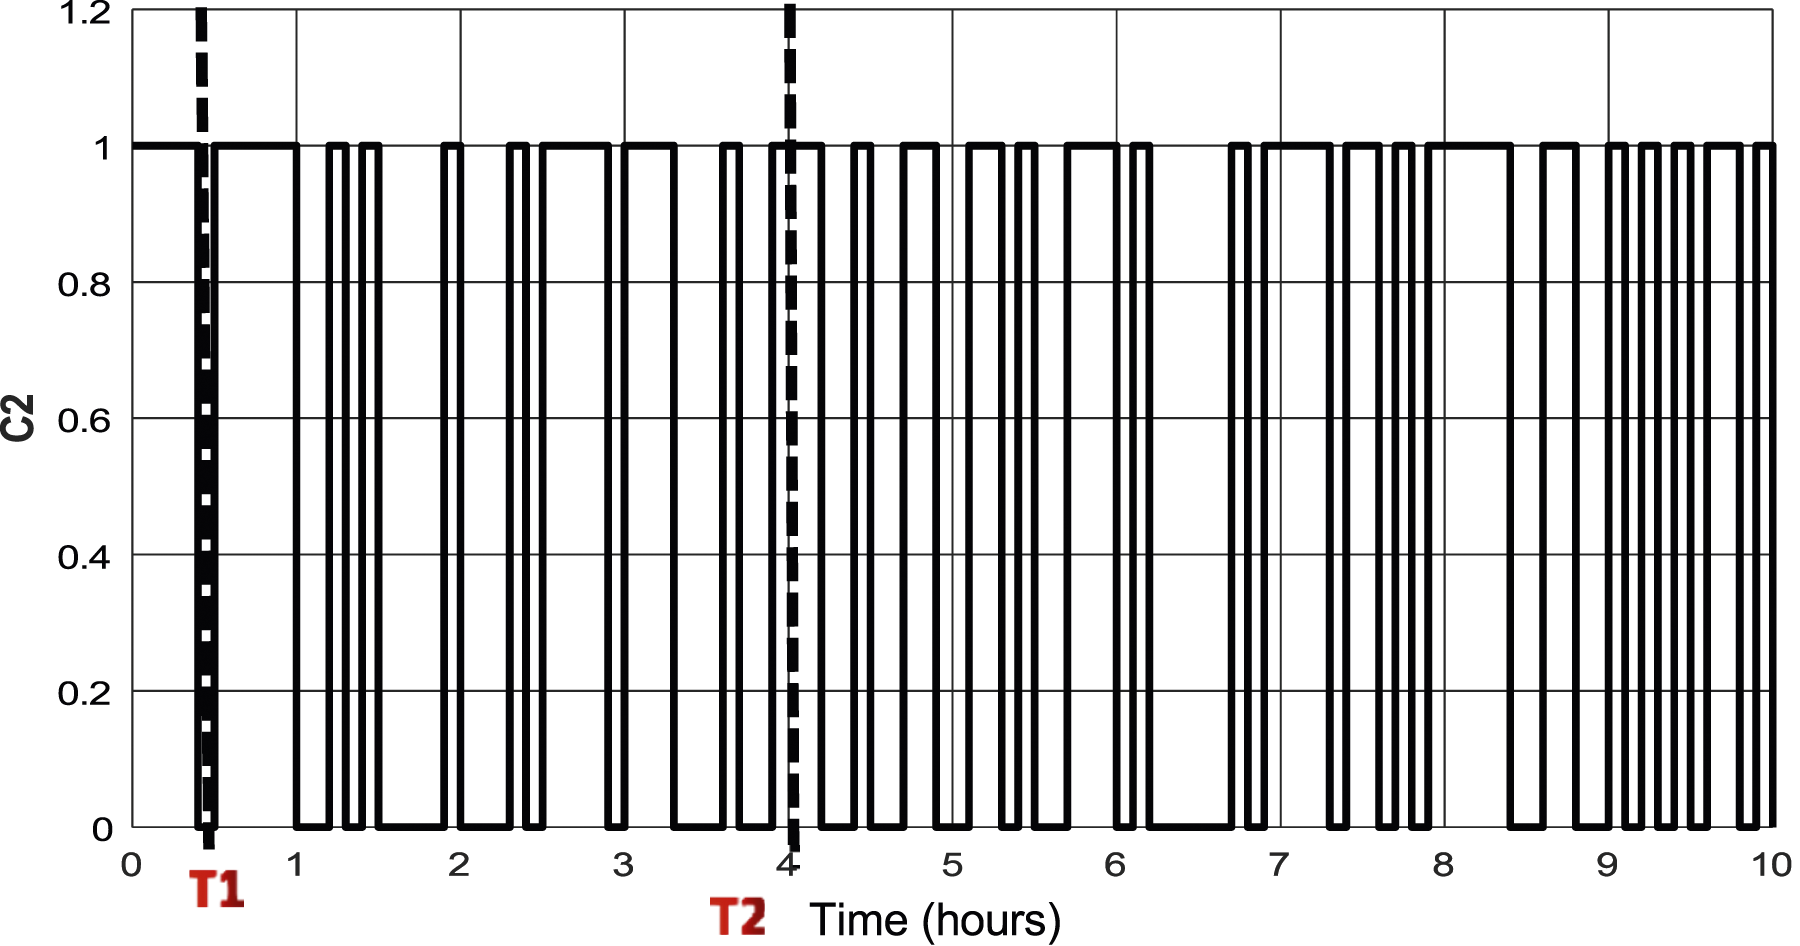
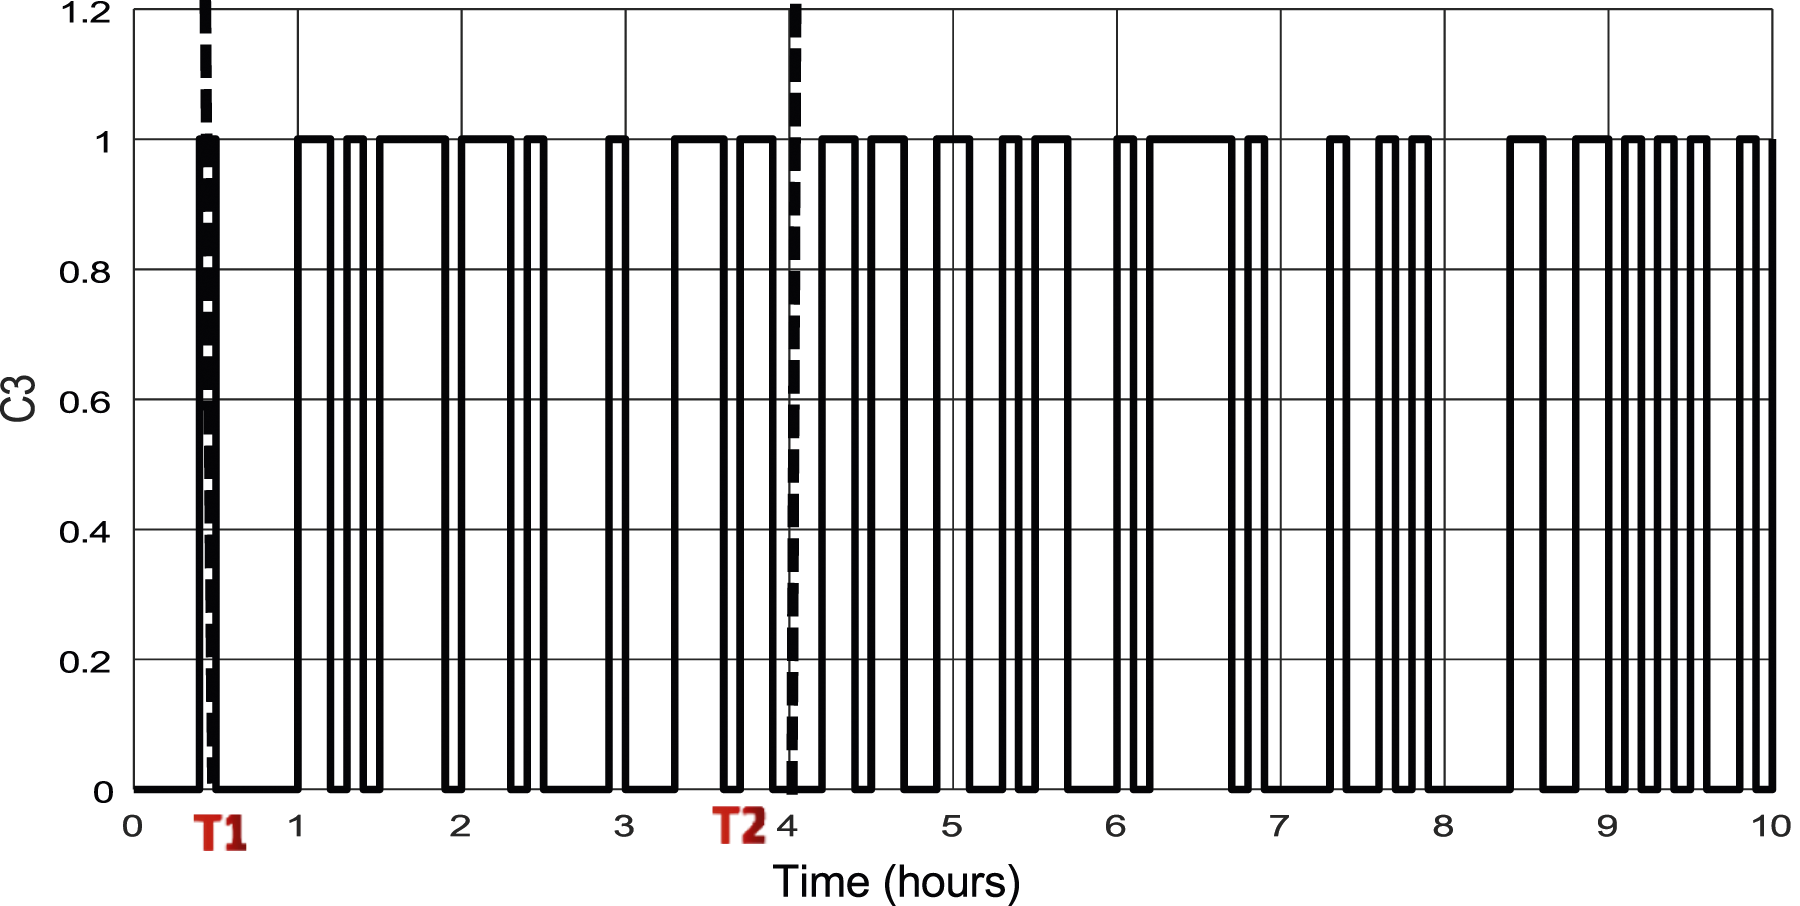
Indeed, in T1, when Price (t) is low, the grid is chosen (C1 is closed), the battery is recharged (C3 is closed). In T2, when price is high and SOC is high (>0.5 c.a.d. 50%) then the battery is chosen for the load supply (C2 is closed, C1 and C3 are opened). When the SOC is low (<0.5), the load is always powered by the network whatever the electricity price (Only C1 is closed (see Figure 20)).
Grid-PVP-battery system
The use of a multi-source system is not only to compensate grid electricity prices during peak hours but also to exploit green and free photovoltaic energy. The priority is always to exploit photovoltaic energy when available to power the load and recharge the battery. Second is to use the battery if its state of charge is sufficient, and lastly is to use grid.
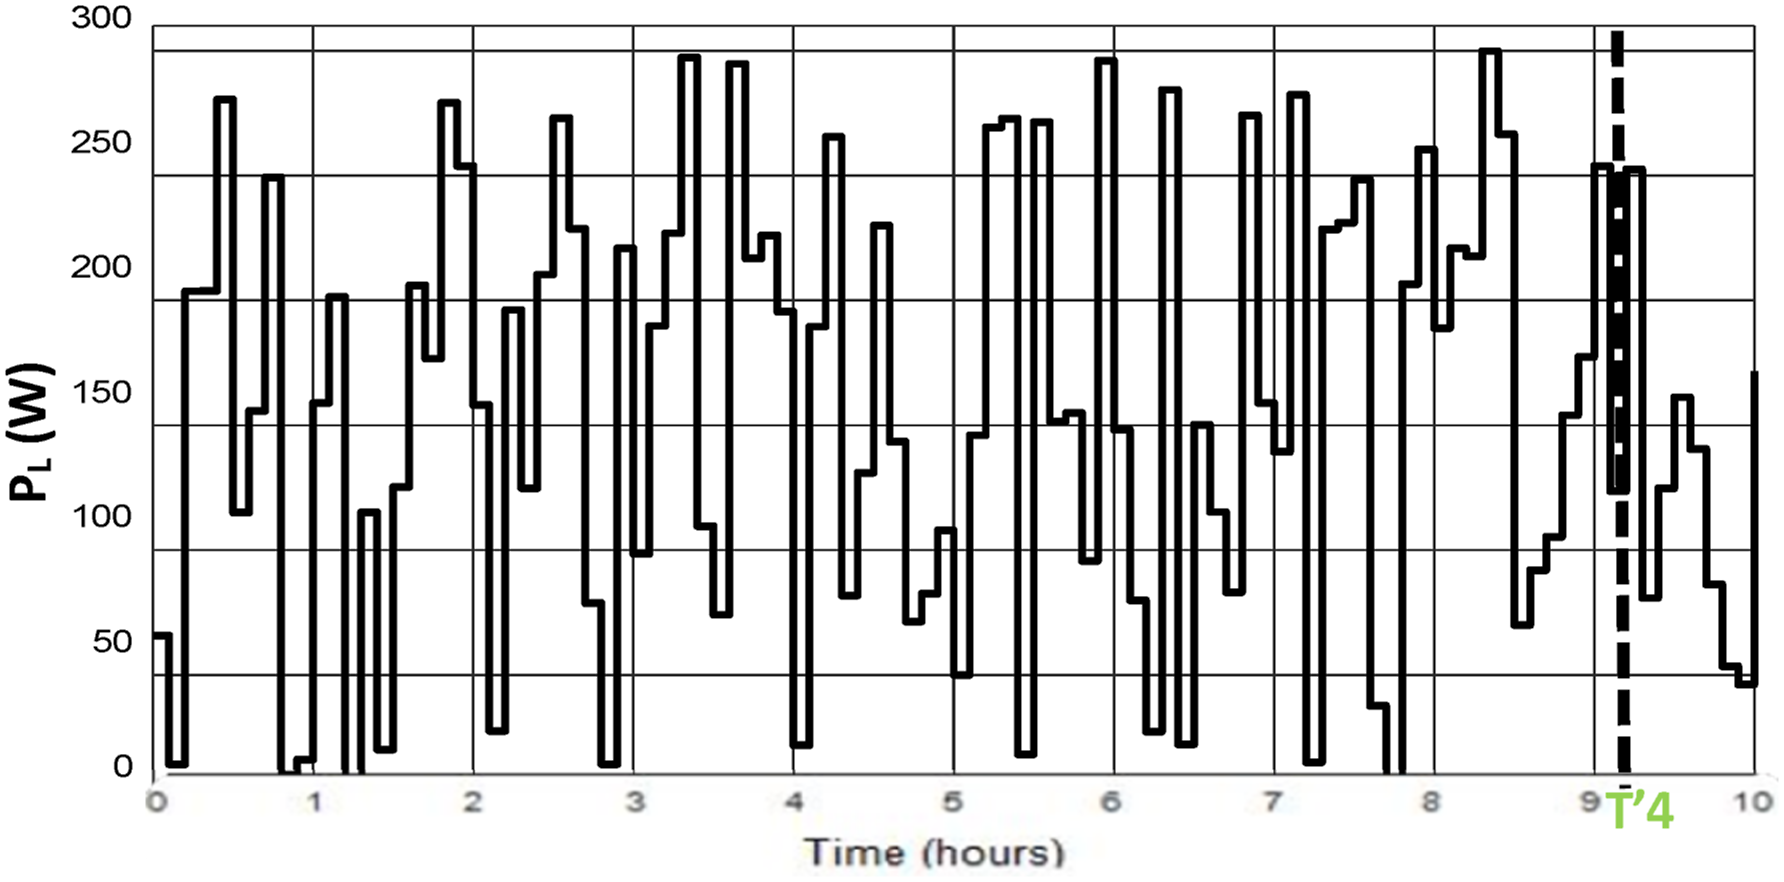
The PVP power and the load power have been shown in Figures 23 and 24, respectively. Photovoltaic panel power PPVP (t). Load power evolution PL (t).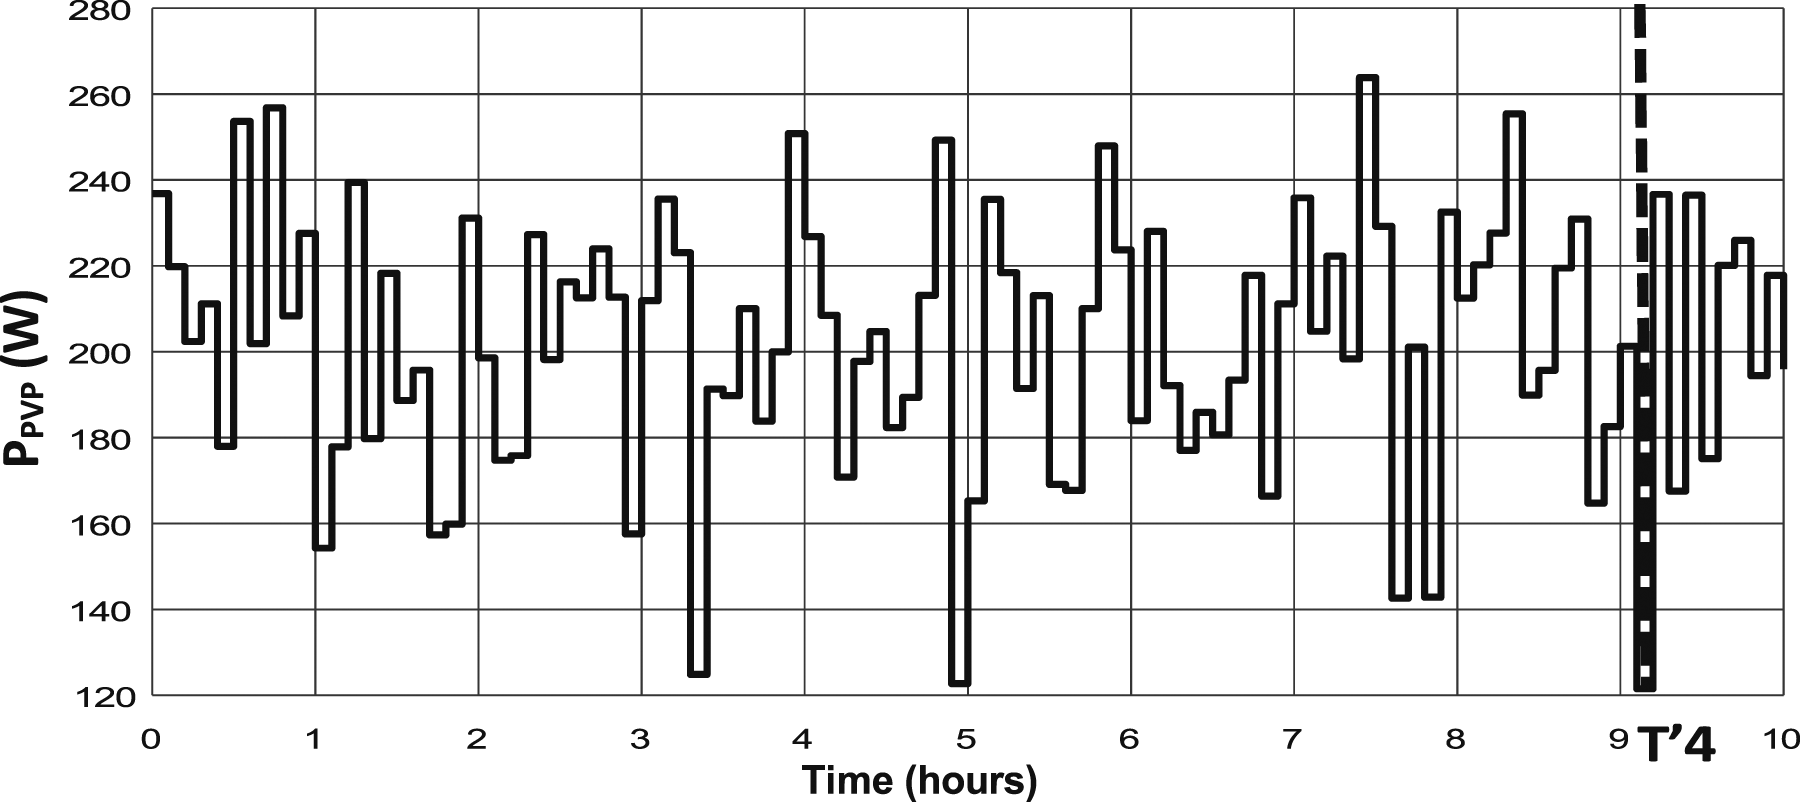
As input data of the second system grid-PVP-battery, the electricity price (Price (t)), varies from 0 to 0.5€/kW (Figure 18), the battery state of charge (SOC(t)) variation from 0 to 90% (Figure 19), as well as the normalized difference power index DP (Figure 25). The power difference 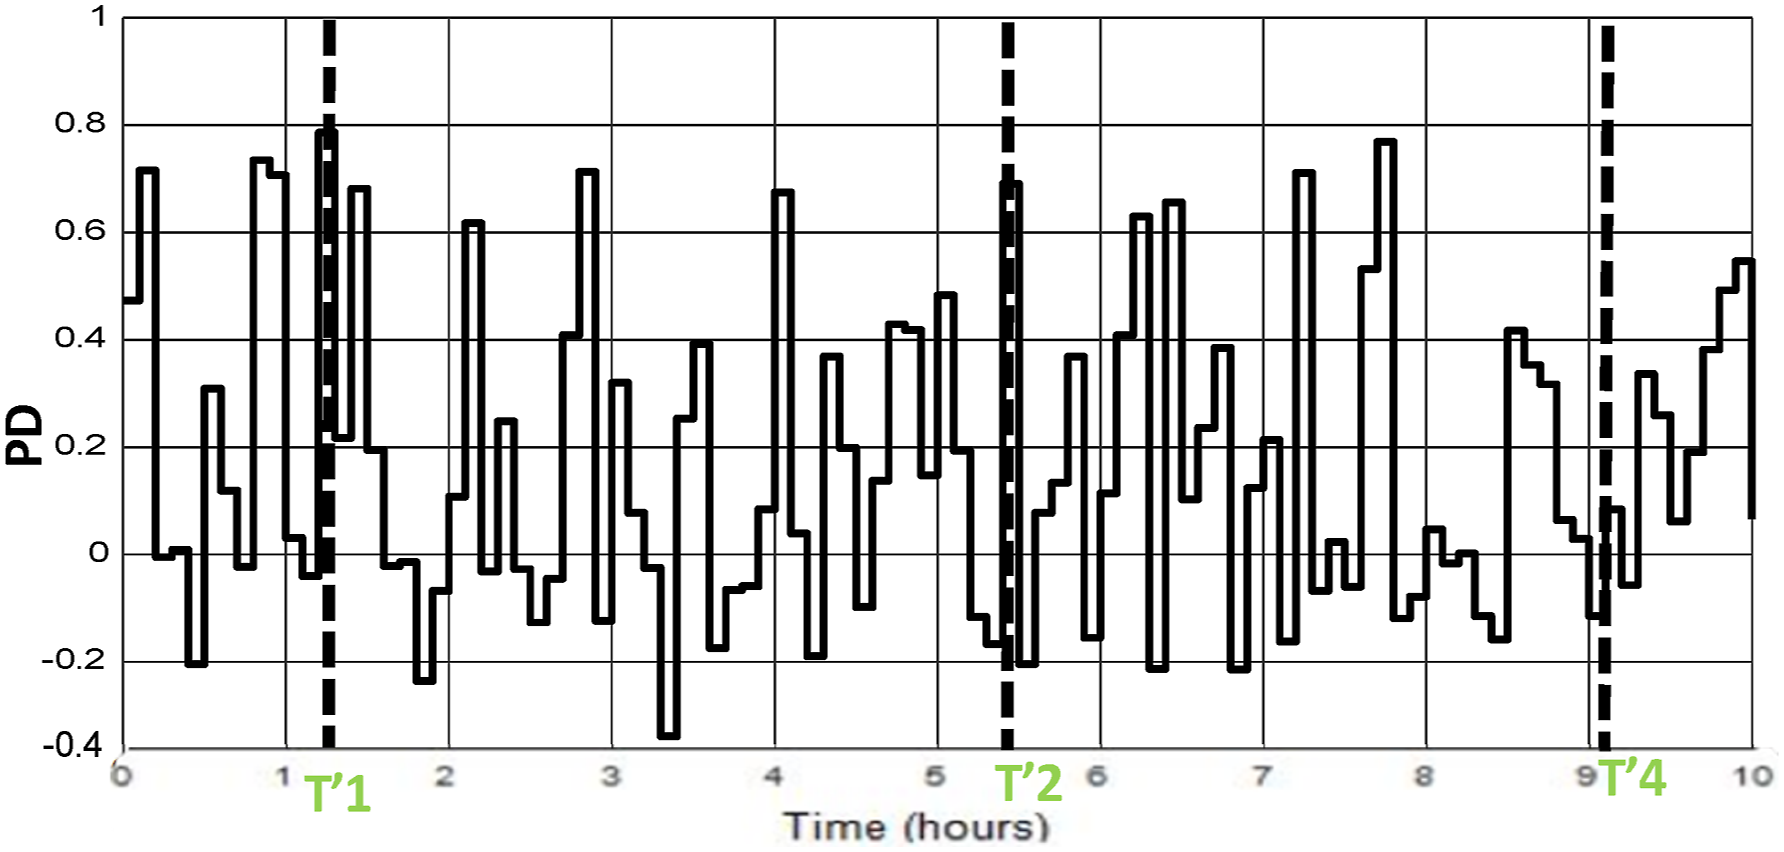
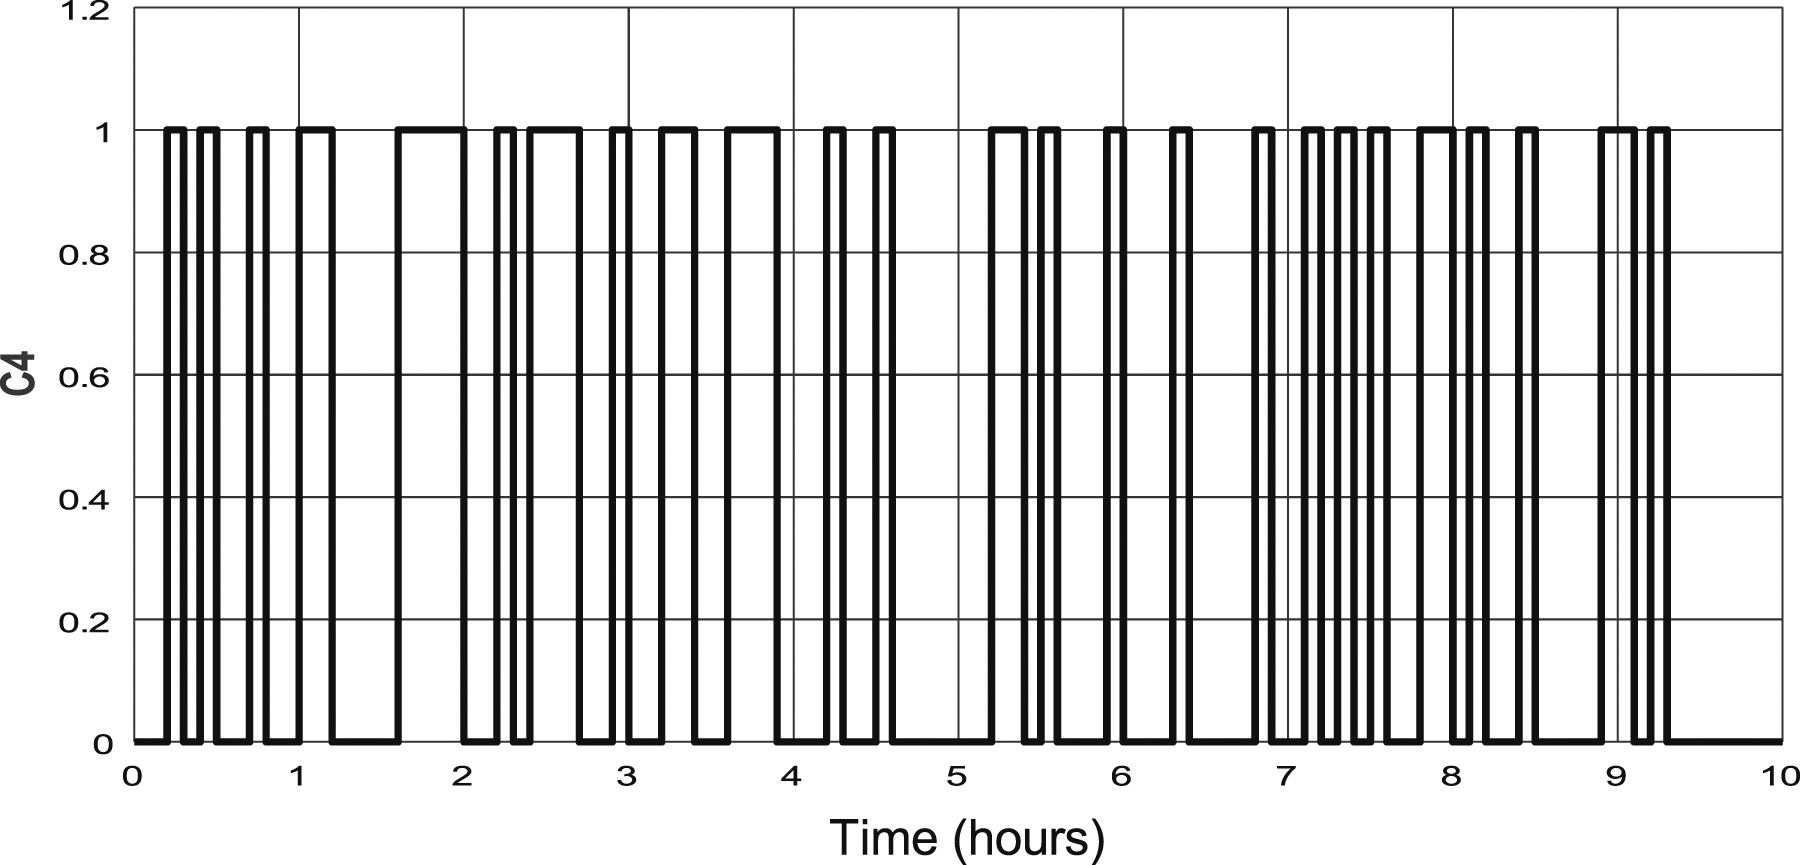
Figs. 26–29 show the states of switches C1 (PVP-load), C2 (grid-load), C3 (PVP- battery), and C4 (battery-load), respectively. Switcher 1 (C1) evolution. Switcher 2 (C2) evolution. Switcher 3 (C3) evolution. Switcher 4 (C4) evolution.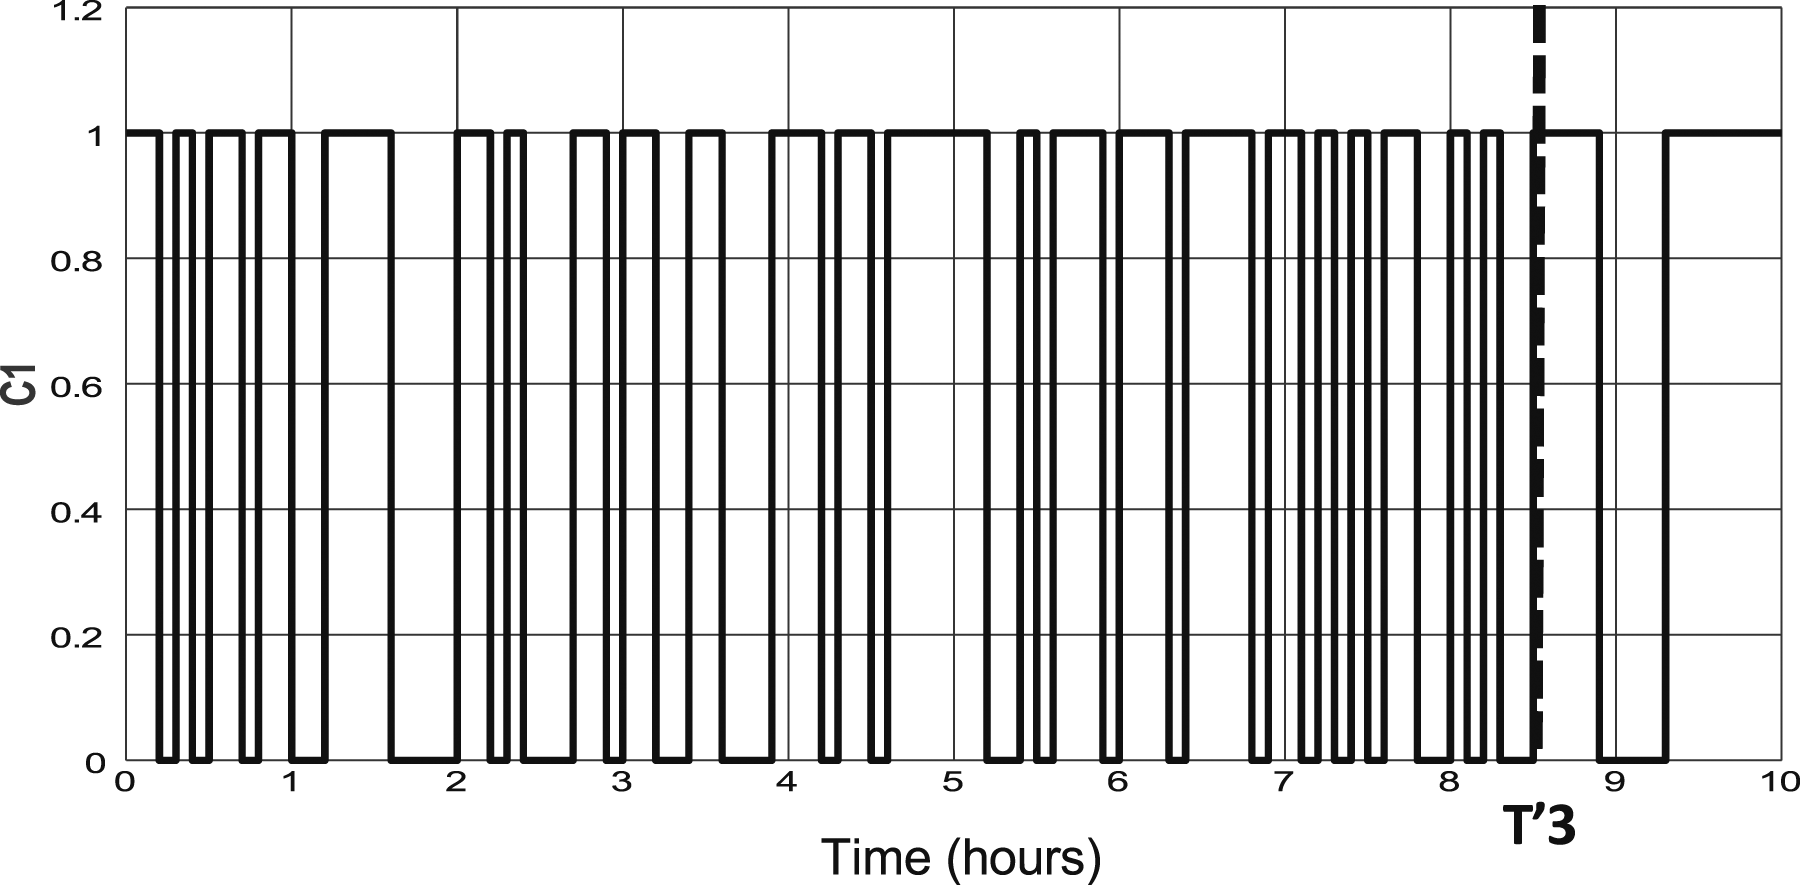
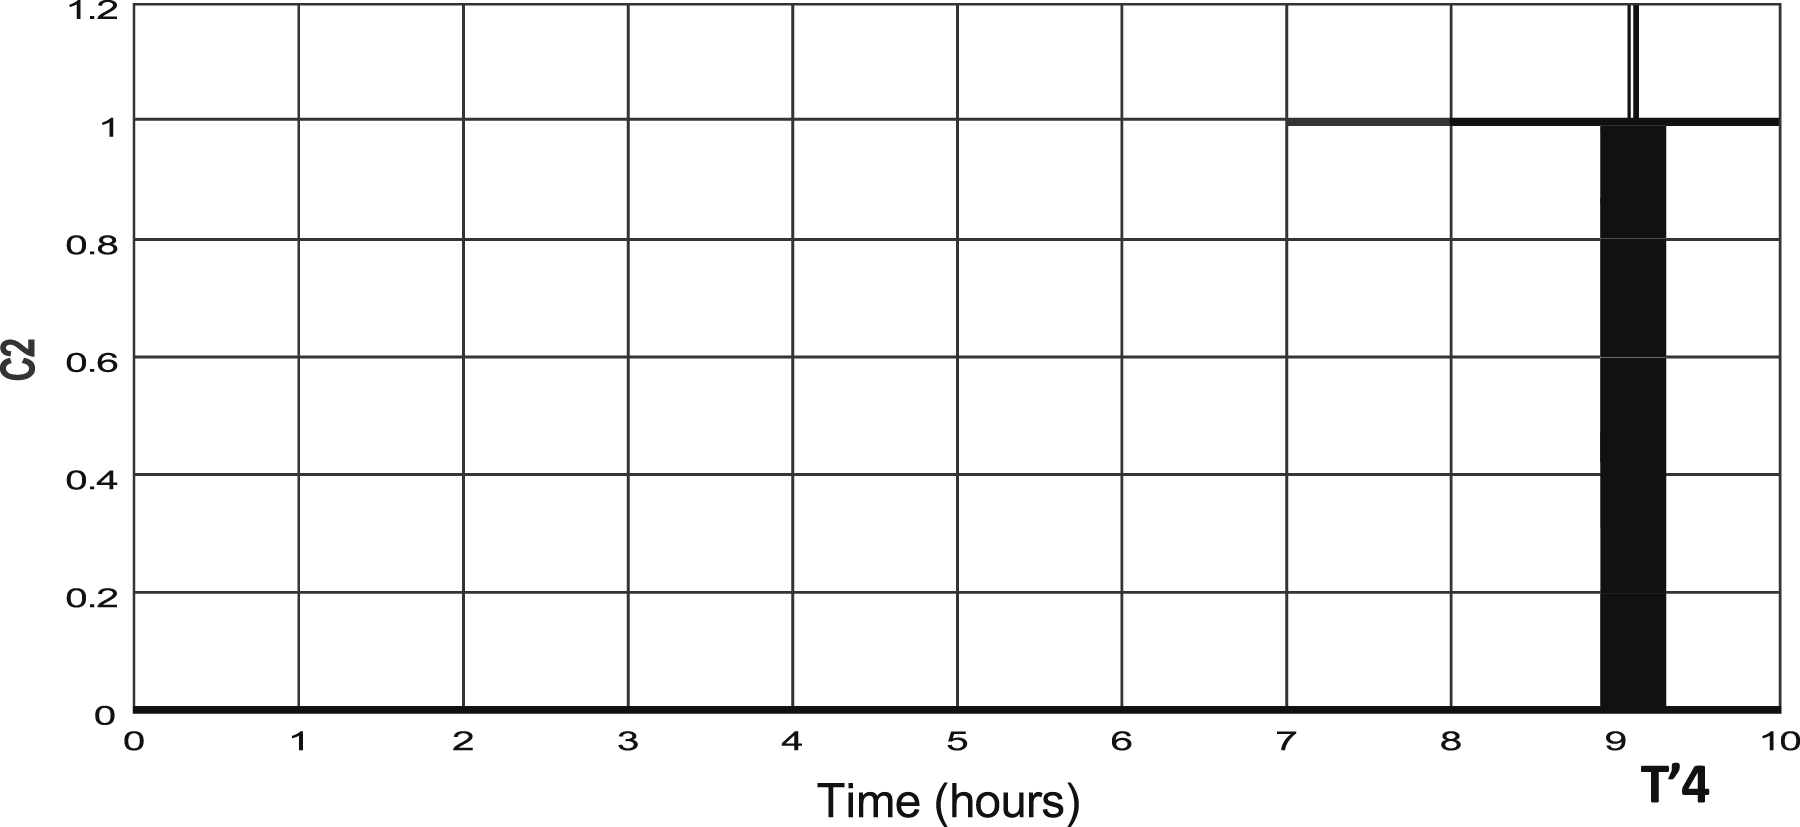
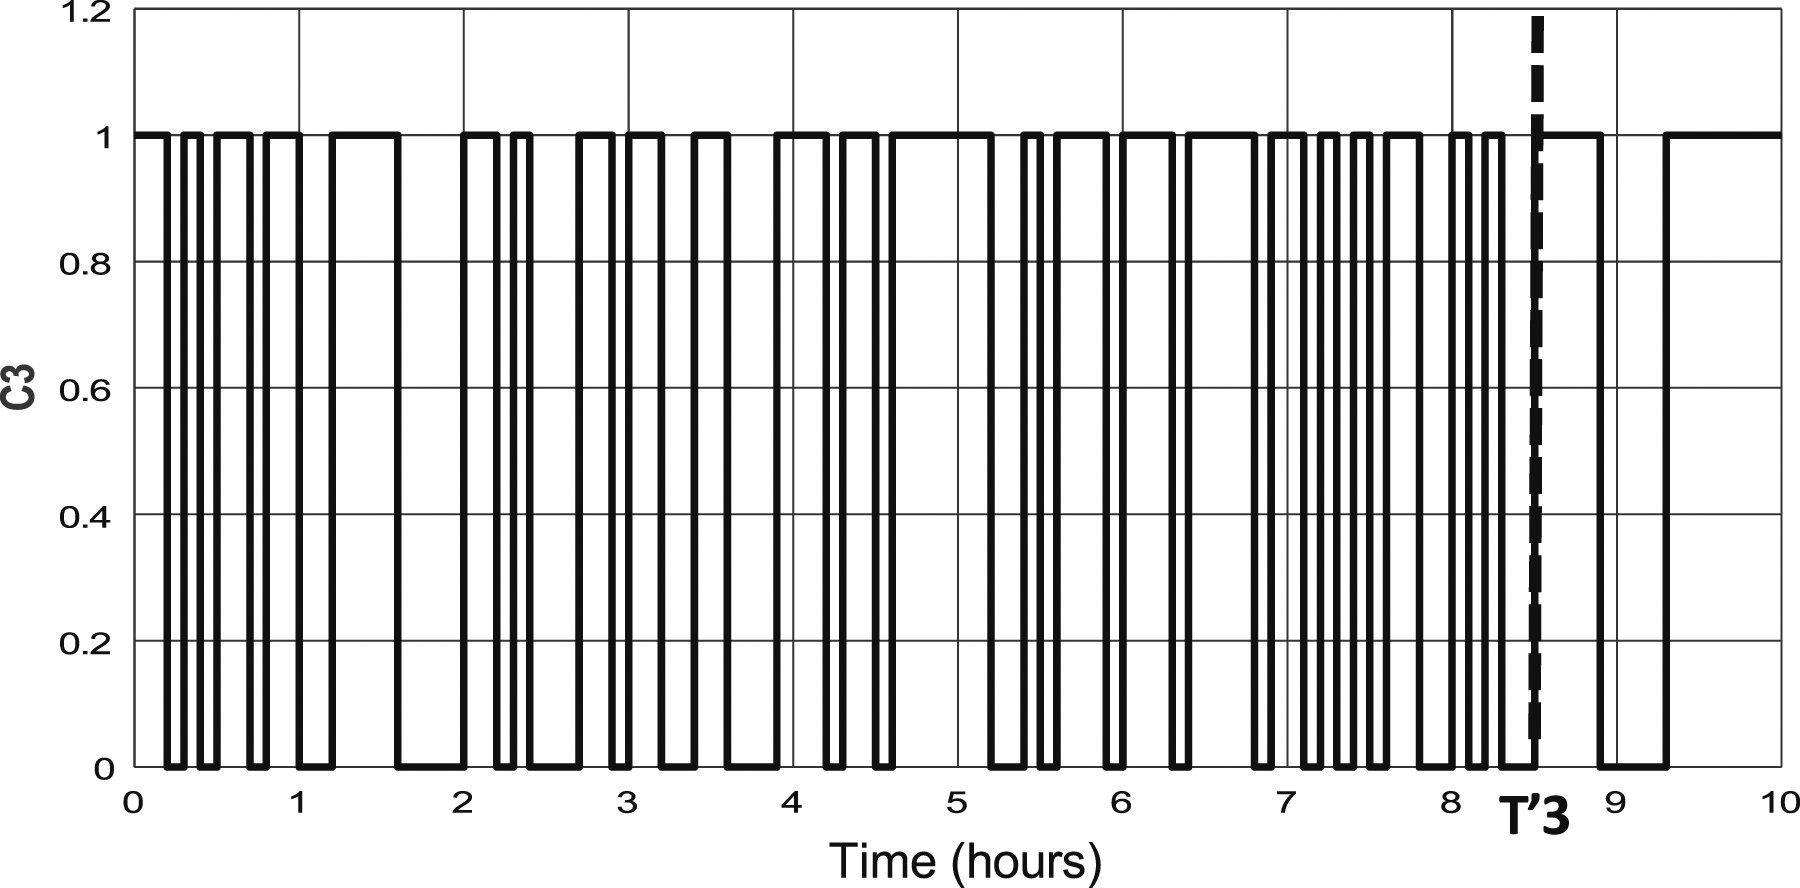
The energy management strategy in the grid-battery system pursue the following approach, if the PPVP is low, the SOC of the battery is low (<0.5) and the price is low then C1, C3 and C4 are opened and only C2 is closed. It’s clear that C2 is opened except during the interval T′4. Thus, the use of the grid to supply the load is done for a very short period (0.1 h = 6 mn). Therefore, the main objectives were been achieved. Firstly, the load is still powered.
Second, the PVP has been used as much as possible (C1 is closed), which can lead to system cost reduction since the PVP has a very low cost, example the slots time T′1 and T′2. Moreover, C1 and C3 evolutions are identical (we can cite the slot time T′3), indeed, while supplying the load, the PVP is the only source used to recharge the battery. Also, C1 and C4 curves evolve in an opposite way. Therefore, when the PVP is not available or when there is bad weather, such as days with cloudy skies, the battery is also utilized to sustain the demands if SOC is high (>0.5). Finally, the proposed strategy is effective, not only, in the energy resources scheduling to meet the load, but also, for the system cost reduction.
Conclusion
This paper dealt with a smart grid system containing the traditional grid, the PVP, and the battery. The main objectives were to propose an optimal sizing, based on the HOMER software technique in order to get an efficient system with minimum cost. Second, Also, an energy management strategy, based on the Fuzzy logic flow, has been adopted to ensure the power resources scheduling in order to keep a continuous equilibrium supply-demand of electricity and avoid instabilities in the grid, with guaranteeing a minimum cost of electricity. The simulation results prove that the HOMER software technique is effective to determinate that the (grid-PVP-battery) configuration is the most reliable and costless one. Also, results confirm the efficiency of the proposed energy management strategy by studying two smart grid configurations (grid-battery, grid-PVP-battery) using time-varying price electricity to solve the instant decision problem.
Footnotes
Declaration of conflicting interests
The author(s) declared no potential conflicts of interest with respect to the research, authorship, and/or publication of this article.
Funding
The author(s) disclosed receipt of the following financial support for the research, authorship, and/or publication of this article: The authors acknowledge “Researchers Supporting Project number (RSPD2024R685),” King Saud University, Riyadh, Saudi Arabia.”
Author biographies
Appendix
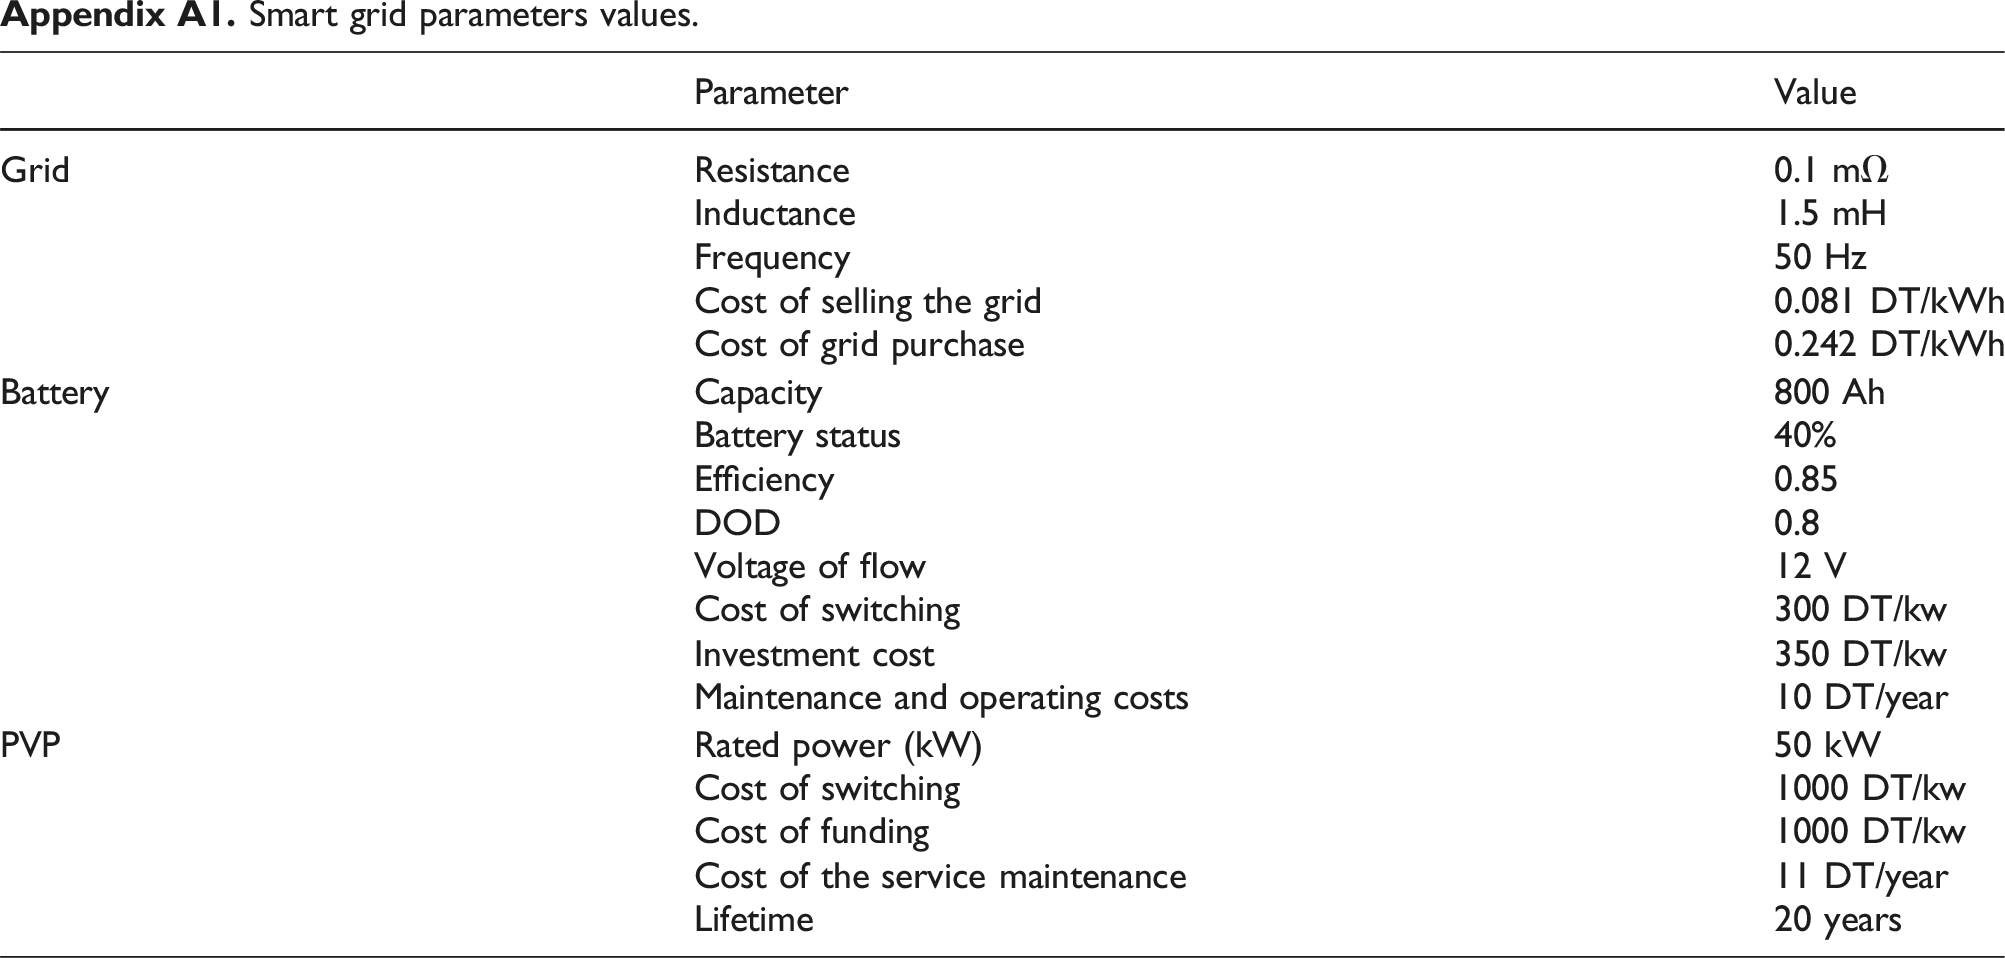
Parameter
Value
Grid
Resistance
0.1 mΩ
Inductance
1.5 mH
Frequency
50 Hz
Cost of selling the grid
0.081 DT/kWh
Cost of grid purchase
0.242 DT/kWh
Battery
Capacity
800 Ah
Battery status
40%
Efficiency
0.85
DOD
0.8
Voltage of flow
12 V
Cost of switching
300 DT/kw
Investment cost
350 DT/kw
Maintenance and operating costs
10 DT/year
PVP
Rated power (kW)
50 kW
Cost of switching
1000 DT/kw
Cost of funding
1000 DT/kw
Cost of the service maintenance
11 DT/year
Lifetime
20 years