
Abstract
This article reviews the risk-adjustment models underpinning the National Healthcare Safety Network (NHSN) standardized infection ratios. After first describing the models, the authors focus on hospital intensive care unit (ICU) designation as a variable employed across the various risk models. The risk-adjusted frequency with which ICU services are reported in Medicare fee-for-service claims data was compared as a proxy for determining whether reporting of ICU days is similar across hospitals. Extreme variation was found in the reporting of ICU utilization among admissions for congestive heart failure, ranging from 25% in the lowest admission hospital quartile to 95% in the highest. The across-hospital variation in reported ICU utilization was found to be unrelated to patient severity. Given that such extreme variation appears in a designation of ICU versus non-ICU utilization, the NHSN risk-adjustment models’ dependence on nursing unit designation should be a cause for concern.
Keywords
In the United States, 3300 acute general care hospitals paid under the Medicare fee-for-service program through the Inpatient Prospective Payment System (IPPS) are subject to performance evaluation (and payment adjustment) for the value-based purchasing (VBP) program and the Hospital-Acquired Complication Reduction Program (HACRP). Together the VBP and HACRP are responsible for reallocating more than $2 billion of hospital payments.1,2 Performance measure scoring and subsequent payment adjustments are complex but take as their basis several common measures of hospital-acquired infections (ie, central line-associated bloodstream infection [CLABSI]) that are shown in Table 1.
Shared National Healthcare Safety Network (NHSN) HACRP and VBP Measures. a
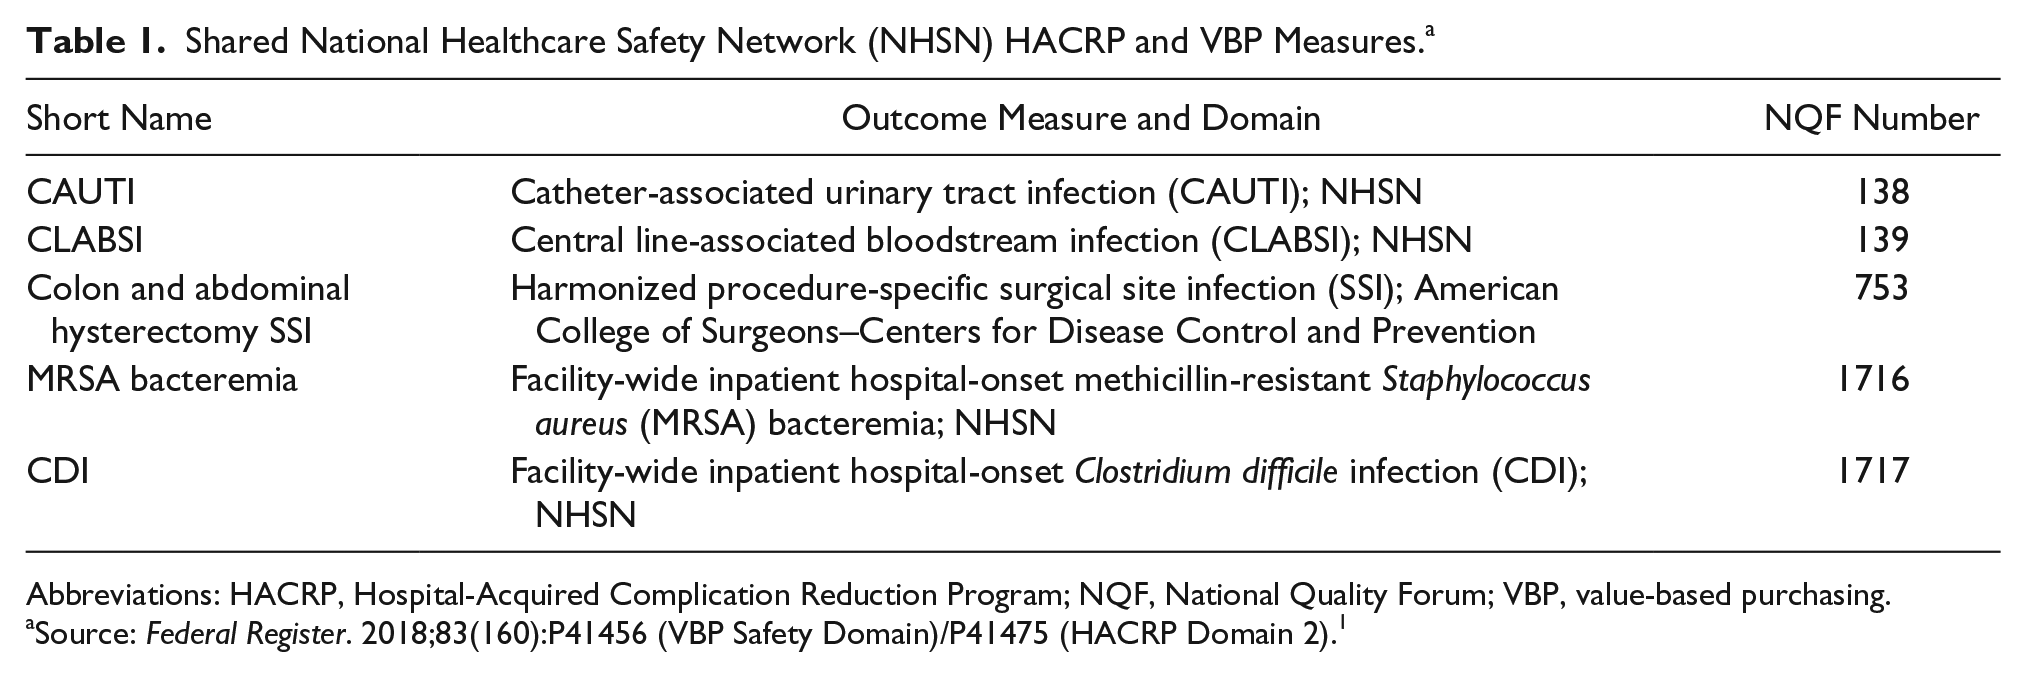
Abbreviations: HACRP, Hospital-Acquired Complication Reduction Program; NQF, National Quality Forum; VBP, value-based purchasing.
Source: Federal Register. 2018;83(160):P41456 (VBP Safety Domain)/P41475 (HACRP Domain 2). 1
The 5 measures shown in Table 1 constitute Domain 2 of the HACRP and the Safety Domain of the VBP. The measures have been constructed by (and are maintained by) the Centers for Disease Control and Prevention (CDC) National Healthcare Safety Network (NHSN). 3 Each measure is risk adjusted to calculate a standardized infection ratio (SIR) for comparison across hospitals. Risk adjustment is intended to control for variation in the rate of observed infections that may be attributed to factors outside of hospital control that may affect comparison of hospital performance. The risk-adjustment models vary by measure, but there is consistency in approach for 4 of the 5 measures shown in Table 1 (the exception being the surgical site infection [SSI] measure), each of which employ hospital-reported bed counts, teaching status, and bed size from the annual CDC survey. 4 An additional risk-adjustment variable common to the measures is that of patient care location, which is established by each hospital (following CDC guidelines) and then reported to the CDC through the NHSN event monitoring system. 5 The regression coefficients calculated for each measure’s risk-adjustment model are summarized in Table 2 and, where possible, shown with overlap in Supplementary Appendix 1. 6
NHSN Bed Size Coefficients and CIs for CLABSI, CAUTI, MRSA, and Clostridium difficile 2018. a
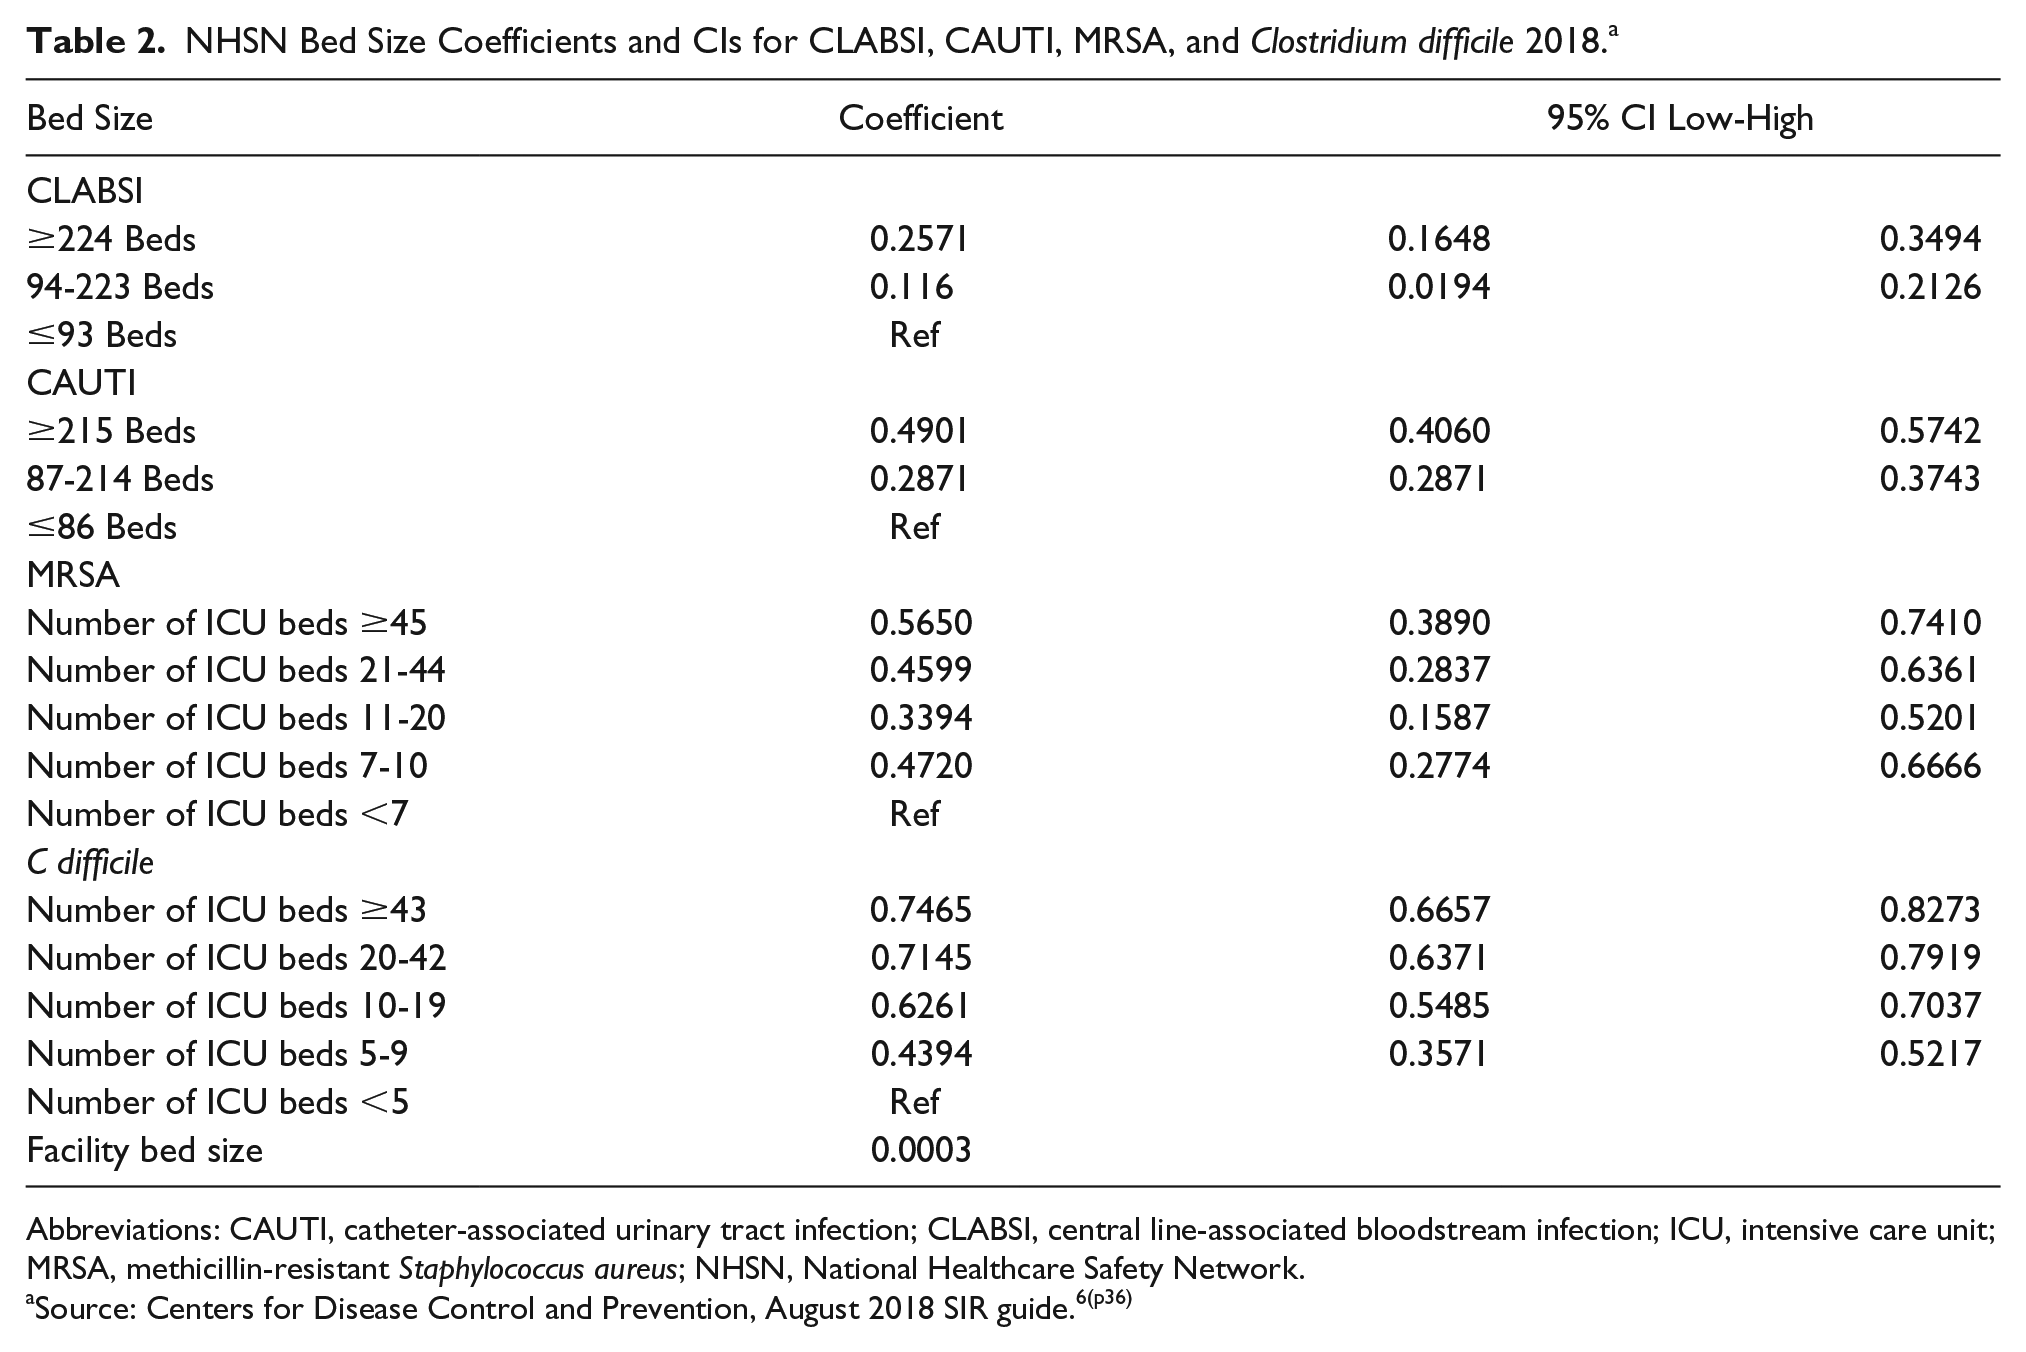
Abbreviations: CAUTI, catheter-associated urinary tract infection; CLABSI, central line-associated bloodstream infection; ICU, intensive care unit; MRSA, methicillin-resistant Staphylococcus aureus; NHSN, National Healthcare Safety Network.
Source: Centers for Disease Control and Prevention, August 2018 SIR guide.6(p36)
The risk-adjustment model(s) used in the NHSN SIR calculations raise 3 major concerns. First, the variables used to account for risk in the NHSN measures represent facility characteristics rather than patient risk factors. When the NHSN risk model identifies those facilities with more beds as having a greater risk of infections (ie, a positive coefficient for bed size), it seems at odds with a culture of patient safety to risk adjust that increased risk away. There has been a long-standing concern that smaller facilities pose a patient risk through treating low surgical volumes. 7 Although the merits of the low-volume hypothesis have been argued widely for many years, it has never been suggested that, if true, those differences should be adjusted away so that smaller hospitals can be granted the appearance of performing more favorably. Yet this is precisely the implication presented by the volume variable in NHSN models. One also should assess whether a hospital is truly being held harmless for size-related effects, or is size simply correlated with other unmeasured (and unspecified) variables that have an effect on infection rates? Although patient volume has prominence in the NHSN risk models, there is no inclusion of individual patient complexity or reason for patient admission. Studies have shown that patient comorbidities add significantly to the existing NHSN risk models that depend solely on non-patient characteristics.8,9
Second, it is assumed that when creating the risk-adjustment model, the developers considered hospital size (total beds), teaching school affiliation, nursing unit, and number of intensive care unit (ICU) beds to be important factors worthy of inclusion. The 4 measures shown in Table 1 (excluding SSI) include these concepts yet classify hospitals within the individual risk categories differently (Supplementary Appendix 1). For example, the CLABSI and catheter-associated urinary tract infection (CAUTI) measures use different NHSN-designated aggregations of nursing unit; both CLABSI and CAUTI consider Major Teaching and Graduate Teaching hospitals as risk categories, whereas the methicillin-resistant Staphylococcus aureus (MRSA) measure replaces Graduate Teaching with “Other” Teaching, with the Clostridium difficile measure simply having a teaching (vs nonteaching) category; the CLABSI measure identifies large hospitals as having ≥224 beds, whereas the CAUTI measure begins the category at ≥215 beds. There are many more examples of these inconsistencies, but put simply, if a concept of large or teaching is being employed to adjust for risk, then why should it be classified differently across measures?
Third, coefficients obtained from the regression models show internal inconsistency. For example, the relationship between ICU beds and the predicted number of MRSA events shows a pattern of increase and decrease across the specified ranges of ICU beds. Furthermore, the CIs for the individual coefficient results overlap, meaning that the coefficient for one category is not found to be statistically differentiated from that of another at the level of confidence for the statistical test. These issues are highlighted in Table 2.
Table 2 reports the variable descriptions for bed size variables, their associated model coefficients, and 95% CIs based on their reported standard errors. The inconsistency of category determination across measures is observed immediately. The CIs for CLABSI, MRSA, and C difficile coefficients can be observed as overlapping, whereas the monotonically increasing number of adverse events for ICU and total reported hospital beds projected in the C difficile, CLABSI, and CAUTI models is replaced by a U-shaped relationship in the MRSA model.
SIR ratios take the product of the regression coefficients and the number of “at risk” units (eg, central line days) to generate a standardized number of adverse events (eg, CLABSI) that may be compared to the observed number of events. Thus, for the example of CLABSI, a cardiac care unit (CCU) is standardized to predict 38.5% more CLABSI events per central line day than the reference patient location (adult mixed acuity ward).
In addition to questions of the appropriateness of the choice of risk-adjustment variables is the concern that self-reported variables such as the designation of CDC location (a standardized patient care location using an NHSN mapping algorithm) for hospital units may be variable. In order for SIR calculations to be truly “standardized,” the assignment of CDC location across hospitals, in particular the designation of ICU and CCU beds, must be consistent, or else the risk-adjustment model is compromised.
Given the sensitivity of SIR ratios to the designation of patient care location, the large amount of money reallocated as a result of SIR comparison under the VBP and HACRP, and the absence of studies assessing the consistency of patient care location assignment across hospitals, this article provides a measure of the consistency with which hospitals designate patient care locations as ICU or non-ICU. The research team uses Medicare claims data as a proxy for this measure, reasoning that hospitals will consider a patient location similarly when billing for services as when evaluating quality and submitting location data to the CDC. The team compares the rate with which ICU is billed on claims data for congestive heart failure (CHF) admissions and reviews across-hospital variation in ICU utilization after accounting for variation in ICU utilization that results from differences in patients’ clinical risk.
Methods
The research team obtained financial year 2016 (FY2016) Medicare fee-for-service claims spanning October 1, 2015, through September 30, 2016. The team retained claims for hospitals paid under the IPPS and grouped claims under Version 36 of the All-Patient Refined Diagnosis-Related Group (APR-DRG) classification system. Cases identified as transfers (discharge disposition = 2) and flagged cases in which patients died (discharge disposition = 20) were excluded for subsequent analysis.
To identify patient admissions reported as receiving days in ICUs, the research team flagged a claim as ICU if any claim charges were made for a revenue center code listed in Supplementary Appendix 2. The identification of claims for which ICU services are billed is consistent with previous studies of ICU utilization and is the method employed by the Centers for Medicare & Medicaid Services (CMS) to adjust for “intensive day” costs when computing IPPS weights.10,11
To review variation in patterns of ICU designation across hospitals, the analysis was restricted to a single base DRG—APR-DRG 194 CHF—that has a known high level of ICU utilization. The analysis was further restricted to hospitals having at least 100 ICU cases within the claims data. This resulted in the retention of 1374 hospitals and 430 397 CHF cases, of which 270 616 were designated ICU charge present (62.9%) and 159 781 were designated no ICU charge present.
The research team created a list of 27 diagnoses and 9 procedure codes (high-intensity codes) that were expected to be more frequently associated with the need for ICU services. These are shown in Table 3.
ICD-10 Diagnosis and Procedure Codes With Increased Probability of ICU Utilization.
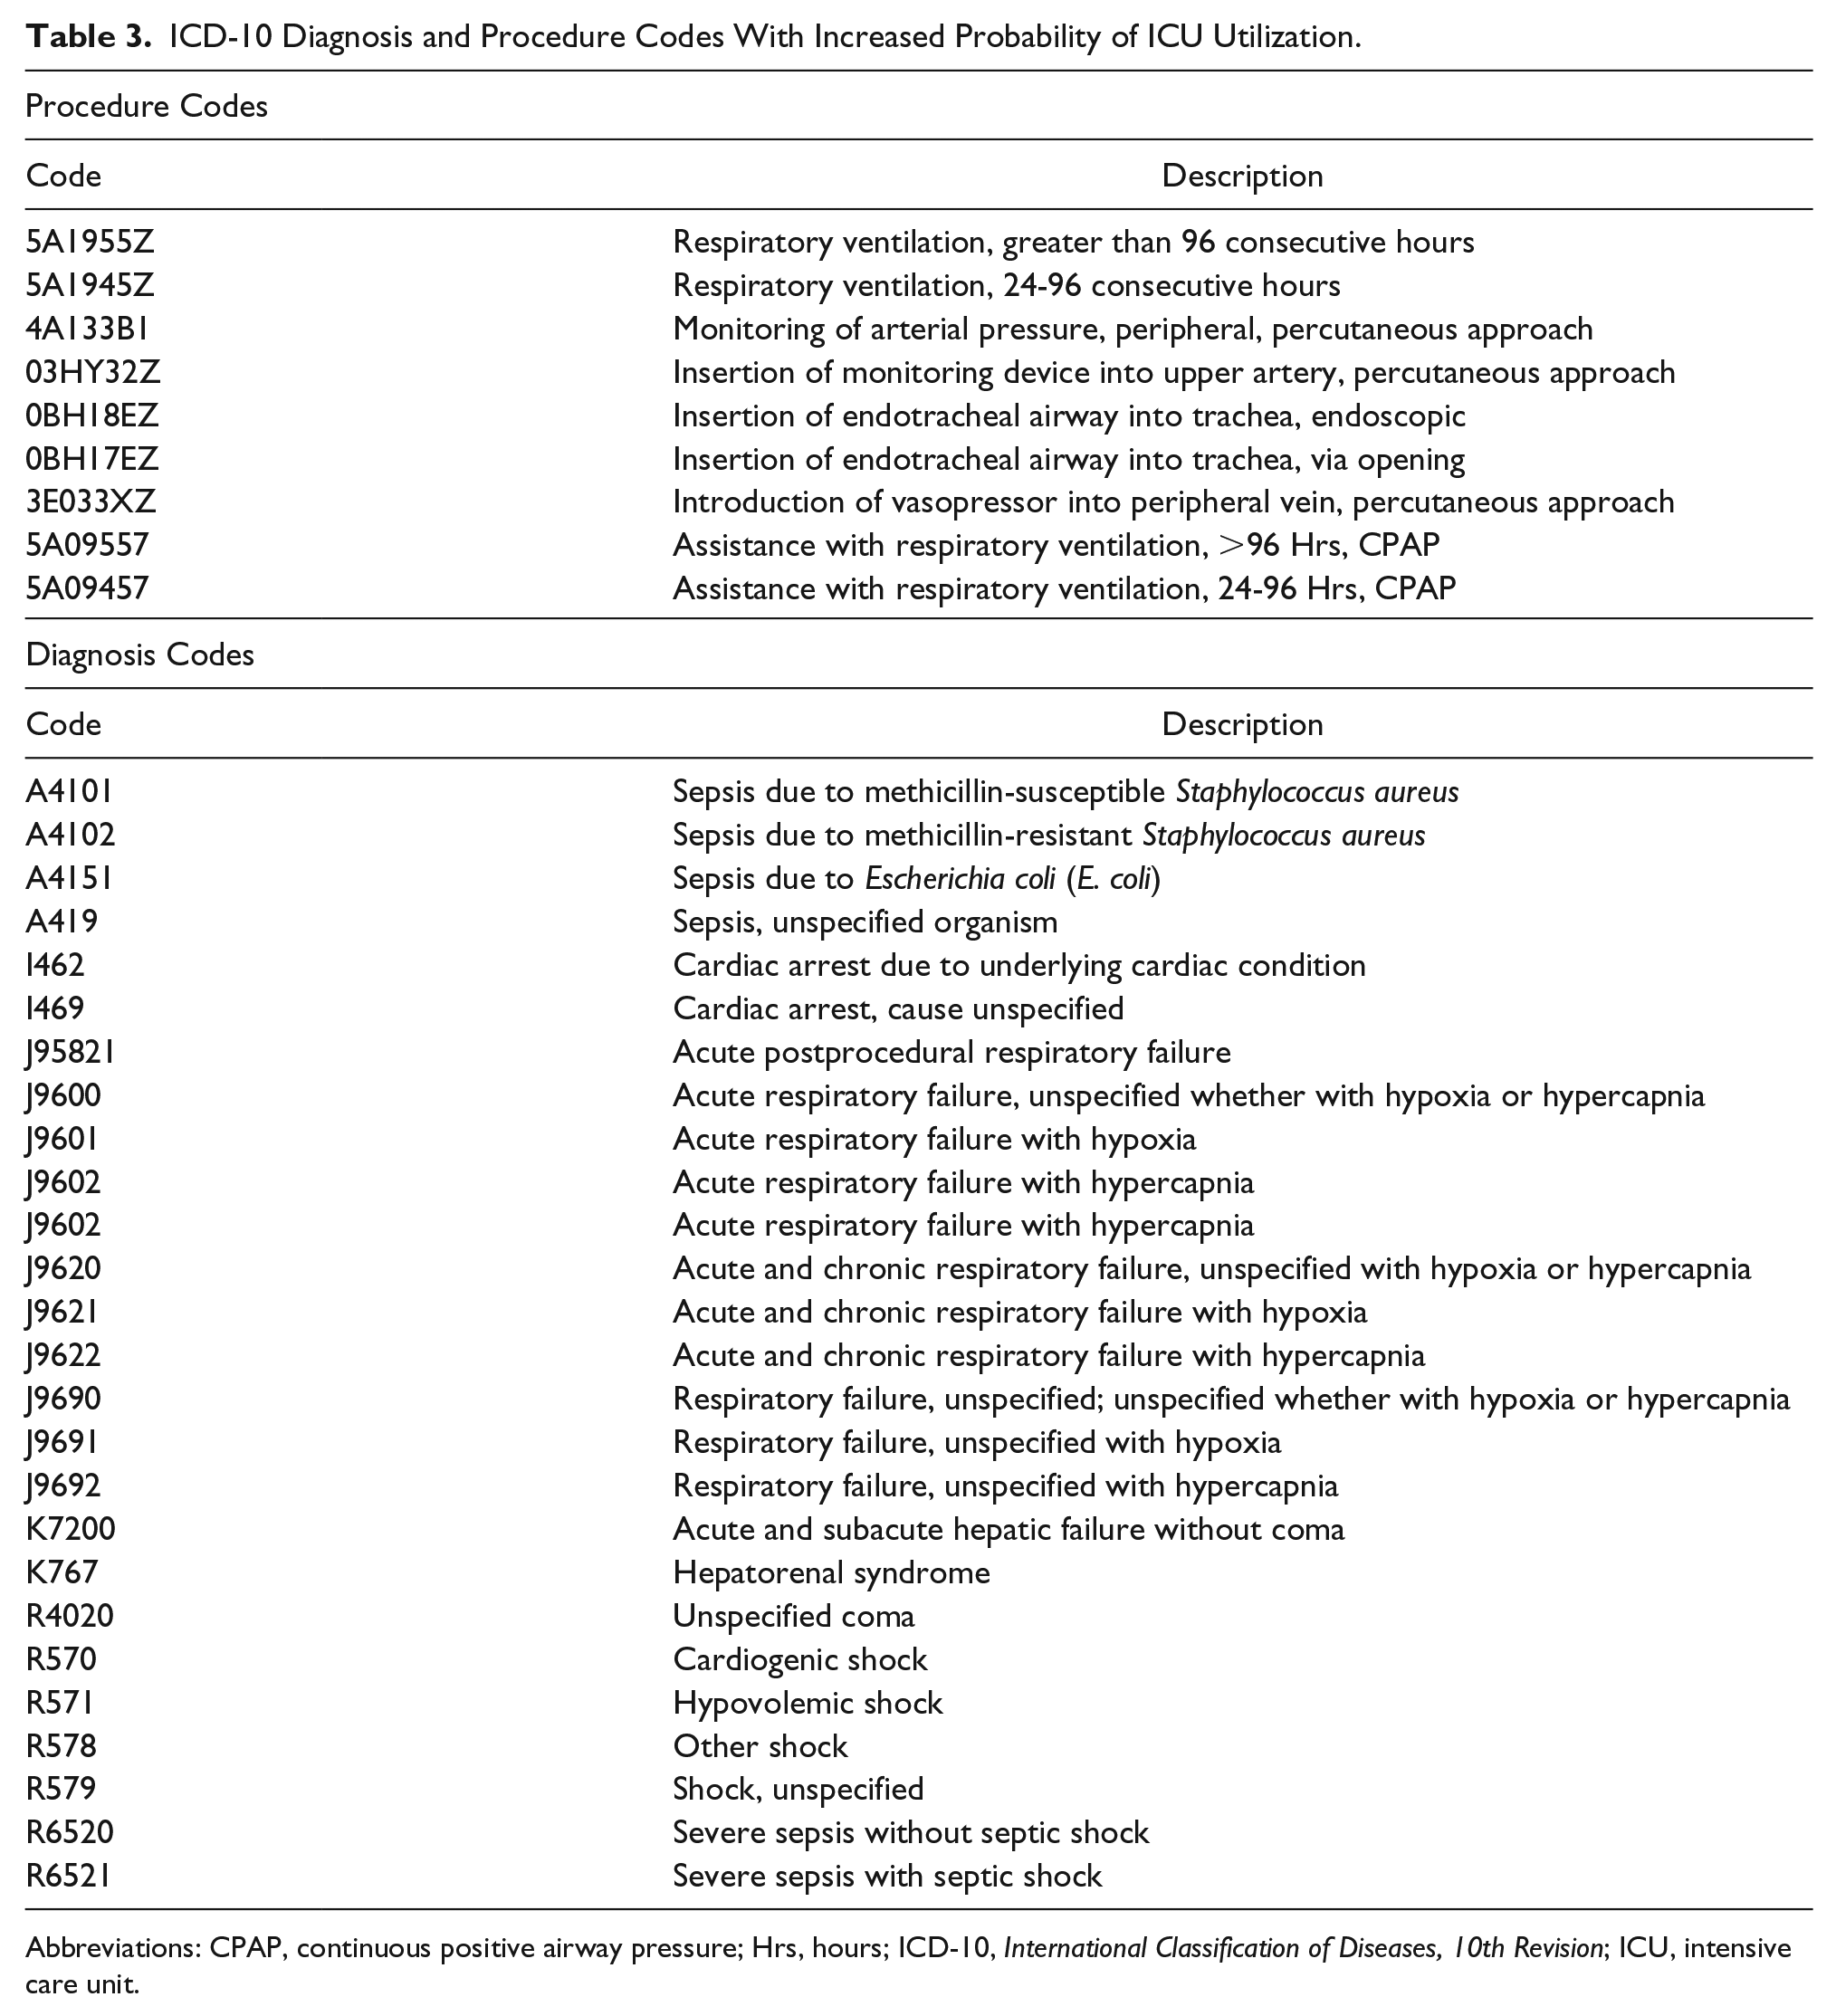
Abbreviations: CPAP, continuous positive airway pressure; Hrs, hours; ICD-10, International Classification of Diseases, 10th Revision; ICU, intensive care unit.
The team compared the frequency of cases with high-intensity codes to the distribution of cases by APR-DRG severity level. Similar stratification comparisons were performed for mortality rates and length of stay. The purpose of this comparison was to confirm that the use of APR-DRG severity leveling provided risk adjustment of ICU need to adjust for differences in patient acuity.
After reviewing the adequacy of risk adjustment, the team reviewed the distribution of ICU and non-ICU cases by hospitals, by severity level to assess whether there were differences in reported ICU utilization and 2 routinely measured patient outcomes: average length of stay (ALOS) and patient mortality.
Results
Table 4 reports the relationship between severity level, outcomes, and the reporting of high-intensity codes for CHF admissions (APR-DRG 194). It can be seen that the highest severity patients, severity level 4, are nearly 3 times more likely to be reported as being admitted to the ICU than non-ICU. Mortality rates, ALOS, and the reporting of associated high-intensity codes also mark the severity level 4 patients admitted to the ICU as a sicker cohort. A similar, though not as extreme, pattern emerges for severity level 3 patients. At the lowest severity levels, severity levels 1 and 2, the intensity of procedures and diagnoses drops rapidly as do ALOS and mortality rates. The cases in these categories combine to outnumber the cases in severity level 4, yet have a markedly different prognosis.
Congestive Heart Failure Severity Level and Admission Characteristics. a
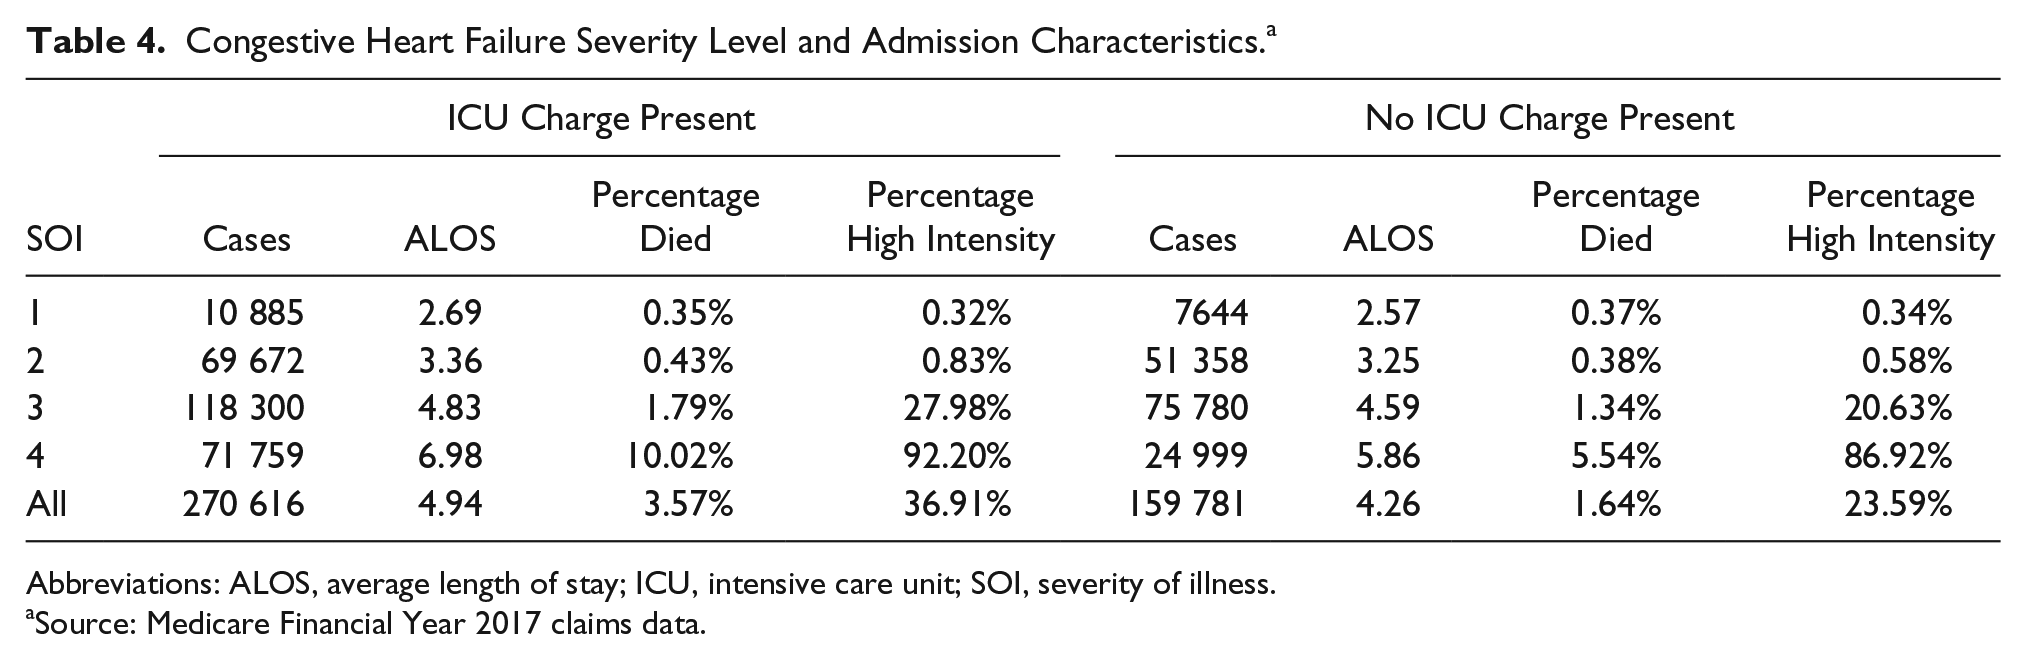
Abbreviations: ALOS, average length of stay; ICU, intensive care unit; SOI, severity of illness.
Source: Medicare Financial Year 2017 claims data.
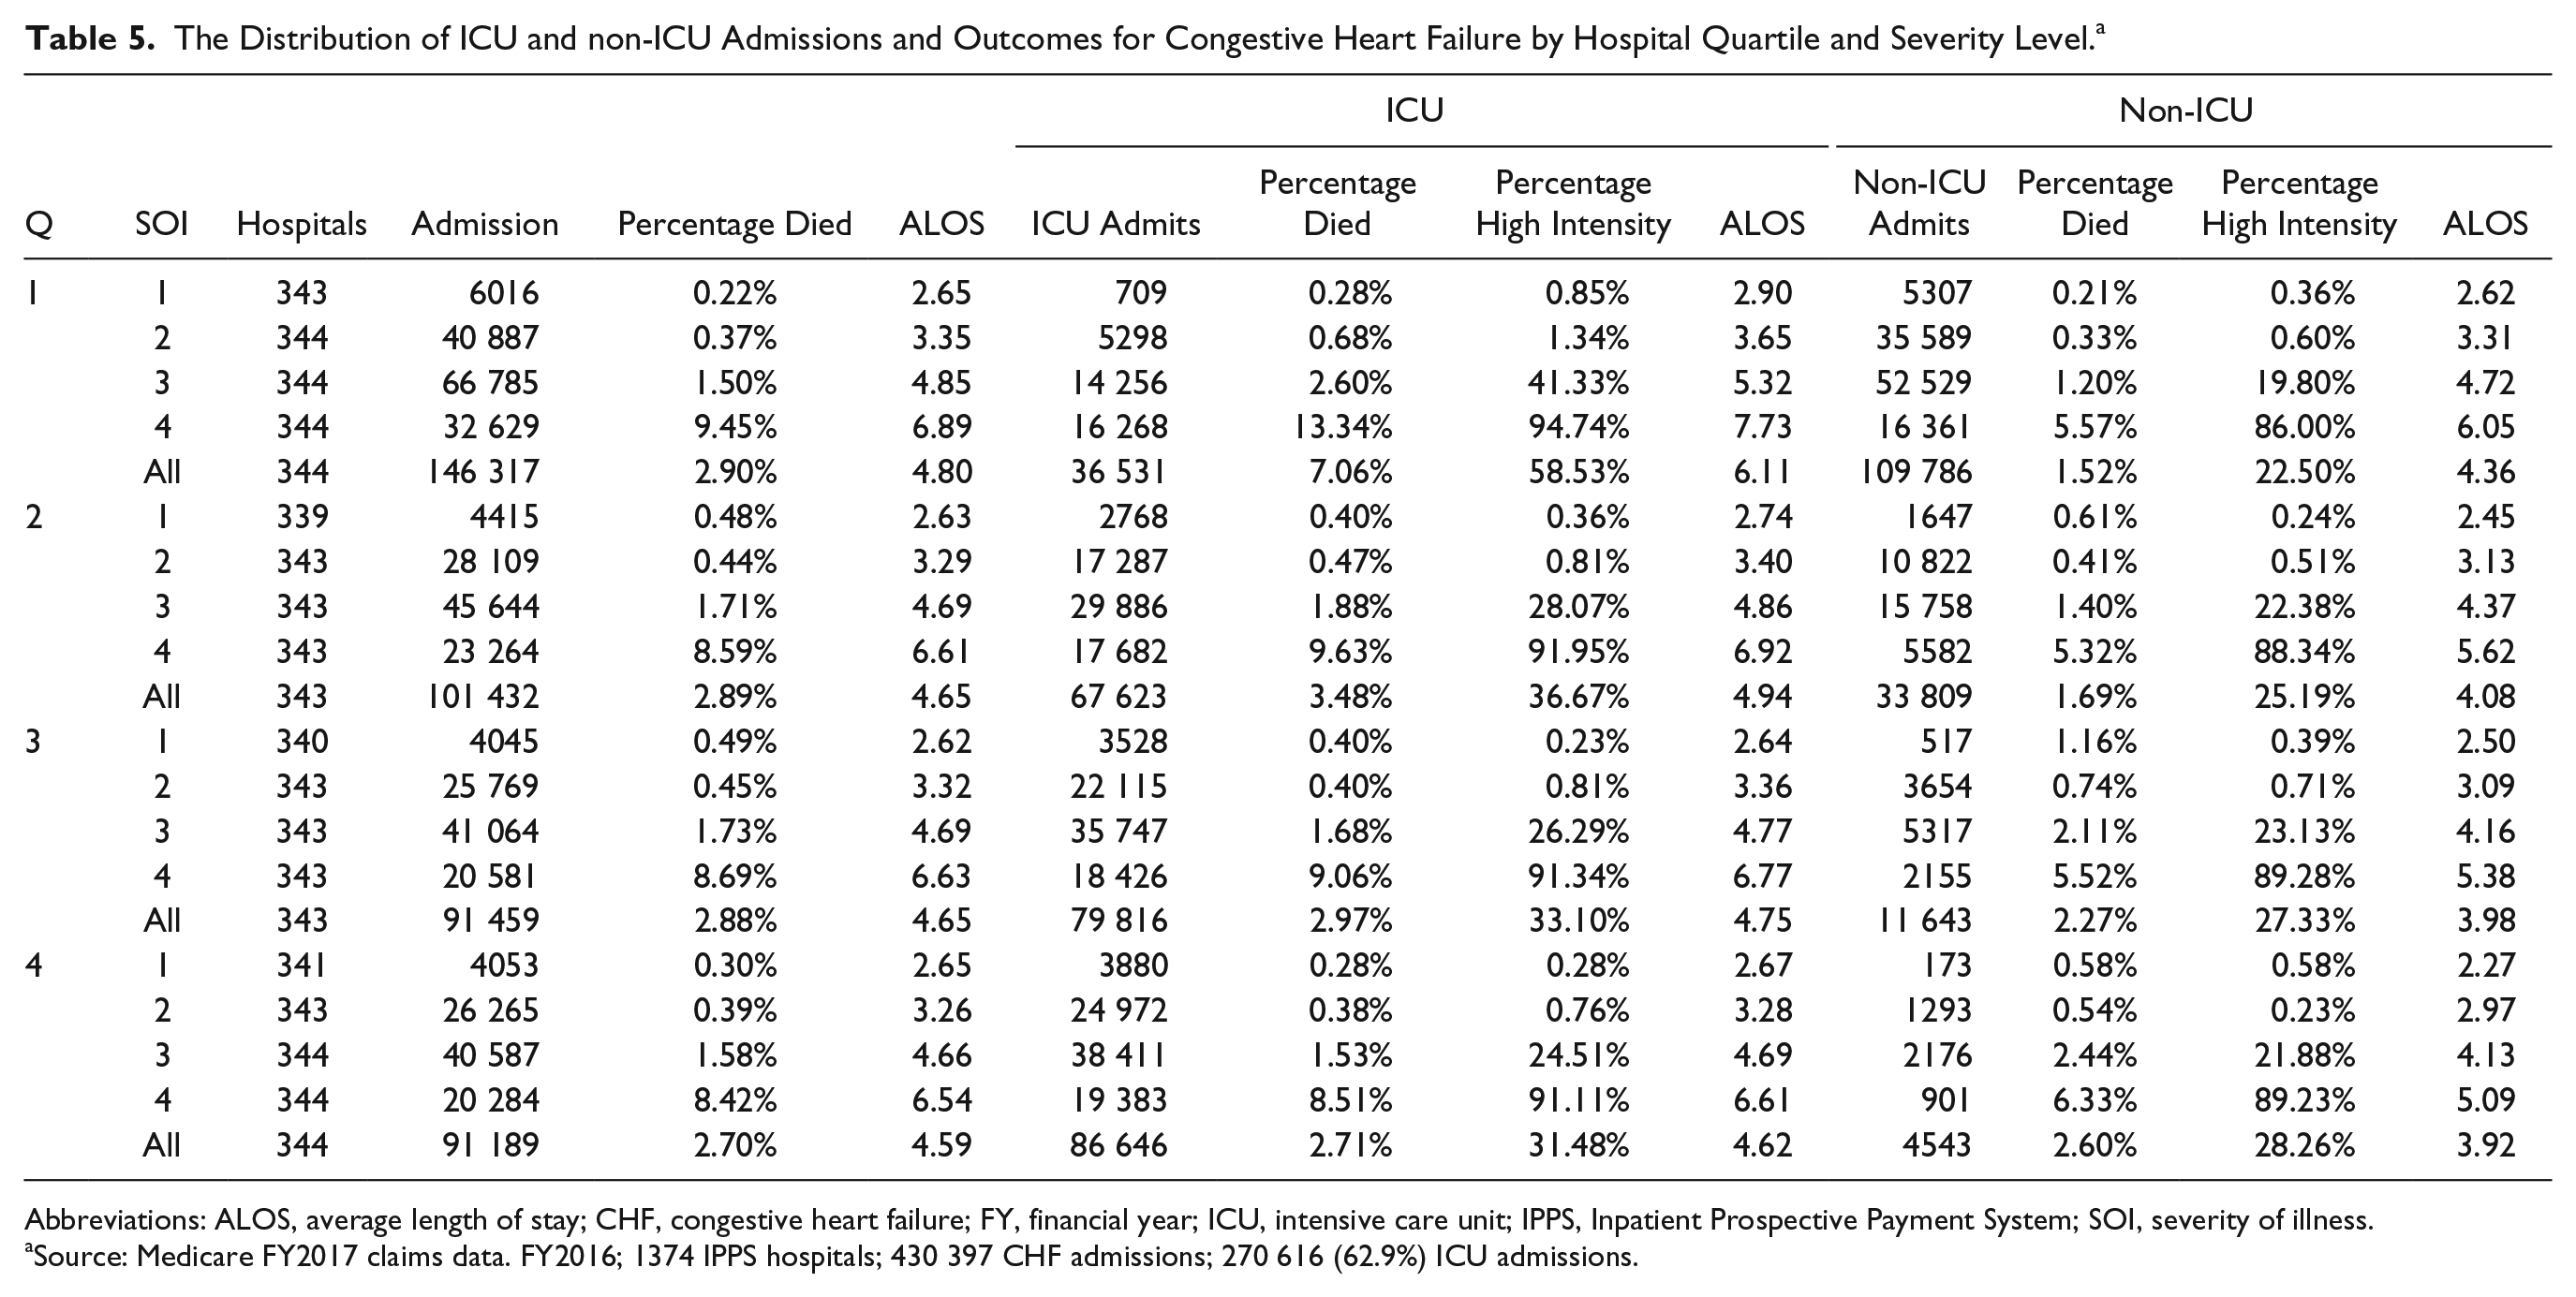
Table 5 sorts hospitals within quartiles by percentage of reported ICU use for CHF admissions. Quartile 1 (Q1) contains hospitals with the lowest percentage of reported ICU admissions (25%) and Q4 the highest (95%). It can be observed that the hospitals in Q1 and Q2 have more admissions per hospital than those in Q3 and Q4, but similar percentages of admissions within each severity level. ALOS and the percentage of deaths at each severity level also are similar.
The Distribution of ICU and non-ICU Admissions and Outcomes for Congestive Heart Failure by Hospital Quartile and Severity Level. a
Abbreviations: ALOS, average length of stay; CHF, congestive heart failure; FY, financial year; ICU, intensive care unit; IPPS, Inpatient Prospective Payment System; SOI, severity of illness.
Source: Medicare FY2017 claims data. FY2016; 1374 IPPS hospitals; 430 397 CHF admissions; 270 616 (62.9%) ICU admissions.
Thus, although one can observe incremental ICU admission frequency by severity level with a corresponding worsening of patient outcomes (ALOS, percentage died), the dramatic variation in the likelihood of reporting ICU use across hospital quartiles is not matched by a corresponding variation in patient outcomes.
To understand more about the relationship between hospital type and propensity to report admission to the ICU, the research team assigned each admission an “expected” ICU admission rate based on its severity level (ie, average ICU admission rate for the CHF severity level). The team obtained descriptive hospital variables for bed size and teaching intensity (indirect medical education) from the FY2018 hospital IPPS impact file released by CMS 12 and computed several Pearson correlation coefficients. The team found the propensity to admit to ICU was inversely correlated with hospital teaching intensity (r = −0.2014; P < .00001), bed size (r = −0.2711; P < .00001), and the number of CHF admissions (r = −0.3551; P < .00001) across the 1374 hospitals.
Discussion
This analysis of claims data identifies a large difference across hospitals reporting ICU utilization for CHF admissions. Severity of illness levels within the APR-DRG classification system exhibits concurrence with higher intensity levels of diagnoses and services, increasing length of stay, and patient mortality but explain little of the underlying variation in hospital reported ICU utilization. It was found that, in general, larger teaching hospitals with more CHF admissions are less likely to report ICU usage in excess of that predicted by the discharge severity level.
This finding is important for the functioning of the risk-adjustment mechanism employed within the NHSN measures. The research team acknowledges that the NHSN measures are hospital wide, whereas the current analysis was confined to Medicare fee-for-service claims for CHF admissions. There also may be greater uniformity in hospital designation of nursing units within the NHSN measures than that which appears in the billing and coding of ICU services on claims. However, the magnitude of difference in ICU days reported on claims across hospitals, and the dilution of average ICU days with less sick patients that this implies, should be of concern to those following the NHSN quality measures given the large weight assigned to the patient location in NHSN risk adjustment.
To help visualize the importance of the risk-adjustment model on comparative SIR rates it is useful to provide an example. NHSN does not routinely publish unstandardized hospital rates of infections, but some states such as California make them available. 13 In their reporting for 2017, of 285 acute care hospitals with at least 1000 central line days, 232 (81.4%) had 10 or fewer CLABSI infections in the year. Given the relative infrequency of CLABSI events, differentiation in performance is provided by the denominator of the SIR, the risk-adjusted number of central line days. This distribution of CLABSI events and central line days are not specific to California. Although central line days and unadjusted infection rates are not published by CMS, it can be seen by reviewing the CLABSI benchmark 13 that the top performing 10% of hospitals have a SIR rate of 0 (no CLABSI events) in the VBP program.
Table 2 shows variation across coefficients in the risk model for MRSA, where having 11 to 44 ICU beds poses less risk for MRSA than both 7 to 10 ICU beds and >45 ICU beds. The absence of a monotonic increase in MRSA risk with increasing numbers of ICU beds seems counterintuitive (although one could postulate that smaller ICUs lack sufficient expertise and larger ICUs rely on inexperienced house staff) and is inconsistent with the monotonic pattern of rising risk in the ICU bed size coefficients for C difficile, with a significant increase (42%) in risk when moving from 9, to 10 to 20 ICU beds (Table 2). This reported inconsistency in what constitutes greater risk has limited statistical support because, by once again turning to Table 2, one can reject a null hypothesis of difference between the risk categories by using the model output statistics showing that reported standard errors for the model coefficients fall well within each other’s 95% CIs. If in addition to this one observes that there may be wide variation in the self-reported data that underpin the risk-adjustment model, then one might well ask exactly what is being adjusted in the risk-adjustment model?
The research team should stress that their remarks directed toward the inclusion of bed size and the resulting coefficients are not intended to imply that hospital size, attendant staffing, and teaching mission have no bearing on infection rates and infection rate detection. However, to the extent that these factors impact relative infection rates, the team believes that the disparities in patient outcomes revealed should be equalized by hospitals reviewing how they are sized and managed rather than being hidden by risk adjustment.
Of equal importance to the specification of the risk model, its variables, and its data, should be a concern that the use of SIR rates does not take into account steps taken by the hospital to avoid infections by improving patient management strategies. NHSN calculates Standardized Utilization Ratios (SURs) to compare hospital device utilization. 14 Although hospitals reducing central line or catheter days should perform favorably against a SUR benchmark reduction, such efforts will have no effect on SIR rates. This is because the prevalence of infection is measured relative to the use of a particular device rather than relative to the nature of hospitalization. Reducing dwell time for peripherally inserted central catheters is known to reduce CLABSI risk 15 by reducing catheter days, yet this resides outside of the SIR measure and thereby the HACRP and VBP performance calculations.
Taking these considerations together, there should be a review of how the NHSN measures, ostensibly designed for single hospital improvement, are being employed for across-hospital quality measurements that drive billions of dollars of penalties and rewards.
Conclusion
Policy intended to reduce hospital-acquired infections is good policy. Tying policy to financial incentives through the HACRP and VBP sends a strong message that quality of care is important. But the fact that a policy is both rational and well-intentioned does not obviate the need for the policy to be implemented in a fair and equitable manner. It also is imperative that the policy not mislead patients and stakeholders in publicly reported comparisons of performance. The present analysis highlights several theoretical concerns with the risk-adjustment model used for the NHSN measures. The principal purpose of this article, however, is to highlight through analogy to Medicare claims submission the likelihood that self-designation of nursing units, a key component of the risk-adjustment models being used, is the subject of widespread and unexplainable variation.
This finding on its own calls into question the public reporting of hospital SIR rates and the billion-dollar payment adjustments made under the HACRP and VBP. As a generalizable rule, self-reported data tied to payment should be verified and the variables should not be susceptible to arbitrary decisions made by the hospital. When such widespread variation is observed, and such large amounts of money are at stake, a formal review of risk-adjustment methods is urgently required.
Supplemental Material
Appendix1 – Supplemental material for Problematic Risk Adjustment in National Healthcare Safety Network Measures
Supplemental material, Appendix1 for Problematic Risk Adjustment in National Healthcare Safety Network Measures by Richard L. Fuller, John S. Hughes, Graham Atkinson and Barbara S. Aubry in American Journal of Medical Quality
Supplemental Material
Appendix2 – Supplemental material for Problematic Risk Adjustment in National Healthcare Safety Network Measures
Supplemental material, Appendix2 for Problematic Risk Adjustment in National Healthcare Safety Network Measures by Richard L. Fuller, John S. Hughes, Graham Atkinson and Barbara S. Aubry in American Journal of Medical Quality
Footnotes
Declaration of Conflicting Interests
The authors declared the following potential conflicts of interest with respect to the research, authorship, and/or publication of this article: Mr Fuller, Dr Hughes, and Ms Aubry report a potential conflict of interest through receiving payment from employment with 3M Health Information Systems, a developer of Potentially Preventable Complications (PPC) software used to measure hospital acquired complication rates. Dr Atkinson reports no conflict of interest.
Funding
The authors received no financial support for the research, authorship, and/or publication of this article.
Supplemental Material
Supplemental material for this article is available online.
References
Supplementary Material
Please find the following supplemental material available below.
For Open Access articles published under a Creative Commons License, all supplemental material carries the same license as the article it is associated with.
For non-Open Access articles published, all supplemental material carries a non-exclusive license, and permission requests for re-use of supplemental material or any part of supplemental material shall be sent directly to the copyright owner as specified in the copyright notice associated with the article.