
Abstract
Beginning as early as 2009, Texas began to put the antecedents in place for an effective Medicaid value-based purchasing model. Since those early activities were undertaken, Texas Medicaid is emerging as a national leader in value-based purchasing and has produced exceptional results that clearly demonstrate the value proposition associated with alignment of financial incentives. This article presents several years of data and preliminary results of this effort. This study found significant improvements in a number of outcomes. Further improvement will depend on implementation of financial incentives and ongoing commitment to paying for better outcomes. This ongoing commitment includes many additional programs that hospitals, in particular, have put in place such as improved handwashing techniques.
State Medicaid programs have taken a variety of pathways toward value-based purchasing (VBP). During March 2016 the National Association of Medicaid Directors, in collaboration with The Commonwealth Fund, completed and released a survey of state efforts to move from a payment system based on volume to one based on value. 1 Of the 34 states that responded to the survey, 28 were engaged in a payment reform process:
At least 12 states provide supplemental payments to providers for infrastructure, quality measurement, and reporting. These programs most often support health home or patient-centered medical home programs, and may include a shared savings or shared risk component.
Seven states have either implemented or are in the process of developing episode-based payment programs, in which accountability for quality and total cost of care for specific procedures or events (such as asthma exacerbation, childbirth, or congestive heart failure [CHF]) is placed on an identified provider or group of providers, with opportunities for shared savings predicated on quality performance.
At least 9 states have implemented population-based payment models, which establish a targeted expenditure based on total cost of care for an identified population, and hold providers responsible for quality and cost and usually include a shared savings component.
Some states have adopted a prescriptive process that mandates compliance with state-prescribed care components in order to receive an incentive payment or avoid a penalty. These systems are time consuming, expensive to implement, must be maintained over time, and they are subject to evolving changes in best practice models. What is needed is a system that allows a state Medicaid program to establish the right financial incentives that motivate health plans to manage their provider networks in such a way that will achieve the state-desired value proposition. Such a process should be put into place that does not impose clinical practice guidelines on providers, inhibit the ability of health plans to innovate, or require inordinate expense.
Both objectives of better outcomes and more efficient management can be achieved based on 5 outcomes measures that are indicative of a well-performing health care system and are suitable measures for a variety of populations. Since 2011, the Texas Medicaid program has proceeded to implement this outcomes-based payment by selecting 5 specific potentially preventable events (PPEs) measures for different provider organizations that reflect the organization’s responsibility and influence over reducing that PPE. Texas is implementing, among other efforts, these 5 quality outcomes measures that result in substantial and potentially avoidable health care costs. Together, these quality outcomes measures cover the vast majority of all potential savings in the health care system.
In its fee-for-service (FFS) program, Texas applies potentially preventable readmissions and complications to its FFS hospital payments. Each year an adjustment is made in payments for those hospitals that perform below the statewide mean. An incentive program was created by the Texas Legislature during 2016. In addition to a performance penalty for low-performing hospitals, the legislature appropriated almost $300 million for the biennium (2015/2016) to fund incentive payments. The funds are split equally between preventable complications and readmissions. 2
During 2012, Texas Medicaid included a provision with its new managed care contracts to place 4% of the premium at risk based on performance measures. The 4% amount is not insignificant—statewide that equates to about $640 million annually. As the program developed, Texas Medicaid assigned 2% of the value based on health plan performance associated with 3 PPEs: preventable hospital admissions and readmissions, and emergency department (ED) visits. The remaining 2% was allocated to 3 Healthcare Effectiveness Data and Information Set measures that varied based on health plan model.
Potentially Preventable Complications (PPCs). PPCs are harmful events (eg, accidental laceration during a procedure) or negative outcomes (eg, hospital-acquired pneumonia) that may result from the process of care and treatment rather than from a natural progression of underlying disease. 3
Potentially Preventable Readmissions (PPRs). PPRs are return hospitalizations that may result from deficiencies in the process of care (eg, readmission for a surgical wound infection) or inadequate postdischarge follow-up (eg, prescription not filled) rather than unrelated events that occur post discharge (eg, broken leg resulting from trauma). 4
Potentially Preventable Admissions (PPAs). PPAs are hospital admissions that may have resulted from the lack of adequate access to care, inadequate treatment of those with access, or insufficient coordination among specialists in the ambulatory care setting. PPAs are ambulatory care sensitive conditions (eg, asthma, CHF) for which adequate patient monitoring and follow-up (eg, medication management) often can preclude the need for admission.
Potentially Preventable ED Visits (PPVs). PPVs are ED visits that may result from a lack of adequate access to care or ambulatory care coordination. Similar to PPAs, PPVs are ambulatory care sensitive conditions (eg, asthma, diabetes) for which adequate patient monitoring and follow-up (eg, medication management) should be able to reduce or preclude the need for an ED visit.
Potentially Preventable Outpatient Services (PPSs). PPSs are outpatient laboratory and interventional services, ordered by physicians, that may not provide useful information for diagnosis (routine use of many laboratory tests), or treatment for which there are significant questions concerning efficacy (eg, avoidable back surgery). 5
In 2011, through Senate Bill 7, the Texas Legislature established a Medicaid “quality-based outcomes” payment program covering all types of provider systems including hospitals and managed care plans. 6 The program is designed so that hospitals and managed care plans receive their comparative PPE quality reports many months in advance of any payment adjustment the state makes based on those quality scores—and thereby have the opportunity to begin making quality improvements.
The results for the Texas VBP model have been impressive. Success has been obtained not by the state dictating the process of care or mandating adherence to a state-imposed clinical process for a given episode of care, but rather by creating financial incentives that encourage and reward innovation in the delivery of services. The balance of this paper documents the impact of this model on care delivery in Texas.
Methods
Data Sources and Scope
This section describes the data used to analyze PPE outcomes for Texas Medicaid programs. The analysis was conducted using Texas Health and Human Services Commission (HHSC) claim and retroactive STAR, STAR + PLUS, and CHIP enrollment files from January 2012 through May 2016. The analysis included claims for inpatient, outpatient, professional, and prescription services. Dual eligible and CHIP perinatal membership was excluded from the analysis.
Membership Eligibility
To be included in the calendar year analysis a member must have had at least 1 month of eligibility in that calendar year and 3 or more months of eligibility in the year prior. A unique member ID was created within each health plan for each Medicaid member. Between 3.3 and 3.4 million members were included depending on the calendar year. Member enrollment was mapped to Managed Care Service Areas (MSAs) defined by HHSC as illustrated in Figure 1. If a member could not be mapped to a MSA they were assigned to a default statewide category.
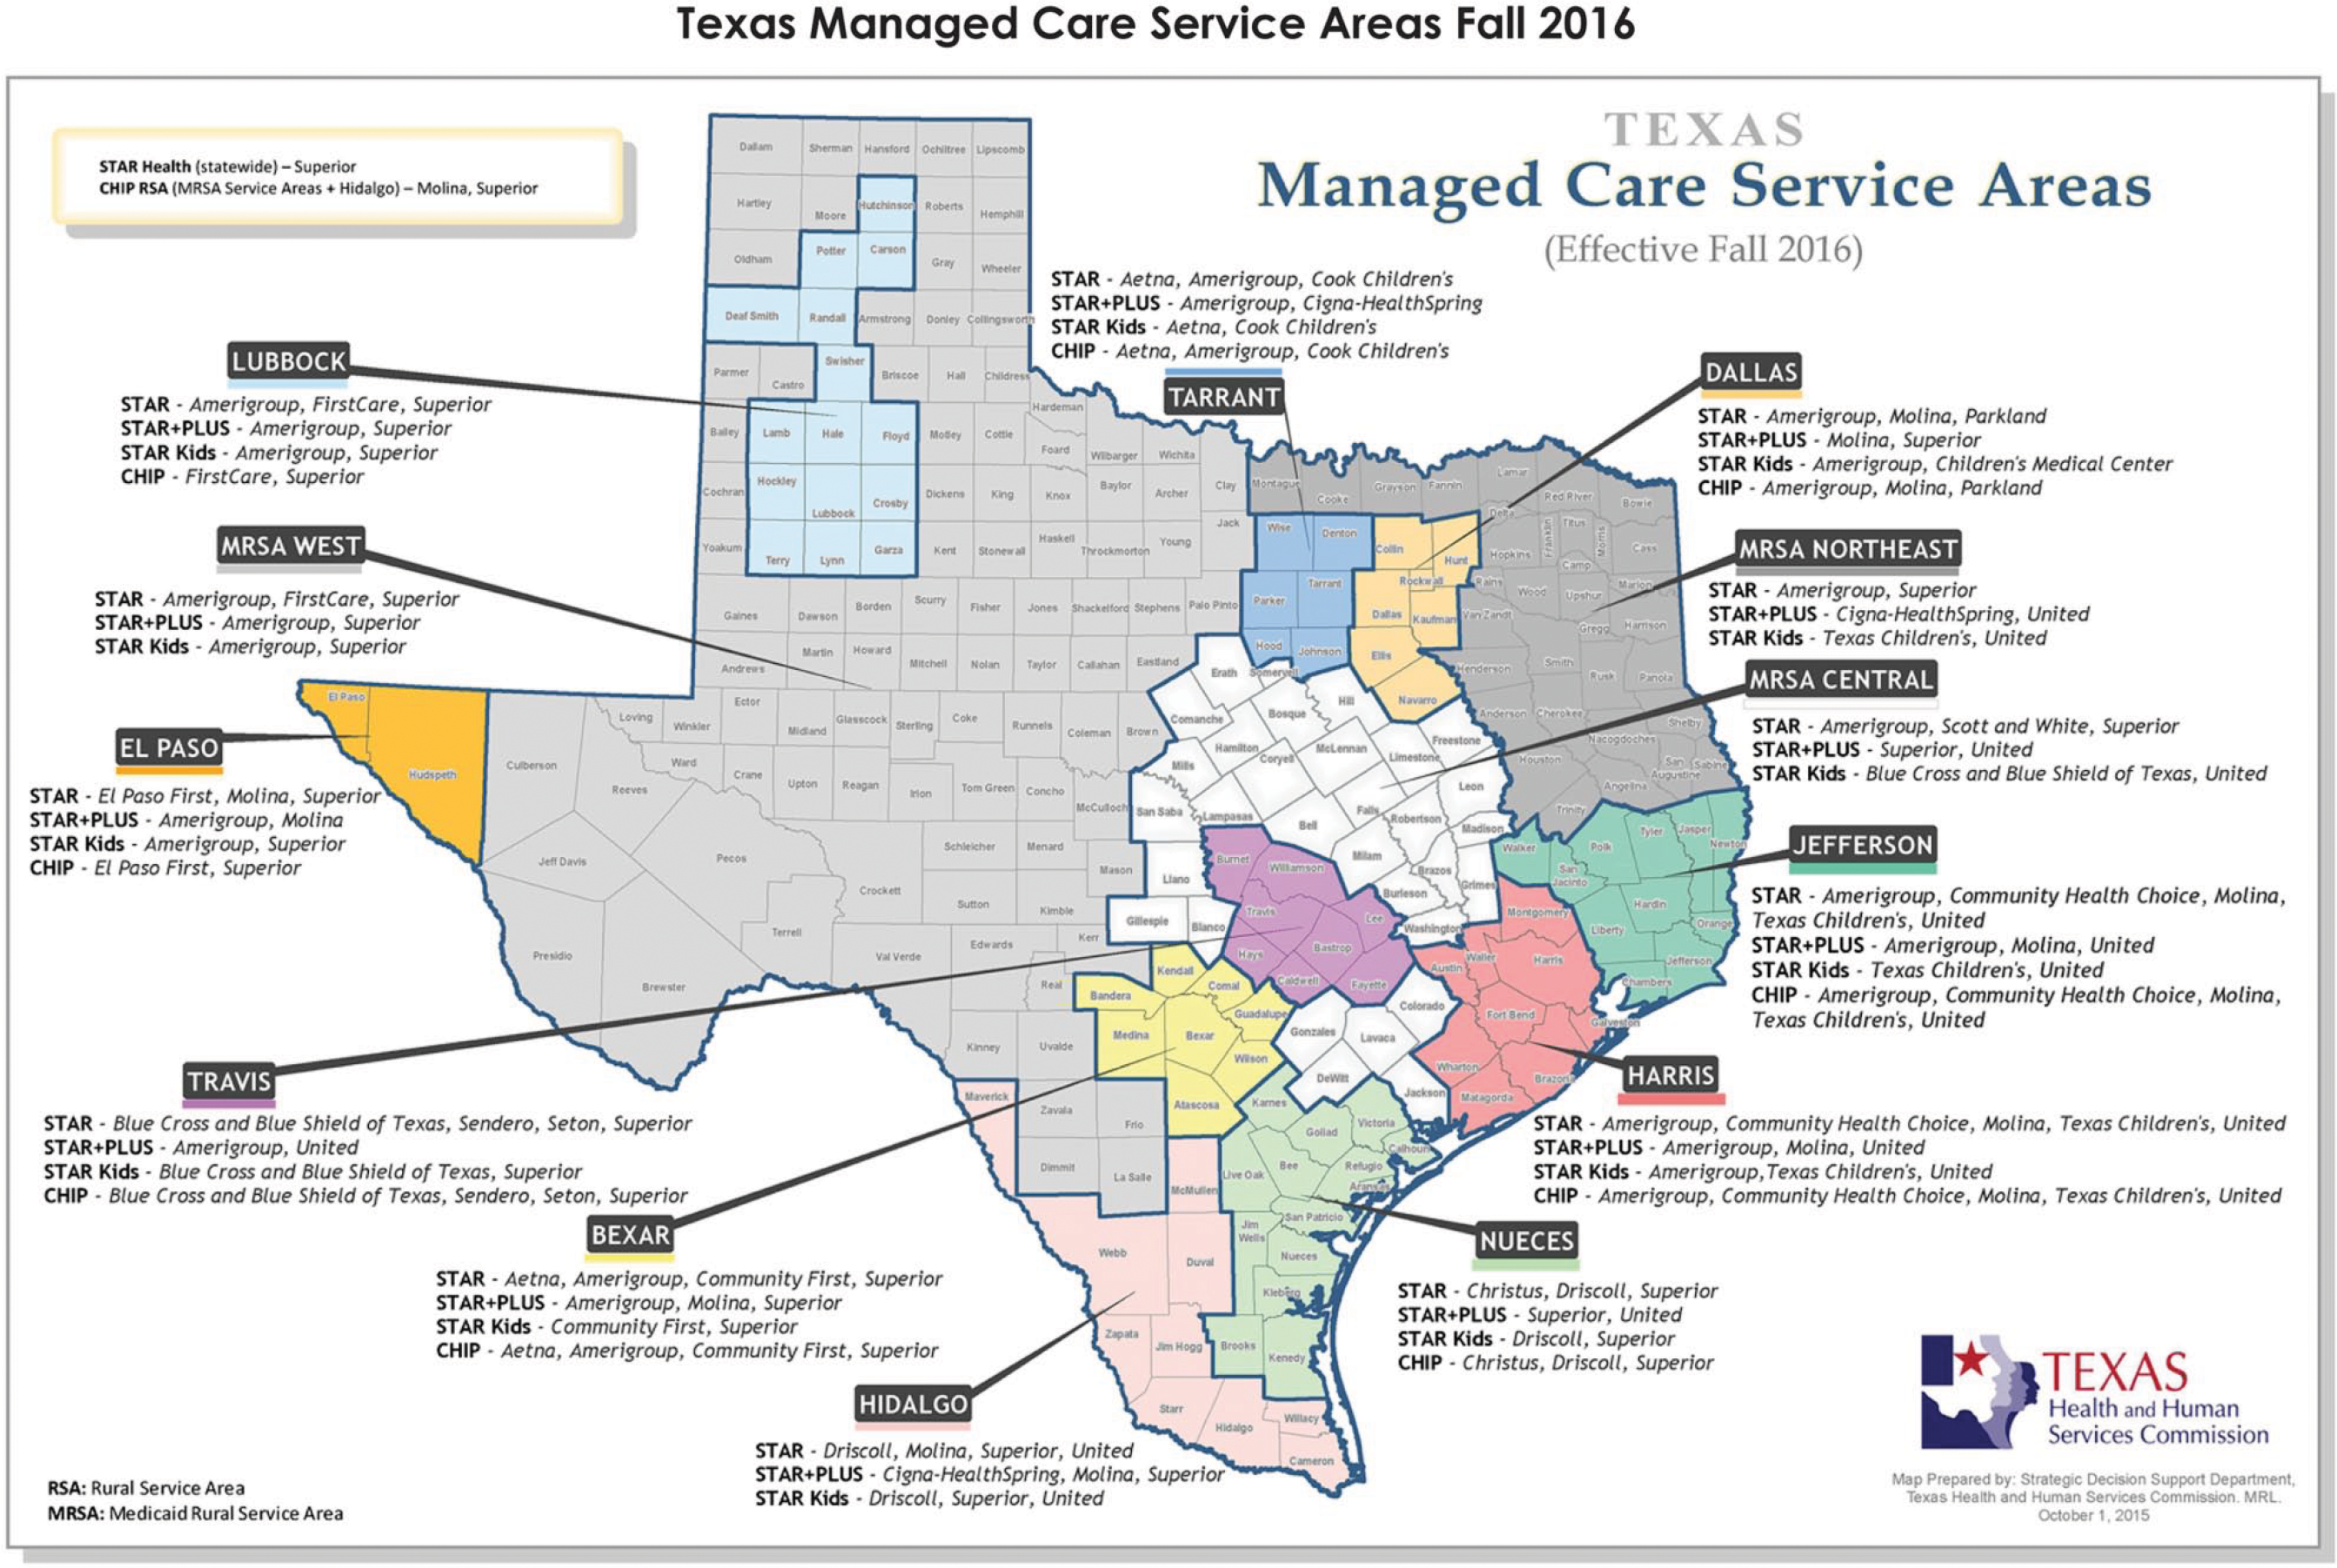
Health and Human Services Commission Texas Managed Care Service Areas as of October 1, 2016.
PPEs
The results provided in this article focus on 3 of the 4 PPEs (ie, PPA, PPVs, and PPRs) that the State of Texas implemented (Texas has implemented PPCs only for hospitals). In order to measure performance of PPEs over time, risk-adjusted norms were calculated as statewide averages for each respective PPE metric in the baseline year, 2013, to measure incremental change in performance from 2013 to 2015.
PPAs and PPVs were identified using the 3M Population-focused Preventables (PFPs) Software V1.3.0 (3M, St. Paul, Minnesota). PPA and PPV norms were calculated separately for each respective measure in the baseline year as average risk-adjusted rates within each product (ie, STAR, STAR + PLUS, and CHIP) and Aggregated Clinical Risk Group (ACRG) 3 level. Expected utilization for 2014 and 2015 was calculated from these 2013 norms, risk adjusted to the patient mix within each subsequent year based on 3M CRGs V1.12 (3M, St. Paul, Minnesota) at an ACRG level 3 for all eligible members within a given calendar year and within each product. Actual and expected PPA and PPV performance is recorded as rates (per 1000 members per year, or PKPY).
PPRs were measured using 3M PPR Grouping Software V31.0 (3M, St. Paul, Minnesota), which identified clinically related readmissions using a 30-day readmission window. Because some types of admissions require follow-up care that is intrinsically clinically complex and extensive, and for which preventability is difficult to assess, there are certain circumstances in which a readmission cannot be considered potentially preventable. Accordingly, for example, all patients who left against medical advice are not included.
After these exclusions were applied, all other inpatient claims starting between January 1 and November 30 within a given calendar year were considered candidate cases for identifying PPRs.
PPR rate norms were calculated in calendar year 2013, the baseline year, at a statewide level across all products (STAR, STAR + PLUS, and CHIP). Expected utilization for 2014 and 2015 was calculated from 2013 norms, risk adjusted for 3M All Patients Refined Diagnosis-Related Group and severity of illness, mental health status, and age category (older/younger than age 18).
Performance for PPAs, PPVs, and PPRs was measured by calculating the percent difference between the actual and expected rates.
Results
Texas Medicaid PPE performance aggregated across all products (STAR, STAR + PLUS, and CHIP) over a 3-year period is shown in Figure 2 through the percent difference between actual and expected rate of PPEs. Even though the membership volume and expected rates for PPAs, PPVs, and PPRs have increased over time, driven by change in member volume and case mix, the actual number of PPEs have decreased substantially, showing year-over-year risk-adjusted improvement from the baseline year.
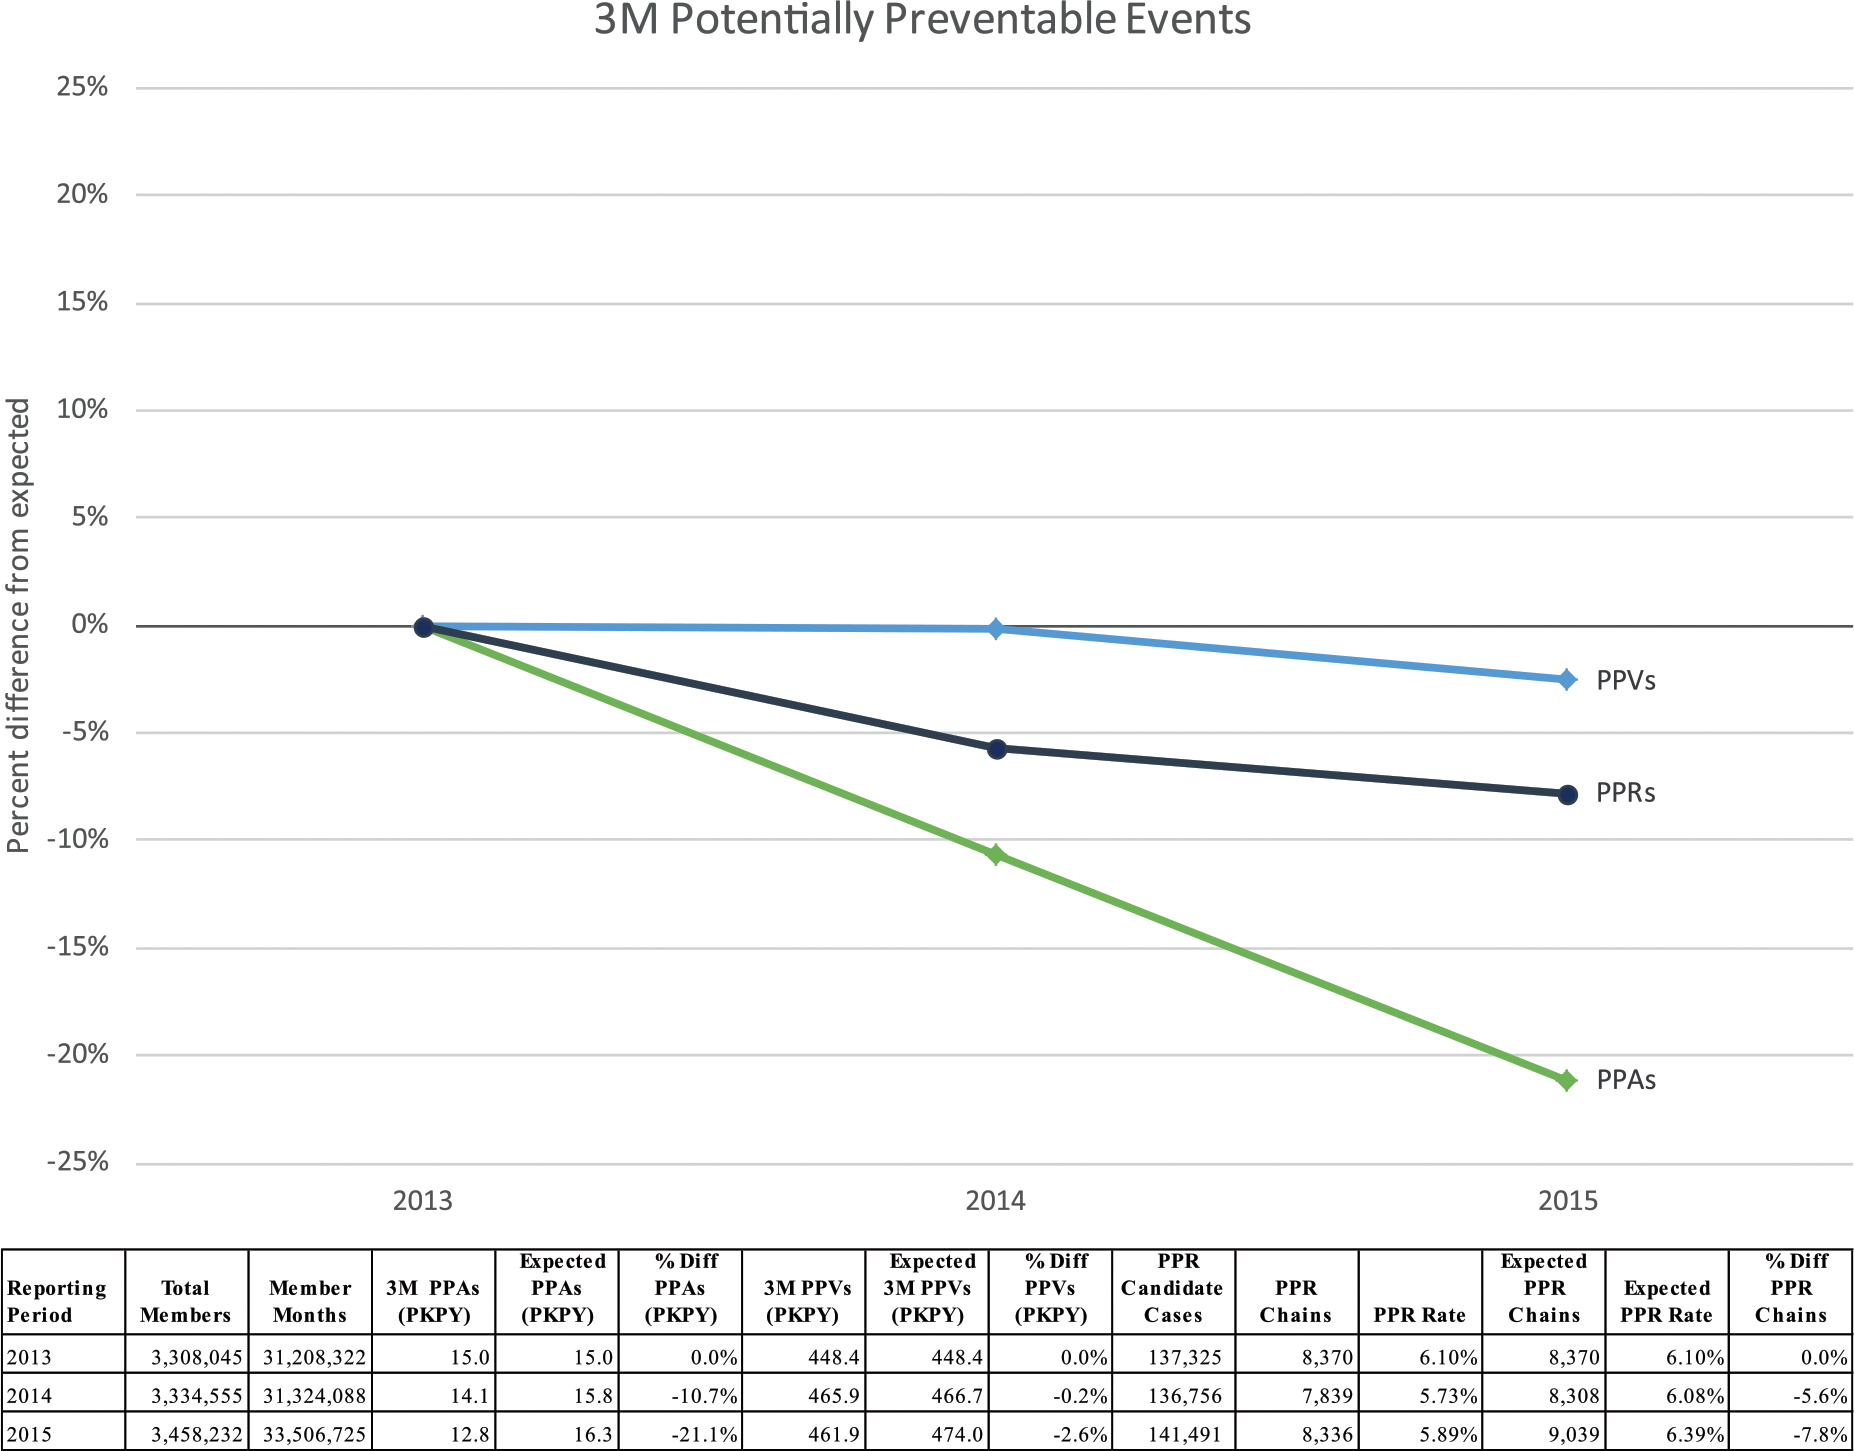
Potentially preventable events compared to risk-adjusted expected amount, 2013 to 2015.
PPAs in 2014 and 2015 were lower than expected (Figure 2). In 2014, there were fewer PPVs (PKPY) than expected. In 2015, PPVs (PKPY) were reduced to fewer than expected. PPR rates in 2014 and 2015 were lower than expected.
Using the same data and approach as in Figure 2, Figure 3 shows geographic performance by MSAs in PPA, PPV, and PPR rates. There is geographic PPE performance variation between MSAs within Texas with most MSAs showing improvement from 2013 to 2015.
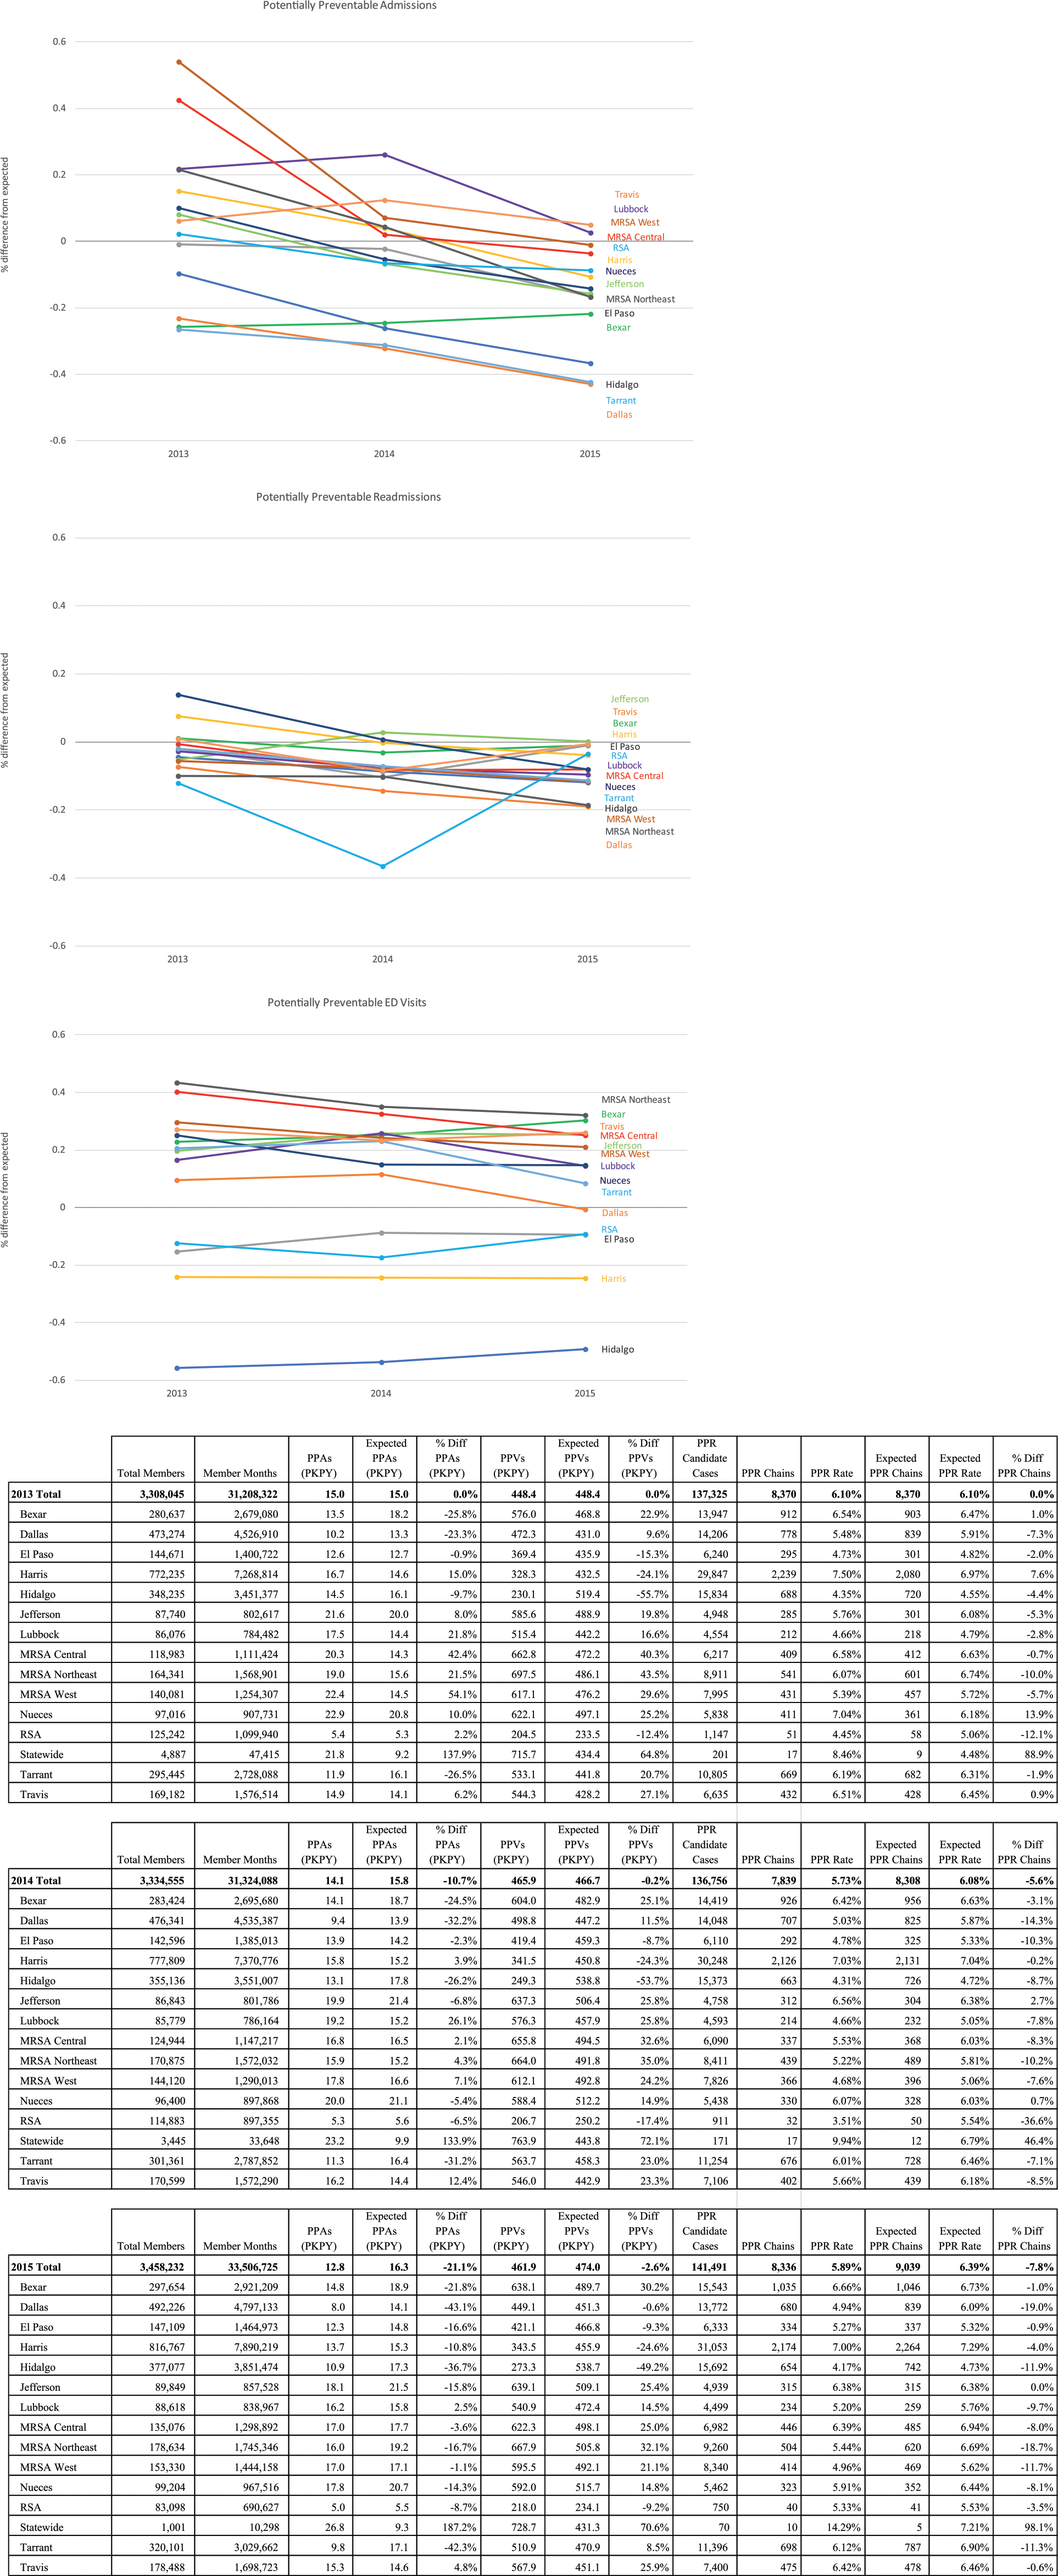
Potentially preventable admissions, ED visits, and readmissions compared to risk-adjusted expected amount, 2013 to 2015, by HHSC Texas Medicaid Managed Care Service Area.
Figure 4 shows clinical detail on the top 5 most common services driving PPA, PPV, and PPR outcomes. Asthma, cellulitis and skin infections, pneumonia, diabetes, and mental health services are among the most common services associated with PPAs and accounted for 40% of all PPAs in 2015. Schizophrenia, bipolar disorders, major depressive disorders, and other/unspecified psychoses, CHF, and septicemia are the most common services received for a medical PPR and accounted for a large percentage of all PPRs in 2015. On the surgical side, the most common PPRs were infections and/or other complications that occurred after a procedure. Infections of the upper respiratory tract and otitis media are by far the most common PPV, accounting for 22% of all PPVs in 2015.
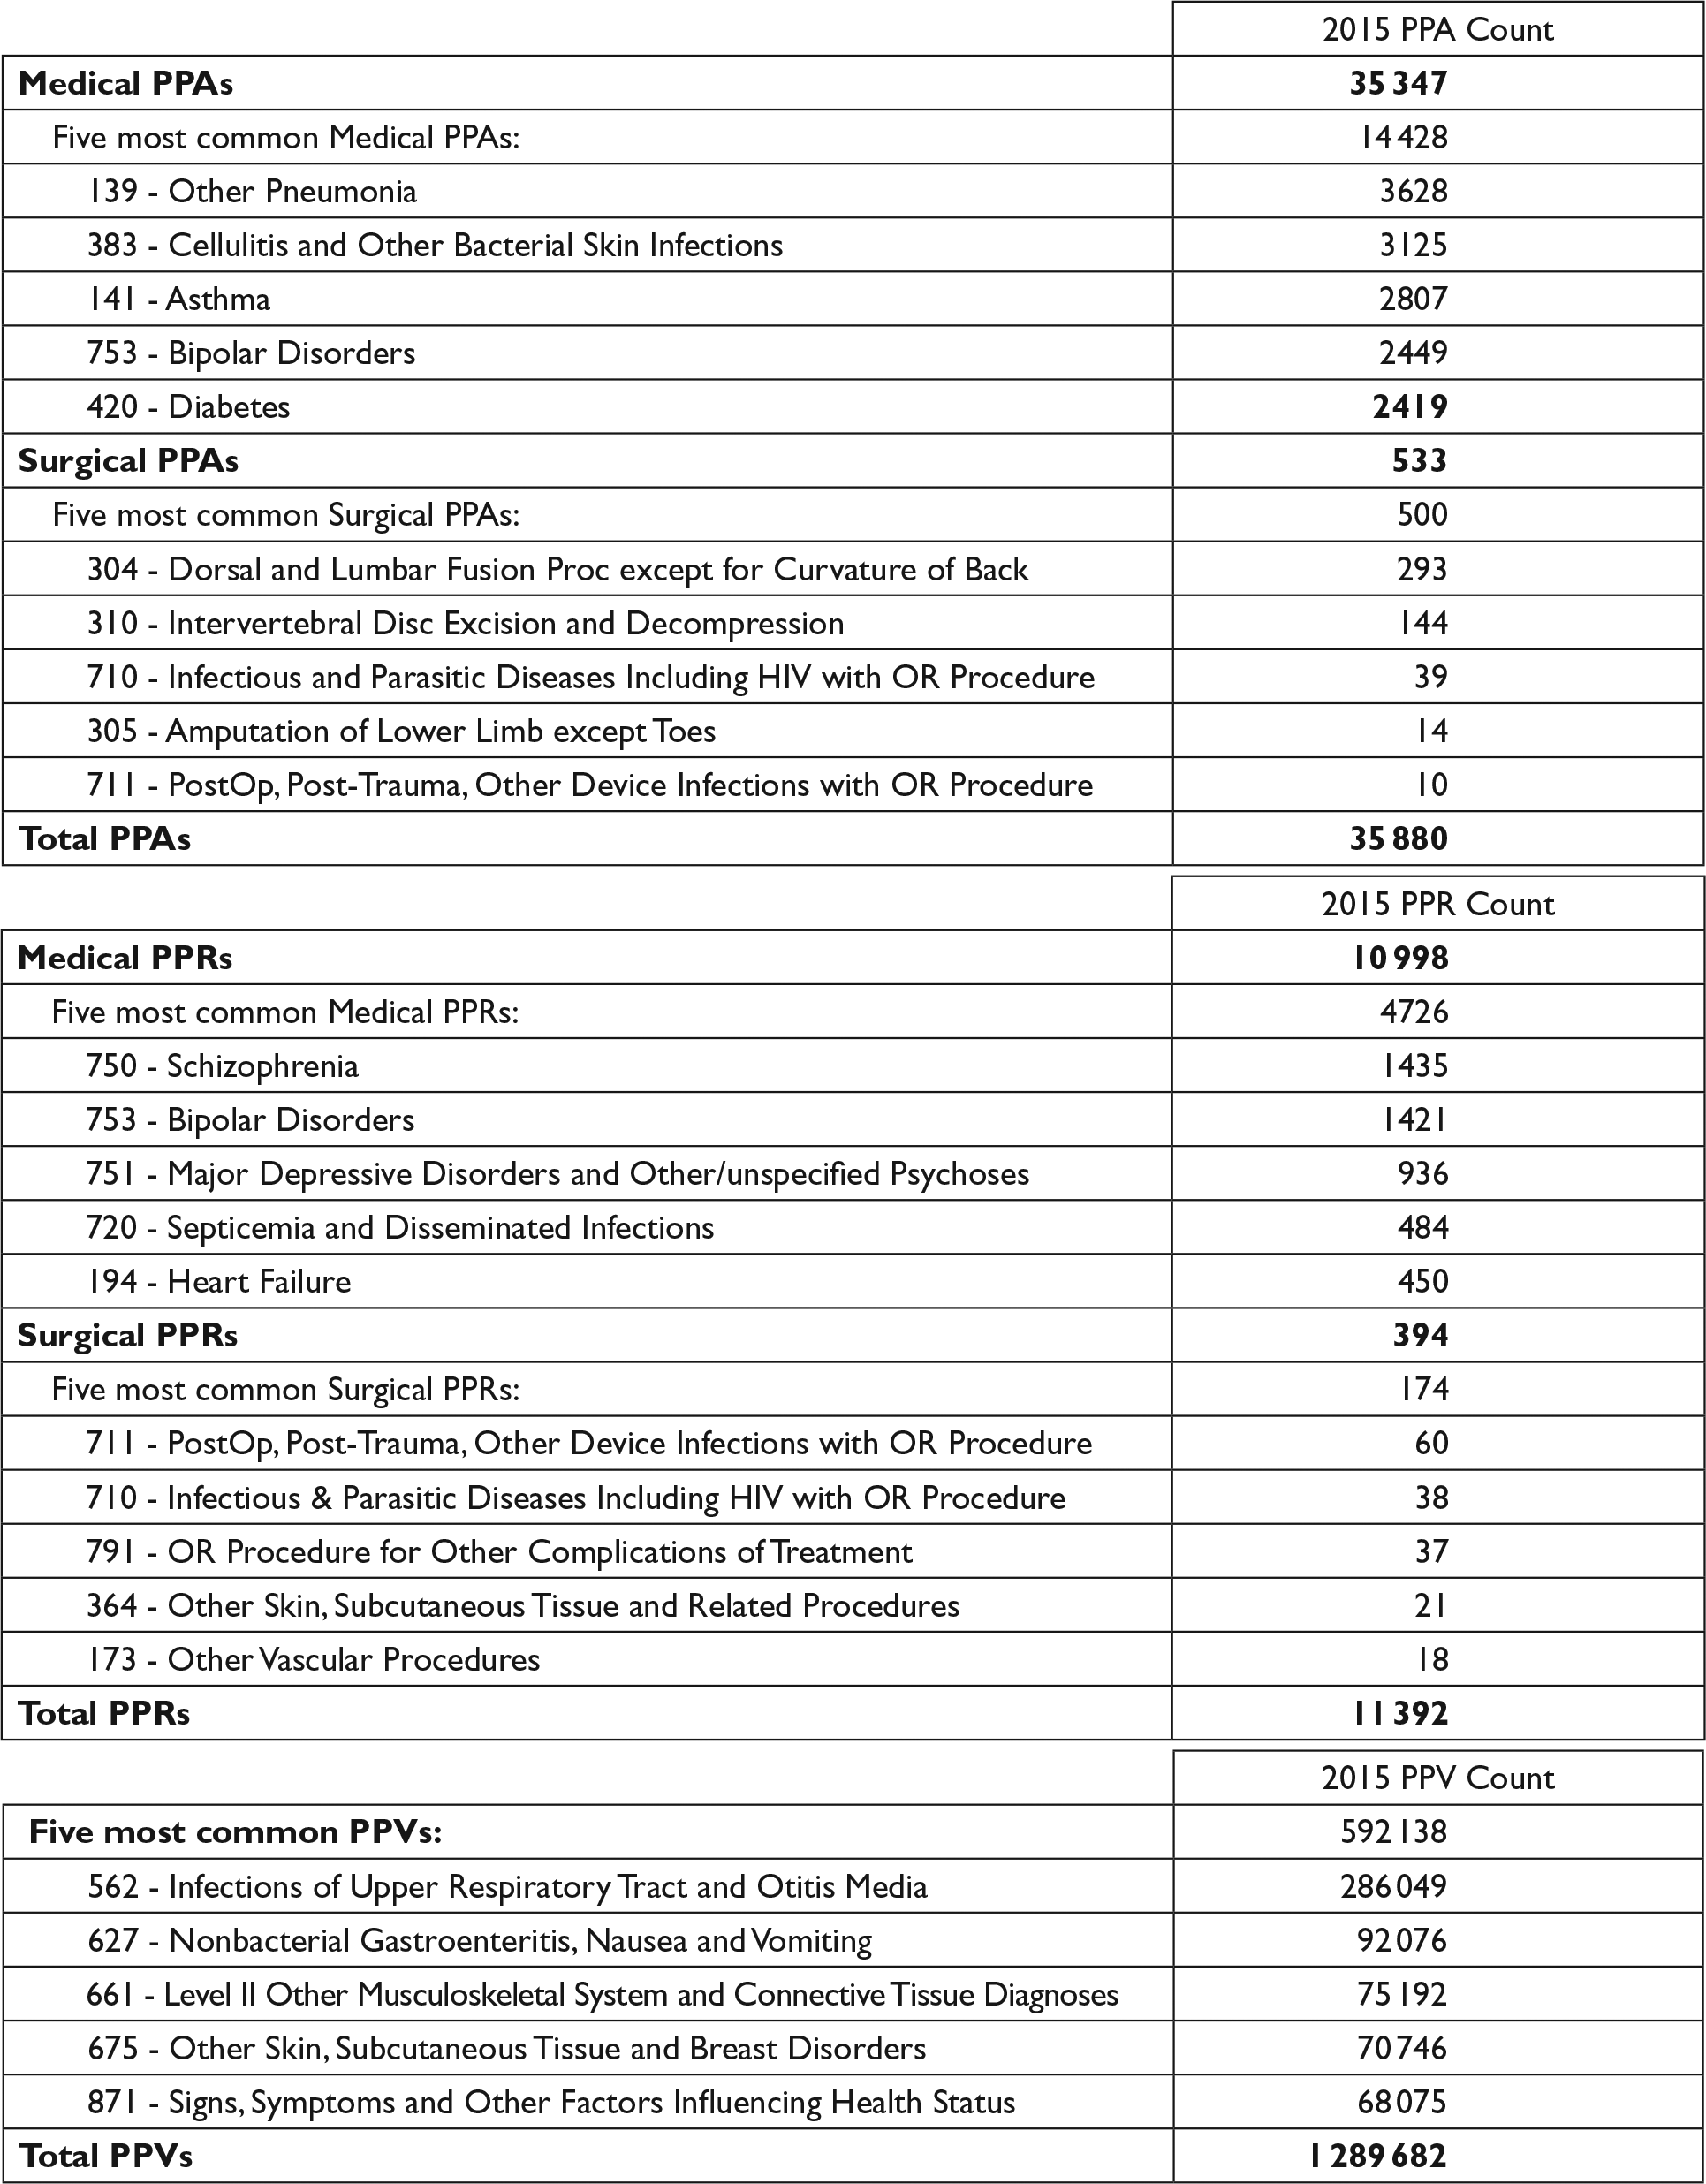
Total potentially preventable admissions (PPAs), potentially preventable readmissions (PPRs), and potentially preventable visits (PPVs) and the 5 most common medical and surgical PPAs by 3M All Patient Refined Diagnosis-Related Groups, 2015.
Discussion
It is important to highlight caveats that certainly mitigate any conclusions that one can draw from this one state case report. Most important, numerous initiatives were occurring throughout the country—the Centers for Medicare & Medicaid Services (CMS) Hospital-Acquired Condition Program, the CMS Hospital Readmission Reduction Program, and overall initiatives such as the appropriate use of handwashing. That said, preliminary results for this important statewide intervention are very encouraging. Simply put, all 3 PPEs decreased; the decrease in PPEs occurred in both the hospital and managed care settings. Soon after the PPE approach was implemented, a Medicaid health plan in a major Texas metropolitan area analyzed its PPA performance. The health plan found that the source of many of its PPAs was associated with ED visits and a specific ED physician practice group. The health plan negotiated a contract with the ED physician practice group that included an incentive for reductions in preventable hospital admissions. In tandem with those discussions, the health plan contracted with several of its primary care physicians in those areas of the city where the PPAs were occurring to offer expanded hours for after-hours care. Following these efforts there was a noticeable decline in PPVs and PPAs.
At the same time, New York State has taken a similar approach to comprehensive and transparent quality outcomes-based payment. In 2010, New York implemented a Medicaid payment reform that mandated a reduction of $47 million in annual Medicaid payments to hospitals with high rates of PPRs. 7 New York Medicaid expanded quality outcomes payment to its managed care programs in 2013; plans will have their premiums adjusted based on their performance on several quality measures, including 4 of the PPEs described in this article.
Transparent and categorical methodologies will allow provider systems to produce meaningful data for clinicians and the entire health care team, thereby increasing the likelihood of acceptance of a quality-based outcome payment system. As with regression models, clinical categorical models utilize predictor variables to estimate the value of an outcome. The process used in the development of a clinical categorical model is an iterative process of formulating clinical hypotheses regarding the relationship between the outcome of interest and predictor variables and then testing the hypotheses with historical data. The historical data are used to confirm or refine the clinical hypotheses identified by clinicians. When there are discrepancies between clinical expectations and the data results from the historical data, the clinical expectations are refined to form the basis of the clinical categorical model. 8 In fact, both Texas and New York have been providing detailed reports based on these categorical models and are planning to expand this effort substantially. 9
This outcomes-based payment also has been used by the Maryland Health Services Cost Review Commission in its effort to decrease hospital complications. In the first 4 years, Medicaid inpatient complications in Maryland decreased by approximately 50% and cost savings over the first 2 years of the Maryland payment adjustment for inpatient complications was $110.9 million. 10
The Texas models have been successful because they adhere to a set of principles consistent with VBP. These principles as implemented in Texas include the following.
Establish a Rational Financial Incentive
The financial incentive must be reasonably proportional to the cost associated with the targeted system inefficiency. In Texas, policy makers placed up to 2% of the premium at risk based on performance associated with preventable admissions, readmissions and ED visits.
Provide the Incentive to Engage in VBP
Many of the Texas Medicaid health plans realized they could not independently achieve the ambitious objectives established by the program without engaging in payment reforms within the managed care network. As a result, provider networks contracts have been revisited to include gainsharing and risk based on reductions in ED visits, and hospital admissions and readmissions. The focus of the plans is beginning to change so that networks are assessed not only on access to providers but also on quality.
Assess Individual Plan Performance
Texas assesses performance at the individual plan level rather than creating a statewide measure to which all health plans are held. Creation of a single statewide standard does not adequately consider individual health plan performance. For example, if a statewide measure is used, then one plan may only need to improve performance by a small percentage to avoid a penalty on quality for an incentive while another plan may need to make gargantuan progress. Progress should be plan specific and measure improvement from the individual plan baseline.
Use Risk-Adjusted Measures
The illness burden of health plan members is not equally distributed. Some plans may attract members with more acute and/or chronic conditions than others. As a result, the measures used must be risk adjusted to reflect the variance in the distribution of the illness burden among plans.
Use Measures That Apply Across Delivery Systems and Populations
The Texas measures are used in multiple delivery systems (fee for service, managed care, and Delivery System Reform Incentive Payment) and will accommodate future changes Texas may make in its delivery model. Similarly, the measures are applicable to the reasonably healthy Medicaid populations (eg, pregnant women, children) as well as to those with more chronic conditions (eg, aged, blind, disabled). The measures are equally applicable for acute as well as long-term services and supports delivery models.
Assess Population Rates Rather Than Cases
Determining the payment adjustment for quality based on overall provider system performance avoids the key problem with the case-by-case approach. It allows the determination of an overall quality payment adjustment that is applied to all patients treated by the provider system, regardless of whether the individual patient experienced the negative outcome, thereby avoiding the need to designate the care of specific patients as substandard.
Put differently, key characteristics of a pay-for-outcomes approach must include the following:
A comprehensive approach applicable to all major provider organizations, covering those outcomes that substantially impact expenditures without mandating hundreds of process measures.
Financial incentives that decrease negative outcomes that are substantive yet proportionate. Without sufficient financial motivation, providers are unlikely to make the investment necessary to achieve the behavioral changes needed to improve quality. For example, the Medicare Hospital-Acquired Conditions payment adjustment affects less than 0.02% of Medicare Inpatient Prospective Payment System payments. 11 Interestingly, despite the fact that the Texas HHSC made the decision to delay implementation of the at-risk amount until a later date, the very consideration of a several percent penalty resulted in the dramatic changes described in this paper.
Adequate risk adjustment that is clinically comprehensive to the providers taking on the risk and is not susceptible to manipulation or gaming. 12
Despite the fact that senior personnel at the Texas Department of Health Services have changed over the past 5 years, there has been ongoing and continuous support for an outcomes-based approach, both in terms of delivering reports to health professionals and the commitment to implementing appropriate financial incentives.
What are the challenges to implementing the pay-for-outcomes approach described in this article? Most important, health policy experts still largely prefer using process measures as the key to successful quality improvement. At the end of the day, individual consumers want better quality outcomes such as fewer complications and readmissions. Senior policy makers at Medicaid programs in particular, but also at Medicare and commercial insurers, expect savings and increasingly demand improved outcomes.
This pay-for-outcomes approach results in ease of communication. The importance of the effectiveness of communication, which must focus on improvement and has to be simple, comprehensive, and transparent, cannot be overstated. CMS has emphasized the importance of the communications value of the method of payment: “The success of any payment system that is predicated on providing incentives for cost control is almost totally dependent on the effectiveness with which the incentives are communicated.” 13 CMS, Medicaid programs, and commercial insurers should focus on health reform efforts that demonstrate bottom line results. Current CMS quality programs should be revamped to make the programs more outcomes focused. Individual consumers are right to demand improvement in quality outcomes and to have access to information that is clear and easy to understand.
Conclusions
In summary, for its Medicaid enrollees, Texas has thus far succeeded in improving clinical outcomes and reducing health care costs associated with PPEs instead of just simply cutting services. As befits any large-scale ambitious intervention, there are many unanswered policy questions and many opportunities for improvement. What is the right mix of financial incentives, information, and opportunities for collaborative engagement between plans? In ideal circumstances, all payers should have a clear and transparent process with providers by which they arrive at a mix of financial and nonfinancial incentives to improve outcomes. How should plans best involve consumers, particularly in the burgeoning area of consumer activation/empowerment? 14 Other states such as New York and Maryland are going down a similar path of providing overall financial incentives targeted to potentially preventable health care costs while not prescribing onerous and time-consuming process measures. These states are leading the effort to improve health care outcomes.
Footnotes
Declaration of Conflicting Interests
The authors declared the following potential conflicts of interest with respect to the research, authorship, and/or publication of this article: Dr Goldfield and Mr Turnipseed are salaried employees of 3M Health Information Systems. Several of the classification systems utilized in this article are proprietary to 3M Health Information Systems, and Dr Goldfield and Mr Turnipseed contribute to the development of these classification systems.
Funding
The authors disclosed receipt of the following financial support for the research, authorship, and/or publication of this article: This study was supported by internal 3M Health Information Systems funds.