
Abstract
Hospital engagement networks (HENs) are part of the largest health care improvement initiative ever undertaken. This article explores whether engagement in improvement activities within a HEN affected quality measures. Data were drawn from 1174 acute care hospitals. A composite quality score was created from 10 targeted topic area measures multiplied by the number of qualifying topics. Scores improved from 5.4 (SD = 6.8) at baseline to 4.6 (5.9) at remeasurement; P < .0001. Hospitals with higher baseline scores demonstrated greater improvement (P < .0001) than hospitals with lower baseline scores. Hospitals with larger Medicaid populations (P = .023) and micropolitan (P = .034) hospitals tended to have greater improvement, whereas hospitals in the West (P = .0009) did not improve as much as hospitals in other regions. After adjusting for hospital characteristics, hospitals with improvement champions (P = .008), a higher level of engagement with their state association (P = .001), and more leadership involvement (P = .005) in HEN demonstrated greater improvement.
National health care quality improvement (QI) campaigns are attracting considerable attention from policy makers, payers, and leaders of health care organizations. Numerous efforts, such as the Institute for Healthcare Improvement’s 100 000 Lives Campaign, the Five Million Lives Campaign, and Agency for Healthcare Research and Quality–funded initiatives in reducing infections have demonstrated evidence that large-scale impact is achievable.1-3
The largest of these QI efforts is the Centers for Medicare & Medicaid Services’ (CMS’s) Hospital engagement networks (HENs). As part of the Partnership for Patients (PfP), HENs worked to develop learning collaboratives for hospitals and provide an array of educational and improvement assistance strategies and activities seeking to reduce patient harms and preventable readmissions. During the 3 years (2012 to 2014) in which the initial HENs operated, all were held accountable by CMS for decreasing 11 hospital-acquired conditions by 40% and unplanned readmissions by 20%. More than 3700 hospitals worked toward these goals under the direction of one of 26 HENs, funded through the PfP. Of these hospitals, 1485 (40%), drawn from 29 states, the District of Columbia, and Puerto Rico, were represented in this project. 4
A better understanding of how these efforts affect different types of hospitals and of which specific improvement activities are best at reducing harms is warranted. HEN hospitals were encouraged to: participate in events such as improvement training, make internal changes designed to support improvement efforts, more effectively engage patients and families in hospital planning, and collect, report, and use data to drive improvement efforts. Although there are conceptual and empirical reasons to believe that these activities have value, the goal of this work is to determine whether particular forms of engagement were related to larger amounts of improvement in targeted areas.
Methods
The Health Research and Educational Trust Institutional Review Board reviewed the project and classified it as a QI project that did not constitute human subjects research.
The hospital associations representing all 50 states, Puerto Rico, and the District of Columbia were contacted and offered the opportunity to collaborate with this HEN project. Ultimately, the researchers collaborated with hospitals and hospital associations representing 29 states, the District of Columbia, and Puerto Rico. Data used for this report include information collected from the 1485 hospitals actively participating in the project activities. This HEN project was open to all acute care hospitals willing to commit to the PfP goals, engage in improvement efforts, and collect and report required process and outcome data.
Analyses were limited to hospitals that reported at least one of 15 hospital-acquired conditions quality measures at both the baseline and remeasurement period (n = 1331). Of these, data were included from only general and medical surgical hospitals (n = 1201); 27 hospitals were dropped from analyses because they had a composite denominator size at either baseline or remeasurement of fewer than 20, leaving 1174 hospitals in the analyses.
Baseline and Remeasurement Periods
Hospitals self-reported their QI measurement numerators (number of occurrences) and denominators (number of admissions or number of days) from the beginning of the project in December of 2011 through its conclusion in December of 2014. Hospitals were encouraged to submit data monthly and to include baseline data from before 2012 but sometimes reported their numerators and denominators for time periods longer than one month. The baseline period was defined as any month of data prior to April 2012, using all available data in this period. Improvement efforts began in January of 2012, but because implementing improvements takes time, measurable improvements were not expected to occur prior to April 2012. The remeasurement period was May 2014 to October 2014. Only the last 3 months of available data in this period were used to create a remeasurement rate. A hospital had to report at least 3 months of data in both the baseline and remeasurement periods in order for that QI measure to be included.
Quality Measures and Topics
For the 15 measures, a low score represents higher quality. Numerators and denominators for measures were scaled so that they represent the equivalent of one reporting month. A total of 10 topic-specific numerators and denominators were created according to the rules in Table 1, after which baseline and remeasurement composite scores were calculated by summing topic-specific numerators and denominators.
Measures Used to Define Topic-Specific Summary Measures.
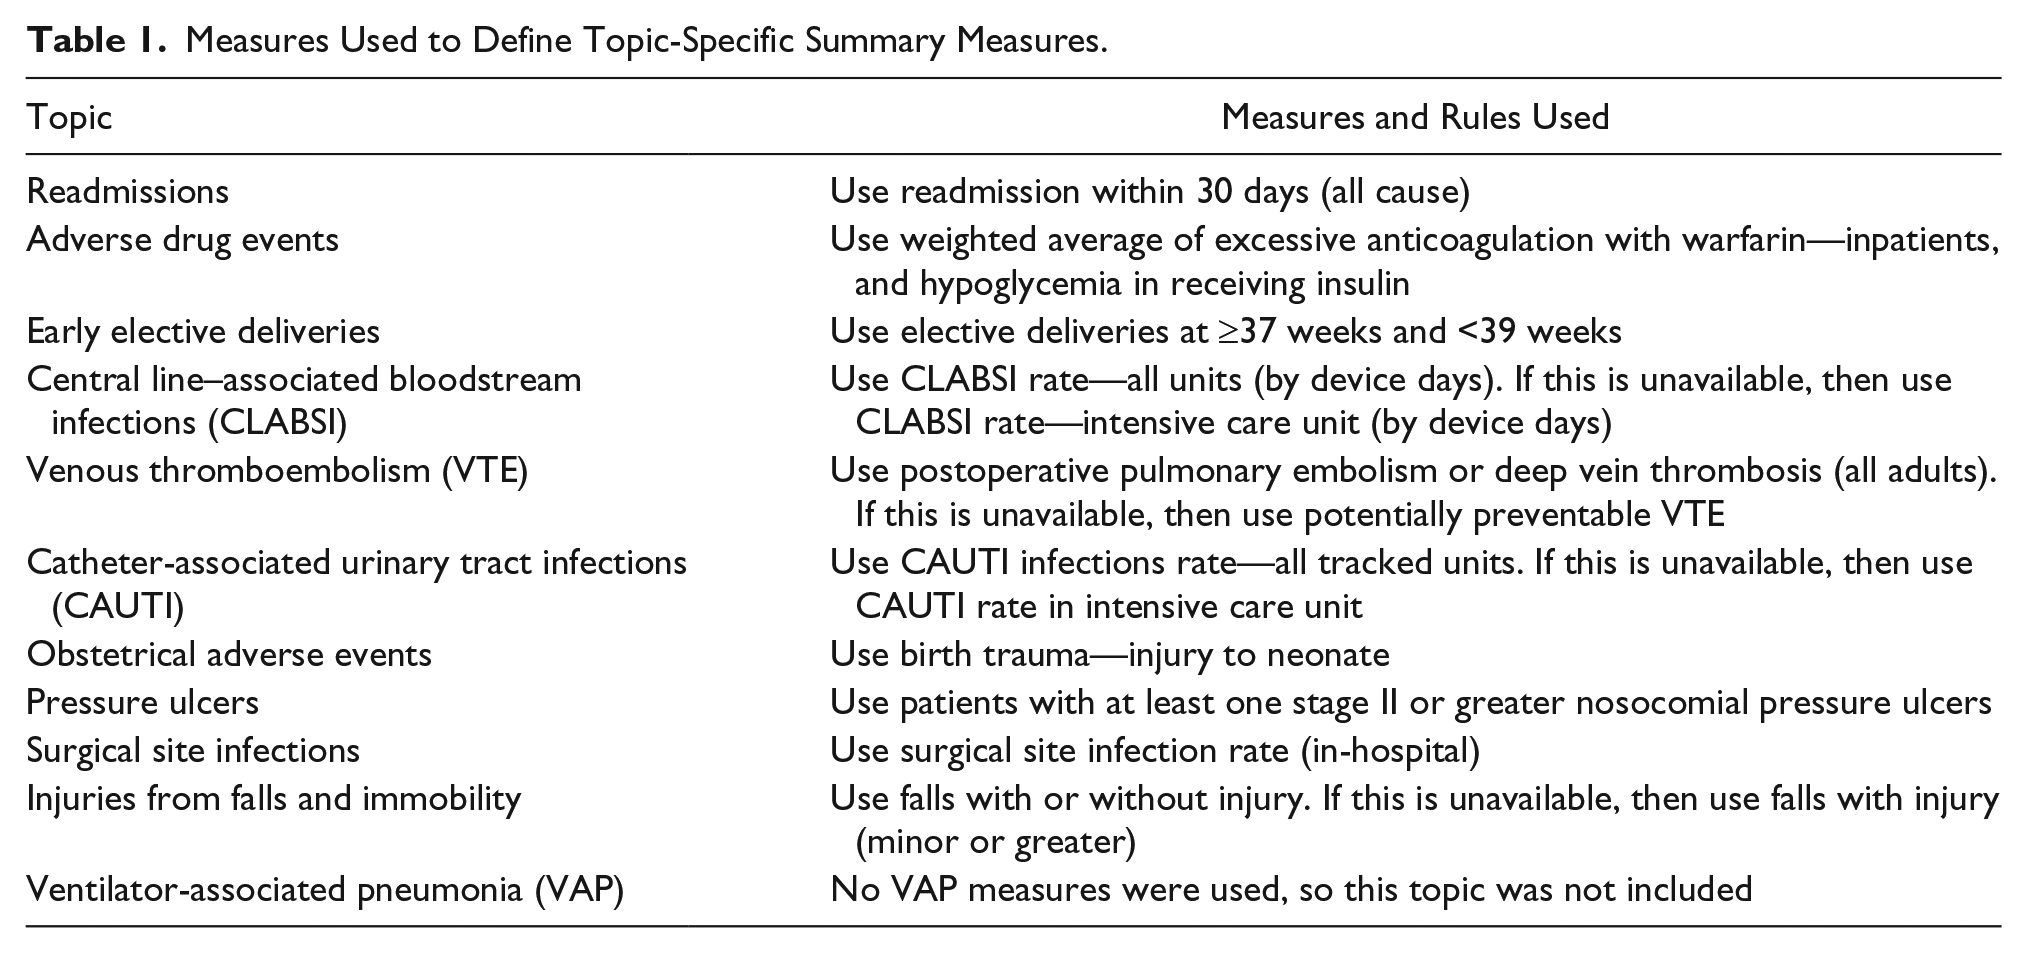
Although change in the initial composite score represents the average amount of change observed across all measures on which the hospital submitted data, it does not reflect the number of topics the hospital was actively working to improve. Because PfP sought to reduce harms across multiple topics, a weighted composite improvement measure was created to reflect volume of change achieved across all topic areas that the HEN initiative was targeting. This weighted composite equaled the initial composite score times the number of topics for which the hospital reported data. The initial composite score was unrelated to the number of topics measured (r = 0.012; P = .68). The weighted composite score provides the best option for capturing the overall change in measures by the hospital across the 10 harm topics, and this is the outcome measure reported throughout this article.
Hospital Characteristics
Eight hospital characteristics were used to examine whether outcomes were linked to type of hospital. The variables include the following: whether the hospital was critical access, bed size, urban/rural status, region, type of ownership (profit, nonprofit, government), and teaching status. Percentage of admissions with Medicare payment and percentage of admissions with Medicaid payment cutoff points were identified using the median of all hospitals in the project. Safety net hospitals were identified using the ratio of Medicaid volume divided by the total volume. A hospital was classified as a “safety net” if the ratio was greater than the state mean plus the state standard deviation.5,6 Hospital characteristic information was obtained from the 2013 American Hospital Association Annual Hospital Survey.
Engagement Measures
The researchers constructed engagement measures designed to reflect variability in the extent to which each hospital participated in HEN project improvement activities. The 5 domains of engagement used were the following:
Number of improvement events attended by hospital staff
Number of improvement fellows
State hospital association (SHA) assessment of how engaged the hospital was in improvement in HEN
SHA assessment of how engaged hospital leadership was in improvement in HEN
Duration of involvement in the HEN project
Improvement Events
Improvement events were educational, and training opportunities focused on one or more topics targeted in the PfP. These included both in-person multisession events and web-based instruction or coaching on improvement strategies that were provided by the project team or by CMS. The study measures reflect the number of events the hospital participated in as well as the total participants and total unique participants across events during the intervention period. The events that are included in the analysis were the ones administered by this project team on the national level. Hospitals may have participated in events provided by the SHAs or other QI initiatives during this same time period, which are not reflected in the measures compiled for this study.
Equipping Staff to Be Improvement Leaders
Hospitals were encouraged to enroll staff in an improvement fellowship initiative designed to equip them to champion improvement projects within the hospital. This initiative provided in-person and web-based training and support in areas that included improvement science, data and measurement, overcoming common improvement challenges, and specific improvement strategies linked to the 10 targeted PfP areas. Fellows were classified as either junior, senior, or champion fellows based on their backgrounds as well as the amount and types of trainings they participated in. The study measures represent the number of fellows of each type from participating hospitals.
SHA Ratings
QI learning opportunities occur outside of this project. The relationship between hospitals and their SHAs provides a method to measure hospital participation in other events. Each SHA was asked to assess each hospital in their state based on whether it demonstrated close engagement with PfP during 2012-2013.
The researchers emphasized the importance of engaging with hospital leadership and provided concrete recommendations related to how engagement with these groups might be operationalized and measured. Engaging with this group was rated by the SHAs based on whether the hospital had strong leadership engagement with the HEN goals.
Duration
Duration was measured as the number of months the hospitals were in the HEN project.
Combined Engagement Score
A single combined measure of engagement was created by combining the 5 distinct elements on a 12-point scale. Hospitals were given up to 3 points based on the total number of events depending on the following categories: 0, 1 to 2, 3 to 5, and 6 or more. Hospitals were given up to 3 points based on whether they had at least 1 junior fellow, at least 1 senior fellow, and at least 1 champion fellow. SHA rating of hospital engagement and leadership were each converted to up to 2 points (low = 0, medium = 1, high = 2). Finally, hospitals were given zero points for a duration ≤12 months, 1 point for a duration between 13 and 24 months, and 2 points for a duration between 25 and 36 months.
Statistical Analysis
Paired t tests were used to assess whether there was a change in scores over time. To assess the impact of characteristics on change in scores, the researchers ran repeated-measures models. A categorical “time” variable was used to assess the impact of change over time (pre versus post). The main effect of the characteristic tested for a preexisting difference in scores at baseline. The main effect of time tested for the impact of project (between baseline and remeasure) on scores. The interaction effect assessed whether the categories had a consistent change over time. Hospital identifiers were included in the model as a random effect. The covariance structure of the repeated-measures analysis was unspecified.
For analyses of engagement, the researchers also ran mixed models that included adjustment for region, general medical and surgical services, and urban/rural status (ie, Core-Based Statistical Area [CBSA] code). These variables were selected based on an observed relationship with the weighted composite score.
To assess the relationship between baseline scores and change over time, the baseline scores were used as predictor variables in a regression model to predict change scores. To quantify the amount of variance in change over time, the researchers used regression models with change score composites as the outcome variables and reported the coefficient of determination (R2). All analyses were conducted using SAS V9.4 (SAS Institute Inc., Cary, North Carolina).
Results
HEN Outcomes and Hospital Characteristics
Table 2 reports overall baseline and remeasurement scores for the weighted composite score and each individual improvement area. Statistically significant improvements were observed from baseline to remeasurement in 5 of the 10 targeted areas and on the weighted composite measure used to assess relationships between hospital characteristics and engagement and the overall impact of HEN.
Mean Baseline and Remeasure Scores, by Topic and for Weighted Composite Measures. a
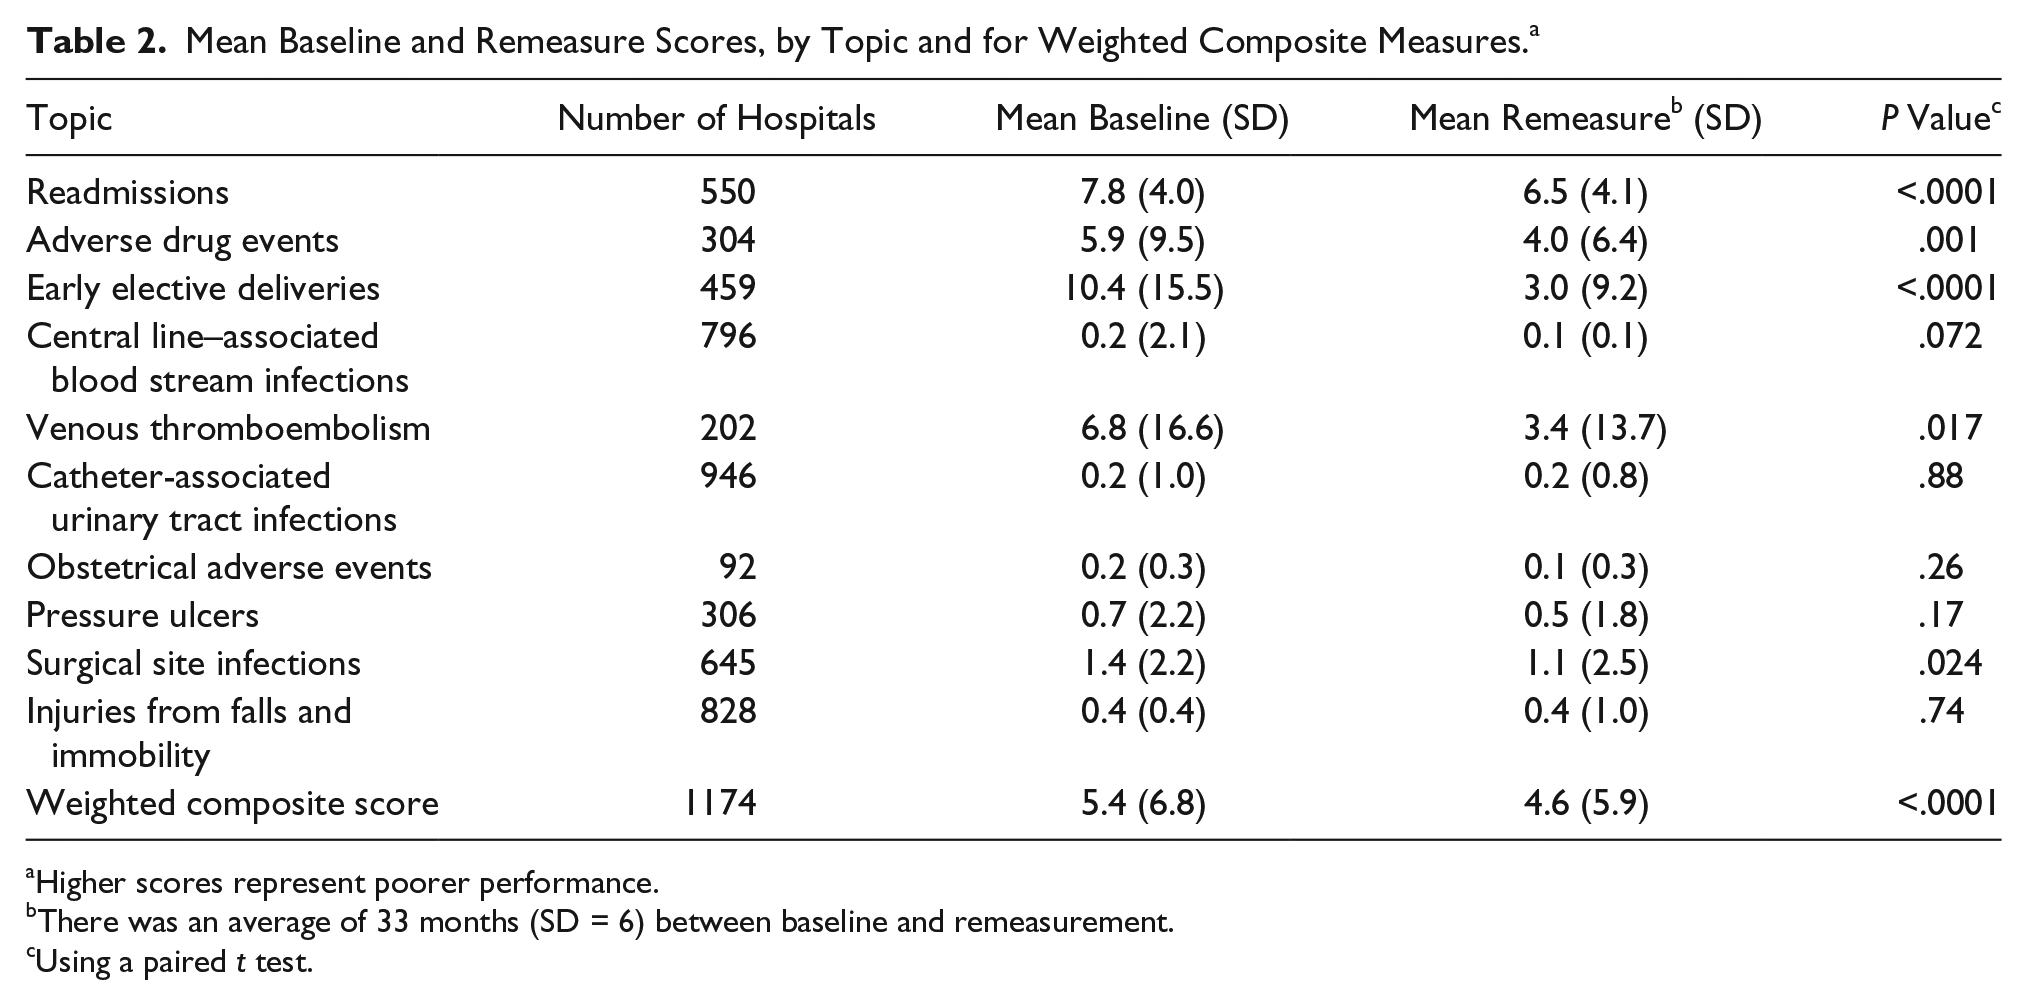
Higher scores represent poorer performance.
There was an average of 33 months (SD = 6) between baseline and remeasurement.
Using a paired t test.
How baseline scores affected amounts of observed improvement on the composite outcome measure also was examined. Hospitals with poorer baseline scores improved significantly more than those with better scores at baseline; P < .0001. Baseline scores accounted for 14.2% of the variability in the change in scores.
Table 3 reports relationships between hospital characteristics and the weighted composite score at baseline and remeasurement. Hospitals with more Medicaid admissions, micropolitan hospitals, and government-owned hospitals all had higher scores at baseline. Hospitals from the West and Midwest and teaching hospitals had lower scores. Percentage Medicaid, region, and CBSA type had statistically significant interactions with time. Hospitals with more Medicaid admissions had more of an improvement than those with fewer Medicaid admissions. Micropolitan hospitals had more improvement than the other locations. The North, the East, and especially the South had a larger decrease in scores than the West. The South had the highest baseline score, and the West had the lowest. The West had little room for improvement and showed no improvement in scores, whereas the South had the most room for improvement. Using the change in the weighted composite score as the outcome measure, the total amount of variance explained, using all the demographic variables to predict change score, was 3.4%.
Baseline and Remeasurement Weighted Composite Scores, a by Demographic Characteristics.
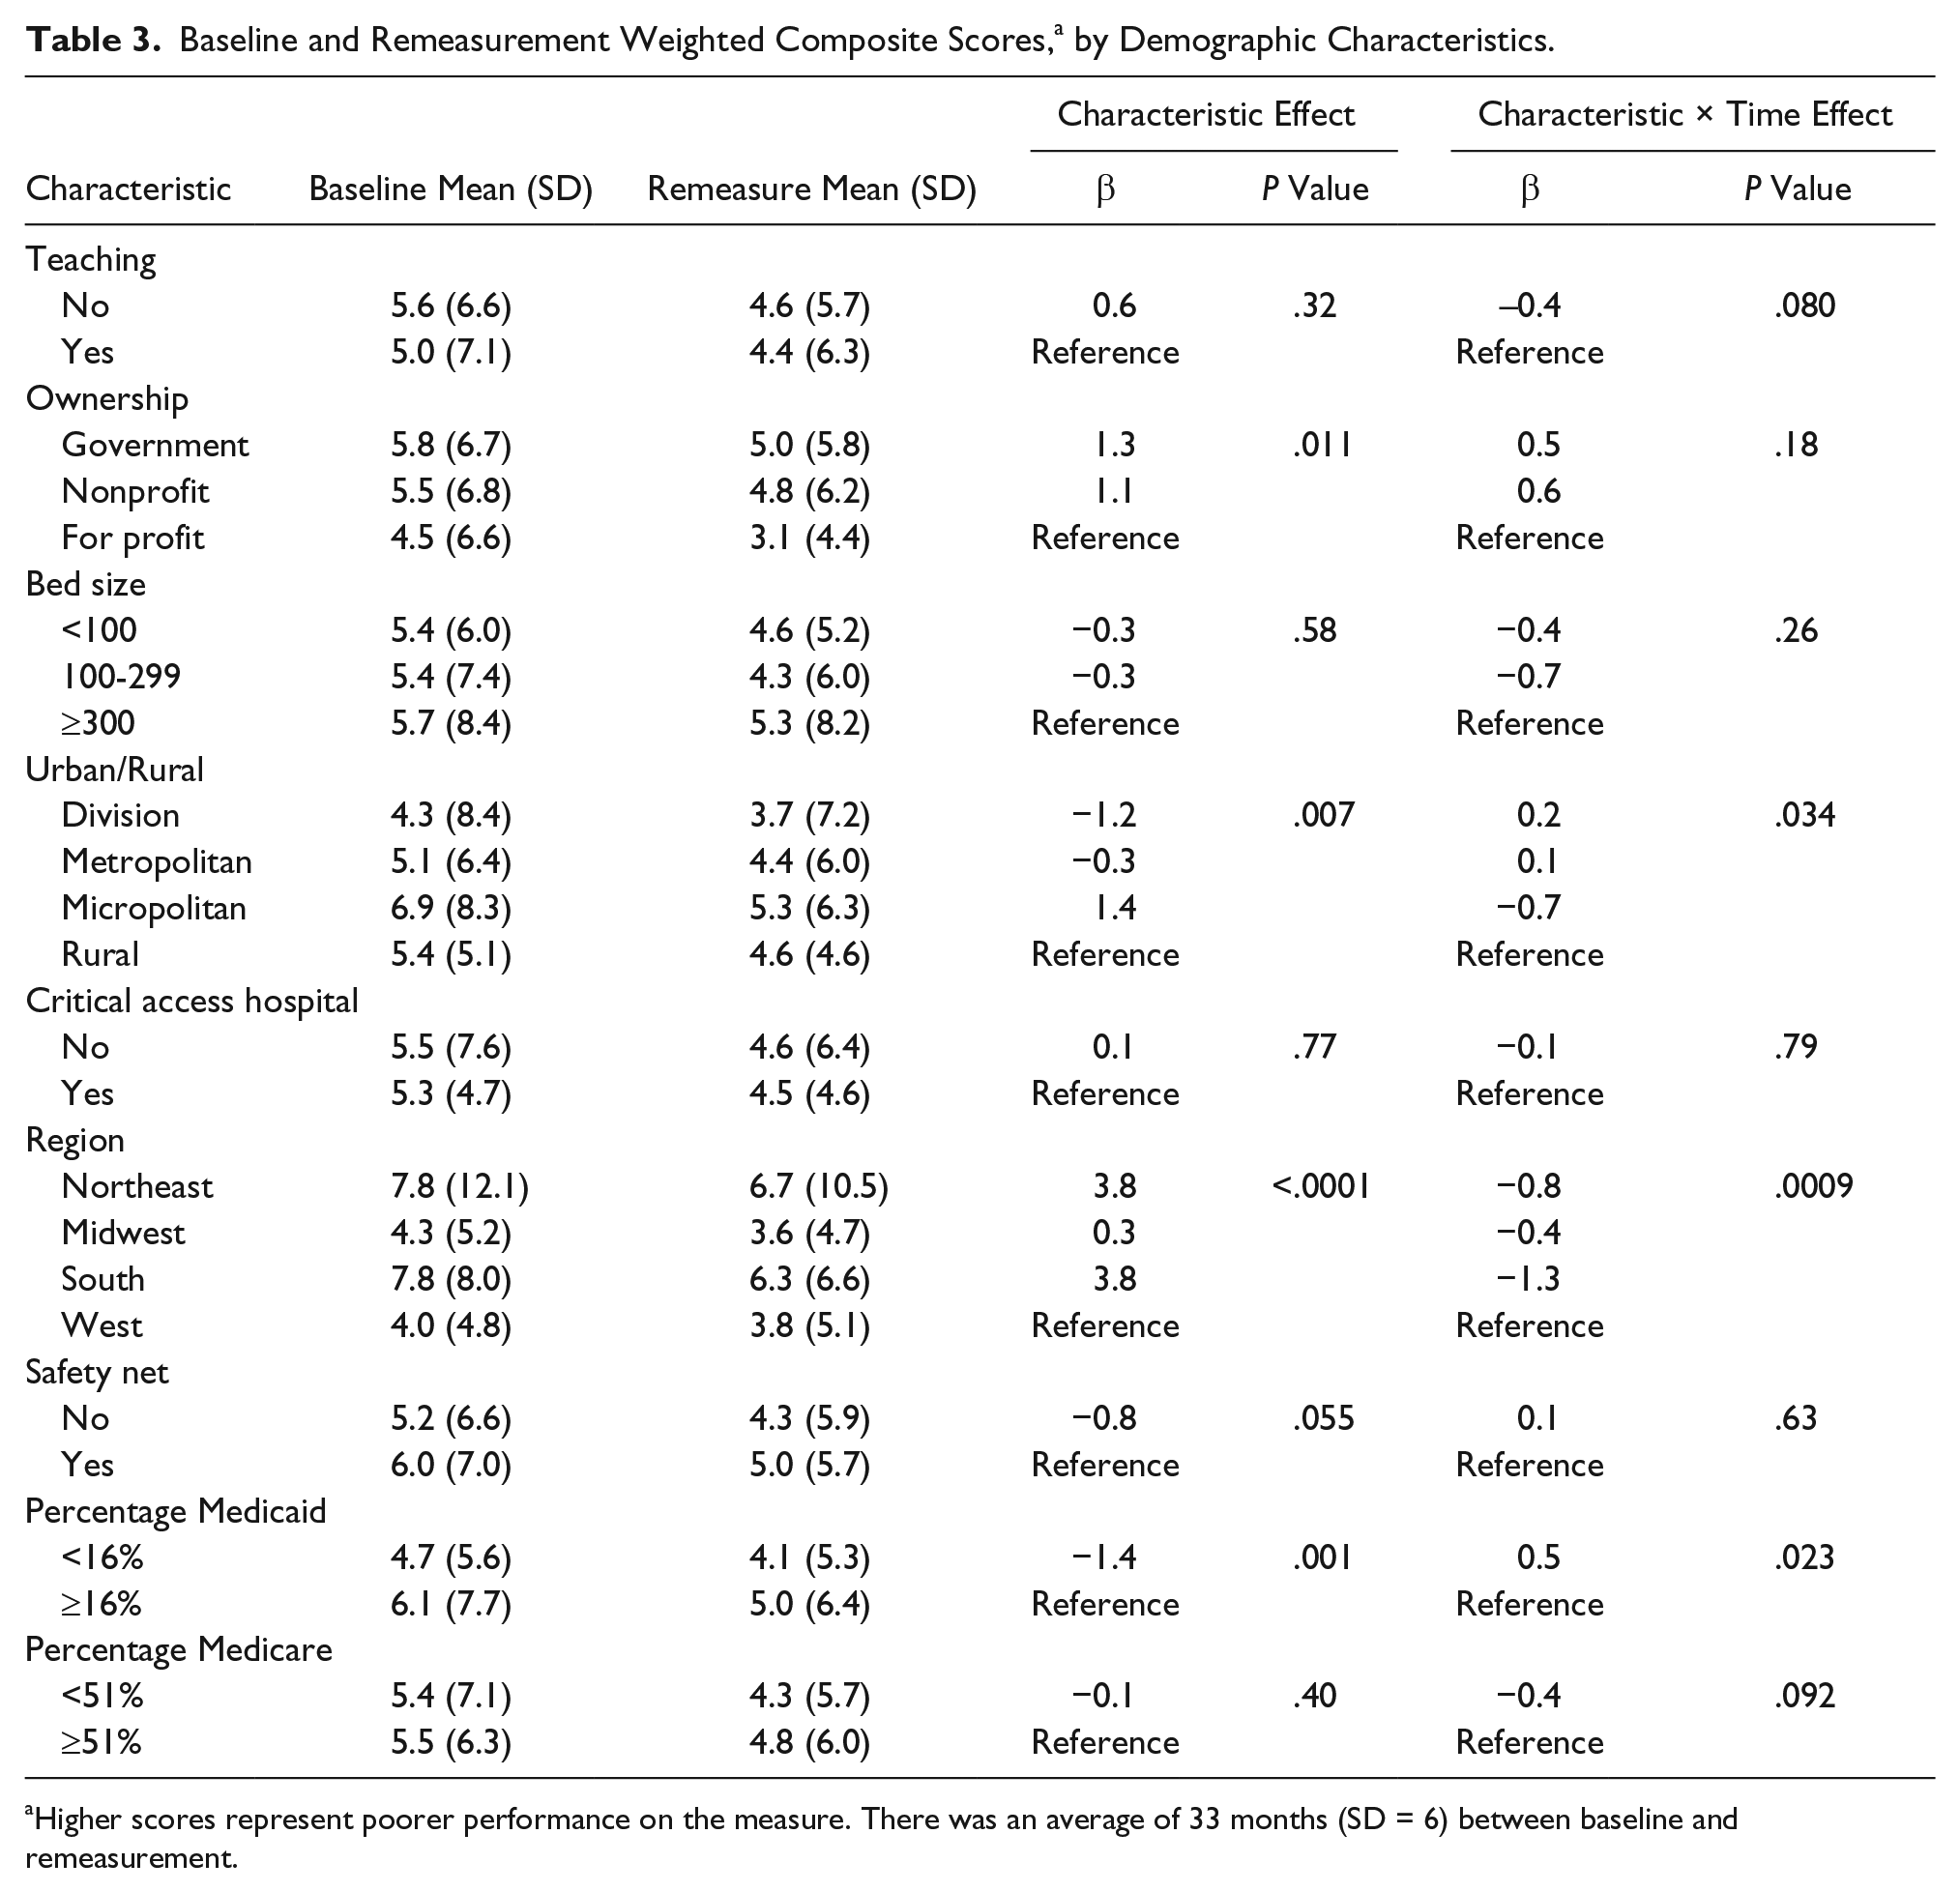
Higher scores represent poorer performance on the measure. There was an average of 33 months (SD = 6) between baseline and remeasurement.
HEN Outcomes and Engagement
Table 4 shows descriptive statistics of these measures of hospital engagement.
Descriptive Statistics of Event and Engagement Measures.
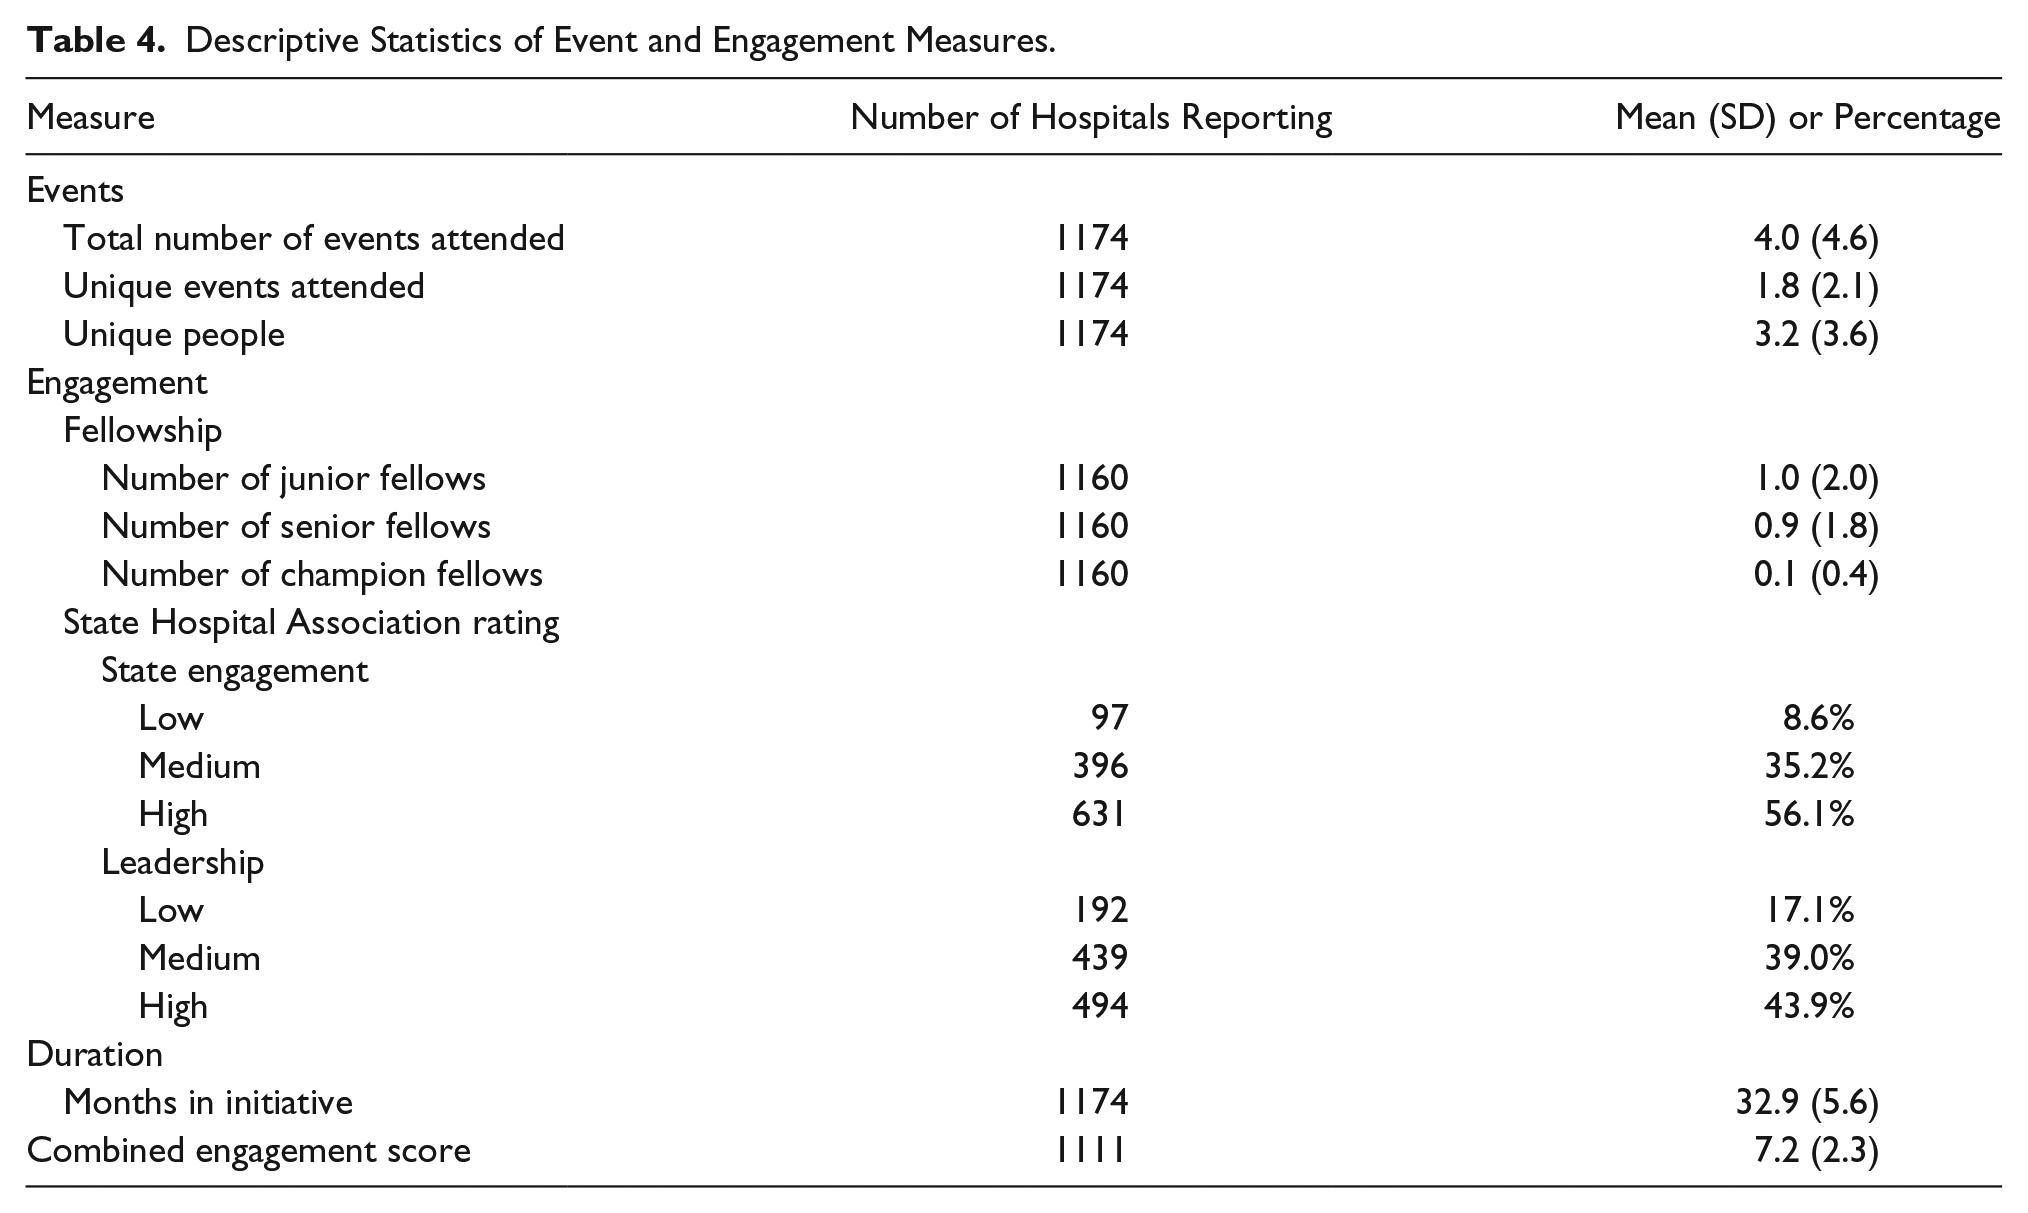
Table 5 shows the relationship between the engagement measures and the weighted composite score. Total number of events attended and number of champion fellows are examples that illustrate the findings; hospitals that attended more events had higher weighted composite scores at baseline (higher scores means poorer performance; β = 0.2, P = .0003). Hospitals that attended more events decreased scores between baseline and remeasure more than hospitals that attended fewer events (β = −0.1; P = .025). After adjusting for region, percentage Medicaid, and CBSA code, the effect of total number of events attended on change in scores was attenuated (P = .068). Similarly, hospitals with more champion fellows had higher weighted composite scores at baseline (β = 2.0; P < .0001). For every champion fellow a hospital had, they reduced their scores over time by 0.9 points more than hospitals without champions (P = .005). Unlike with the total number of events, after adjusting for region, percentage Medicaid, and CBSA code, the effect of the number of champion fellows remained statistically significant (P = .008).
Relationships Between Engagement Measures and Improvements in Weighted Composite Measure.
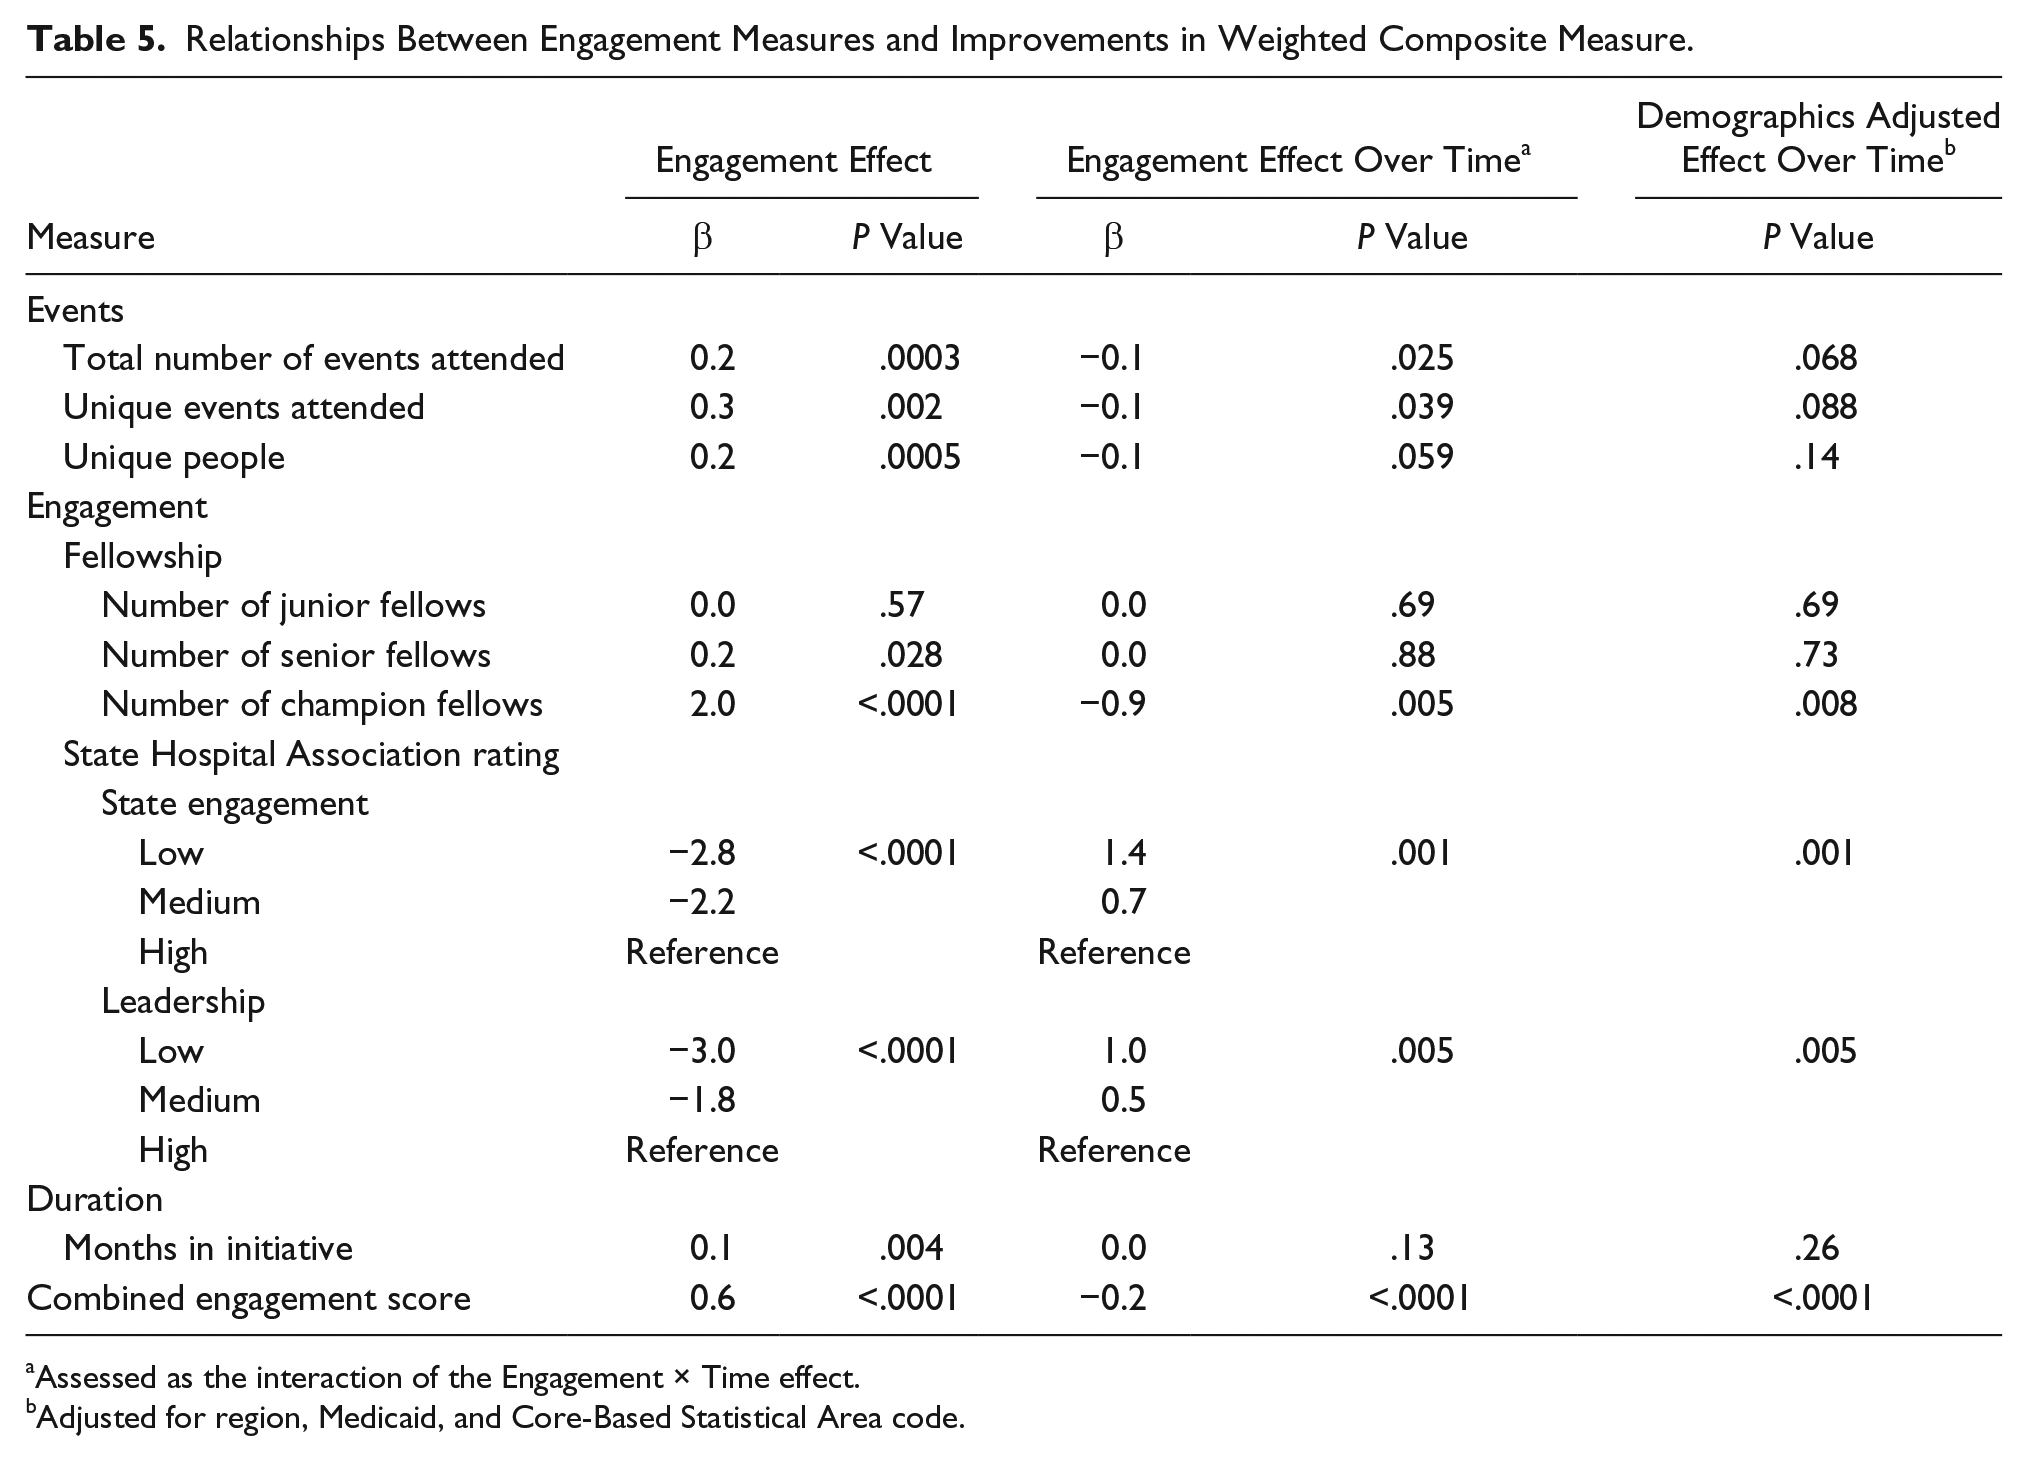
Assessed as the interaction of the Engagement × Time effect.
Adjusted for region, Medicaid, and Core-Based Statistical Area code.
Many of the engagement measures were significantly associated with baseline scores. Hospitals with higher baseline scores attended more events, had more senior and champion-level improvement fellows, and spent more time in the HEN project. They also were rated as having more engagement and leadership involvement than hospitals with lower baseline scores. The engagement measures that predicted change in scores over time were total number of events attended, number of unique events, number of champion fellows, SHA rated engagement, and leadership involvement. After controlling for demographic characteristics, the number of champion fellows (P = .008), SHA rated engagement (P = .001), and leadership involvement (P = .005) remained statistically significant. Using the change in weighted composite score as a dependent variable, the total amount of variance explained by the model, using all the engagement measures as predictors, was 2.6%. Higher scores on the combined engagement measure also was associated with greater reduction in composite scores over time (β = −0.2; P < .0001).
Discussion
This HEN project was associated with improvement in half of the individual topic areas and in the composite score. (CMS defined success using one of 3 metrics: whether a hospital’s baseline and remeasurement rates were essentially zero; whether a defined benchmark was met; or whether significant improvement was achieved. The present analyses focused on change in scores, so these results reflect lower levels of improvement than those reported in the project final report. Moreover, analyses reported herein reflect absolute rather than relative reductions in harms, also making the magnitude of HEN impact appear smaller than reported elsewhere.) Topic areas where improvements were not significant tended to be those with very low baseline rates, which made further improvements difficult to observe.
These results dispel concerns that national QI campaigns disproportionately improve the quality of hospitals serving more advantaged populations. Limited differences were found in the baseline scores of safety net hospitals, teaching hospitals, and hospitals serving large percentages of Medicaid patients and the scores of hospitals without these characteristics. The amounts of improvement observed in hospitals during the HEN campaign also were comparable across hospital type, except that hospitals with large Medicaid populations and micropolitan hospitals had greater improvement than hospitals with low Medicaid populations and that hospitals in the West did not improve as much as hospitals in other regions. Separate analyses indicate that the largest amounts of improvement occurred in hospitals with the highest rates of harm at baseline. Although regression to the mean and floor effects partially explain this finding, it suggests that national QI campaigns can be conducted in ways that reduce variability in care quality across hospitals, including those serving disadvantaged populations.
These findings also provide insights into factors that may contribute to success in national QI campaigns. The combined engagement score, driven mainly by the number of champion fellows and the SHA ratings of participation in state-level events and leadership engagement, was related to increased improvement. However, the researchers do not recommend dropping the components that were not associated with improvements from future QI projects. Attending events was only marginally associated with improvements, but this is a substantial mechanism for transferring information. It may be more important for the right people to attend the educational sessions that are most applicable to them than for hospitals to send more people to more events. Efforts to create improvement champions through the fellowship program were associated with improvement in outcomes. Although the same relationships were not observed for less well-equipped fellows, the researchers believe that their impact will occur over a longer period of time and was not captured in the remeasurement period used for these analyses. The lack of an impact of duration in the project on these results is not surprising because there was relatively little variation in the number of months in the HEN.
Limitations
The quality measures used herein were self-reported and may be subject to bias. However, this bias is likely to have occurred consistently over time and so had little impact on measures of change in outcomes. The ratings of engagement and leadership involvement by SHAs may not have been done consistently across states. In states that had higher level of engagement than other states, the bar for being rated as “medium” or “high” may have been higher than in states that tended to have a lower level of engagement. Events hosted by SHAs were a substantial part of the HEN. The only data for these were collected categorically through the SHA ratings of engagement and were not reflected in the numeric measures of events. Additionally, the events data were collected in a way that did not allow individual participants to always be matched with the hospitals that they represented. Future projects will benefit from additional information regarding the extent and types of improvement activities hospitals have participated in. They also will benefit from using a smaller set of outcome measures that hospitals must report. To encourage broad participation in HEN, CMS allowed hospitals to use a wide array of outcome measures; this project collected more than 130 such measures. When the analyses were limited to 15 of the most widely used and validated measures, many hospitals’ data were excluded. For the subsequent HEN 2.0 project, CMS has addressed this by identifying 19 standardized measures to focus on, which will make assessing impact appreciably more accurate.
Secular trends, regression to the mean, and floor effects also affect conclusions that can be drawn from these analyses. Creating control groups to assess the impact of secular trends is exceptionally challenging in projects designed to include a large majority of hospitals in the country, particularly when a reluctance to collect and report data is one of the largest stated reasons for not participating in the project. Although the large number of hospitals with harm rates approaching zero certainly complicates analyses, these hospitals must be included in campaigns such as HEN to help mentor less advanced peers and because these hospitals have other harm areas where improvements are needed.
It is important to recognize that many hospitals did not work on all targeted harm areas for the 36-month duration of the HEN project. Many began focusing on numerous areas and expanded their efforts over time. Although this strategy allowed the HEN initiative to engage with many hospitals that would not have committed to QI efforts in 11 distinct topics at the outset, it complicated efforts to analyze the impact of interventions. Better tracking of when hospitals began working on various topics would enhance the ability to assess changes over time and ensure that baseline and remeasurement periods are correctly defined.
Finally, in areas where there were significant effects at baseline (ie, hospitals with higher baseline scores had a higher number of attendances at events), it is not clear whether greater improvement in scores among those with more engagement relative to those with lower levels of engagement was related to attendance or to a combination of regression to the mean and because those hospitals with more engagement had more room to improve. In addition, because hospitals with “poor” baseline scores were not targeted to attend events, these hospitals probably self-identified as needing improvement and “engaged” more in the HEN.
Conclusion
Quantifying the impact of large-scale improvement efforts has proven challenging, and data regarding specific factors that contribute to improvement are limited. A recent study enumerated 4 components of “dose” that should be considered in QI projects. 7 Although this study’s measures have limitations, each of these 4 components is touched on in the current report: quantity (using number of events), intensity and reach (using SHA ratings of engagement), duration and scope (using months in HEN), and composite (using the combined engagement score). As in many QI projects, quantifying measures of engagement was a low priority for the HEN project. Incentivizing contractors to collect sufficient process data to capture both what improvement activities are being attempted and how well those efforts are being implemented, as well as consolidating the outcome measures participants must report, will greatly enhance future efforts to understand how to maximize the impact of investments in large-scale improvement campaigns.
Footnotes
Acknowledgements
The authors gratefully acknowledge the encouragement and support of Dennis Wagner, MPA, and Paul McGann, MD, for conducting the analyses on which this article was based and for supporting HEN efforts to understand factors associated with better results. Their leadership of the Partnership for Patients and the Hospital Engagement Network was foundational to all our efforts. Charisse Coulombe, MBA, MS, Vice President of Clinical Quality, Jessica McNab, MA, LSW, Director of Clinical Quality, and members of the HRET HEN staff led efforts to obtain data on which this article is based and helped interpret patterns in the data that we observed. Mariana Lesher, MS, Ed Bartholomew, MBA, MS, Fatemeh Kiani, MA, DrPH, Vrinda Mahishi, MPH, Julia Heitzer, MS, Candice Scott, MPA, Paul Cholod, MA, Rich Rodriquez, MPH, and Annette Urganus, MPH, contributed to the compilation and management of the data on which this article is based.
Declaration of Conflicting Interests
The author(s) declared no potential conflicts of interest with respect to the research, authorship, and/or publication of this article.
Funding
The author(s) disclosed receipt of the following financial support for the research, authorship, and/or publication of this article: The work was supported by the Centers for Medicare and Medicaid Services (Contract Number HHSM-500-2012-00017, titled, “Hospital Engagement Network for Partnership for Patients Initiative”).