
Abstract
Multistable perception, characterized by spontaneous alternations between perceptual states, has garnered increasing attention in autism research, because atypical performance in multistable perception tasks has been suggested as a behavioral marker of this population. However, previous studies in this field have yielded variable and conflicting results leading to inconsistent conclusions. Here we present a computational model integrating key neurocognitive mechanisms, all of which have been considered critical in accounting for atypical behavior in autism, such as bottom-up/top-down processes, the excitation-inhibition (E/I) balance, and neural noise. By systematically altering these mechanisms within an artificial neural network, we explored their functional roles on perceptual fluctuations. Our approach provides a clearer understanding of how specific behaviors may correlate with varied neural and cognitive alterations in autism. This model offers a perspective on key debates in autism research, such as the direction for the excitation/inhibition imbalance, and the possible dominance of bottom-up processing. Moreover, this model challenges heuristic single-mechanism theories of autism, favoring neurodiversity approaches by illustrating the spectrum’s complexity, where identical behaviors might result from diverse neurocognitive mechanisms. We highlight the need for future research to employ multiple behavioral tasks to map neurocognitive alterations in autism, aiming for more precise identification and management in therapeutic scenarios.
1. Introduction
Multistable perception (MP) is the alternation between at least two perceptual states that emerge from ambiguous input information. Experimental paradigms of MP such as binocular rivalry and the Necker Cube have been used in search of behavioral markers of psychological and psychiatric conditions (Jia et al., 2020; Ngo et al., 2011; Pastukhov et al., 2013; Safavi & Dayan, 2022; Scocchia et al., 2014), including Autism Spectrum Disorder (ASD) (Kondo & Lin, 2020; Robertson & Baron-Cohen, 2017; Robertson et al., 2013), as there is vast evidence that people with altered neural functioning usually perform with an atypical pattern of perceptual alternations in such tasks. However, the current evidence is far from conclusive, mainly from highly heterogeneous and even contrary results. Understanding the source of such heterogenous results is key to characterize atypical MP, analyze the viability of using it as a behavioral marker of neurodevelopmental disorders, and organize and reconcile previous results. In this paper we offer a simple and abstract computational model of MP aiming to integrate findings from neuroscience, behavior, and cognitive science to explore and understand sources of variability in multistable perception.
1.1. Multistable perception
Multistability in perception occurs when sensory information is ambiguous, leading to two or more interpretations (i.e., percepts) equally likely but mutually exclusive, and alternate spontaneously (Kornmeier & Bach, 2006, 2012; Schwartz et al., 2012). The visual paradigms based on binocular rivalry and the Necker Cube have been the most studied in MP (Blake, 2022; Pastukhov et al., 2013; Schwartz et al., 2012). For our purposes, we will focus on modeling perceptual fluctuations during observation of the Necker Cube: a two-dimensional drawing representing a three-dimensional cube with two possible interpretations (Figure 1) derived from its lower-left and upper-right faces (Koralus, 2016; Kornmeier & Bach, 2005; Wernery et al., 2015). The Necker Cube. Note. The Necker Cube is shown on the left, the interpretation based on the lower-left face in the middle, and the interpretation based on the upper-right face on the right.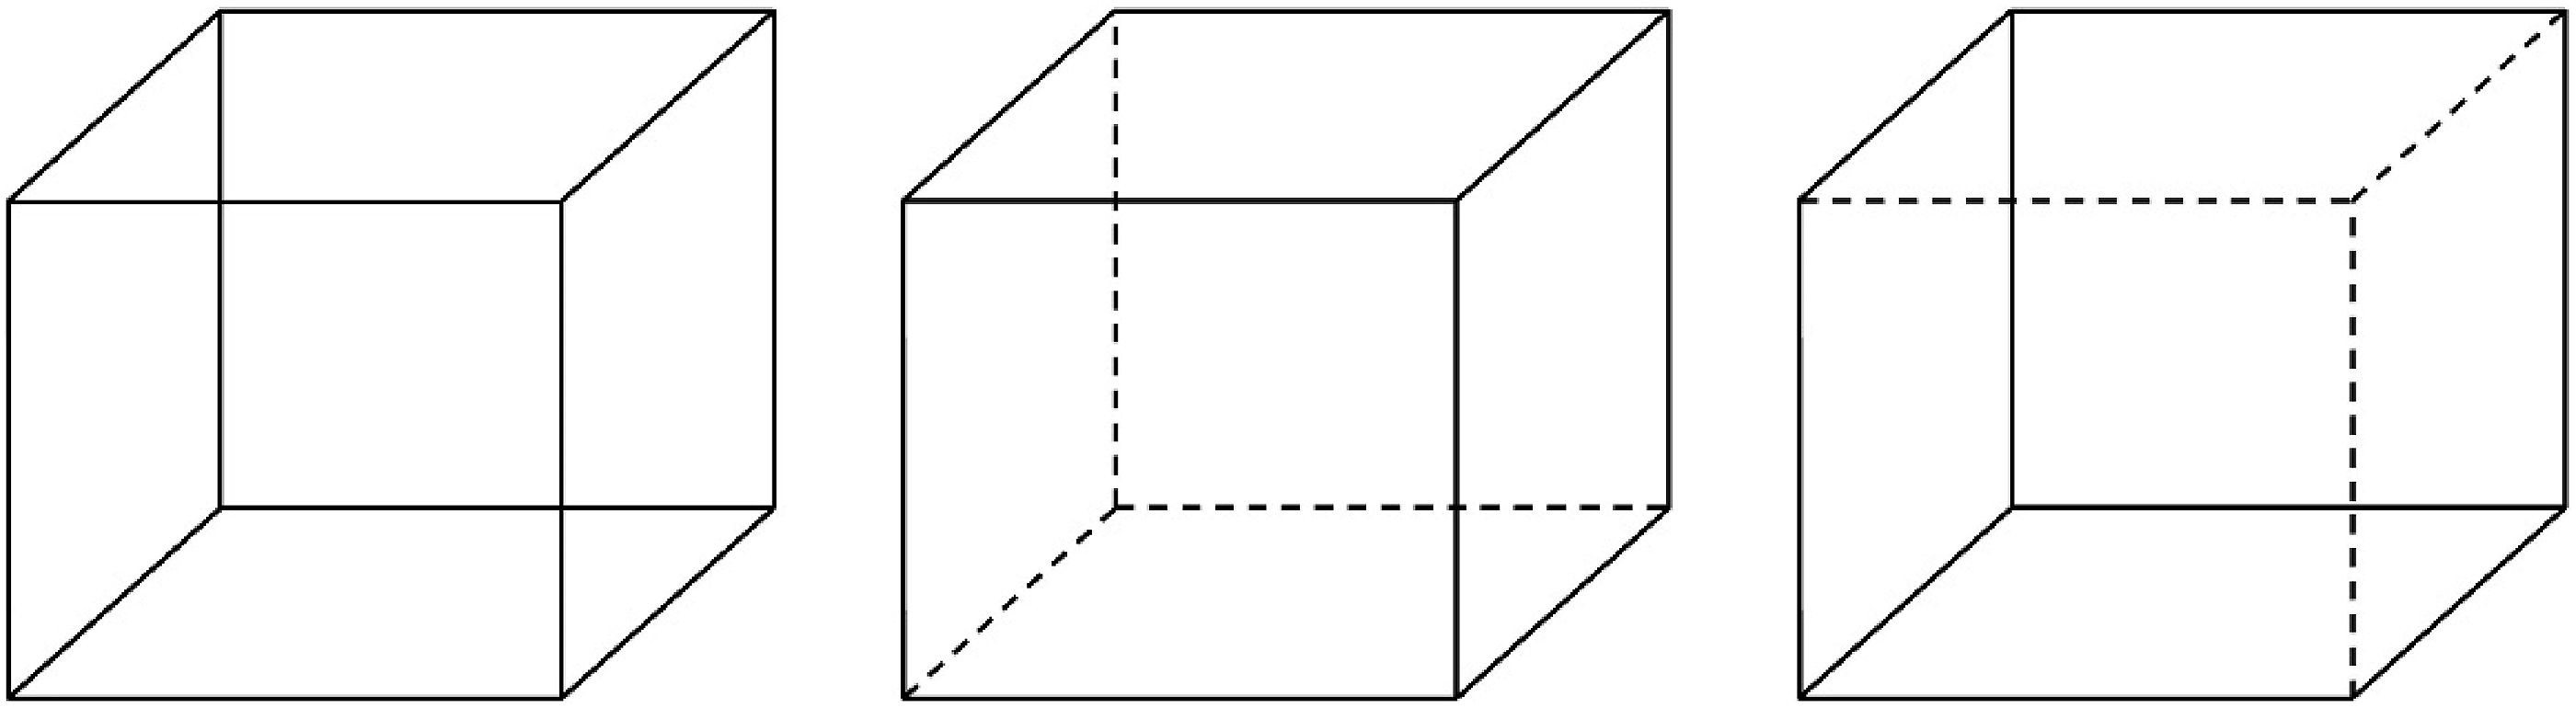
Upon exposure to a multistable stimulus, observers experience both dominance periods, where one percept becomes dominant while the other becomes imperceptible; and mixing periods, where sensory information remains ambiguous, and no single percept dominates (Kornmeier & Bach, 2012). Models of multistability posit that at least two neural processing components compete for perceptual dominance (Blake & Logothetis, 2002; Deco & Romo, 2008; Sterzer et al., 2009) with each percept tied to the activity of a specific neural set that determines the dominant phenomenology (Blake, 2022). This competition is often described as a bistable neurodynamic process, where the system transitions from an ambiguous initial state—referred to as the bifurcation point (Figure 2)—to one of two stable attractor states (Braun & Mattia, 2010; Deco et al., 2013; Moreno-Bote et al., 2007). For the Necker Cube, the existence of two attractors is assumed (Figure 2). Attractors in multistable perception. Note. The left shows a single attractor for a stable object. The right shows two attractors for a multistable object with a bifurcation point (BP) between them; the deeper valley in the second attractor indicates perceptual dominance.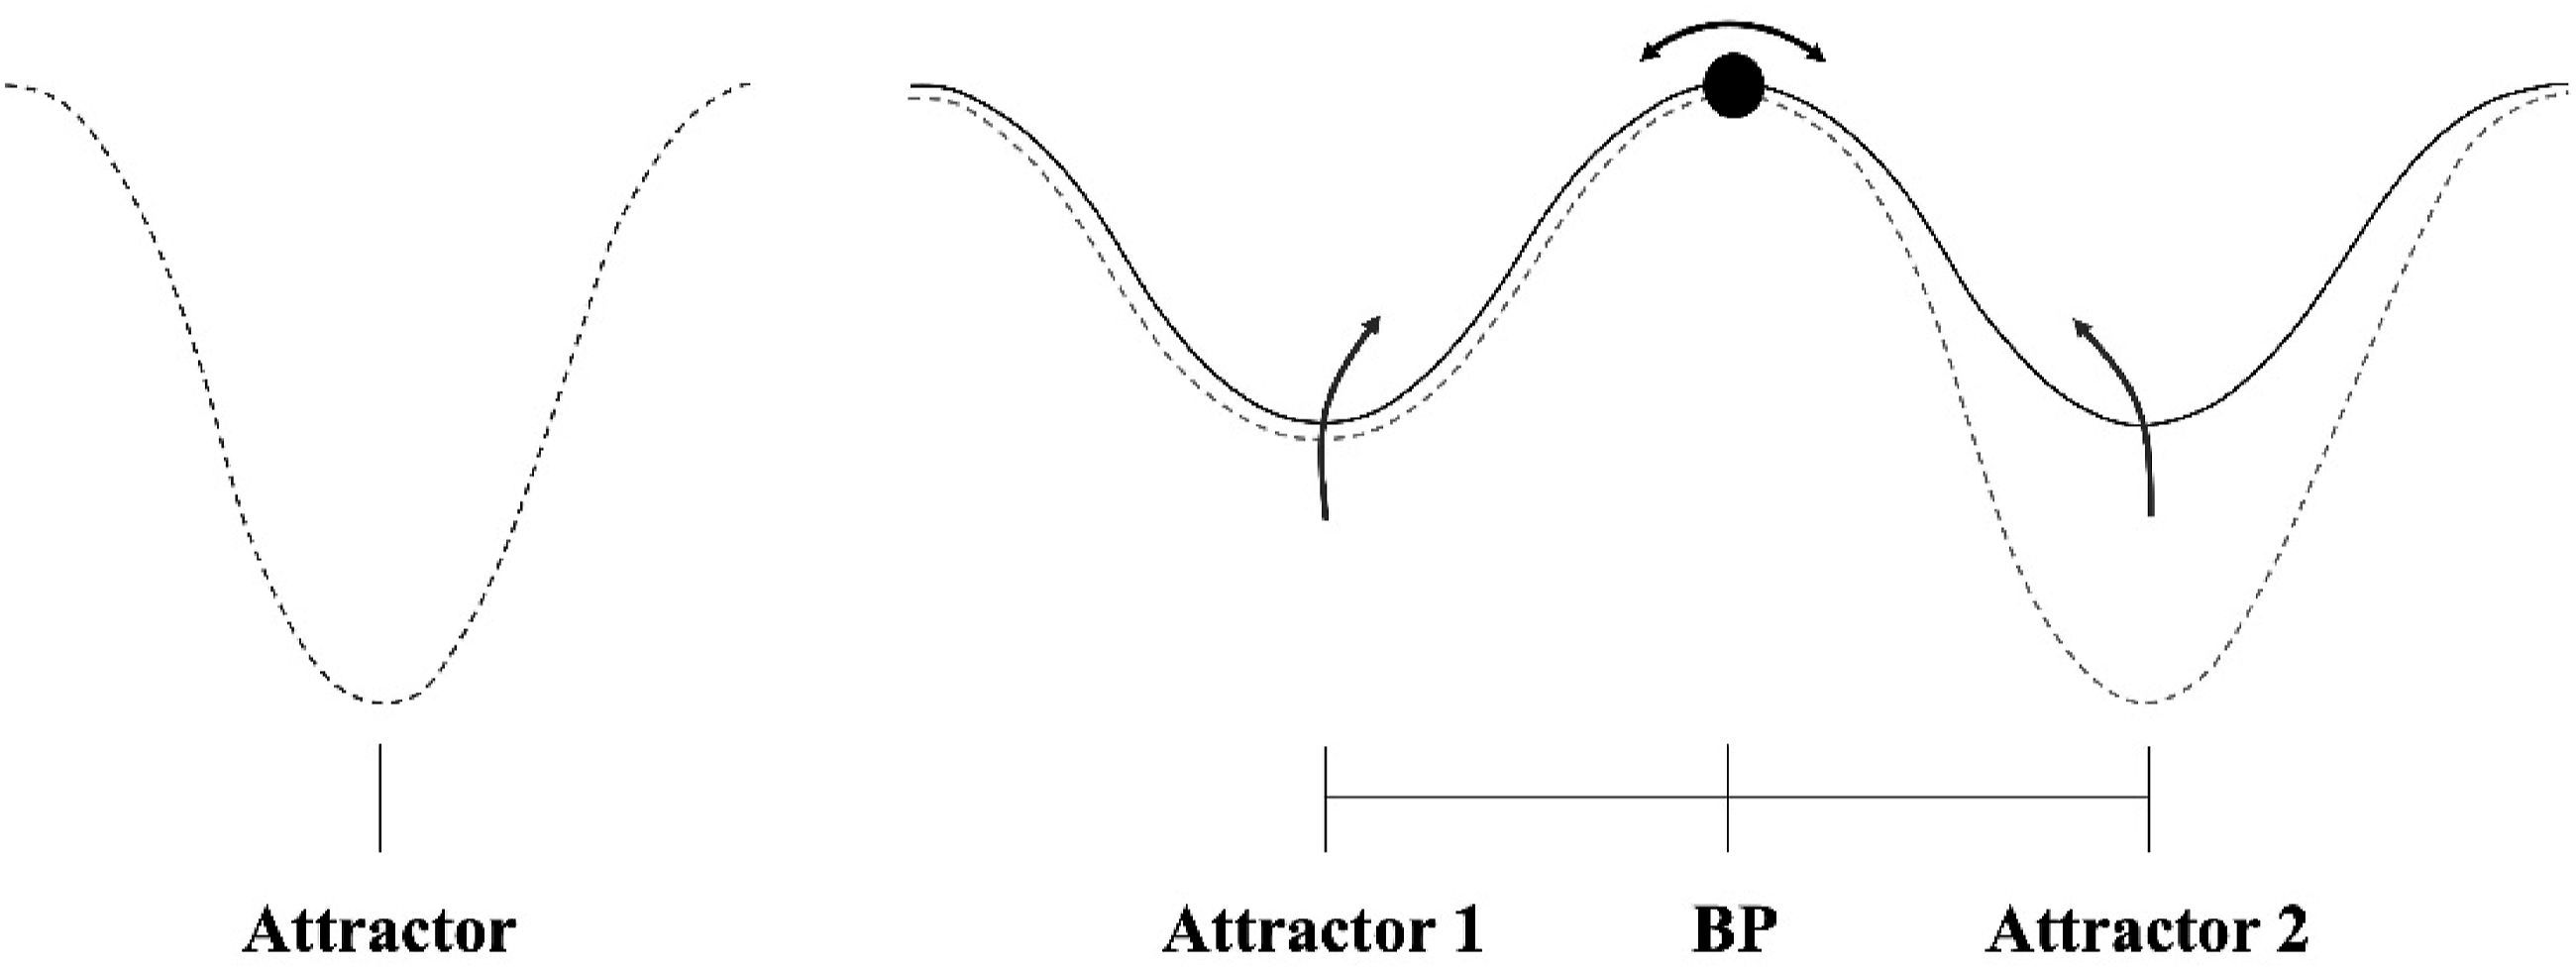
Perceptual fluctuations occur as the system navigates between attractors, with several factors influencing these dynamics by altering the physical properties of the attractors (e.g., their depth), to either facilitate or prevent the transit between them. Key modulatory factors have been postulated, including the interaction between bottom-up/top-down processes, the balance between neural excitation and inhibition (E/I Balance), and the presence of neural noise.
1.1.1. Bottom-up and top-down
Perceptual fluctuations can be modulated by bottom-up processing, including the interplay between passive adaptation, mutual inhibition and recovery of competing neuronal ensembles (Kornmeier et al., 2009). It has been suggested that the characteristics of a stimulus and its mode of presentation during the task influence both the initial perception and the dynamics of fluctuations (Kornmeier & Bach, 2005; Long & Toppino, 2004). On the other hand, top-down processing could also mediate fluctuations, including a certain degree of volitional control (Toppino, 2022; Wernery et al., 2015).
1.1.2. Excitation and inhibition
Multistable perception is usually analyzed through reciprocal inhibitory architectures, involving two neuronal sets whose activities represent the competing percepts (Blake & Logothetis, 2002; Deco & Romo, 2008; Feldman, 1981; Sterzer et al., 2009). The neuronal population of the dominant percept strongly inhibits the competing neuronal population, leading to mutual exclusivity (Kondo et al., 2018; Mentch et al., 2019; van Loon et al., 2013).
The excitation-inhibition balance (E/I) plays a fundamental role in MP and, remarkably, an atypical E/I balance (or E/I imbalance) is one strong candidate mechanism to describe atypical cognition and behavior in autism (Canitano & Palumbi, 2021; Dickinson et al., 2016; Kondo & Lin, 2020; Lam et al., 2022; Rubenstein & Merzenich, 2003; Said et al., 2013; Sohal & Rubenstein, 2019). However, it has been difficult to elucidate how the E/I (im)balance operates, considering that both excitation and inhibition are complementary influences that depend on different neurotransmitters and are ubiquitous in the brain (Dickinson et al., 2016; Kondo et al., 2017; Takeuchi et al., 2017).
Van Loon and colleagues (2013) have suggested that the role of cortical inhibition, mediated by GABA, is to slow down perceptual dynamics (i.e., lower rate of fluctuations) by inducing longer durations of each percept. Meanwhile cortical excitation, mediated by glutamate, increases perceptual dynamics (i.e., higher rate of fluctuations) by inducing shorter durations of each percept. But notably, opposite roles have been proposed for these neurotransmitters and for the role of excitation and inhibition. High GABA concentrations have been correlated with a more scanning processing style, where the proportion of ambiguous states (i.e., mixing periods) may increase; while high glutamate concentrations have been correlated with an exploitation processing style, strengthening the dominance periods (Kondo et al., 2017), which critically results in less fluctuations compared to the excitatory effects suggested by Van Loon and colleagues (2013).
1.1.3. Neural noise
Biologically, noise is considered as stochastic neural activity observed as small and random disturbances that are not part of a signal but may play a crucial and adaptive role in brain functioning (Deco et al., 2013; Ermentrout et al., 2008; Faisal et al., 2008). Noise may modulate the rate of fluctuations in MP tasks (Chen et al., 2022; Huguet et al., 2014; Shpiro et al., 2009), since it possibly helps the perceptual system escape from the bifurcation point and to move between attractors with an stochastic nature (Deco et al., 2009; Deco & Romo, 2008; Moreno-Bote et al., 2007).
1.2. Multistable perception in autism
Autism is associated with challenges in social interaction and communication, stereotyped and repetitive behaviors, and differences in sensory, perceptual, and attentional processes. When these domains are notably pronounced, they can meet the diagnostic criteria for Autism Spectrum Disorder (ASD; American Psychiatric Association, 2013). The atypical sensory and perceptual processing becomes evident in the early stages of development and can be highly predictive of the magnitude of later alterations at the social level (Robertson & Baron-Cohen, 2017).
Atypical sensory experience is estimated to occur in 90% of people with autism affecting all sensory modalities from hypo to hypersensitivity to stimuli (Baron-Cohen et al., 2009; Robertson & Baron-Cohen, 2017), which can actually be advantageous during certain tasks, such as visuospatial tasks, where individuals with autism demonstrate a strong ability to identify visual targets in complex scenes (Happé & Frith, 2006; Plaisted et al., 1998; Robertson & Baron-Cohen, 2017).
Variability in MP tasks in the population with autism has been reported, ranging from suggestions that they experience different rates of fluctuations to reports of no fluctuations at all when compared to typically developing people (Kornmeier et al., 2017; Robertson et al., 2013; Spiegel et al., 2019). Remarkably, reports also exist showing no significant differences in the rate of fluctuations when compared with neurotypical controls (Karaminis et al., 2017; Said et al., 2013).
Studies show that in the Necker Cube task, people with Asperger’s experience three times fewer fluctuations compared to typically developing individuals (Kornmeier et al., 2017). In other MP paradigms such as binocular rivalry, individuals with autism exhibit longer resolution times for perceptual ambiguity, a reduced rate of perceptual switching, and longer durations of mixed percepts (Freyberg et al., 2015; Robertson et al., 2013, 2016).
Empirical evidence shows a significant correlation between atypical MP task outcomes and higher scores on key autism diagnostic scales, including the Autism Diagnostic Observation Scale (ADOS-2; Lord et al., 2012), the Autism Spectrum Quotient (AQ), and the Sensory Perception Quotient-Short (SPQ) (Kondo & Lin, 2020; Robertson & Baron-Cohen, 2017; Spiegel et al., 2019). These findings highlight the potential of MP tasks performance as a promising early diagnostic marker for autism, offering a novel pathway for identifying and understanding ASD at earlier stages (Robertson & Baron-Cohen, 2017).
Despite the potential of MP tasks in autism research, the literature lacks consensus, highlighting the need for further investigation into atypical perceptual processing in autism. Understanding the sources of variations in MP tasks is key for mapping perceptual outcomes to neurocognitive alterations in autism, which could inform broader behavioral and cognitive atypicalities and improve diagnostic and intervention strategies.
The three main sources of fluctuations in MP previously reviewed in this paper have all been hypothesized to play a role in atypical behavior in autism: a possible atypical predominance of bottom-up processing over top-down in sensory tasks (Kornmeier et al., 2017); the excitation/inhibition imbalance in the cerebral cortex, this imbalance was initially conceived as an increased excitation (or decreased inhibition) (Canitano & Palumbi, 2021; Kondo & Lin, 2020; Lee et al., 2017; Rubenstein & Merzenich, 2003); however, cases have been reported with the opposite E/I imbalance (Dickinson et al., 2016; Sohal & Rubenstein, 2019); and atypical neural noise, both increases or decreases in neural noise have been reported in this population underlying autistic traits (Davis & Plaisted-Grant, 2015; Park et al., 2017; Vilidaite et al., 2017).
Research and clinical perspectives are increasingly shifting away from viewing autism as a unitary, discrete condition characterized by specific deficits. Instead, there is a growing recognition of autism as a spectrum of causes, mechanisms, symptoms, and cognitive styles, rooted in neurodiversity (Happé & Frith, 2020). This spectrum perspective acknowledges that individuals with autism may exhibit varied manifestations of altered mechanisms, also, more than one mechanism may account for the same behavioral outcomes (Dickinson et al., 2016). In this paper, we present a model developed within this framework, assuming that variations and interactions between processing mechanisms explain the wide range of typical and atypical results in multistable perception literature.
1.3. Computational modeling of the Necker Cube
Numerous theoretical frameworks have been proposed to understand atypical perception in autism, including Bayesian approaches (Pellicano & Burr, 2012). Our approach, however, is based on a neural network model, because these models emphasize a more detailed exploration of key neurocognitive mechanisms of MP. While neural network models derive from a variety of theoretical frameworks (Deco & Romo, 2008; Leptourgos et al., 2020; McClelland, 2015; Moreno-Bote et al., 2007; Nagao et al., 2000), they all share three key principles: each possible percept corresponds to one subnetwork, each subnetwork competes for perceptual dominance, and only one subnetwork can dominate at a time.
One classic computational approach to the Necker Cube is the connectionist model of Feldman (1981) revisited and detailed by (McClelland, 2015). This model was designed to address MP by treating it as a constraint satisfaction problem, where the visual system resolves ambiguity by satisfying the maximum number of perceptual constraints to settle on one interpretation (i.e., seeing one face of the cube). This model focused on which face of the cube is perceived, emphasizing the stability of the perceptual outcome but it did not simulate perceptual fluctuations characteristic of MP, as we explain later.
This is a simple abstract model that includes two subnetworks (Figure 3), each representing a different orientation of the Necker Cube. Each subnetwork is composed of 8 units (i.e., artificial neurons), one for each vertex of the cube. The model has two types of fixed connections between units: positive excitatory connections exist between neighboring units within each subnetwork (for the same percept), and negative inhibitory connections exist between units representing opposing vertex interpretations in the competing subnetwork. Units 1–8 (blue in Figure 3), compose the subnetwork for the first percept. Units 9–16 (orange in Figure 3) compose the second subnetwork. Connectionist architecture of the Necker Cube. Note. The first 8 units compose the first subnetwork (blue), units 9–16 compose the second subnetwork (orange). The corresponding cube interpretations are favored in the figure using lighter colors for units 5, 12 and their connections. The architecture of this model includes excitatory connections between neighbor units of the same percept, and inhibitory connections between units representing the competing interpretation among vertices of opposite percepts, as in McClelland (2015). For simplicity and clarity, only some inhibitory connections are shown.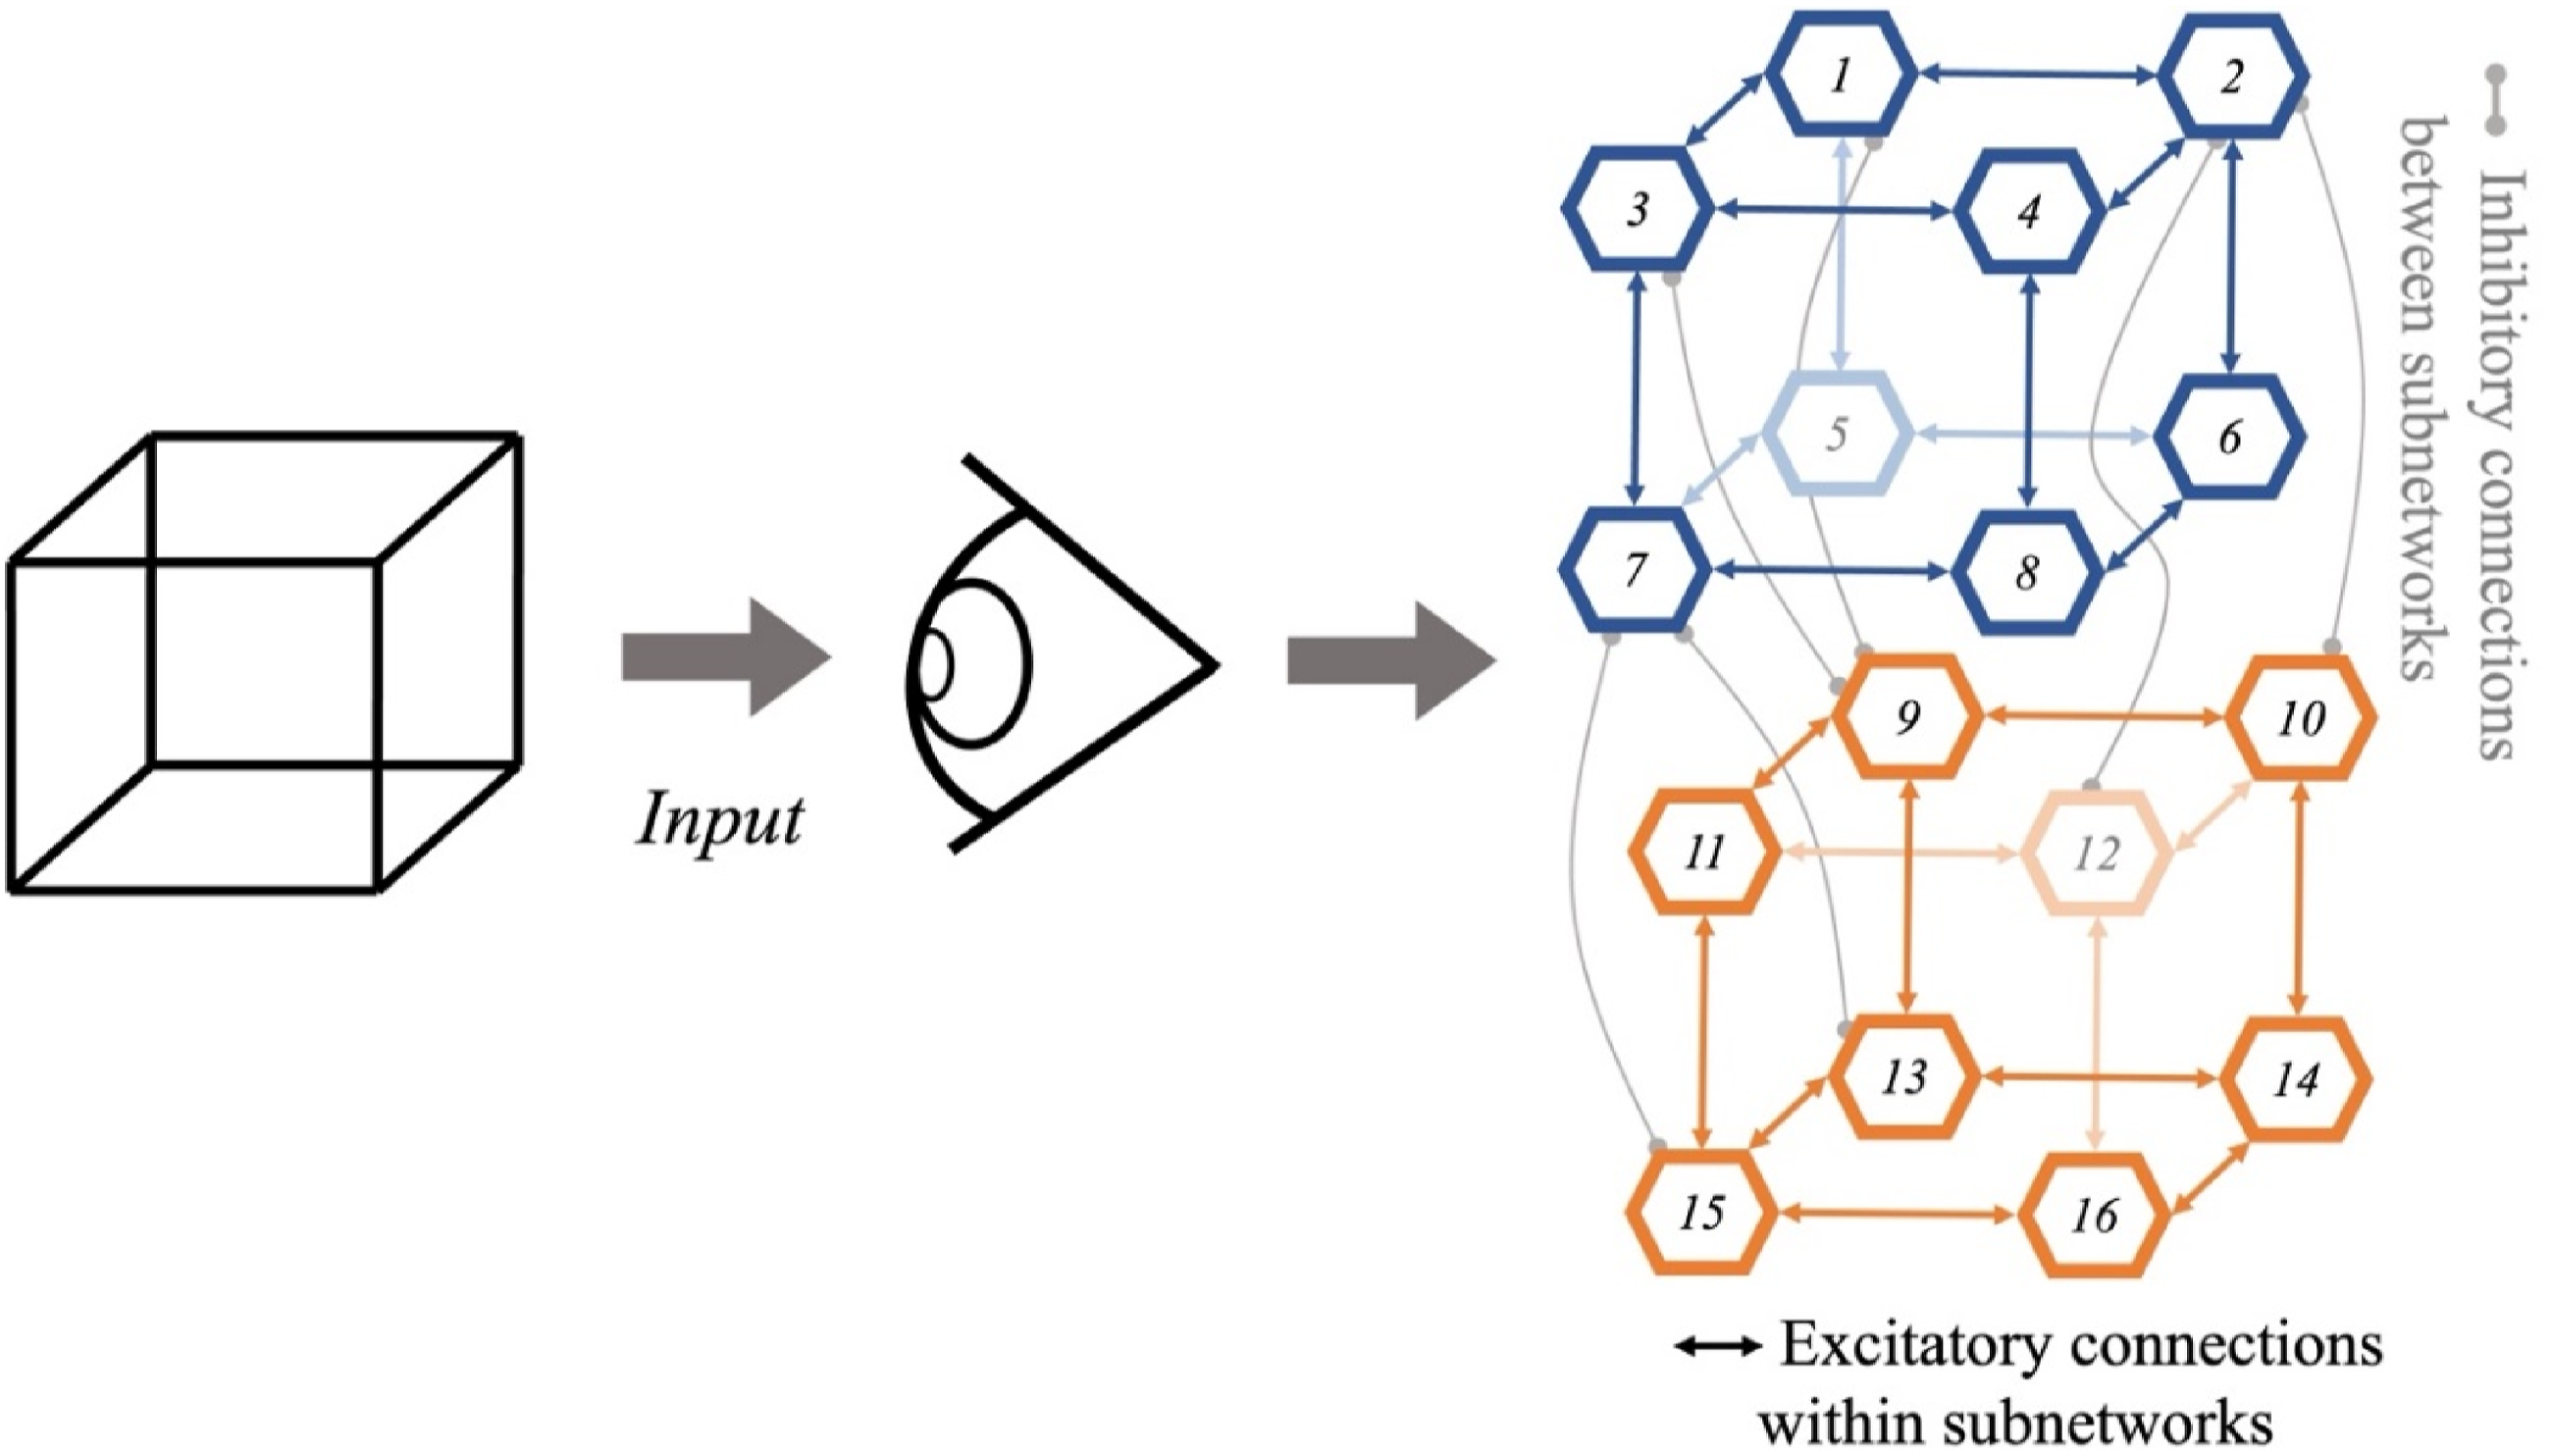
The activation values of each unit in the network are updated sequentially taking a different random order in each iteration. Since each unit sums external and internal activations, different orderings in activation updates introduce variability across different runs of the model. A dominance period is achieved when one subnetwork’s units are highly active (activation ≈ 1), while the rest of the units remain inactive (i.e., activation values ≈ 0) (McClelland, 2015). Thus, a large difference between the sum of activations of each subnetwork confirms a dominance period, while small differences between activity values in subnetworks indicate a mixing period.
Although this model (McClelland, 2015) effectively resolves the Necker Cube’s perceptual ambiguity, a serious weakness must be noted, once a dominant percept is stablished, the activation remains fixed, failing to reflect the fluctuating nature of human perception. Despite this limitation, given its simplicity and biological viability we took this model as our starting point to develop a model that incorporates fluctuations in perception.
This model already incorporates key parameters (see below) reflecting neurocomputational mechanisms central to MP. We hypothesize that through variations of these parameters, the inclusion of neural noise, and a different updating of unit activations we will enrich this model to simulate fluctuations in MP, explore in more detail the role of neurocognitive mechanisms on perceptual fluctuations, and propose an account for both typical and atypical performance in MP.
2. Method
Our model is designed to explore the effects of parameter variations on perceptual fluctuations, rather than to replicate specific sets of empirical data. This approach focuses on understanding how variations in mechanisms relate to differences in MP performance that could be comparable to those observed in autism. The model was developed and analyzed on MATLAB 2021a, and it is available on https://osf.io/wrp69/. It includes the next six key components, as in the model described in McClelland (2015), and we included noise as a seventh key component: (1) An external input: it is a 16-value vector, useful to favor one of the possible percepts; for example, activating only the first 8 units of the input simulates the presentation of the cube from an upwards orientation. (2) A bias value: it is a constant activation value of 0.5, for all units. (3) A top-down modulation parameter (istr): it acts as a limiting rate on the bias, scaling the effect of internal information. (4) A bottom-up modulation parameter (estr): it is a limitation rate on the input, determining the extent to which external inputs contribute to a unit’s activation value. (5) Inhibitory connections: between the units representing the competing interpretation among vertices from opposing percepts. (6) Excitatory connections: between the neighbor units of the same percept. (7) Noise: it is a stochastic component limiting the bias activation of all units.
Variations in the components of the model.
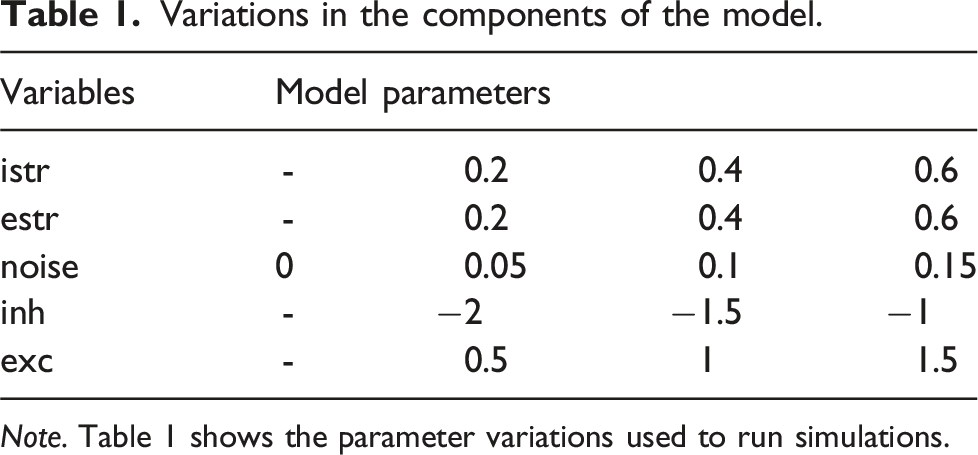
Note. Table 1 shows the parameter variations used to run simulations.
The istr and estr parameters, modulating top-down bottom-up effects, respectively, were both adjusted by ±0.2 from their original settings. To explore the balance/imbalance between neuronal excitation and inhibition, we adjusted by ± 0.5 the connectivity matrix for both excitatory and inhibitory connections, respectively. Finally, we integrated Gaussian noise to the bias activations, through a mean of 0, and 3 different standard deviations (SD = 0.05, 0.1, 0.15). Considering that the original model did not incorporate noise, we also modeled noise absence with an SD of 0. These adjustments explored higher and lower impacts of these parameters on perceptual fluctuations.
2.1. Fluctuations in perception within the model
We implemented three main modifications to the original model: (1) we introduced a dynamic input by using the final activation values from one cycle as the input for the next one, in this way we captured a top-down modulation on perception (Saalmann et al., 2007). (2) We applied a min/max normalization to the unit activations at the end of each cycle to maintain activation values between 0 and 1. And (3) we included noise as an additional neurocognitive component of the model. These adaptations successfully generated perceptual fluctuations in our model.
As mentioned earlier, activation values are updated sequentially in this model. With the introduction of dynamic input, where the final activation values from one cycle serve as input for the next, the sequential activations both within and between cycles create a temporal dependency, where each activation state influences the next one. This process approximates the dynamics seen in recurrent neural networks, allowing the model to capture the temporal variability inherent in multistable perception.
Our activation normalization led to low activation values across network units. Consequently, we redefined criteria for dominance periods based on the activation sum differences between percepts. These differences provided two crucial pieces of information: (1) the sign indicates the dominant percept (positive for the first, negative for the second); and (2) the magnitude, where a large difference (>0.9) indicated a perceptual dominance period, and a small difference (≤0.9) indicated a mixing period. These criteria were applied to each cycle in every simulation run. Transient values lasting 1 or 2 cycles were not considered competitive, and were therefore excluded from the analysis, emphasizing meaningful fluctuations over the simulation’s duration.
3. Results and discussion
We extended the original connectionist model of Feldman (1981) and revisited by McClelland (2015) to capture fluctuations in multistable perception. By running our model with McClelland’s parameters, a mean of 20.2 fluctuations appeared over 2000 cycles across 10 runs of the model, demonstrating fluctuations previously unseen in this architecture (Figure 4). Perceptual Fluctuations in the McClelland Model and Our Implementation. Note. Both panels display activation values across the 16 units of the model over 2000 cycles, represented in a color graph where yellow indicates more active units and blue indicates less active units. Panel A illustrates McClelland’s model, which shows no fluctuations as units 1–8 remain the most active throughout the 2000 cycles. Panel B presents our implementation, where approximately 20 perceptual fluctuations are observed within the same 2000 cycles.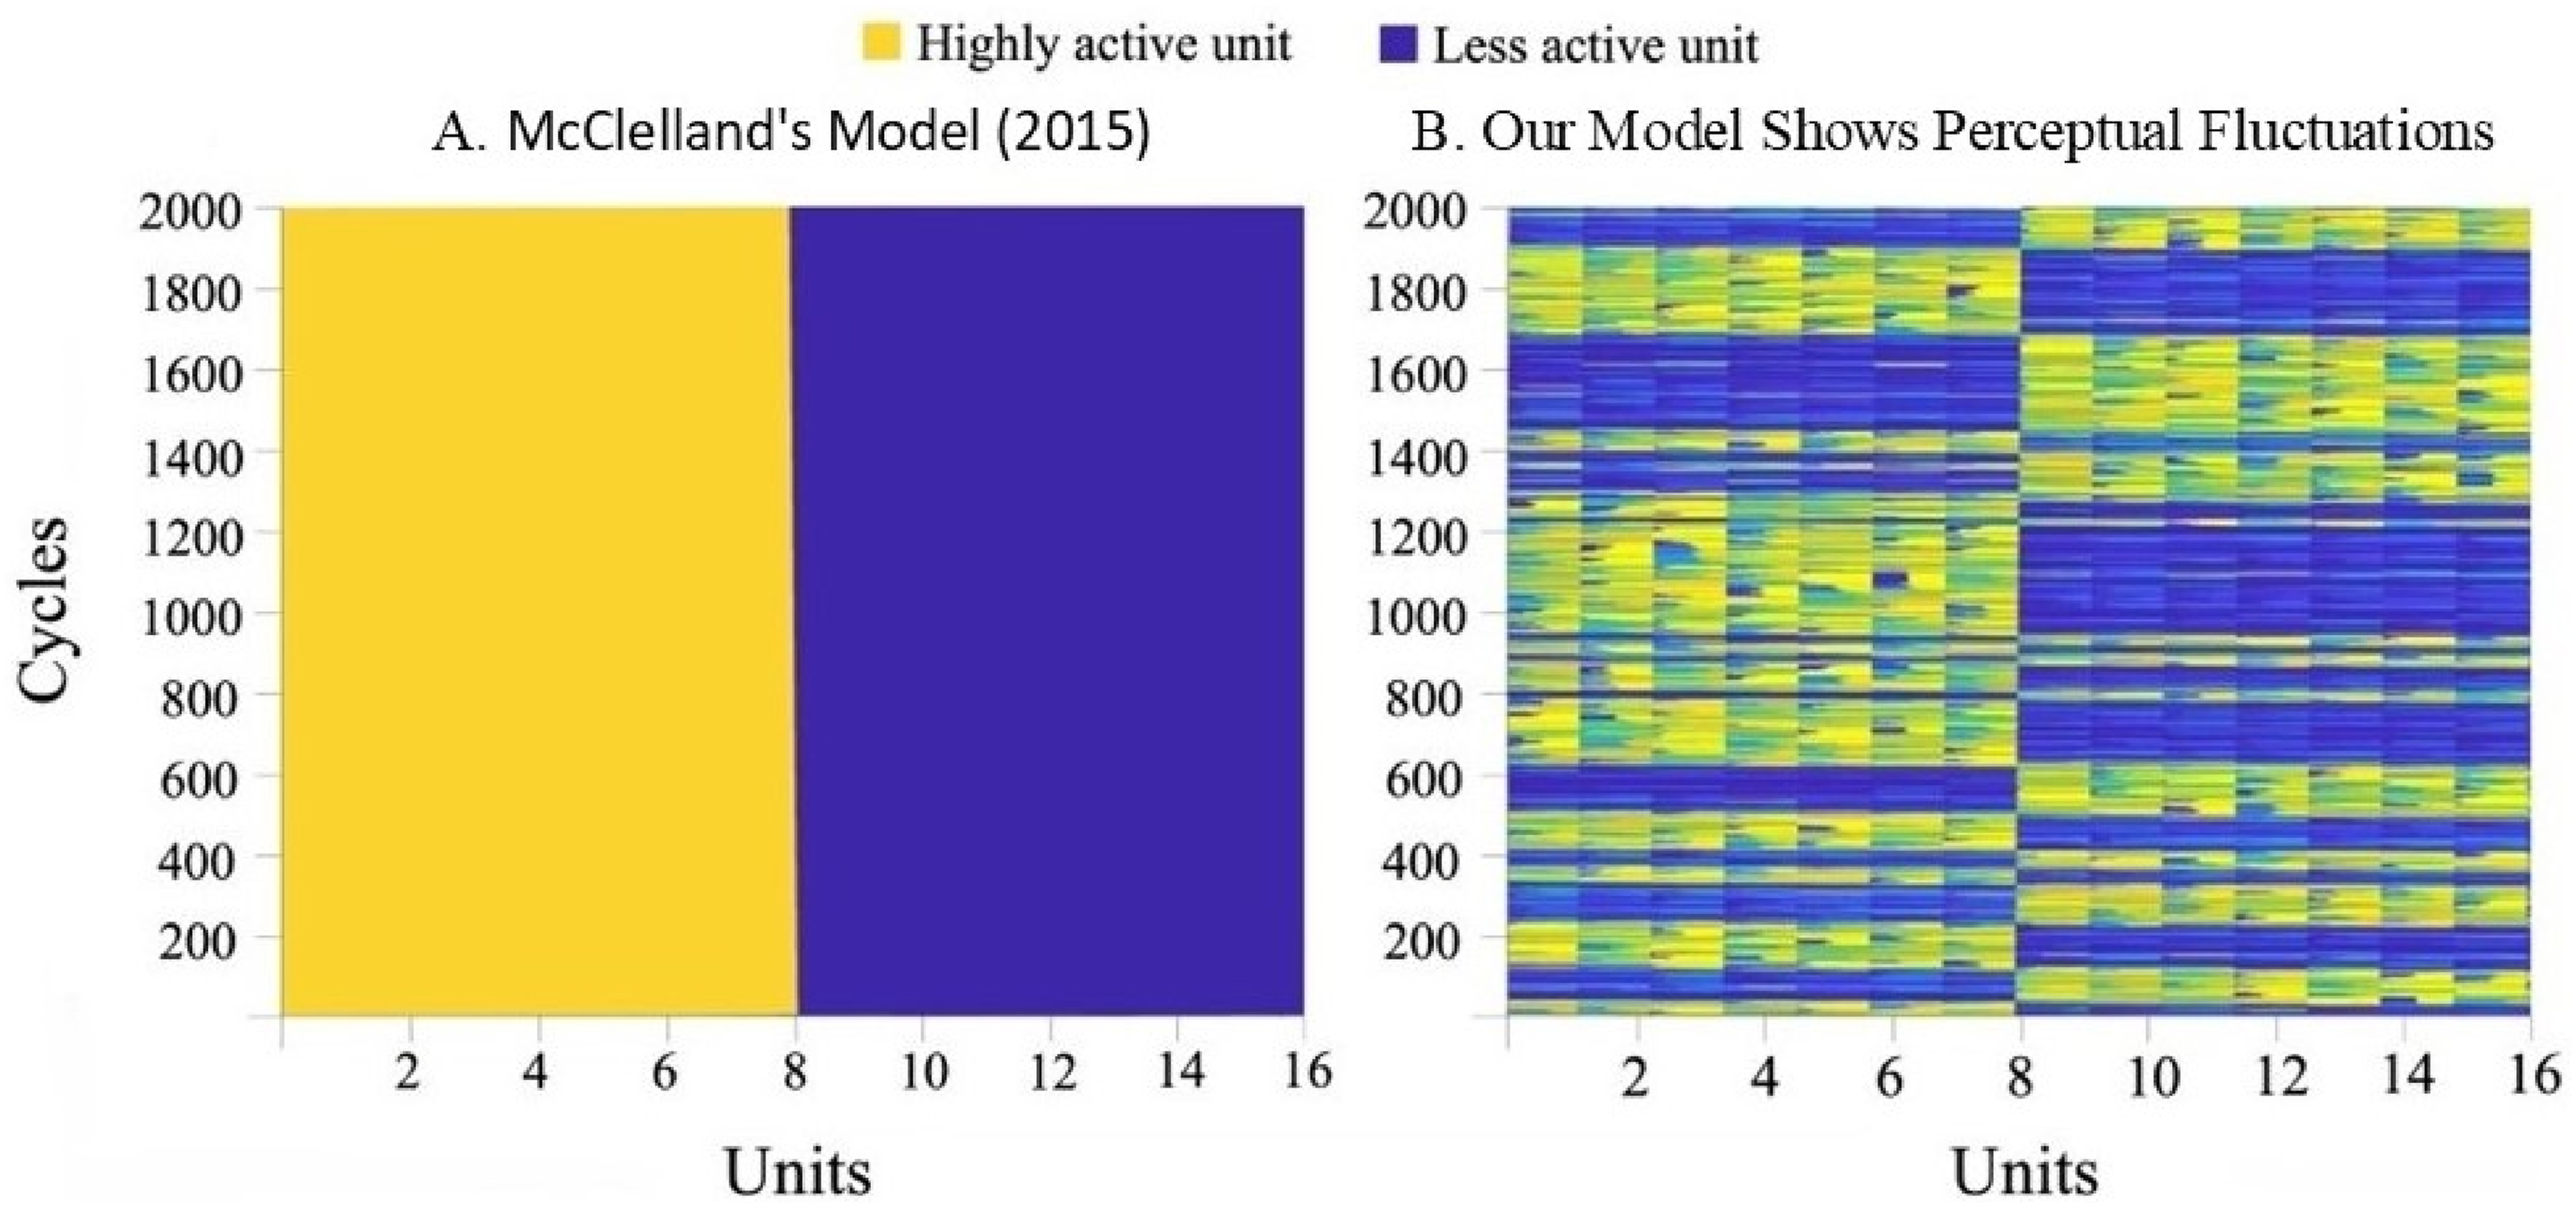
3.1. Simulation analyses
The unique combinations of parameter variations (Table 1) resulted in a total of 324 distinct network configurations. Each unique network was tested across 10 runs resulting in a total of 3240 simulations. Our primary focus was on analyzing the number of dominance periods as the dependent variable, which reflects perceptual fluctuations. Although we initially considered mixing periods, we observed a strong positive correlation with dominance periods (r = 0.835, p < .001), suggesting they depend on similar factors. Therefore, we focused on dominance periods for the main analysis, as mixing periods are less relevant in Necker Cube paradigms.
Regression analysis for predicting fluctuations in the neural network.
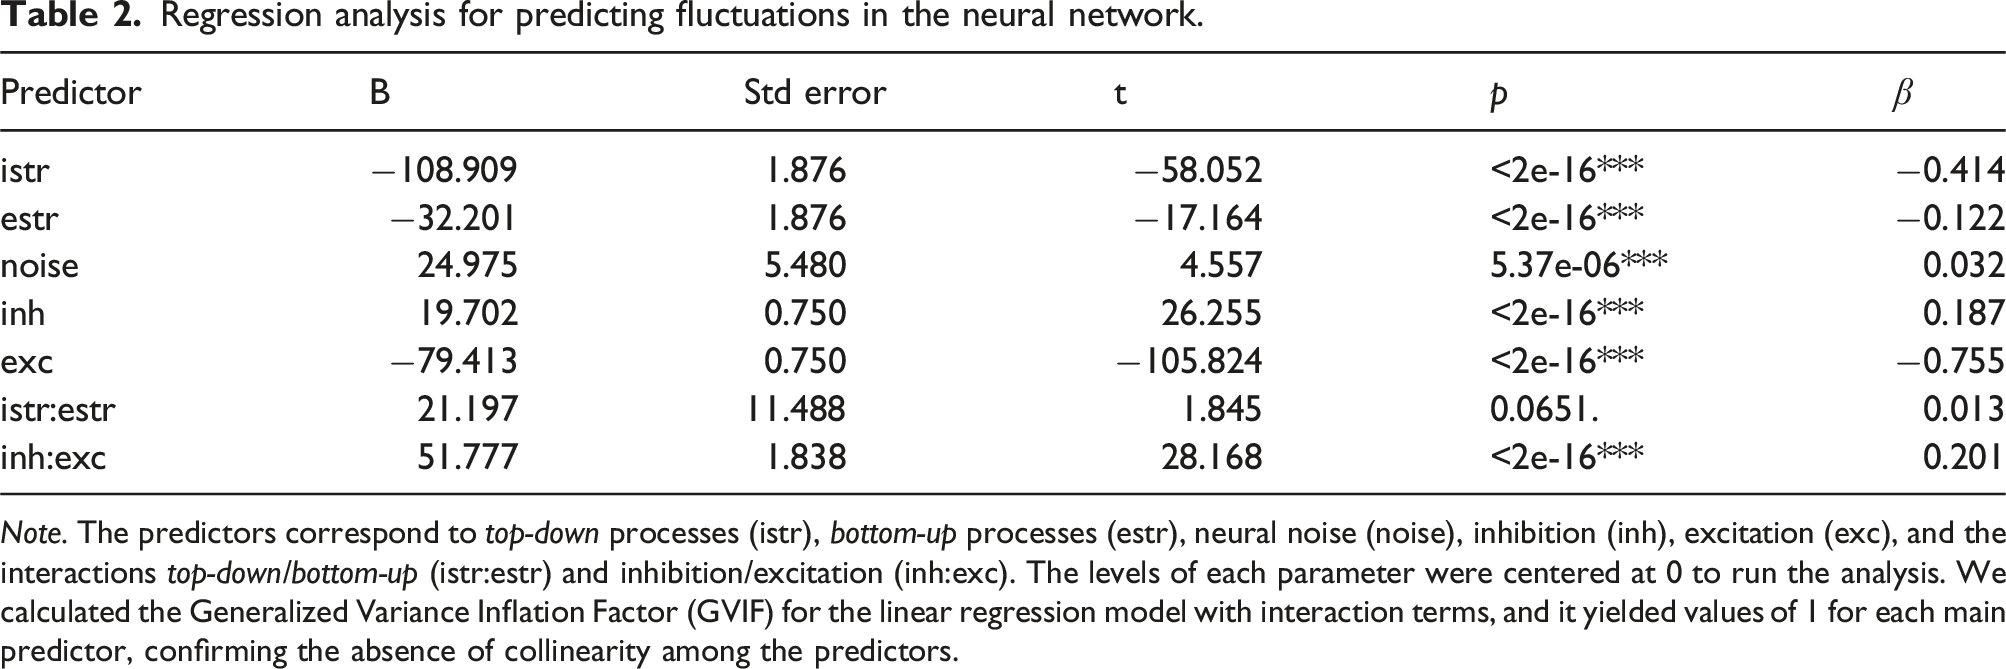
Note. The predictors correspond to top-down processes (istr), bottom-up processes (estr), neural noise (noise), inhibition (inh), excitation (exc), and the interactions top-down/bottom-up (istr:estr) and inhibition/excitation (inh:exc). The levels of each parameter were centered at 0 to run the analysis. We calculated the Generalized Variance Inflation Factor (GVIF) for the linear regression model with interaction terms, and it yielded values of 1 for each main predictor, confirming the absence of collinearity among the predictors.
3.2. Main effects and interactions of model parameters
In our neural network model, lower levels of bottom-up processing, top-down processing, excitation, and inhibition, as well as increased levels of neural noise, were all associated with a relatively higher proportion of perceptual fluctuations (Table 2 and Figure 5). Conversely, higher levels of bottom-up processing, top-down processing, excitation, and inhibition, as well as reduced levels of neural noise, were all linked to relatively fewer perceptual fluctuations. Its noteworthy that despite the diverse outcomes in studies of MP in autism, there is a tendency towards fewer perceptual fluctuations in this population. Therefore, our model points to consider diverse neurocognitive profiles in autism, characterized by possible combinations of increased bottom-up processing, increased top-down processing, increased excitation, increased inhibition, and diminished neural noise, as all these alterations are associated with relative reductions in perceptual fluctuations. Our simulations suggest that different neuroprocessing profiles in autism may exhibit anyone, several, or all these alterations, demonstrating the heterogeneity of processing mechanisms within the autism spectrum. In what follows we discuss the effect of each parameter in the model and how it addresses, supports, or challenges previous literature in multistable perception, particularly in autism. Attractors after variations of the parameters in the model.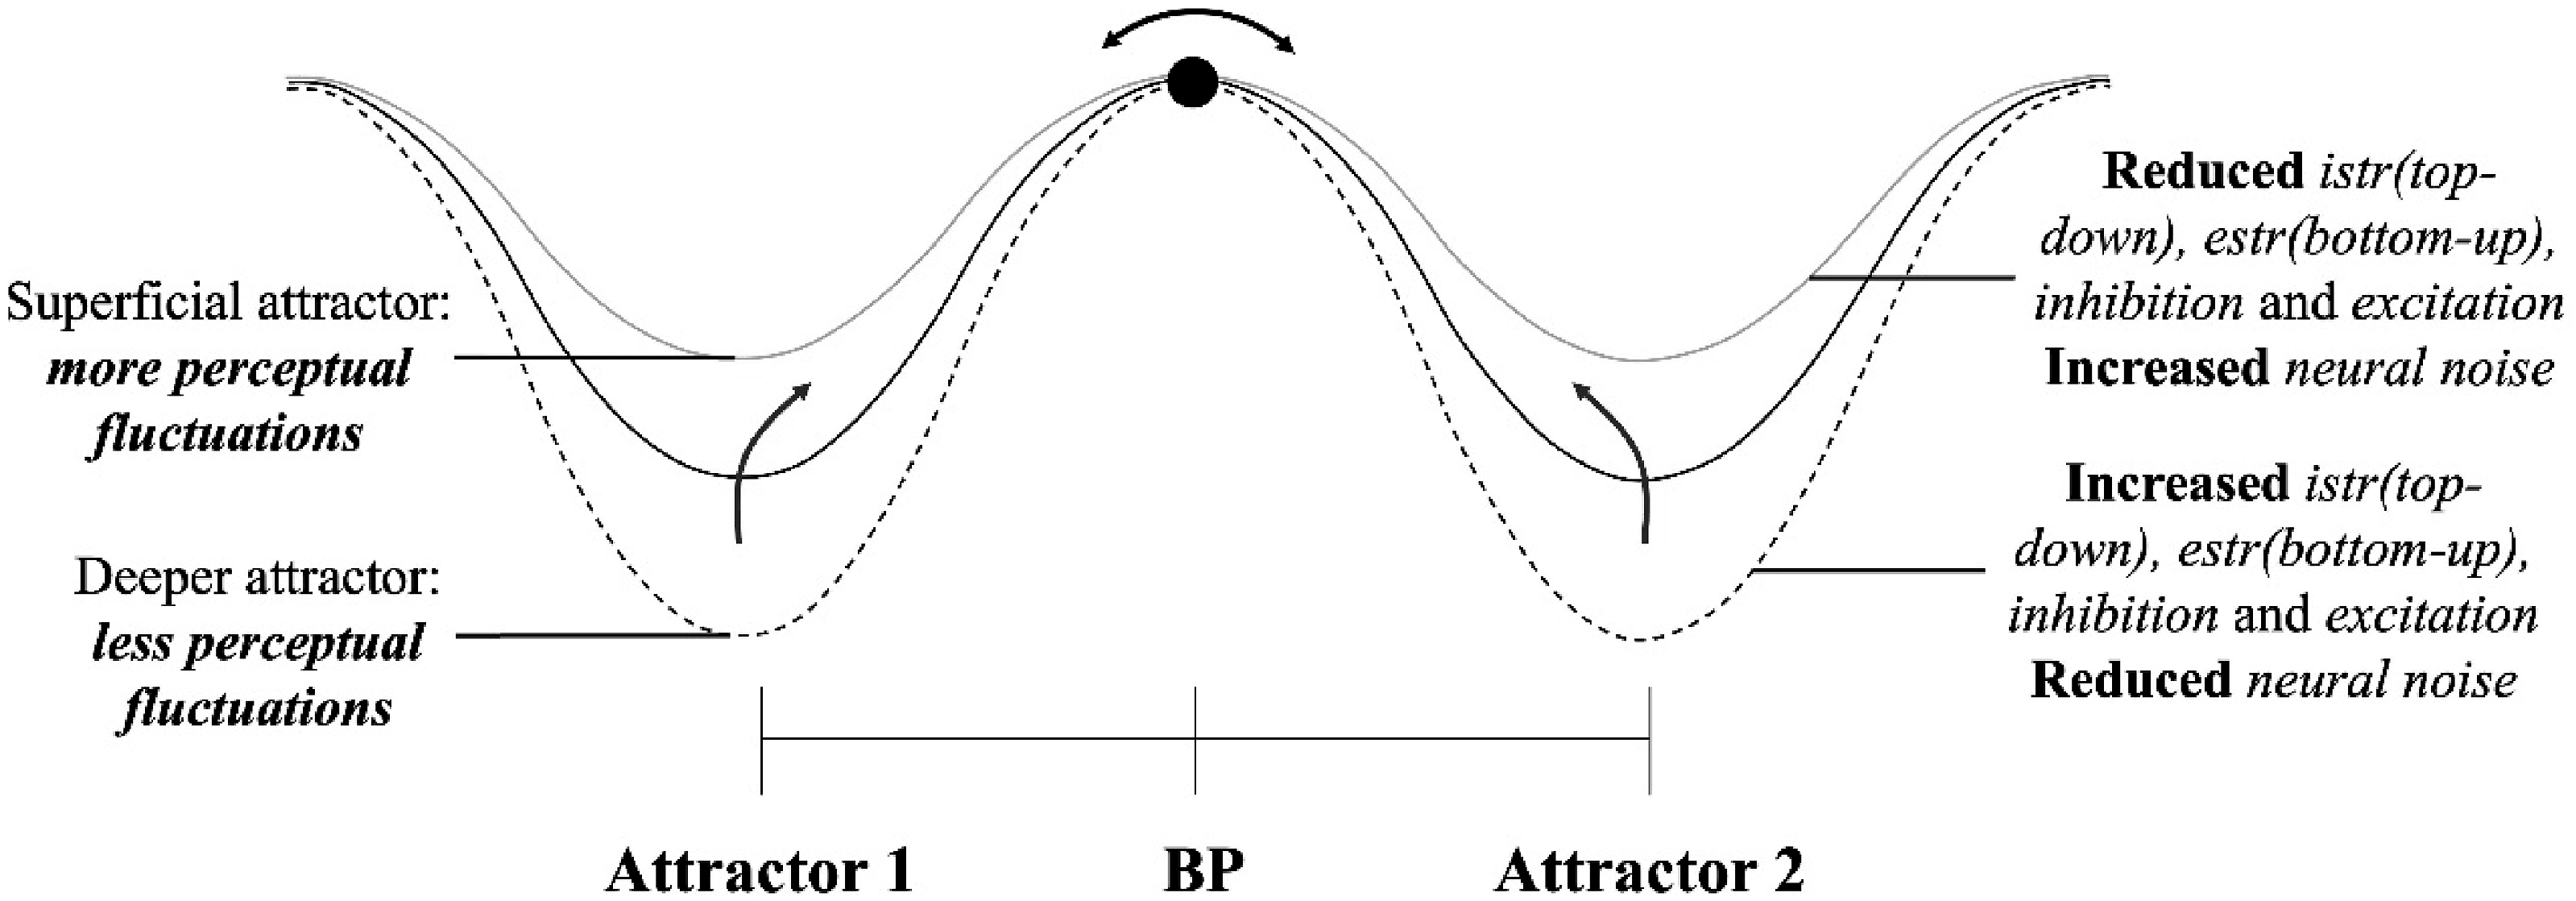
3.3. Bottom-up and top-down
Increasing both istr and estr resulted in decreases in the total number of dominance periods (Figure 6, panels A and B). The changes in top-down processing (istr) in our artificial neural network showed a significant negative effect on the number of perceptual fluctuations in the linear regression model (B = −108.909, SE = 1.876, t = −58.052, p < 2e-16***, β = −0.414). This effect aligns with previous literature on top-down modulations on MP, highlighting the role of endogenous factors, like volitional control when interpreting ambiguous sensory information (Kornmeier & Bach, 2005; Kornmeier et al., 2009). In our model, enhancing top-down processing results in deeper attractors (Figure 5), leading to more stable dominance periods with fewer perceptual fluctuations. Number of Periods of Dominance Through Different Parameter Variations. Note. The panels show box plots with the mean (black point) and median (black line) periods of dominance for each level of the five parameters in our neural network model: panel A (istr), panel B (estr), panel C (inh), panel D (exc), and panel E (noise). Note that for the inhibition (inh) parameter, more negative values represent an increased value of inhibition.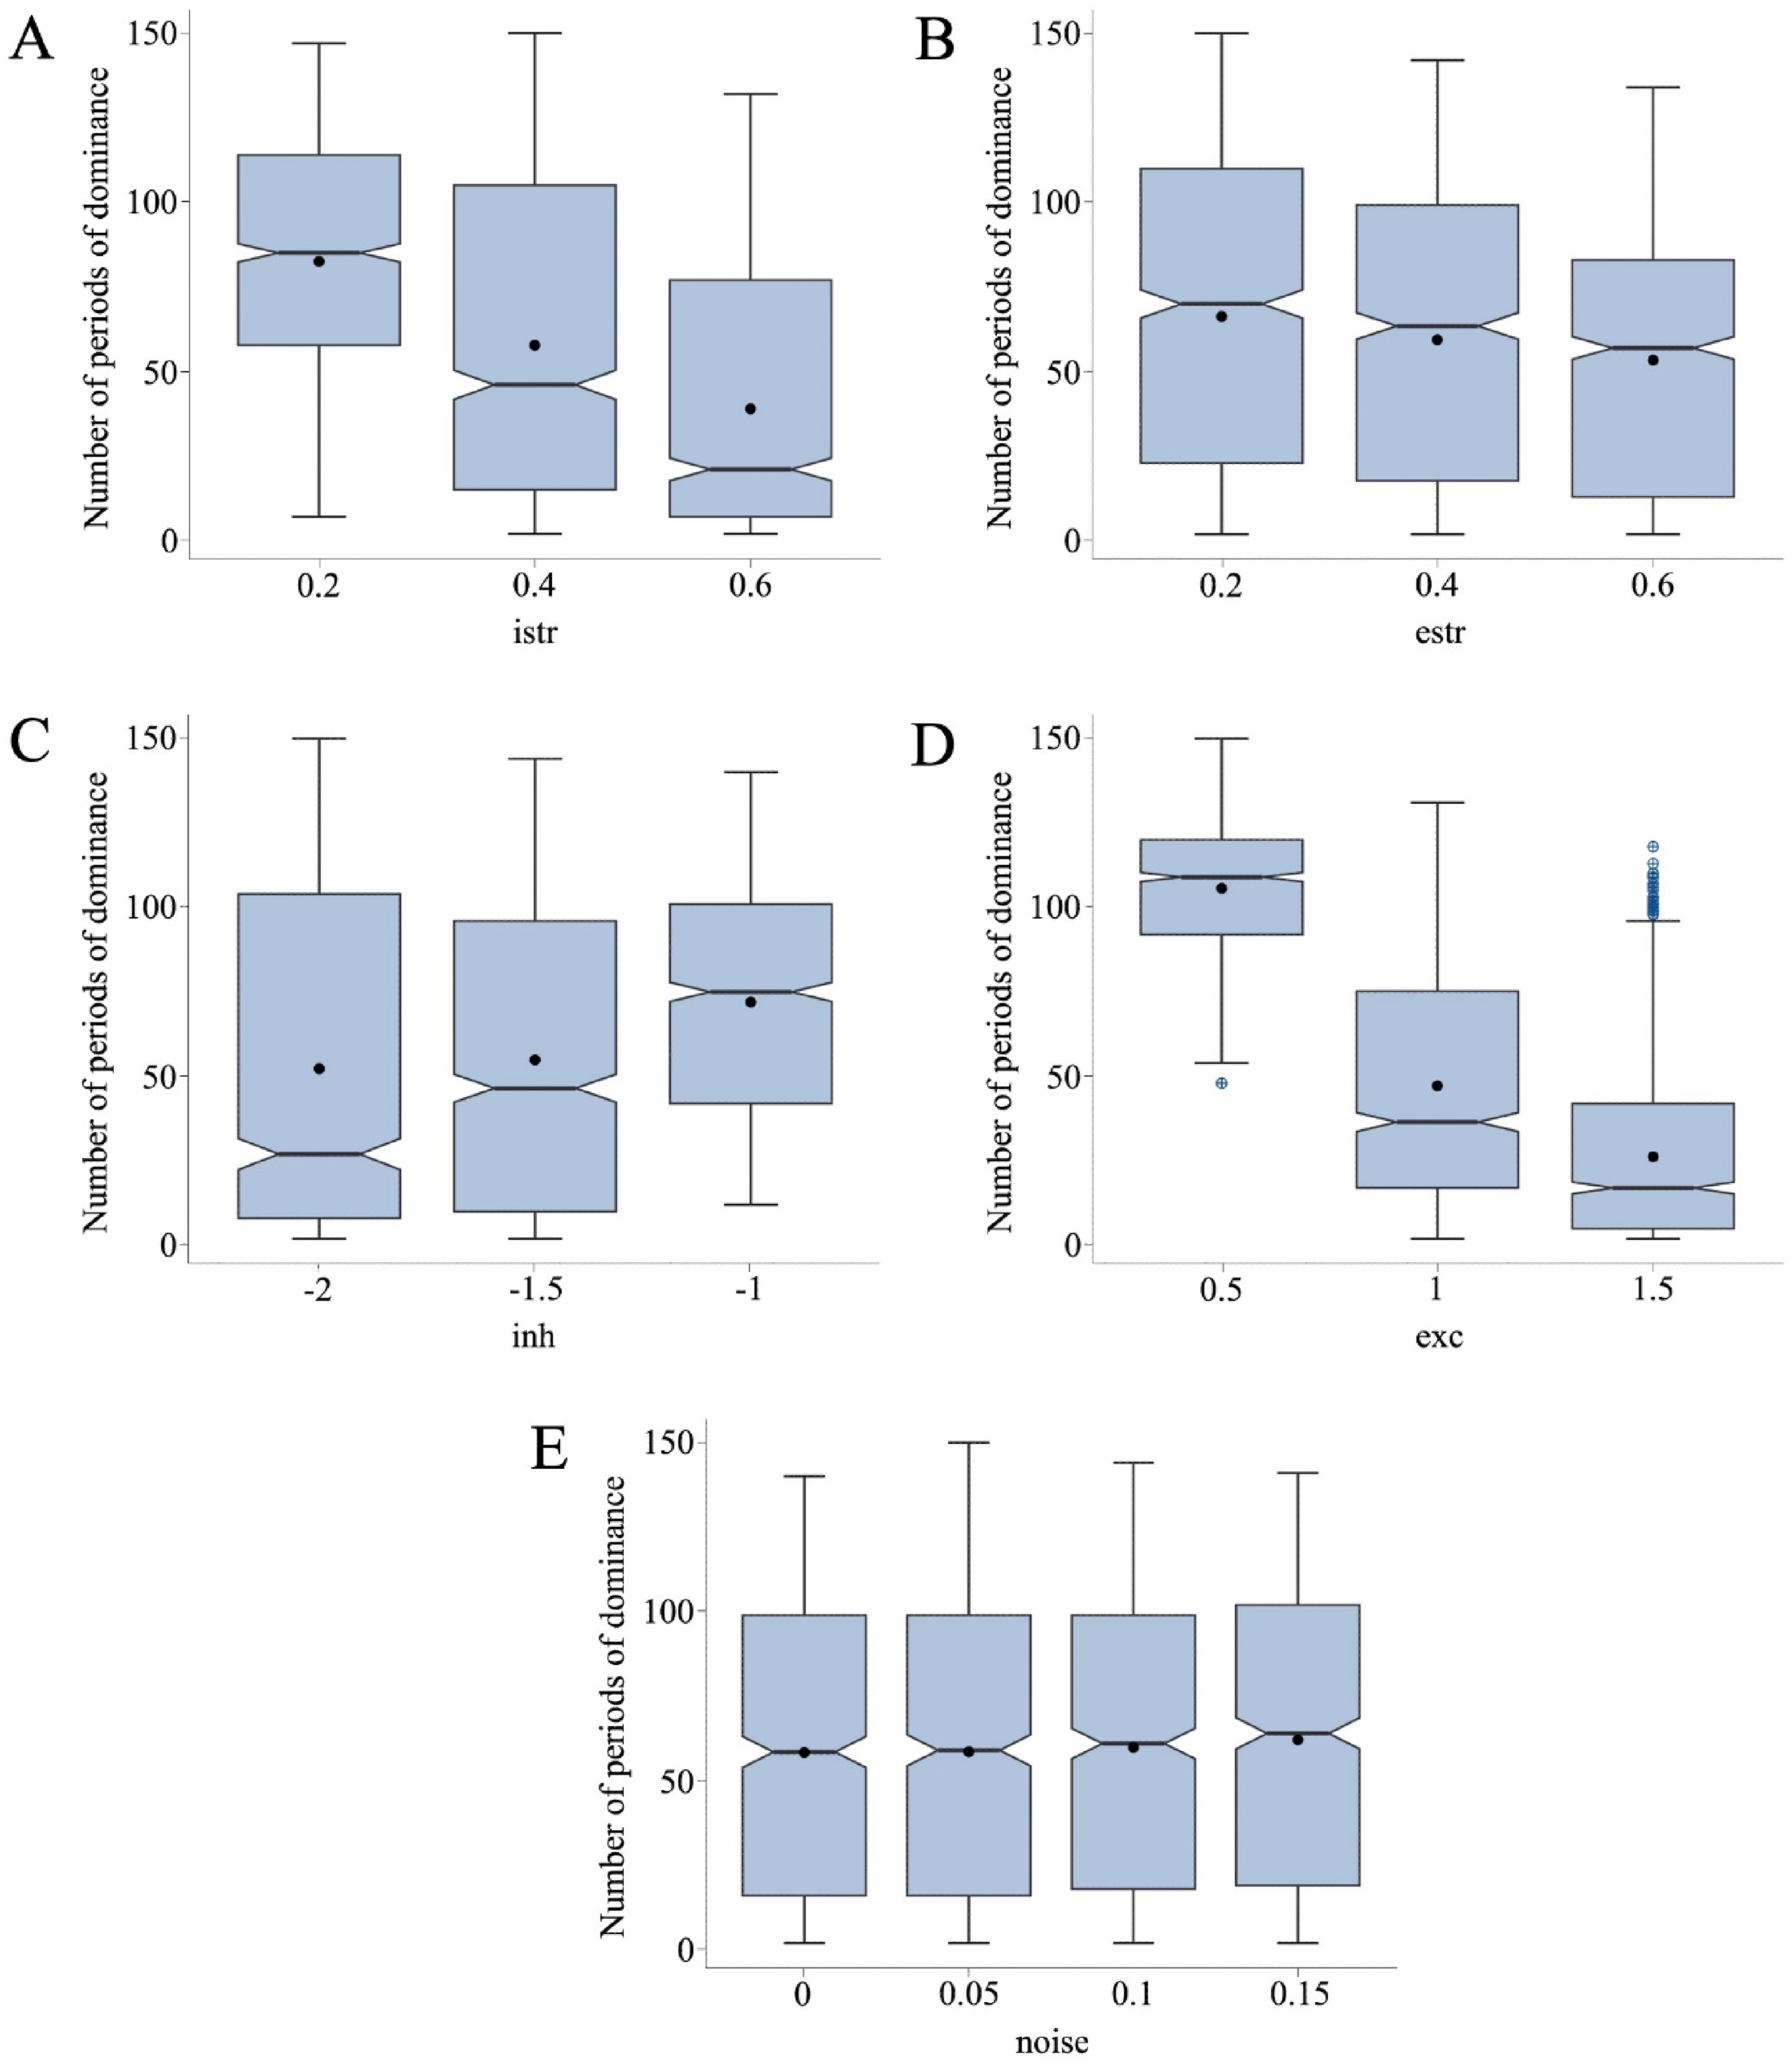
Modulating bottom-up processes (estr) significantly affected the perceptual fluctuations in the simulations (B = −32.201, SE = 1.876, t = −17.164, p < 2e-16***, β = −0.122). This is also consistent with existing literature (Toppino, 2022; Wernery et al., 2015). Our model shows that diminished bottom-up processing intensifies competition between subnetworks and promotes fluctuations. Conversely, when exogenous factors become strongly relevant for resolving ambiguity (estr = 0.6 in our model), one percept becomes more dominant, leading to fewer fluctuations.
Recent hypotheses suggest that in autism, there’s an overvaluation of bottom-up processing and undervaluation of top-down processing leading to a lower number of fluctuations (Kornmeier et al., 2017). Our model partially supports this, showing that increased bottom-up modulation reduces perceptual fluctuations. However, decreasing top-down processing actually leads to more fluctuations in our artificial network. Moreover, given the non-significant interaction effect observed between top-down and bottom-up processes in our model (B = 21.197, SE = 11.488, t = 1.845, p < .0651., β = 0.013), our findings lend support to the notion proposed by Intaitė and colleagues (2013, 2019), suggesting that instead of a strict trade-off, bottom-up and top-down processing might exhibit multiple interaction patterns potentially operating in an additive manner. This outcome, along with the main effects from istr (top-down) and estr (bottom-up) which have similar impacts in reducing perceptual fluctuations as they increase, allow us to question the proposed trade-off in autism, where a preference for bottom-up processing at the expense of top-down may account for less perceptual fluctuations (Kornmeier et al., 2017). Our model challenges this view, suggesting the hypothesis that individuals with autism may not necessarily experience such a dichotomy.
3.4. Inhibition and excitation
We found that increasing inhibition (i.e., more negative values of inh) led to reducing perceptual fluctuations (Figure 6(c)). The complementary effect was observed for excitation values, because increasing it (i.e., more positive values of exc) resulted in a smaller number of fluctuations (Figure 6(d)). The multiple linear regression showed significant effects for both main effects: inh (B = 19.702, SE = 0.750, t = 26.255, p < 2e-16***, β = 0.187), and exc (B = −79.413, SE = 0.750, t = −105.824, p < 2e-16***, β = −0.755), and their interaction (B = 51.777, SE = 1.838, t = 28.168, p < 2e-16***, β = 0.201).
Our model offers a mechanistic account into a form in which increased excitation results in reduced perceptual fluctuations. Specifically, strengthening excitatory connections stabilizes subnetworks, leading to deeper attractors and more stable perceptions. Conversely, reducing excitation weakens the connections within a subnetwork (or percept), causing more fluctuations due to instability of the dominant subnetwork. On the other hand, augmenting inhibition, through more negative values for inh, can also slow down perceptual dynamics and fluctuations. This is because higher levels of inhibition exert greater pressure from the dominant subnetwork onto its competitor, which results in extended periods of dominance (Figures 5 and 6(c)).
The regression analysis indicates that variations in excitation (β = −0.755) have a more pronounced effect on perceptual fluctuations than variations in inhibition (β = 0.187), as reflected by the β coefficients (Table 2). Note that this result could be attributed to the higher number of excitatory connections relative to inhibitory ones within our architecture. While these results should be interpreted with an understanding of this inherent difference in connection proportions in our neural network, yet it remains illustrative of potential neural dynamics in the brain, where a realistic predominance of excitation over inhibition exists.
The E/I imbalance has been strongly suggested as the key mechanism underlying behavioral, cognitive, and sensory atypicalities in autistic individuals (Kondo & Lin, 2020; Lam et al., 2022; Lee et al., 2017; Rubenstein & Merzenich, 2003; Sohal & Rubenstein, 2019). For the case of MP tasks, it has been proposed that the E/I imbalance underlies fewer periods of dominance (Spiegel et al., 2019). This imbalance has been considered in different directions depending on the levels of excitation and inhibition (Dickinson et al., 2016). Here we show that both increased excitation and inhibition may lead to fewer fluctuations, but the lowest numbers of perceptual fluctuations were associated with increased excitation (for exc = 1.5, M perceptual fluctuations = 26.25) as compared with increased inhibition (for inh = −2, M perceptual fluctuations = 52.27). Moreover, by specifically comparing the two extreme forms of E/I imbalanced ratios, those networks that combined increased excitation with reduced inhibition led to fewer perceptual fluctuations (M = 49.50), than those combining increased inhibition with reduced excitation (M = 111.83, Figure 7). Mean periods of dominance for the interaction between excitation and inhibition. Note. Circle size in dark blue represents the mean number of perceptual fluctuations for each combination of inhibition and excitation. The surrounding light blue circles indicate +1 standard deviation.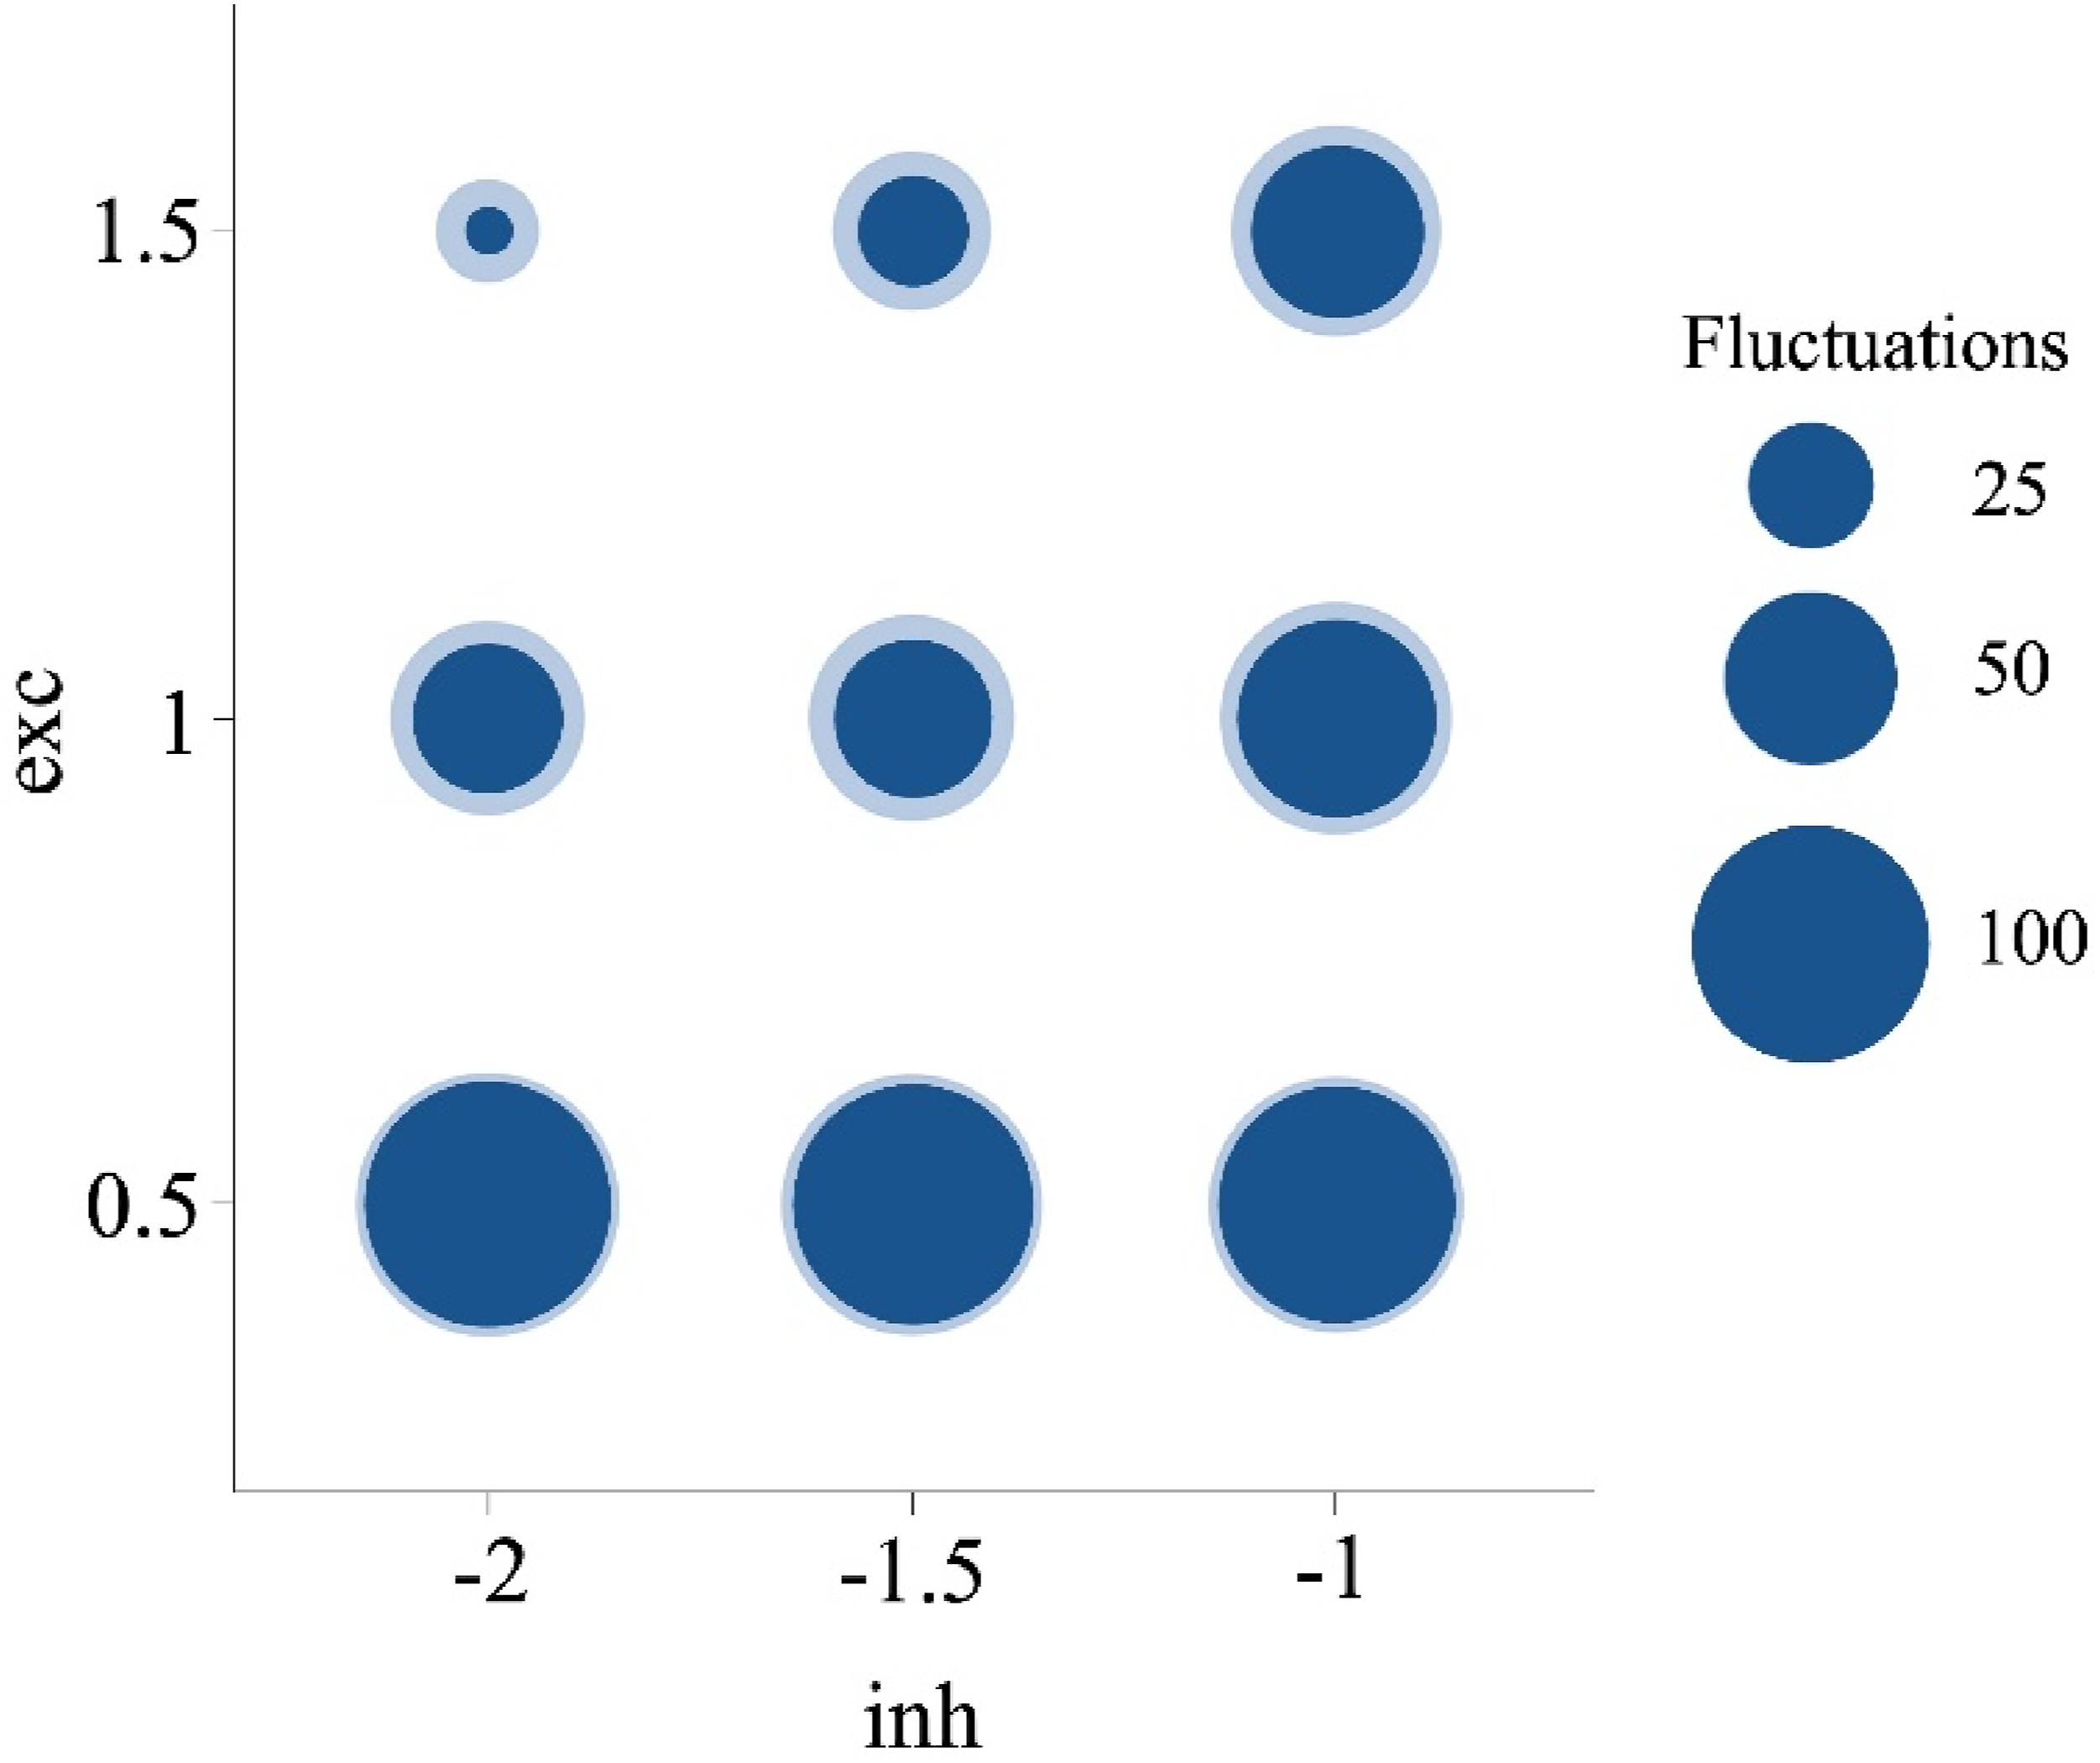
Remarkably, our model offers a possible solution to previous discrepancies in the literature (Kondo et al., 2017; van Loon et al., 2013), because it confirms that different forms of the E/I imbalance can effectively reduce perceptual fluctuations as documented in autism, and it shows how the gradual combinations of excitation and inhibition may result in the variable behavioral patterns observed in this population.
3.5. Neural noise
In our model, increasing noise levels were associated with a greater number of fluctuations (see Figure 6, Panel E). However, the differences were very subtle for the lower noise levels and the absence of noise. Without noise, the average dominance period was 58.34. Introducing noise, gradually raised the averages to 58.58, 59.84, and 62.09, for noise SD values of 0.05, 0.1, and 0.15, respectively. The standardized beta coefficient (β) in the linear regression model showed a positive relation between noise levels and number of fluctuations; however, while this effect was significant, this parameter had the smallest β coefficient in the regression model (B = 24.975, SE = 5.480, t = 4.557, p < 5.37e-06***, β = 0.032).
The small effect of noise in our model, reflected by a relatively small beta coefficient (β = 0.187), might be because our selection of noise levels was conservative. Future models could explore the effect of higher noise levels, which may accentuate the observed effect or even lead to different dynamics.
The model’s behavior is consistent with previous literature; higher noise levels could help the perceptual system escape the bifurcation point and lean on a steady state with an stochastic nature (Deco et al., 2009, 2013; Deco & Romo, 2008; Ermentrout et al., 2008; Faisal et al., 2008; Moreno-Bote et al., 2007). Our simulations mechanistically show how low noise levels in neural systems could be associated with atypically fewer perceptual fluctuations, as those seen in populations with autism. Moreover, these results provide support for a recent neurocognitive hypothesis of autism in which atypical lower levels of neural noise may be underlying altered neural processing with cascade effects potentially impacting a wide range of cognitive and behavioral domains (Davis & Plaisted-Grant, 2015).
4. General discussion
This study presents a novel computational exploration of multistable perception of the Necker Cube, offering significant insights into atypical perceptual processes in autism. While previous empirical studies of MP in autism have shown variable results, a prevailing trend indicates reduced perceptual fluctuations within this population, our results support the viability of an increased bottom-up processing in autism (Kornmeier et al., 2017), as increased estr in our model leads to reduced fluctuations, replicating this hallmark of the perceptual experience in autistic individuals. But it also questions the notion of this increase in bottom-up occurring at the expense of top-down processing. Moreover, in our model those alterations enhancing top-down processing can independently diminish perceptual fluctuations.
Our computational exploration of inhibition and excitation shows a balancing dynamic particularly relevant in the context of autism, where the E/I imbalance is a prominent hypothesis. One key contribution of this model is that it critically demonstrates the possibility of diverse E/I imbalances in autism, providing mechanistic accounts on how both increased neural excitation and increased neural inhibition can reduce perceptual fluctuations. Our data particularly emphasize that an E/I imbalance characterized by heightened excitation with reduced inhibition is strongly associated with significantly fewer perceptual fluctuations.
The incorporation of neural noise into our model sheds light on its role in perceptual dynamics. For the case of autism, both increased and decreased levels of neural noise in sensory systems have been hypothesized (Davis & Plaisted-Grant, 2015; Park et al., 2017; Vilidaite et al., 2017; Winterer, 2017). Our model suggests that atypically fewer fluctuations, as those seen in autism, are more likely to occur in neural systems with atypically lower neural noise levels.
Overall, our findings should be interpreted with caution, as they are dependent on the specific parameter values and model settings chosen in this study. These parameters were selected to examine main effects and theoretically relevant interactions. However, different parameter choices, especially at higher levels, could potentially accentuate some effects while making others less visible. This highlights the inherent dependence of computational models on initial assumptions and the necessity of constantly comparing computational results with empirical data to assess their validity.
These findings are relevant for understanding the variability in perceptual processing, particularly in autistic individuals. The ability of our model to simulate varying behavioral outcomes from continuous alterations in processing mechanisms mirrors the spectrum of neurodiversity and behavioral variability within autism. By exploring the links between neurocognitive mechanisms and behavior we provide a framework to reconcile previous research of multistable perception in autism, as our research highlights two critical ideas in understanding autism: First, the same behavioral trends can emerge from a diversity of altered neurocognitive mechanism. This perspective suggests that autistic individuals may present with similar behavioral patterns while possessing distinct underlying neurobiological profiles. This also helps explain why different empirical studies may report similar behavioral outcomes despite focusing on different (apparently contradictory) underlying cognitive and neural processes. Conversely, we do not rule out that distinct behavioral patterns within autistic individuals could emerge from shared neurobiological mechanisms, considering that autism diagnosis is based on observed behaviors and lacks definitive biomarkers. Second, no single (altered) mechanism can fully capture the complexity of perceptual processing in autism. Our study critically calls for moving away from traditional “heuristic” theories of autism, that postulate a single-mechanism to account for a wide range of behavioral outcomes (see Davis & Plaisted-Grant, 2015), as it instead strengthens the notion of autism as a spectrum of neurodiversity (Happé & Frith, 2020) resulting from subtle to more marked variations in neural, cognitive, and behavioral influences in a complex system.
If, as our data suggest, atypical multistable perception arises from various altered neurocognitive processes, expanding the number of tasks beyond a single MP paradigm could help pinpoint the atypical mechanisms with greater precision in each individual. Future research on this approach holds the potential for developing cognitive assessment batteries that rely on multiple behavioral markers to improve the mapping of neurocognitive mechanisms underlying autistic traits. By identifying these mechanisms more accurately, therapeutic interventions could be better tailored to individual profiles, enhancing their effectiveness. An additional avenue for future research in computational models of autism, with potential impact on clinical practice, involves leveraging biologically realistic simulations to refine mappings between neural function and behavior. These models may improve protocols for assessing the effects of pharmacological treatments in cases where medication is recommended. By identifying the role of medications in modulating neural mechanisms, such as excitation and inhibition levels, these approaches could predict behavioral outcomes and inform targeted interventions.
Our approach calls for an integrative theoretical framework of autism that synthesizes insights from multiple perspectives (e.g., cognitive, computational, and neurobiological). Such an approach provides a more robust understanding of developmental disorders, critically accounting for the notable variability in behavior and neurobiology in autism. This model has allowed us to ground and test mechanistic ideas from influential neurobiological theories of autism, such as the excitation-inhibition imbalance (Rubenstein & Merzenich, 2003), alongside more abstract cognitive notions like the influence of atypical bottom-up and top-down processing (Intaitė et al., 2019; Kornmeier et al., 2017), while also connecting these mechanisms to clinical and behavioral concepts, such as the atypical sensory-perceptual experience (Robertson & Baron-Cohen, 2017). By advocating for a pluralistic perspective, this integrative framework bridges diverse theoretical approaches and fosters a more complex understanding of autism.
Footnotes
Declaration of conflicting interests
The author(s) declared no potential conflicts of interest with respect to the research, authorship, and/or publication of this article.
Funding
The author(s) received no financial support for the research, authorship, and/or publication of this article.
About the Authors