
Abstract
This article addresses the co-evolution of morphology and control in evolutionary robotics, focusing on the challenge of premature convergence and limited morphological diversity. We conduct a comparative analysis of state-of-the-art algorithms, focusing on QD (Quality-Diversity) algorithms, based on a well-defined methodology for benchmarking evolutionary algorithms. We introduce carefully chosen indicators to evaluate their performance in three core aspects: task performance, phenotype diversity, and genotype diversity. Our findings highlight MNSLC (Multi-BC NSLC), with the introduction of aligned novelty to NSLC (Novelty Search with Local Competition), as the most effective algorithm for diversity preservation (genotype and phenotype diversity), while maintaining a competitive level of exploitability (task performance). MAP-Elites, although exhibiting a well-balanced trade-off between exploitation and exploration, fall short in protecting morphological diversity. NSLC, while showing similar performance to MNSLC in terms of exploration, is the least performant in terms of exploitation, contrasting with QN (Fitness-Novelty MOEA), which exhibits much superior exploitation, but inferior exploration, highlighting the effects of local competition in skewing the balance toward exploration. Our study provides valuable insights into the advantages, disadvantages, and trade-offs of different algorithms in co-evolving morphology and control.
Keywords
1. Introduction
The automated design and construction of adaptive and autonomous machines, such as autonomous robots, remains a challenging problem that has yet to be fully solved. Currently, the only known process capable of producing machines that are fully adaptive and autonomous is biological evolution (Doncieux et al., 2015).
In the field of evolutionary robotics, evolutionary algorithms (which are part of the broader class of population-based metaheuristic algorithms) are employed to optimize various aspects of autonomous robots. These algorithms apply the principles of selection, variation, and inheritance inspired by natural evolution to the task of robot design, treating robots as artificial autonomous organisms capable of developing their own skills through interactions with the environment, without human intervention. When designing robots of this kind, multiple factors need to be taken into account concurrently, such as their morphology, sensors, actuators, control architecture, and control policies, all of which interact to determine their behavior.
Two of the most important aspects that can be optimized are morphology (body) and control (brain). Morphology refers to the physical shape and structure of the robot, while control or control policy refers to the strategy for controlling the behavior that allows the robot to perform a certain task. The co-evolution of morphology and control, where these two aspects of the robot mutually influence each other, is a key concept in evolutionary robotics. The morphology and control of a robot are deeply interdependent, and any changes in one have the potential to significantly influence the other. That’s why both aspects must be considered as part of a whole in order to exploit existing interdependencies, which is quite different from the traditional approach to robotics that tends to be reductionist, aiming to keep the design process as modular as possible by focusing on one aspect of the robot at a time while ignoring the rest (Doncieux et al., 2015). The idea here is that the coupled dynamics between the body, the brain, and the environment of an agent result in the emergence of intelligent behavior, which is known as embodied (artificial) intelligence (Auerbach & Bongard, 2010). It’s worth mentioning that since modifying the controllers and morphology of physical robots in this optimization process would be not only impractical but also costly, evolutionary robotics often relies on simulations using virtual creatures to perform this process, and subsequently manufactures physical robots based on the optimized designs.
An advantage associated with the use of evolutionary algorithms is their ability to be used as optimizers for any aspect of the robot, having only at their disposal a costly evaluation function, without any gradient information for it, while a disadvantage is the possibility of the algorithm converging to a local optimum (premature convergence) or not converging at all (Lipson et al., 2016). This is a widely recognized issue, commonly observed in evolutionary computing, and it is inherited in this domain due to the highly intricate nature of the problem, resulting in a rugged fitness landscape (Lipson et al., 2016). The prevalent issue observed in co-evolving morphology and control in virtual creatures or robots is that the evolution of morphology stagnates early on, resulting in a subset of very similar morphologies (Joachimczak et al., 2016; Kriegman et al., 2018; Lipson et al., 2016). This means that the potential benefits of co-evolving both aspects are lost, and optimization occurs only in the controllers. It has been found that this loss of morphological diversity is caused by the fact that morphological changes from one generation to another disrupt the optimized controllers, leading to individuals with recent morphological changes being discarded by selection pressure aimed at maximizing fitness in the chosen task (such as walking, swimming, goal-following, obstacle avoidance, etc.).
Some promising directions pursued previously include the imposition of mechanisms to protect morphological diversity, such as temporarily reducing selection pressure on recent morphological changes (Cheney et al., 2018), using Quality-Diversity (QD) algorithms such as MAP-Elites, defining a set of desired morphological characteristics in which quality is sought within the diversity itself (Nordmoen et al., 2020), and co-evolving control and morphology together in a first phase, followed by evolving only the controller in a second phase to adapt to recent changes in morphology (Nygaard et al., 2017). All these proposals provide promising contributions and results, however, many of them often measure the benefits only against using a fitness evaluation function in a traditional evolutionary algorithm as a reference, and little has been done to compare various approaches that explicitly aim to mitigate the problem of premature convergence of morphology with respect to control, under the same framework, with different indicators and a well-defined benchmarking methodology for optimization algorithms.
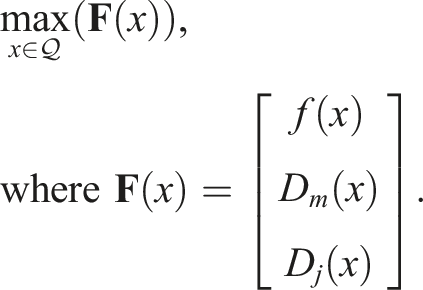
In this article, we compare some of the most representative algorithms that have been used in the state of the art to mitigate the premature convergence problem of morphology with respect to control in evolutionary robotics. Our approach is experimental in nature, as we rigorously assess these algorithms under a novel, unified statistical framework, with respect to a series of relevant indicators. In particular, we aim to address the following research questions: • How does an evolutionary algorithm that lacks any type of morphological diversity protection compare to other algorithms that do have it, in terms of the phenomenon of premature convergence of morphology with respect to control? • Does the problem of premature convergence affect different state-of-the-art algorithms in the same way? • How does the addition of morphological novelty as a secondary objective affect the fitness of solutions and the phenomenon of premature convergence of morphology with respect to control? • How does the introduction of global selection pressure affect a QD algorithm? Does it still maintain the desirable characteristics of QD algorithms? How does it compare to a multi-BC QD algorithm in terms of the phenomenon of premature convergence and the fitness of solutions? • How does the use of local competition instead of global fitness affect the fitness of solutions and the phenomenon of premature convergence of morphology with respect to control? • How does the use of genetic diversity instead of crowding distance affect the solution space? • Can adding a novelty objective based on a quality-driven behavior characterizer mitigate the issue of slow progress in QD algorithms when the diversity of interest (morphological) is unaligned with quality? Do any desirable characteristics of QD algorithms get lost?
The article is organized as follows. Firstly, in Section 2, we describe the main state-of-the-art strategies based on diversity preservation that have been proposed to address the issue of premature convergence in the co-evolution of morphology and control. Next, in Section 3, we provide a detailed account of the experiments conducted to systematically analyze the aforementioned strategies. Subsequently, in Section 4, we introduce a series of performance indicators, which were used to compare the results obtained from the experiments presented in Section 5. Moving forward, in Section 6, we present a methodology based on voting theory to select the optimal algorithm, with a focus on fairness and the careful consideration of multiple pertinent factors. Lastly, in Section 7, we present the conclusions.
2. Strategies for mitigating premature convergence in morphology and control co-evolution
The convergence of evolutionary algorithms typically occurs when the population reaches a single solution or a set of very similar solutions. This is reflected as a loss of diversity in the solutions and causes the population to stop progressing.
The loss of diversity often happens when individuals in the population converge around local or global optima. When an evolutionary run has converged to local optima, it is said to be trapped in local optima, or in other words, it has experienced premature convergence. This problem can be attributed to a bias toward exploitation in the trade-off between exploration and exploitation. Such bias becomes more or less relevant depending on the problem, with increased relevance in problems with multiple local optima or highly rugged fitness functions, such as those encountered in the co-evolution of morphology and control. It is crucial to have strategies that maintain good exploration throughout the evolutionary run when co-evolving morphology and control in virtual creatures and robots.
In this section, we describe the main state-of-the-art techniques used to preserve diversity, serving as strategies to mitigate the premature convergence problem.
2.1. Fitness sharing
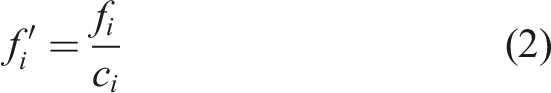
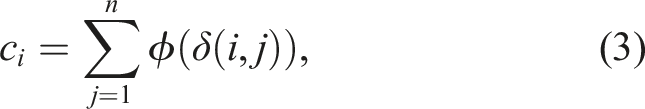
This diversity preservation technique involves scaling an individual’s fitness inversely proportional to its similarity with respect to the other individuals in the population so that the fitness function is modified to penalize those individuals that are similar. In Mouret & Doncieux, (2009), similarity is defined as
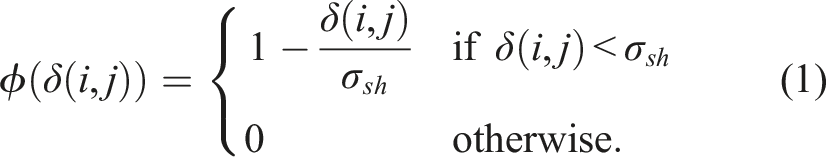
Thus, the modified fitness of an individual i is defined as
2.2. Speciation
Another approach to preserving diversity in evolutionary algorithms is to divide the population into species based on the similarity between individuals, such that: • Each species has a representative genome that comes from the previous generation. • It is decided whether an individual belongs to a certain species based on the niche radius σ
sh
. Individual i belongs to the niche or species represented by the genome of individual j if δ(i, j) < σ
sh
. • The genome of an individual is placed in the first niche where the previous condition is satisfied. • If a genome does not belong to any niche, a new species represented by that genome is created.
Speciation can be carried out in combination with fitness sharing and crossing constraints, as happens in the NEAT algorithm (Stanley & Miikkulainen, 2002). However, it should be noted that it is not necessary to do so, and each one can be used as a separate technique.
2.3. Crossover operator restriction
By limiting the crossover operator, this technique allows only individuals within the same species to be crossed or, alternatively, permits the crossing of only those individuals belonging to different species.
2.4. Diversity as an objective
Using a multi-objective framework, it is possible to include a diversity metric as an additional objective to maximize. This diversity can be applied in both the variable and objective space and is typically problem-dependent.
Previous research has demonstrated that the best results are achieved by measuring the average distance d between an individual and the rest of the population. Consequently, for the purposes of this article, the diversity D of an individual x with respect to the population in generation n (P
n
) is defined as
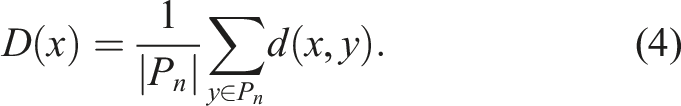
In the context of the co-evolution of morphology and control of virtual creatures, the distance between individuals can be defined in various ways depending on the representation and/or subsequent phenotypic expression they have. The choice of distance metric can have a significant impact on the co-evolutionary process and the resulting solutions. As mentioned in Mouret & Doncieux (2009), if the genotype is represented as a neural network, calculating the distance between two genotypes is an extremely complex problem since computing the distance between graphs is NP-Complete in itself. However, this problem can be reduced by choosing a vector
For example, in Mouret (2011), several algorithms are compared, including the integration of diversity and fitness under a multi-objective paradigm, in the task of evolving controllers (neural networks) for two-wheeled mobile robots to reach a goal in an obstacle environment.
The distance between two individuals can be defined in terms of what is called the behavior vector. For example, the behavior vector

In Nordmoen et al. (2020), both morphology and control of modular robots are evolved for the task of walking the farthest distance possible. The morphology is given by a direct encoding based on trees, where each node in the tree is a module and each edge is a connection between two modules. There are two types of modules, non-mobile and joints, each supporting up to 5 and 3 child nodes, respectively. The control system consists of all individual controllers of each joint, and each controller is defined by 5 parameters. In this case, it is desired to protect morphological diversity, so the behavior vector of an individual x in the space


The diversity is defined in the same way as in equation (4). It should be noted that the distance defined in this case is a function
2.5. Divergent search
The ideal of evolutionary computation to replicate the complexity and sophistication achieved in nature and use it as an optimizer is undoubtedly an extremely ambitious goal. However, this ambition has led to the search for more complex encodings and algorithms. According to this ideal, it should be enough to use selection pressure correctly toward an arbitrarily ambitious objective, but the results, especially in evolutionary robotics, tell us otherwise (Pugh et al., 2016).
Despite strong criticism from purists in the fields of machine learning and optimization, labeling it as an ad hoc method (Pugh et al., 2016), a question stands out as motivation to continue exploring the alternative of artificial evolution: how has nature been able to generate intelligence, and if we look at our best efforts to create artificial intelligent systems with traditional optimization, despite being better than humans in some tasks, they often fall short in areas where human cognition excels?
Divergent search proposes that perhaps the idea of evolution has been applied in a somewhat incorrect way. Natural evolution is divergent, rather than convergent. This idea gives rise to a new vision: evolution as a machine for diversification instead of optimization. This new perspective suggests that the problem lies in the abstraction of evolution that has been used all this time. If we look at natural evolution, it is clear that there is no optimization involved, and there is no clear objective except for a notion of reward for individuals that are not only better but also different (evolutionary niches: some organisms that are sufficiently different from their predecessors may enjoy reduced competition, making them more likely to survive).
2.6. Novelty search
It is a radicalization of the previous idea, completely disregarding optimization toward a particular goal (e.g., the fastest robot, the most efficient, the best at solving mazes), and directing the search solely through a notion of novelty as a consequence of diversity (Pugh et al., 2016). In Novelty Search, no fitness function based on a specific goal is optimized to explore the search space. Instead, a novelty metric of the individual is rewarded, allowing us to know how far it is from the rest of the population (either in the search or solution space) (Lehman & Stanley, 2011a). A novelty metric that allows us to measure the dispersion at any point in the space in question is
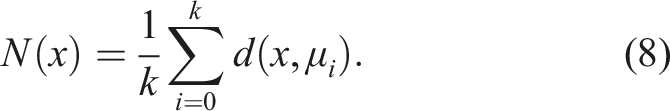
This refers to the average distance of the individual x to its k nearest neighbors. Here, d(x, μ i ) represents a certain distance metric dependent on the domain. The greater the average distance to its k nearest neighbors, the more dispersed the point x is located in a particular region (Lehman & Stanley, 2011a).
Regarding the implementation, to direct the search process toward more dispersed regions, a novelty archive
Novelty search has been successful in some domains, especially those in which the fitness evaluation space is considered “deceptive” (problems where objective-based evaluations fail), as objective-based evaluation is susceptible to getting trapped in local minima in which the evolutionary process converges to a single solution, losing diversity. An example of a problem where NS has been successfully applied is in the production of agents capable of navigating mazes. In particular, navigation in an old city whose map is unknown can be thought of as a deceptive problem, given that they often have an irregular path structure (Omelianenko, 2019). Novelty search has demonstrated that the evolutionary ability for diversification can be harnessed to find solutions close to global optima. In contrast to the traditional notion in evolutionary computation of survival of the fittest, novelty search emphasizes survival of the most novel (Lehman & Stanley, 2011a).
Similarly to adding diversity as an additional objective, novelty can also be incorporated as an extra objective. This was demonstrated by Mouret (Mouret, 2011). In this study, the multi-objective regimes of diversity+fitness and novelty+fitness were compared against novelty and fitness as single objectives respectively in evolving neural network controllers for mobile robots in the task of solving a maze. The best results were obtained using novelty+fitness, although only marginally better than diversity+fitness.
2.7. Quality-diversity
The problem with the Novelty Search approach is that it uses diversity as a means to achieve the usual end of finding a global minimum (Pugh et al., 2016), that is, as an optimizer. Moreover, the idea of completely eliminating objectives means that there is no notion of good and bad solutions, which seems to be crucial in most applications. In contrast to the search for global optima, Quality-Diversity (QD) methods seek to emulate the way evolution works in nature, so that in a single run, diverse ways of solving the same problem are found, all equally viable. The objective of QD algorithms is to find a maximally diverse collection of individuals with respect to the space of possible solutions, where each member is maximally fit in its own evolutionary niche (Pugh et al., 2016). QD algorithms balance the search for diversity, which finds many evolutionary niches, with local searches for quality within each niche. Within a niche, competition is focused on individuals, thus producing the best possible individuals locally within the niche. This type of search is capable of finding diverse solutions while improving existing ones (Pugh et al., 2016).
In QD, the diversity measurement of an individual x and its position in the space of features or behaviors
The general problem to be optimized in QD algorithms is to find, for each point
In general, QD algorithms work by sampling with a certain granularity
In QD, the feature space
The promise of QD algorithms is that, in addition to being competent in performing tasks traditionally oriented toward optimization, they can surpass what is possible with traditional optimization algorithms (Pugh et al., 2016). These types of algorithms have also been called “illumination algorithms” because they reveal (or “illuminate”) the best achievable performance in each region of the phenotype space.
It should be noted that these types of algorithms are different from simply using a multi-objective framework and adding novelty or diversity as an additional objective. The distinction lies in the locality of the quality search in QD. Unlike the purely multi-objective case, where the notion of quality of an individual x is global, in QD, the notion of quality is local to the niche N
i
, where the phenotype of x is according to
2.8. Novelty Search with Local Competition
The NSLC algorithm aims to use a multi-objective framework, specifically with two objectives: quality and novelty. However, the approach to multi-objective optimization is somewhat special in this case. As explained, in QD algorithms, global optimization is not sought, as would happen in a traditional multi-objective approach. Instead, the goal is to find niches that are as diverse as possible through the novelty objective exposed by Novelty Search, and within each niche obtain high-quality solutions through the concept of “local competition,” which consists of evaluating the individual according to the number of individuals that it outperforms in terms of fitness within its own niche, that is, it locally looks for the best within the same niche. There is no promotion of a concept of “best” globally, and this algorithm does not focus on inherently better niches.
In the work of Lehman and Stanley (Lehman & Stanley, 2011b), where this algorithm was first proposed and applied to morphology and control co-evolution, Pareto-based non-dominated sorting is used with two objectives: movement quality evaluated as a certain distance traveled (in this case the Euclidean distance) by an individual in a given simulation time, and novelty evaluated as a subroutine through Novelty Search in a three-dimensional morphological space (in this case, these morphological characteristics make up a behavioral characterization) composed of height, mass, and number of active joints (actuators). The novelty metric is given by the average Euclidean distance to the k nearest neighbors (in the same way as in pure NS), and the quality objective is given by the proportion of those same k nearest neighbors that are surpassed with respect to the movement quality metric. In NSLC, niches emerge when calculating the k nearest neighbors to the individual, so it can be said that the quality of a certain individual is calculated locally to the niche as the proportion of individuals in the niche that are surpassed by it.
The niche N of an individual x is defined as the k nearest neighbors to the individual in the
NSLC can be formulated as a two-objective multi-objective problem, as follows
In Lehman & Stanley (2011b), a substantial trade-off was found: despite obtaining more diverse results in terms of morphology, the fittest individuals obtained by NSLC were slightly worse than the fittest individuals from a traditional evolutionary algorithm. One possible hypothesis proposed is that unlike what happens in the natural world, in artificial evolution, populations with fixed sizes are used, and this limits the ability of each niche to explore for better individuals since exploring new niches necessarily involves redirecting resources away from niches that have already been discovered. This is another example of the complexity ceiling that the field has encountered.
2.9. MAP-Elites
Unlike NSLC, where niches emerge as part of the NS search process and the novelty archive it maintains, in the MAP-Elites (Multi-dimensional Archive of Phenotypic Elites) algorithm, the behavioral space is explicitly subdivided into niches (bins/containers) created by discretizing
It is noteworthy that in Chatzilygeroudis et al. (2020 and Cully & Demiris (2018), the authors propose a framework for the generalization of QD algorithms. This framework abstracts the main components common to all QD algorithms and provides an example of how it can be used to generate new QD algorithms. Additionally, the authors distinguish between two main types of archives present in QD algorithms: the NSLC archive, referred to as an unstructured archive or simply an archive, and the MAP-Elites archive, referred to as a “grid.”
2.10. Multi-BC QD
One important aspect of a suitable feature space is its alignment with the concept of quality. Alignment in the context of a BC is defined as the degree to which finding diversity also leads to finding higher fitness (Pugh et al., 2016). It has been found that seeking diversity using a BC with higher alignment results in better outcomes simply because the search for diverse solutions also leads to better quality solutions, thereby mitigating the problem of premature convergence. Two examples where the effects of having aligned and unaligned BCs can be distinguished are: • In the domain of maze-solving agents, the goal is to find the topology and weights of a neural network that controls the agent through inputs provided by proximity sensors (for obstacle detection) and navigation sensors (that inform the robot the direction of the goal) and outputs that control linear and angular acceleration. An associated BC simply based on the final position of the agent in the maze will be highly aligned, since an agent that continuously finds new positions will eventually reach the final position in the maze (Pugh et al., 2016). • In the co-evolution of morphology and control of virtual creatures, the search for novel morphologies in many cases does not lead to better walking cycles (Lehman & Stanley, 2011b) (at least in the short term and without diversity protection (Cheney et al., 2018), and without introducing development (Kriegman et al., 2018)). However, it has been widely pursued to address the problem of premature convergence of morphology with respect to control, since premature convergence is often a consequence of a loss of diversity.
The degree of alignment is extremely difficult to measure a priori; however, it can be anticipated by considering the following two properties: 1. Each behavior is associated with a reduced range of fitness values. 2. The maximum fitness value in adjacent regions of the BC space is correlated.
In Pugh et al. (2016), it is suggested that when diversity is sought using unaligned BCs, QD algorithms fail to obtain optimal solutions, and in more complex problems, they may completely fail to make any progress toward even viable solutions. This is why they propose the use of new variants of MAP-Elites and NSLC algorithms capable of handling multiple BCs. The following are the most representative variants.
2.10.1. Multi-BC Novelty Search with Local Competition
This extension to the NSLC algorithm incorporates a third objective, a novelty metric aligned with quality, and can be especially useful in domains where the novelty used in NSLC is unaligned with quality. This second BC would incorporate desirable features that, according to the decision maker’s judgment, could represent a potential alignment with quality. This leads to potential variations with more than two BCs, multiple notions of local competition, etc., using a multi-objective evolutionary algorithm capable of dealing with the curse of dimensionality. It should be noted that with each BC introduced, a new novelty archive will have to be introduced, along with the distance defined for that BC in order to calculate novelty.
2.10.2. Multi-BC Map-Elites (ME-ME)
Similarly to MNSLC, this algorithm introduces a new BC aligned with quality, hence a new grid. In each generation, an equal number of parents are selected from each grid, and their children are mapped to both archives independently (a child may be saved in both, one, or neither archive).
3. Experiments
In this section, we present the experimental setup of this study, while following a framework as general as possible for conducting experiments with virtual creatures and evolutionary robotics.
3.1. Representation
We chose to adopt Lipson et al.’s approach (Lipson et al., 2016) as the basis for the morphology and control representation in our study. This approach employs a diploid genotype that encodes both morphology and control using two CPPN (Compositional Pattern Producing Network) neural networks (Stanley, 2007). These networks are structured as weighted, connected, acyclic graphs, where each node or neuron corresponds to a perceptron (Mcculloch & Pitts, 1943).
The use of two different CPPNs allows for variations in one aspect without affecting the other, direct measurement of genetic diversity and complexity of the neural networks of each aspect, and proposing relevant indicators to detect and measure the phenomenon of premature convergence of morphology relative to control. Additionally, as already observed in the literature (Cheney et al., 2014), the use of CPPNs as an indirect encoding tends to lead to better evolvability, as they are capable of producing morphologies and controllers with regular patterns.
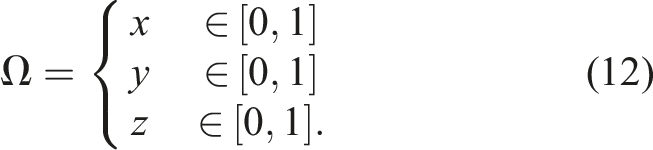
For the CPPNs used, we have a region
3.1.1. Morphology
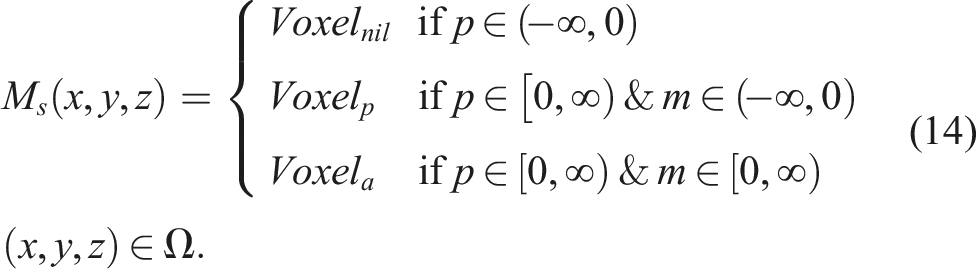
For the experiments conducted in this article, we chose to evolve robots with soft voxel-based morphologies (softbots). We chose these morphologies for their promise in terms of versatility, ease of evolution, and potential to be transferred from virtual to physical worlds. We used morphologies with two types of voxels, active and passive. The active voxels act as muscles or actuators, each performing expansions and contractions at the same frequency but with different phase offsets, allowing for movements similar to the propagation of a wave. A valid morphology is created in a discrete design space with a fixed resolution of 5 × 5 × 5, and is composed of a combination of any number of contiguous voxels.
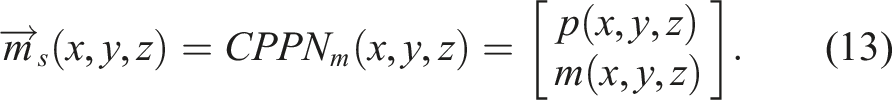
The neural network CPPN
m
has a fixed number of inputs and outputs. It has four inputs (x, y, z, r), corresponding to the three Euclidean coordinates of the three-dimensional design space, plus a radial coordinate (with the hope of encouraging the appearance of radial patterns). Similarly, it has two outputs,
We can say that the CPPNs in these experiments are functions of (x, y, z), and not r, by considering as always having an input neuron with and activation function
Henceforth, the evaluation of CPPN
m
can be expressed as a function
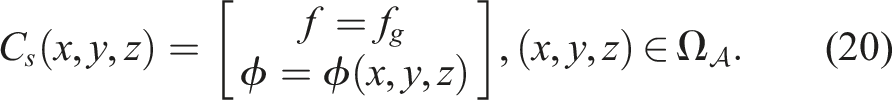
3.1.2. Control
The control system is composed of all the active voxels within the morphology, which is defined as
Once the morphology is obtained, all the control system’s voxels are taken, and given the coordinates of each one
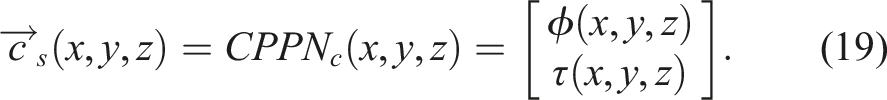
In CPPN
c
, the inputs are the same as in CPPN
m
, and the outputs are also two, (ϕ, τ) ∈ [0, 2π] × [−1, 1], where ϕ corresponds to the phase shift that the actuator voxel has with respect to a global frequency f
g
, and τ corresponds to the period. For the case of ϕ, it can take scaled values of [0, 2π] radians, which is achieved by always connecting the output u to a neuron with a logistic activation function scaled by 2π
The period τ is used to obtain the global frequency f
g
, averaging the frequency obtained for each active voxel f (x, y, z) = 1/τ(x, y, z),
The value of τ is obtained by connecting the output v of the neural network to a logistic activation function biased in the interval [−1, 1], where
Moreover, the calculation of f
g
has discontinuities at
Henceforth, the evaluation of CPPN
c
can be expressed as a function
The control system is like a mass-spring-damper system, where masses correspond to the centroids of voxels (nodes), and springs to the edges formed from the Delaunay triangulation, thereby the resting length L0 is determined. Actuation is achieved by altering the resting length according to the following signal
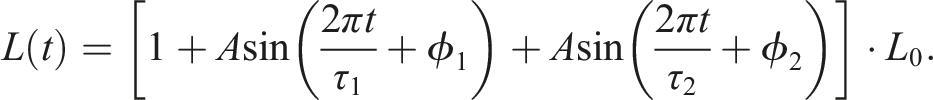
where τ1, τ2 and ϕ1, ϕ2 are the periods and phases associated with the centroids at the end of the spring. In other words, modifying the resting length serves as an input signal to the system. The controllers are open-loop, as they do not take into account any error signals or sensor feedback.
3.1.3. Softbot definition
Per the definitions for morphology and control presented in Sections 3.1.1 and 3.1.2, it is possible to define a softbot s, such as the ones evolved in these experiments, based on its morphology (Equation (13)) and control (Equation (19)) genotypes, as well as its morphology (Equation (14)) and control (Equation (20)) phenotypes.
The genotype G
s
of a softbot s is defined as


3.2. Task
The task chosen for all experiments in this work was locomotion in a straight line, undoubtedly the most common task in the literature on morphology and control co-evolution. However, it is not the only one, and in practice, locomotion toward an objective (Lan et al., 2018; Lan et al., 2021; Sims, 1994;), locomotion with obstacles and in different environments (Stensby et al., 2021), moving in confined spaces (Cheney et al., 2015), or competing to seize an object (Miconi & Channon, 2006; Sims, 1994) may be more of interest. Nonetheless, the chosen task is comparatively simple and reduced, and the interest of this research is not to explore different environments or tasks (although they are equally valid research avenues), but mainly to investigate the incidence of premature convergence of morphology with respect to control, and to benchmark different algorithms with mechanisms for protecting morphological diversity according to relevant indicators.
3.3. Simulated environment
The softbots were tested on a flat surface within the Voxelyze physics engine (Hiller & Lipson, 2014), which was accelerated by GPU using CUDA, and referred to as Voxcraft (Liu et al., 2020).
3.4. Algorithms and parameters
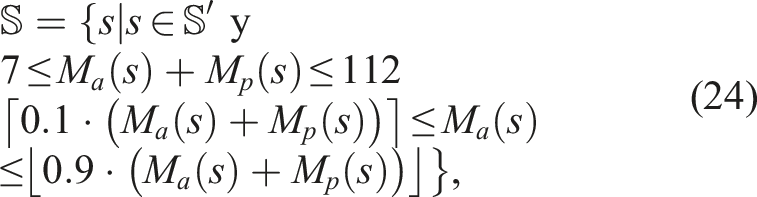
Firstly, we shall define the unrestricted softbot search space
With such restrictions,
Functions
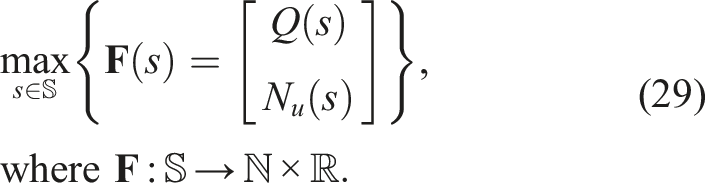
The experiments were conducted using five different algorithms: (i) Single-Objective Evolutionary Algorithm (SO), (ii) Fitness-Novelty MOEA (QN), (iii) Novelty Search with Local Competition (NSLC), (iv) Multi-dimensional Archive of Phenotypic Elites (MAP-Elites), and (v) Multi-BC NSLC (MNSLC), with 20 runs of each algorithm to obtain statistically significant results.
To identify the parameters with which the algorithms had to be run, especially those with diversity protection mechanisms, runs were performed on benchmark problems with multimodal functions instead of directly on the morphology and control co-evolution problem due to its high computational cost. It was of particular interest to find a set of parameters that balanced the fact that a higher number of individuals per generation would take advantage of GPU simulations. The QN, NSLC, and MAP-Elites algorithms were run on the Rastrigin, Ackley, Eggholder, and the fourth Schaffer Function benchmark problems, paying special attention to the parameters used for the latter, as the domain for which it is defined (x1, x2 ∈ [−100, 100]) is similar in size to the misaligned BC used for the number of passive and active voxels M
p
, M
a
∈ [0, 125]. Once the parameters for these functions were identified, some test runs were done with fewer generations (200) to further refine the obtained parameters. By doing all this, the following parameters were established for all experiments: • population_size: 100 • generations: 1000 • design_space_resolution: [5,5,5] • k (number of nearest neighbors considered to calculate novelty between individuals in the archive and the current population): 200 • novelty_threshold (initial novelty threshold value): 12. • novelty_floor (the minimum value that the novelty threshold can take): 1. • max _archive_size (the maximum archive size): 1500. • min _archive_size (the minimum archive size): 1. • grid_dimensions: [25, 25]. • Mutation: p
m
= 1/2. Both neural networks, CPPN
m
and CPPN
c
are subject to a mutation with probability p
m
. A random selection is made from six different types of mutations: – Node Addition—a connection (u, v) of the CPPN is randomly selected, with a weight w
o
= w(u, v). A new node q is added between u and v, creating the path u↦q↦v, where the connections (u, q) and (q, v) have weights w(u, q) = 1 and w(q, v) = w
o
. A random activation function is chosen. – Node Removal—a hidden node connected to another node u is randomly selected and removed, while ensuring that the connectivity of any path passing through u is maintained. – Connection Addition—a pair of nodes u and v is randomly selected from the network, such that the edge (u, v) does not already exists in the network, both are hidden nodes, and u ≠ v. Once the node pair is chosen, the connection (u, v) is created, and a random weight is assigned, either w(u, v) = −0.1 or w(u, v) = 0.1. – Connection Removal—a connection is randomly selected and removed. – Activation Function Change—a hidden or output node is randomly selected, and its activation function is changed to a different one from its original function. – Weight Mutation—a connection (u, v) is randomly selected, and its original weight w
o
= w(u, v) is modified based on a normal distribution, resulting in a new weight
Two archives and two grids are used in the experiment. The two archives are employed to measure aligned and unaligned novelty. The two fitness and aligned novelty grids are used to assess coverage and QD-scores. In the case of the fitness grid, MAP-Elites also employs it for the search process instead of a population.
3.5. Implementation
PyMOO (Blank & Deb, 2020), a multi-objective evolutionary algorithms framework implemented in Python, was used due to its strong object-oriented approach, modularity, and extensibility, allowing for clean, cohesive, and simple integration of the specific implementations of Novelty Search, Novelty Search with Local Competition, and MAP-Elites into a generic evolutionary algorithm, as well as the variations of these algorithms, and the evaluation function based on Voxcraft simulations.
3.5.1. Single-Objective Evolutionary Algorithm (SO)
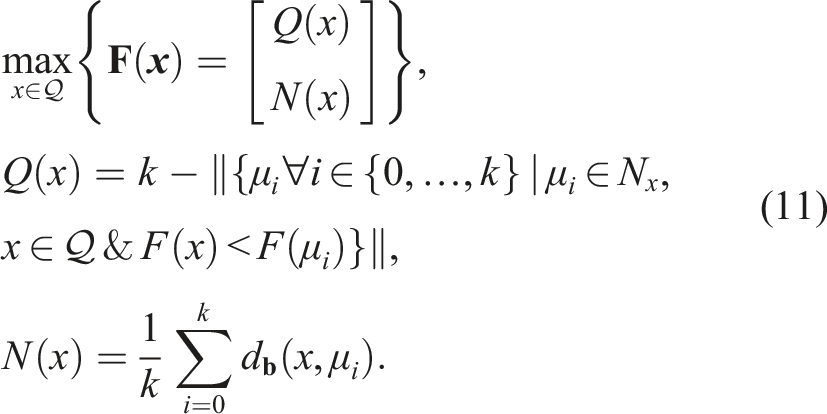
We took as a baseline the simple single-objective evolutionary algorithm (μ + λ). The problem to be solved was
This algorithm does not provide any kind of protection for morphological diversity and serves as a starting point to identify the phenomenon of premature convergence of morphology with respect to control and compare it with other algorithms that do provide protection for morphological diversity.
3.5.2. Fitness-Novelty MOEA (QN)
In this experiment, the problem to be solved was
The NSGA-II implementation from the PyMOO framework was used.
We aimed to answer the following questions using this algorithm: • How does adding morphological novelty as a second objective affect the phenomenon of premature convergence of morphology with respect to control? • How does adding morphological novelty as a second objective affect the fitness of the solutions? • How does this multi-objective approach that uses global fitness compare to its QD counterparts that consider local fitness (NSLC and MNSLC) in terms of the phenomenon of premature convergence and the fitness of the solutions?
3.5.3. Novelty search with local competition
This is the same algorithm as the one described in Section 2.8, the problem to be solved was
The NSGA-II implementation from the PyMOO framework was used, replacing the crowding distance with the genetic diversity calculation described in equation (54).
The purpose of including this algorithm in the experiments is to provide a response to the following questions: • How does using local competition instead of global fitness affect the phenomenon of premature convergence of morphology compared to the control? • How does using local competition instead of global fitness affect the fitness of solutions? • How does using genetic diversity instead of crowding distance affect the results? • How does it compare to a QD algorithm with fitness-based selection pressure (ME) and another Multi-BC algorithm in terms of the phenomenon of premature convergence and the fitness of solutions?
3.5.4. Multi-dimensional Archive of Phenotypic Elites (MAP-Elites)
MAP-Elites was implemented using the generic genetic algorithm proposed in Eiben and Smith (2003), taking into account the following considerations: 1. Algorithm Initialization: The initialization of MAP-Elites relies on the discretization of the feature space into bins or niches and the initialization of a number of individuals, denoted as P, which can be considered as the initial population. Each individual is placed in its corresponding bin based on • Discretization of

where l
i
and u
i
are the lower and upper limits of the i-th feature, defining the possible values for each feature. The discretization b
i
of a certain feature

The discretization B of the space • Population initialization and placement of individuals in the discretized space B is done as follows: A random sample of individuals of size P is taken. P genotypes are initialized randomly, expressed as phenotypes, and evaluated. In order to place an individual x in the discretization B, the feature vector

If we want the index of the bin where an individual x falls in the i-th dimension, given the value of
With this, it is possible to convert a real-valued feature vector into an integer-valued feature vector, where each entry determines the bin or stencil it belongs to, based on the value of the corresponding feature. In other words

With this mapping, we can obtain the index of the bin to which the individual x belongs by 2. Survival: Each individual in a population of offspring of size P is evaluated and placed in a bin based on its feature vector 3. Selection: In the original algorithm, each individual in a parent population of size P is chosen with uniform probability from the elites present in the grid. In these experiments, we made the modification described in (Cully & Demiris, 2018) to select parents proportionally to their fitness.
The modification in the selection process was made in order to investigate the following research questions: • How does the introduction of global selection pressure affect a QD algorithm like MAP-Elites? • Does it still maintain the desirable characteristics of QD algorithms? • How does it compare to a Multi-BC QD algorithm?
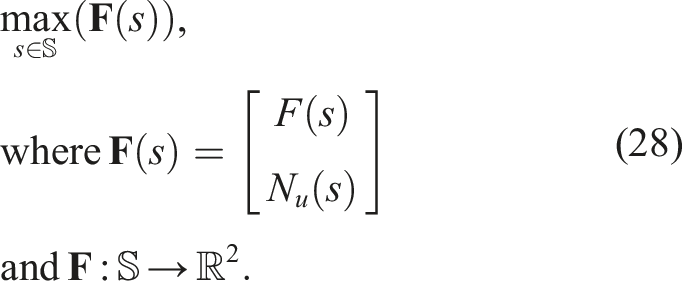
3.5.5. Multi-BC NSLC (MNSLC)
It’s the same algorithm described in section 2.10.1. The problem being addressed is the following
The behavior or aligned novelty function N
a
(s) is described in detail later in Section 4.1.2. With the introduction of this algorithm to the experiments, we ask the following two research questions: • Can the addition of a third novelty objective to NSLC in a BC that is assumed to be aligned with quality mitigate the problem of slow progress in QD algorithms when the diversity of interest (morphological) is misaligned with quality? • Are any desirable characteristics of QD algorithms lost, especially those related to premature convergence of morphology with respect to control?
4. Performance indicators
In this section, we provide a detailed account of the proposed indicators that were used to compare experiments involving the co-evolution of morphology and control in virtual creatures, with particular attention to the issue of premature convergence of morphology relative to control.
Originally, 31 indicators were introduced, grouped into three relevant aspects: phenotypic diversity, genotypic diversity, and task performance. However, upon conducting linear regressions on the entire distribution of experimental data for each pair of indicators and obtaining correlation coefficients, it was decided to discard any indicator from any pair that had a correlation coefficient of r ≥ .85 in order to reduce the indicators to only those that provided the most information. This led to a reduction of 11 indicators, which are presented below.
4.1. Task performance indicators
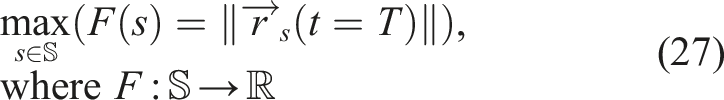
4.1.1. Fitness
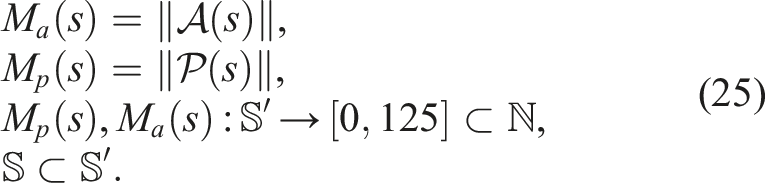
The fitness function for the walking pattern learning task was the distance traveled by the softbot in a simulation of T = 5 [s],
4.1.2. Behavioral or aligned novelty
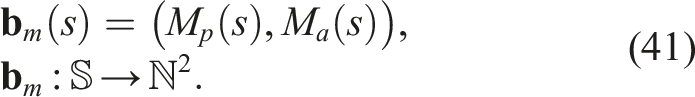
A notion of diversity that appears to be quite aligned with fitness or quality is defined based on the three-dimensional simulation space in which the softbots perform, since it would be precisely measured in the feature space (BC) where the robots’ fitness is measured.
Drawing direct inspiration from (Mouret, 2011), we define the behavioral distance between two softbots s1 and s2 as the L2 norm of the vector formed by their final positions after a simulation of duration T, that is

Using the aforementioned distance, it is possible to define behavior novelty, or alternatively, aligned novelty (given that it is defined based on the distance over an aligned BC). To calculate the aligned novelty N
a
of a softbot s an aligned novelty archive is required. By using equation (36) and substituting it into 8, we obtain
4.1.3. QD indicators
In general, the primary metric for QD algorithms is the QD indicator. This indicator uses a grid, and regardless of the quality metric (Q) used in the selection criteria for elites in each bin, it is summed for all bins, resulting in an indicator that can inform the total or accumulated local quality of the solutions found so far or the quality of the diversity found so far.
Let Q (x
i
) be the quality of individual x
i
(or any attribute of x
i
) which has the highest quality found so far in bin i of the grid G, where G(i) = x
i
. The QD indicator is defined as
It is worth mentioning that this kind of indicator, along with coverage (which will be discussed later), is always computed with respect to an archive (grid) since they are derived from the MAP-Elites algorithm. This is different from all the indicators mentioned earlier, which were based on the population. It is important to keep in mind that in MAP-Elites, the primary structure being evolved is the grid, not the population as in other algorithms.
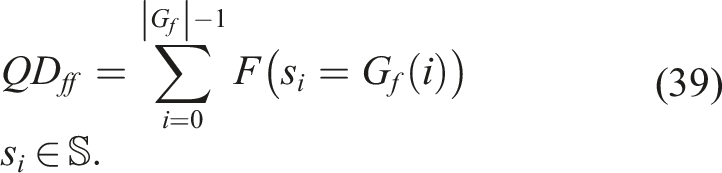
We propose two QD indicators: QD ff indicator (Fitness Grid/Fitness) and QD anan indicator (Aligned Novelty Grid/Aligned Novelty).
For the indicator QD
ff
, a grid is introduced where the main criterion for retaining the elite in each bin is fitness. In each evaluated generation, a MAP-Elites selection cycle is performed, and quality is obtained by substituting Q
i
(x) = F(x) in (38)
On the other hand, for the indicator QD
anan
, a grid based on the proposed aligned behavioral characterization (BC) is introduced, where the selection criterion for each MAP-Elites cycle was the aligned novelty N
a
instead of fitness F. Similar to the previous indicator, the notion of quality for each bin, in this case, aligned novelty, are summed up to give a metric that tells us the quality found in terms of morphological diversity in the solutions of an algorithm, where quality is understood as a notion of diversity supposedly aligned with quality
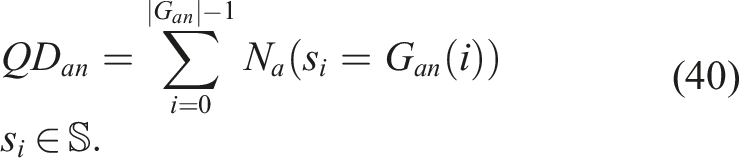
It should be noted that the aligned novelty in this grid is calculated not only with respect to the members of the grid and the current population but also with respect to the members of the aligned novelty archive. This is because the archive maintains a history of the solutions generated throughout the evolutionary run, not just the elites. If only the elites are considered against the current population, members of the current generation could be mistakenly considered more novel than they actually are, and members of the grid could be considered less novel, or vice versa.
4.2. Phenotypic diversity indicators
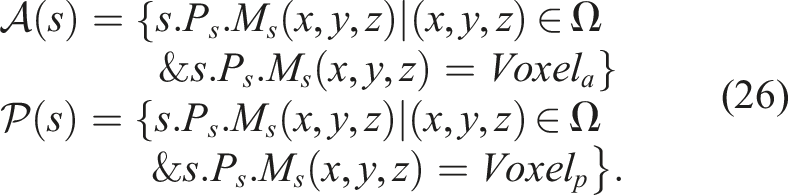
4.2.1. Morphological diversity
If we want to introduce diversity in the co-evolution of morphology and control of virtual creatures, we need a notion of distance, which can vary greatly. Furthermore, if we decide to measure distances between the neural networks that encode morphology (graphs), and we use a graph-defined distance, such as an edit distance, we would find that such a distance for directed and cyclic graphs is an NP-Complete problem in itself. However, the notion of vector and feature space (BC) can be introduced by making a model-free dimensionality reduction. We took inspiration from Nordmoen et al. (2020) to define the morphological feature vector of a softbot s as
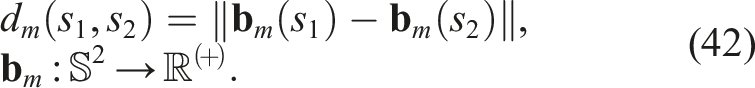
Thus, the morphological diversity of a softbot s with respect to the population in generation n (P
n
) can be defined by substituting equation (42) into equation (4)
4.2.2. Morphological or unaligned novelty
In morphology and control co-evolution, the search for novel morphologies often does not lead to better walking patterns. Therefore, the BC defined earlier, on which the morphological distance was defined, is a misaligned BC. Similarly, if we define novelty using this distance, we will have a morphological or unaligned novelty. To calculate this unaligned novelty N
u
of a softbot s, we use equation (42) and substitute it into equation (8)
4.2.3. QD fun indicator (Fitness Grid/Unaligned Novelty)
The QD
fun
indicator quantifies the accumulated unaligned novelty present in the fitness grid. It is computed by setting Q
i
(x) = N
u
(x) in equation (38), and is evaluated with respect to the fitness grid, population, and the archive of unaligned novelties
4.2.4. Coverage
This metric is defined as the ratio between the number of discovered cells and the total number of cells in the grid. It can be expressed as
It is worth noting that for a given algorithm, any number of grids defined in the same BC will always have the same coverage, as it quantifies the proportion of the BC space that has been visited at least once, regardless of the quality metric being used to update the grid.
4.3. Genetic diversity indicators
These indicators arise in the implementation of NSLC (Novelty Search with Local Competition), as there is a need to define a more rigorous diversity measure among genotypes than what is originally defined in the original paper of the algorithm (Lehman & Stanley, 2011b).
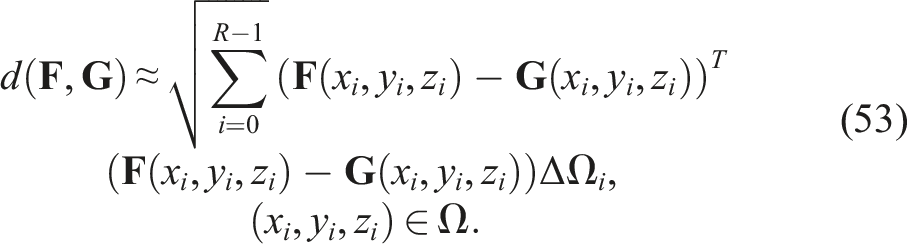
This indicator is derived from the implementation of NSLC, as there is a need to define a more rigorous diversity among genotypes compared to the original paper of the algorithm (Lehman & Stanley, 2011b). In that work, it is stated that there is a need to replace the crowding distance of NSGA-II as a mechanism to promote diversity along Pareto fronts with a genotype-based diversity indicator. The authors argue that a diversity defined in the space of local competition and novelty objectives may not necessarily reflect the diversity of interest (in this case, the diversity of morphologies). For instance, it is possible to have two individuals with exactly the same local competition and novelty scores. However, since these scores are entirely relative to the k nearest individuals, these two individuals could be located in completely different regions of the morphology space (i.e., they could have distinct morphologies). However, the crowding distance would penalize these two individuals heavily, potentially discarding them. Lehman and Stanley (Lehman & Stanley, 2011b) then proceed to define a genetic diversity based on a distance metric that counts the nodes and edges of the graphs that represent the morphology and control of the evolving robots. For the genotype distance defined in this article, the fact that we are working with genotype representations based on neural networks was leveraged to define a genotype distance based on the outputs of the CPPNs that encode the morphology and control. Considering that a neural network is a universal function approximator (Cybenko, 1989), a CPPN with m input neurons and n output neurons can be seen as a function

the distance between f and g can be seen as d (f, g) = ‖f − g‖.
If the norm of the function f is defined in terms of the inner product as

Extending to vector fields
For the CPPNs used in the experiments, the region Ω corresponds to the design space. For a design space with a resolution of R = X × Y × Z, we have that
As a result, the previously defined distance can be expressed in discrete form as
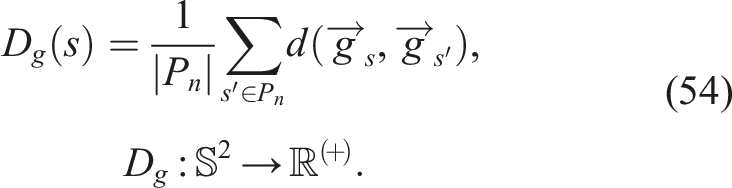
4.3.1. Genetic diversity
If we use the morphology and control neural networks as the gene expression function
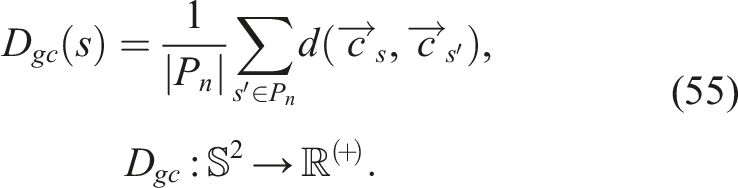
4.3.2. Genetic diversity of control
If we now consider only the neural network controller as the gene expression function for the controller of a softbot s, denoted as
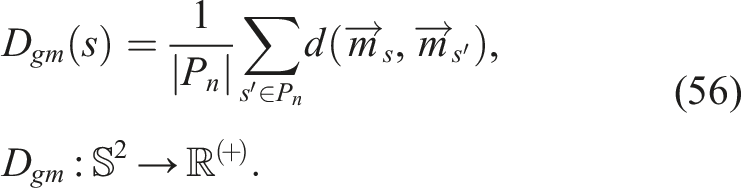
4.3.3. Genetic diversity of morphology
If we now do the same but instead we take the morphology neural network of a softbot s, we will have that
5. Results
In this section, the results of the experiments are presented in the form of convergence plots, box plots, and frequency diagrams along with their approximate densities through KDE for each of the indicators mentioned in Section 4. For the convergence plots and KDE, the bootstrapping resampling method was employed, which involves randomly sampling with replacement. In this case, 1000 samples were taken per generation from the 20 runs. The convergence plots display the average of the runs using solid colors, while the confidence interval (ci = ±95%) is represented by transparent bands. Additionally, other interesting results are presented, either from other indicators or other visualizations.
5.1. Task performance
5.1.1. Fitness
Figure 1(a) shows that NSLC exhibits a rather slow fitness growth, which is characteristic of QD algorithms with novelty defined in a misaligned BC, as mentioned in (Pugh et al., 2016). In contrast, MNSLC shows a clearly higher and more erratic growth, evident both visually in Figure 1(a) and through the large number of outliers in Figure 1(c). Furthermore, it seems that the supposedly aligned BC is indeed aligned, given the higher growth rate when compared to NSLC. ME, QN, and SO exhibit a similar convergence pattern in this indicator, with ME performing slightly better (as seen in Figure 1(a), the median in Figure 1(c), and the skewed density estimate in Figure 1(b), biased slightly to the right), followed by QN and SO. SO appears to have a slightly more stable behavior than QN, while QN seems to have a slightly faster growth rate than SO (based on Figures 1a and 1(b), with Figure 1(c) showing nearly identical medians for both). Looking ahead, it is expected that MNSLC will perform at least as well as NSLC in the indicators where a QD algorithm is expected to yield better results. Convergence, KDE, and Box plots for task performance indicators: (a)-(c) Fitness F, (d)-(f) Behavioral novelty N
a
, (g)-(i) Fitness Grid/Fitness QD
ff
, and (j)-(l) Aligned Novelty Grid/Aligned Novelty QD
anan
.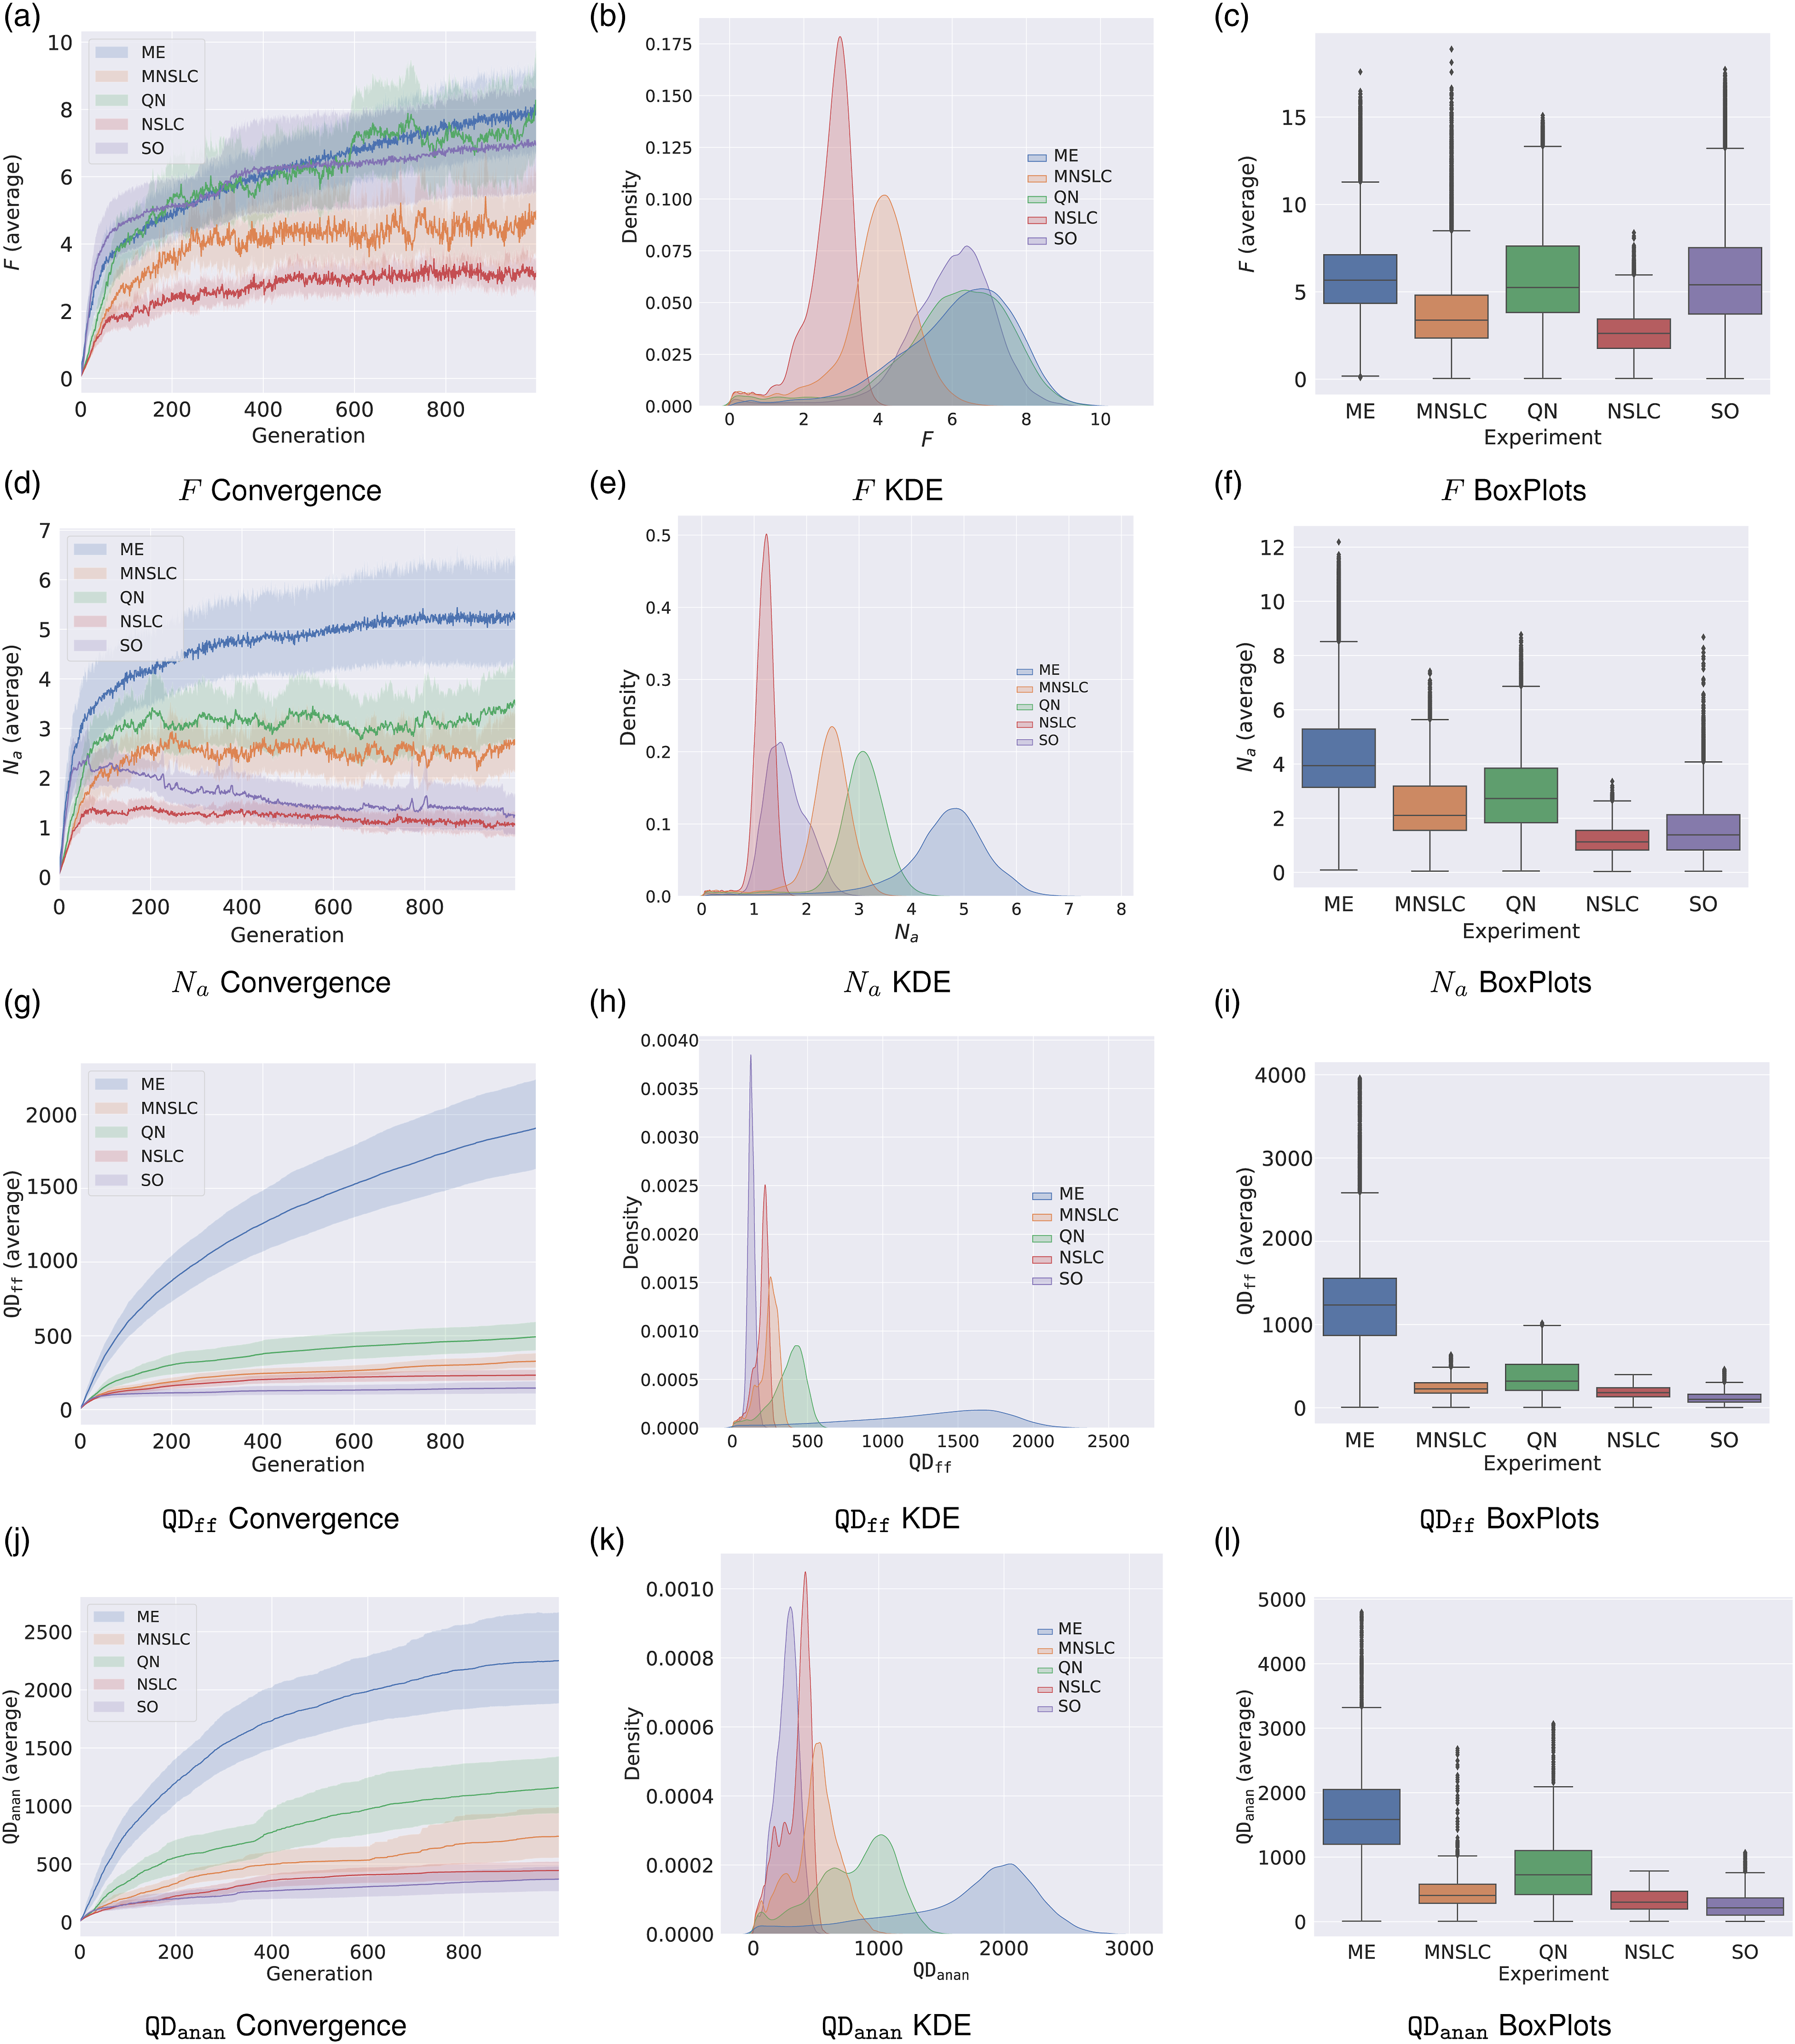
5.1.2. Behavioral novelty N a
Figure 1(d)-(f), provide insights into the performance of the different experiments for this indicator. It is noteworthy that ME and QN, which employ algorithms with a selection pressure aimed at global fitness, outperform MNSLC, which explicitly maximizes aligned novelty as one of its objectives. This observation partly confirms that the proposed aligned novelty concept is indeed aligned, but there could also be a partial causal relationship with morphological diversity. If aligned novelty was solely related to fitness, then SO would exhibit similar behavior to ME and QN, which is not the case. SO is similar to that of NSLC. Therefore, it seems that there is a component of aligned novelty that is related to fitness and another component that could be related to morphological novelty. When seeking morphological novelty, changes in morphology over optimized controllers are equivalent to changes in the environment (Lipson et al., 2016), leading to erratic behaviors. These changes could result in trajectories of the softbots that exhibit higher aligned novelty but have lower fitness.
5.1.3.
indicator
For this indicator, it is expected that ME will have the best results by a significant margin, which is confirmed in Figure 1(g)-(i). The reason for this is because this indicator measures the total quality achieved in a grid over the misaligned BC, the MAP-Elites algorithm is using the same grid, with a selection pressure oriented toward quality, that is, seeking to maximize precisely this
5.1.4.
indicator
For this indicator, some points similar to those observed in N
a
and
5.2. Phenotypic diversity
5.2.1. Morphological diversity
The impact of the loss of morphological diversity becomes evident when comparing algorithms where explicit diversity preservation is absent (SO) with those where such strategies are present (QN, ME, MNSLC, NSLC), as shown in Figure 2(a). The differences between these situations are clear and contrasting based on this indicator. The information presented in Figure 2(a) reveals the following: • The SO algorithm exhibits a decreasing trend that reaches a stable state at much lower values. • In ME, a decreasing trend can be observed in the first few generations, which could be attributed to the fact that much of the morphological search space has not yet been explored in these early stages of optimization. However, this behavior ceases after a few generations, and a slow increase in morphological diversity can be observed, stabilizing at a value of approximately 35. • A very rapid growth pattern can be observed in all algorithms that use NSGA-II and explicitly target N
u
• In QN, a higher variance can be distinguished, as well as a decreasing pattern immediately after the initial period of rapid growth. This behavior is more pronounced than in NSLC and MNSLC, almost reaching the same value at which ME stabilizes. • For the QD algorithms with a local selection pressure (NSLC and MNSLC), a slightly decreasing trend can be observed, which stops almost immediately and quickly stabilizes within a range of values. Convergence, KDE, and Box plots for phenotypic diversity indicators: (a)-(c) Morphological diversity D
m
, (d)-(f) Unaligned novelty N
u
, (g)-(i) Fitness Grid/Unaligned Novelty
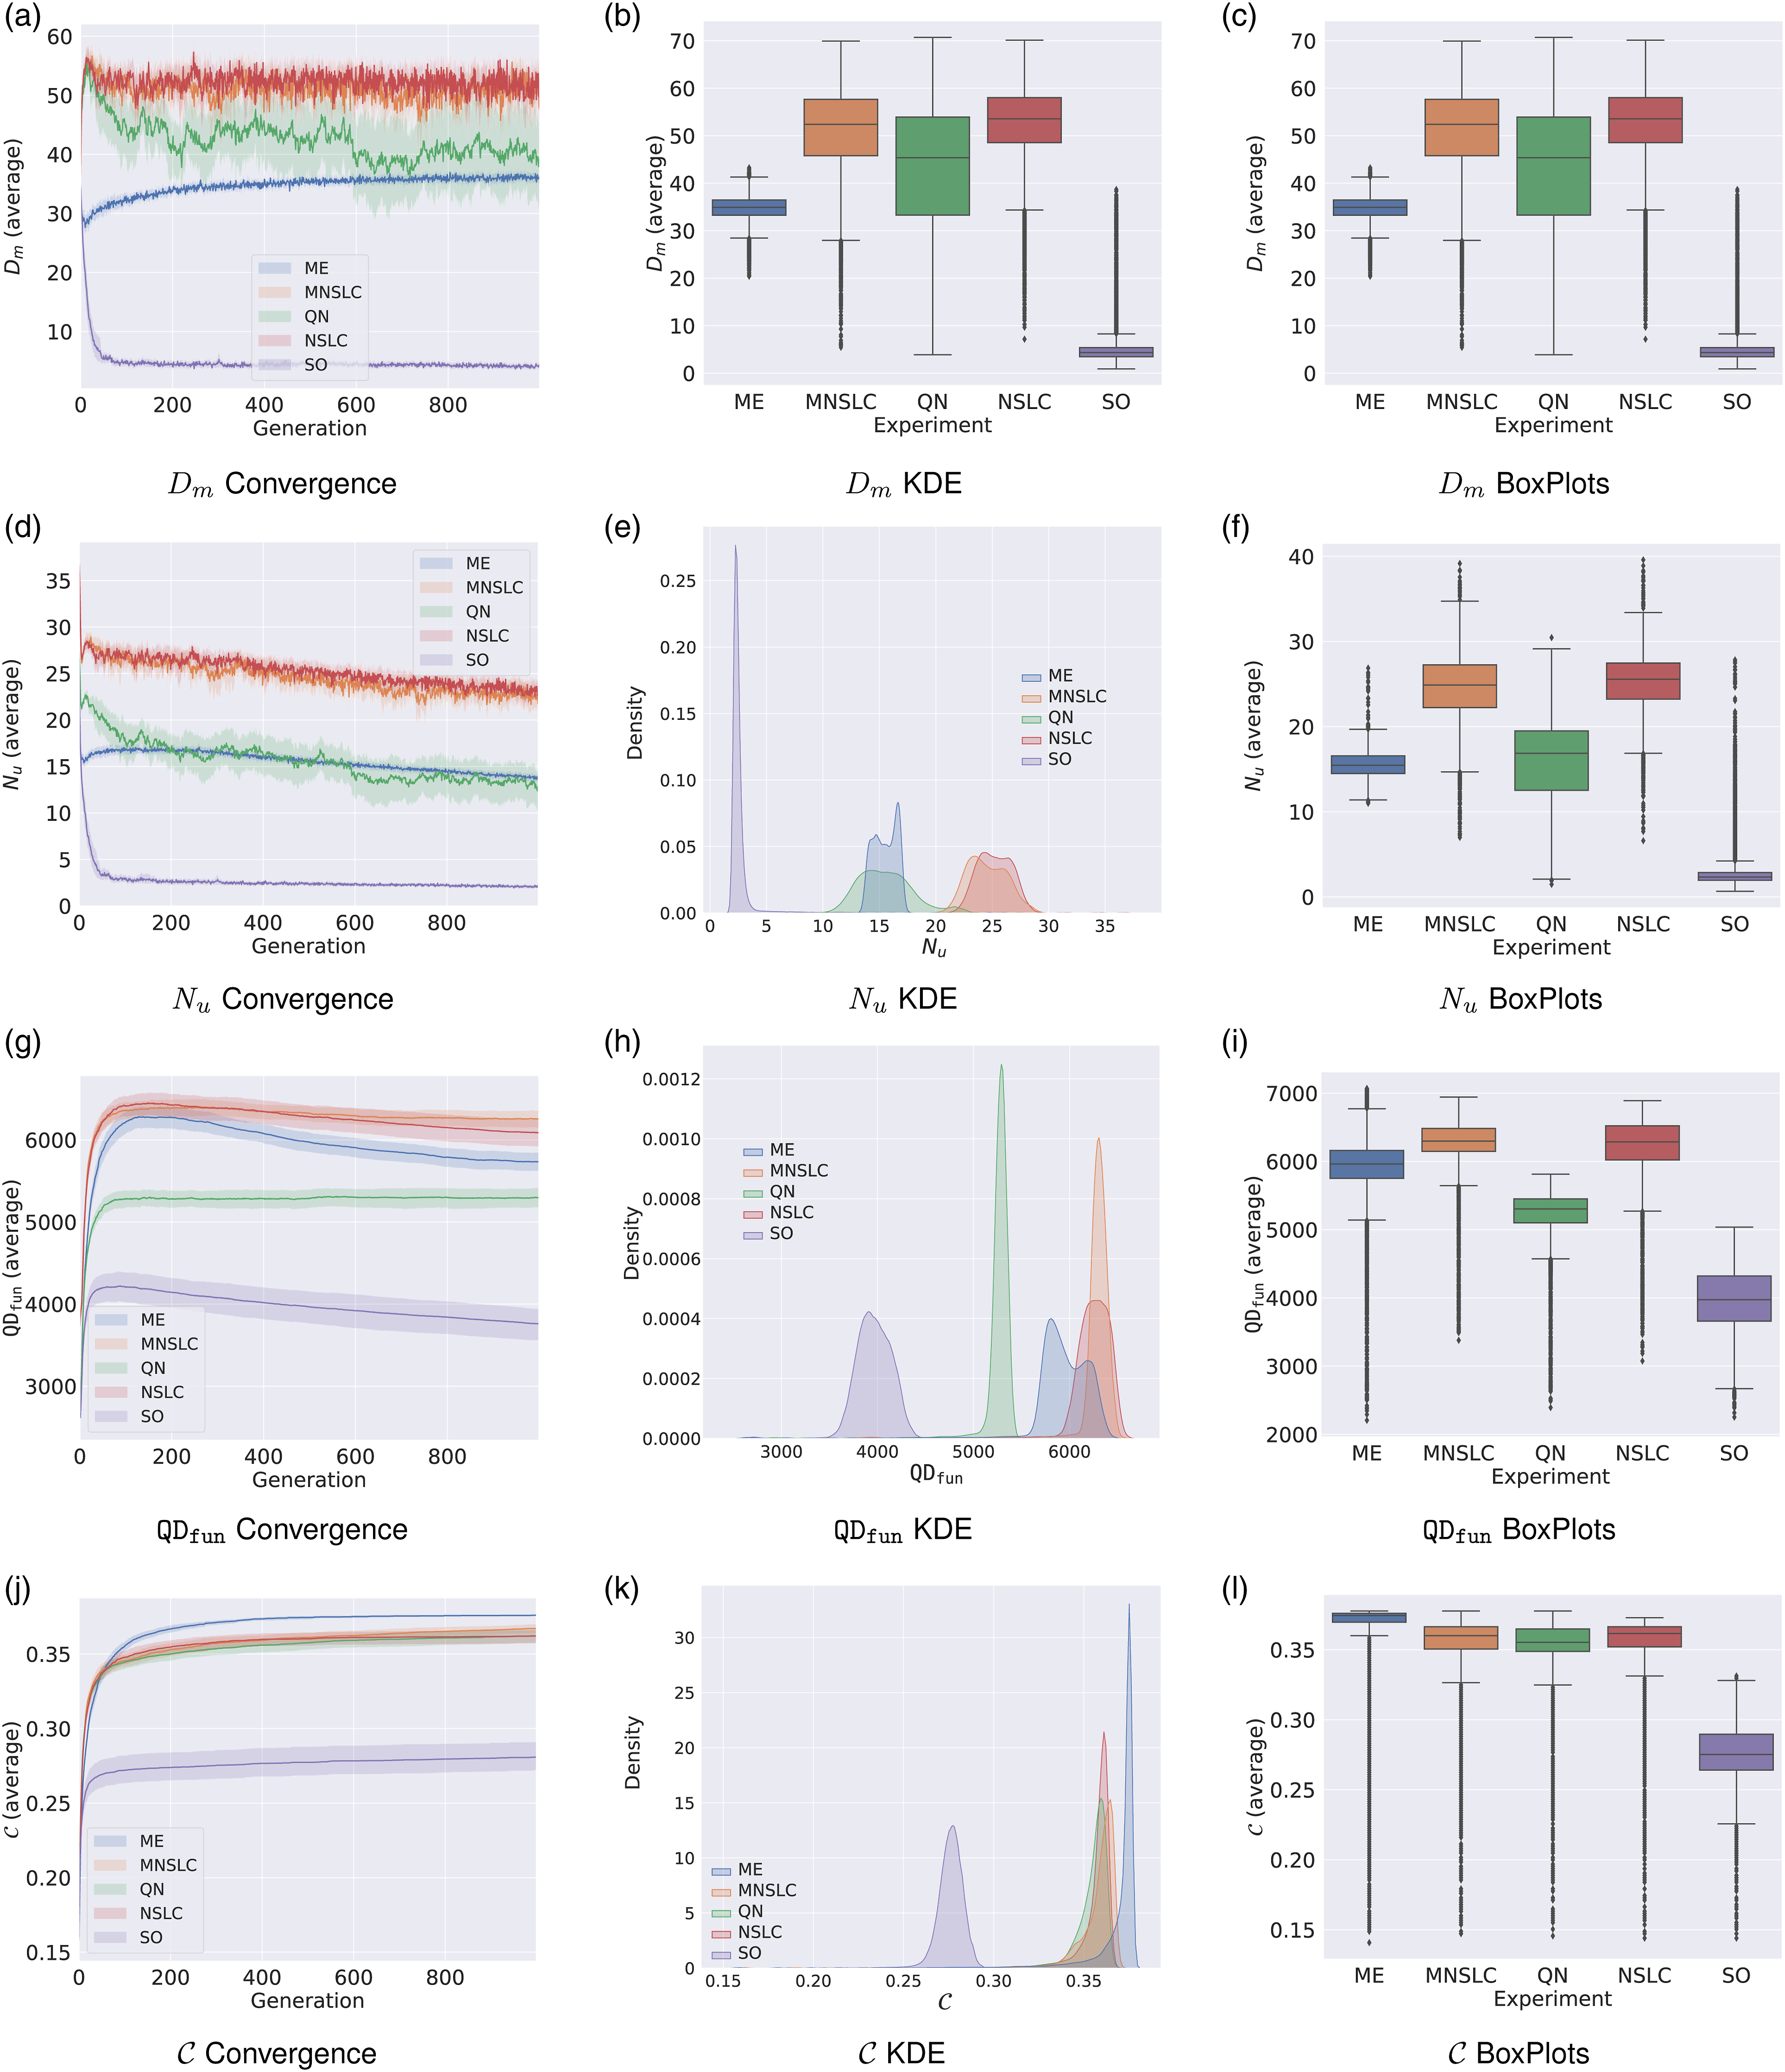
In broad terms, the algorithms that exhibit the lowest loss of morphological diversity are the “purely” QD ones (NSLC and MNSLC), followed by QN, which integrates global quality rather than local quality and aligned novelty (or morphology) into a multi-objective framework. Next is ME, which does not include any objective for aligned novelty or explicit selection pressure toward it, but rather finds morphological diversity through a grid defined in the aligned behavior space and by maximizing
5.2.2. Unaligned novelty N u
Regarding N u , a similar trend to that observed in D m is observed. As shown in Figure 2(d), MNSLC and NSLC exhibit the highest unaligned novelty, with a sharp decrease in the first generations followed by a stabilization in a rather slow, and approximately linear decrease. It is interesting to note that ME and QN converge to similar values, with ME staying slightly higher at the end of the evolutionary runs, especially considering that QN explicitly pursues the N u objective, demonstrating the effect of using a global quality measure in contrast to its local version. As shown in Figure 2(e), and 2(f), QN also exhibits higher variance, possibly due to the conflicting objectives of global quality and unaligned novelty. In Figure 2(d), ME exhibits a more pronounced loss of novelty than the three previously mentioned experiments, once again highlighting the selection pressure toward global quality, in contrast to its “pure” QD counterparts, but then exhibits the same slow growth that resembles a logarithmic curve, followed by a more or less linear decrease. In Figure 2(f), it can be seen that ME exhibits a slightly lower median novelty than QN, while also exhibiting a lower variance, and therefore less noisy behavior. Finally, SO exhibits similar behavior to what was observed in D m , as shown in Figure 2(f), once again exhibiting outliers with rather high values, likely due to mutations that led individuals to be eliminated by the purely exploitative selection operator, or because in the early generations, there are more novel individuals.
5.2.3.
indicator
Similarly to the other QD indicators examined previously, as can be seen in Figure 2(g), there is a growth pattern similar to a logarithmic function. However, it appears that as the rate at which new areas of the BC space are discovered decreases, the morphological novelty of the elites in the grid also begins to decline. On the other hand, the similarity of the behavior of ME to NSLC and MNSLC can be explained by the fact that the QD indicators are computed relative to the grid, and ME evolves a grid and not a population. By maintaining solutions distributed in the morphological BC, it is also implicitly seeking diversity and therefore novelty, ultimately placing its behavior closer to “pure” QD algorithms than to QN. Also, by examining the behavior of SO in this indicator, it can be observed that even in an experiment without any type of diversity protection, by using a grid to store the solutions found, some novelty is found, resulting in a behavior relative to the other experiments that is visibly better for SO than the one observed in the population-based novelty N u .
5.2.4. Coverage
As can be seen in Figure 2(j)-(l), even when using a selection probability proportional to the global quality, ME exhibits higher coverage than MNSLC, NSLC, and QN. In other words, a stochastic selection of bins in a grid, even when biased in an exploitative manner, finds more regions of the feature space than a search for novelty. This would likely be even more noticeable if the selection was uniform, that is, if pure MAP-Elites had been used.
5.3. Genetic diversity indicators
5.3.1. Genetic diversity D g
When observing the behavior of this indicator in Figure 3(a)-(c) and comparing it with other diversity indicators, there seems to be a certain relationship between genetic diversity as defined in this article, and phenotype diversity. Regarding this indicator, each experiment presents a characteristic and easily distinguishable behavior at first glance. As shown in Figure 3(a), no experiment exhibits sudden growth at the beginning of the evolutionary runs, that is, in all experiments, there is some degree of loss of genetic diversity, a phenomenon that is prevalent in the literature. With regard to Figure 3(a), it can also be observed that: • Starting with SO, a rapid loss of genetic diversity is observed, closely aligned with all the previously mentioned population-level phenotypic diversity indicators (N
u
and D
m
). • QN exhibits the second-largest loss of genetic diversity, while ME exhibits the third-largest. This is likely due to the use of a grid in the morphological feature space, which is closely related to the behavior found in population-level phenotypic diversity indicators. Once again, it appears that the introduction of selection pressure proportional to global quality separates ME from the other QD algorithms. • In the case of NSLC and MNSLC, a slightly different behavior is observed, with one significantly outperforming the other. In this case, MNSLC outperforms NSLC, which can perhaps be explained by the fact that aligned novelty search leads to greater diversity in the controllers. Additionally, a slightly increasing behavior can be observed after the initial loss of diversity. Convergence, KDE, and Box plots for genetic diversity indicators: (a)-(c) Genetic diversity D
g
, (d)-(f) Genetic diversity of control D
gc
, and (g)-(i) Genetic diversity of morphology D
gm
.
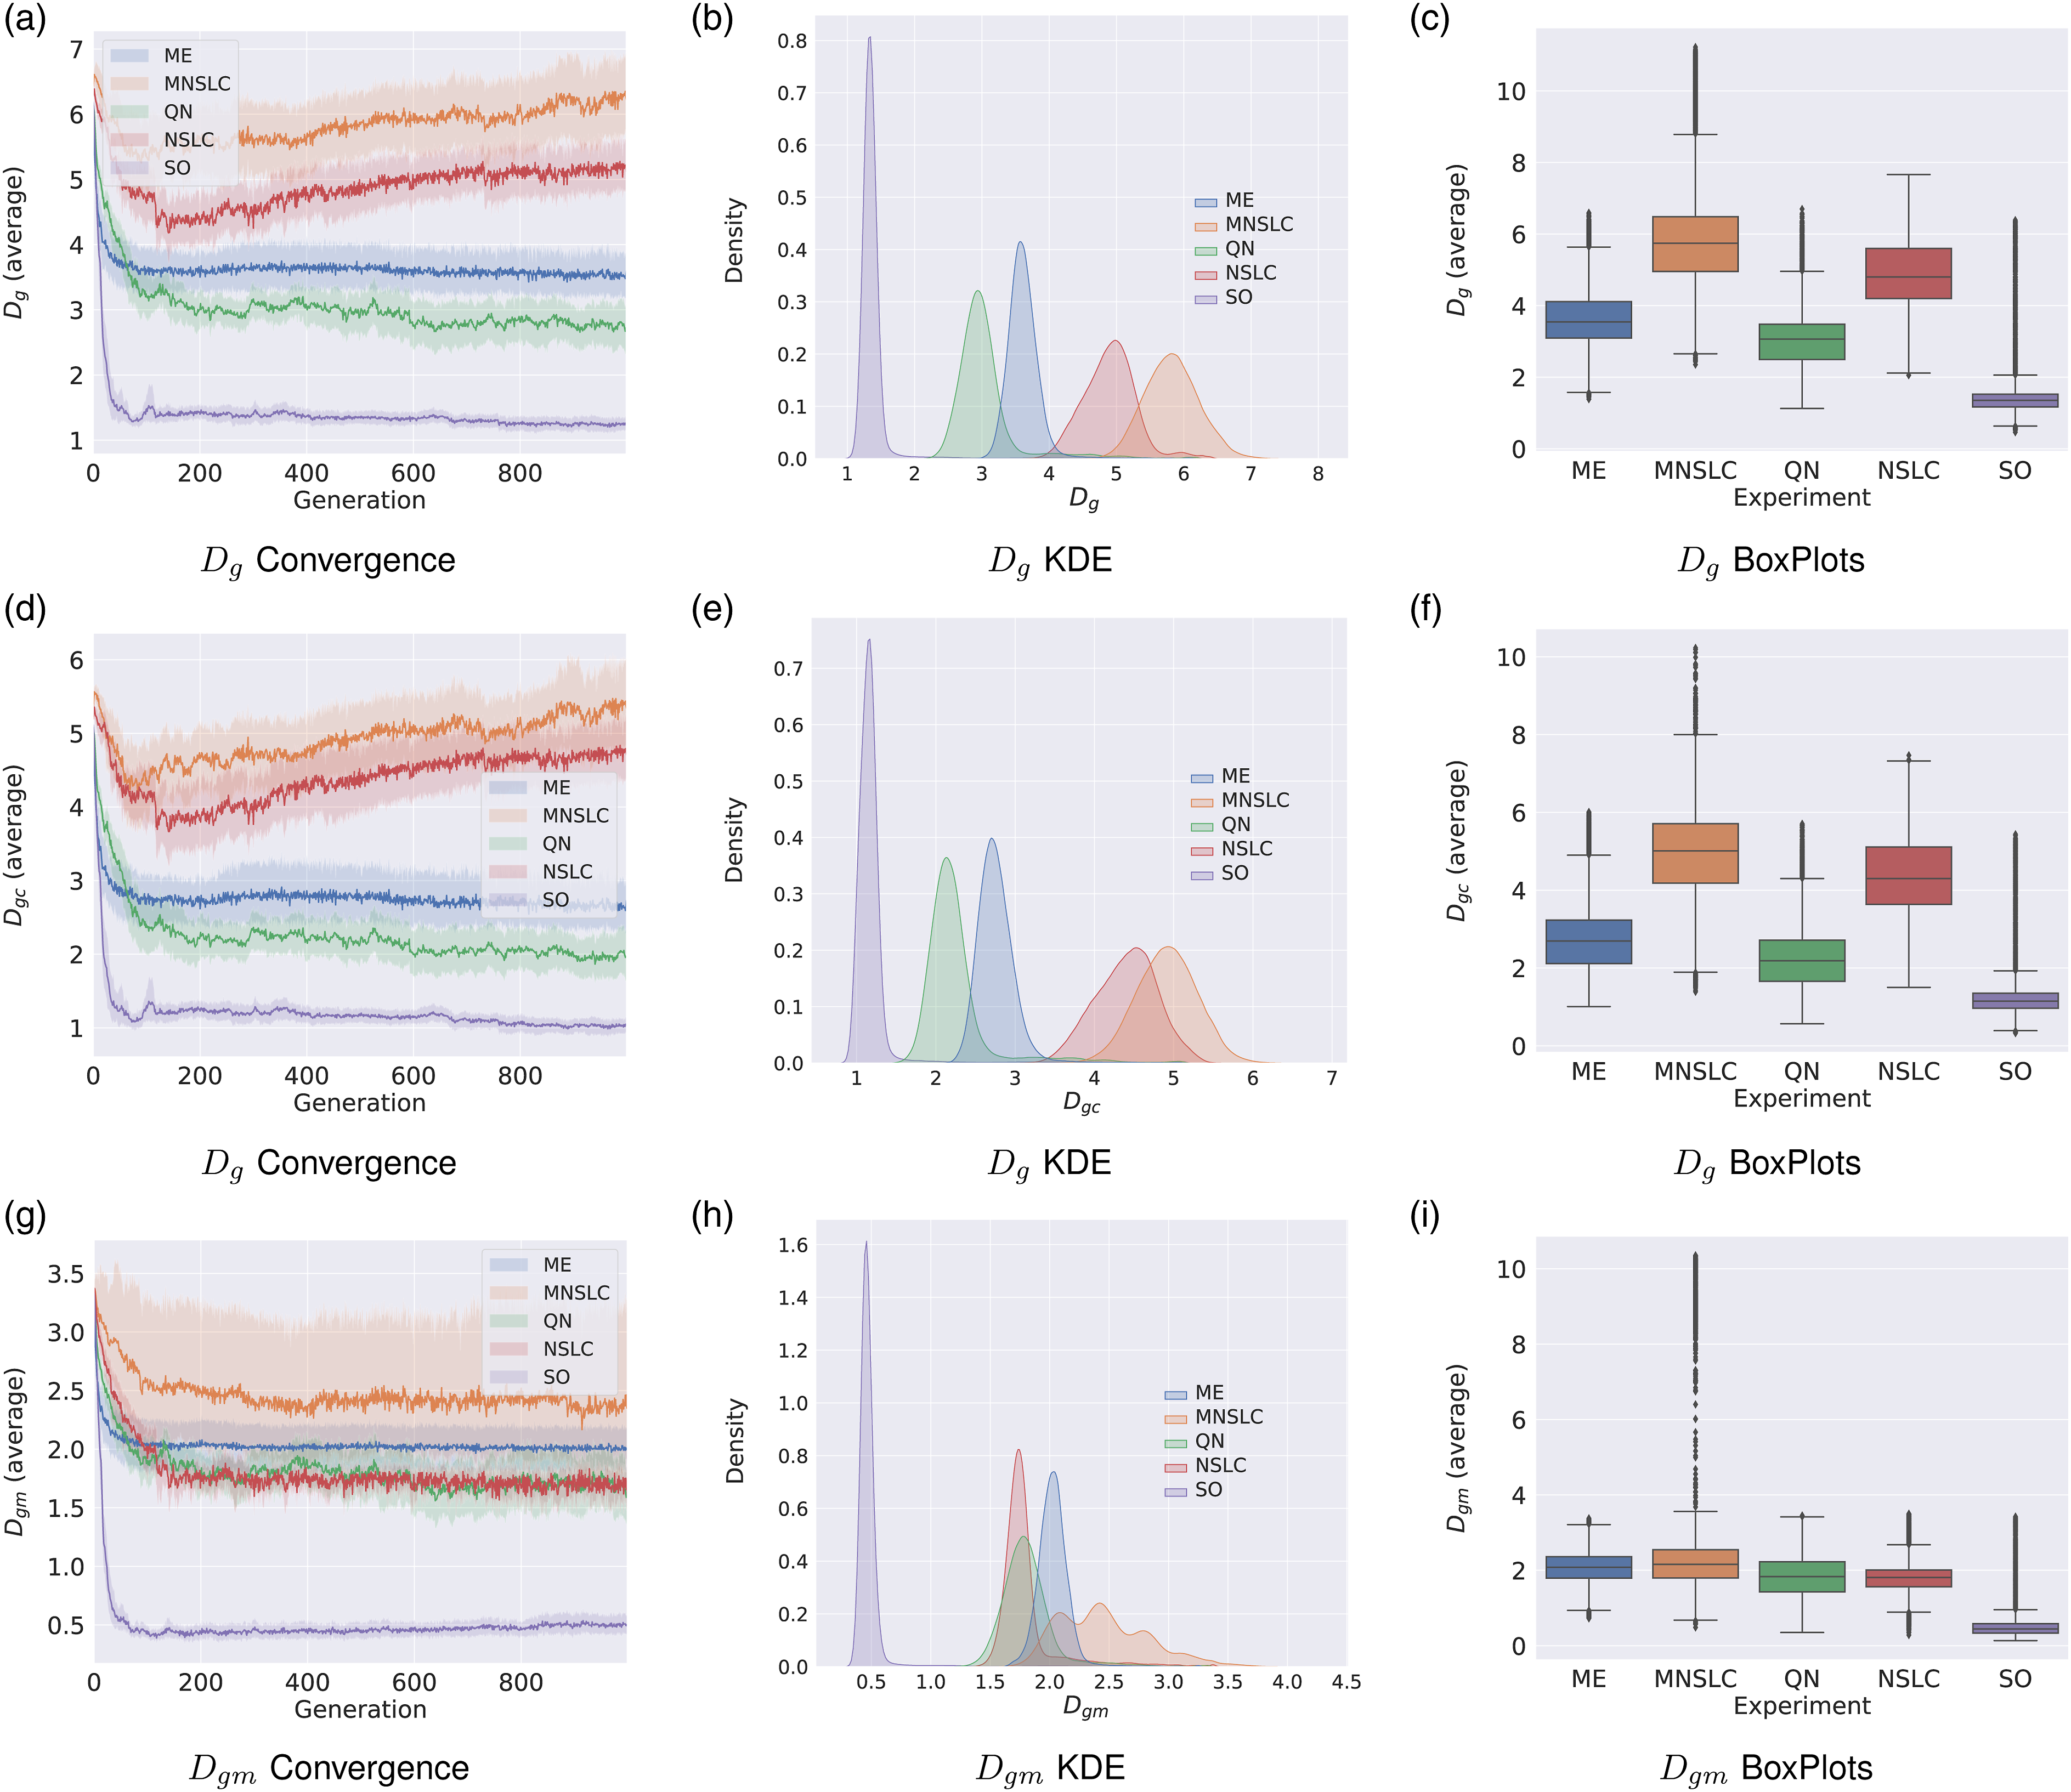
It is noteworthy that the two experiments that exhibit local competition (or quality) are also the ones that exhibit the highest genetic diversity. It also seems that QD algorithms (ME, NSLC, and MNSLC) are the ones that exhibit the highest genetic diversity. Furthermore, it appears that NSLC and MNSLC, which represent more purely the characteristics of QD algorithms, such as division into niches (unstructured in this case) in the feature space and the notion of local quality, are the ones that exhibit the highest genetic diversity. On the other hand, ME, by favoring a selection pressure proportional to global quality instead of a uniform selection, loses genetic diversity, as was the case with N u and D m .
5.3.2. Genetic diversity of control D gc
As shown in Figure 3(d)-(f), this indicator follows the same ranking as D g . In this case, it can be observed that aligned novelty may be caused (at least partially) by greater diversity in behavior, and in turn, by greater diversity in controllers. Furthermore, the two experiments that exhibit local competition also exhibit greater diversity in controllers, as can be contrasted with the behavior of QN in Figure 3(d), which also targets morphological novelty as a secondary objective. This could suggest that maximizing the score of local competition increases the genetic diversity of controllers. Taking this further, in the case of ME, it could be argued that QD algorithms exhibit greater genetic diversity of controllers, but once again, introducing the global quality proportional selection pressure erodes genetic diversity.
5.3.3. Genetic diversity of morphology D gm
In Figure 3(g), it can be observed that SO shows a much faster-decreasing behavior than its counterparts with diversity protection. Interestingly, in that same figure, the behaviors of NSLC and QN are so similar. It seems that morphological genetic diversity ignores local competition, unlike D gc . On the other hand, MNSLC, whose only difference with NSLC is the introduction of a third objective corresponding to aligned novelty, has the highest D gm , which could be due to the fact that aligned novelty is partly caused by changes in morphologies associated with changes in trajectories.
5.4. Results of other indicators and visualizations
In this section, we present other indicators and visualizations in addition to those presented previously. Although they are not relevant for the selection of the winning algorithm, they do represent interesting results.
5.4.1. Complexity of the neural networks
Three basic but representative indicators of the complexity of the control and morphology neural networks are displayed for each experiment. These indicators include the number of nodes (Figures 4(a) and 4(b)), edges (Figures 4(c) and 4(d)), and total weight sum (Figures 4(e) and 4(f)). Complexity of CPPNs.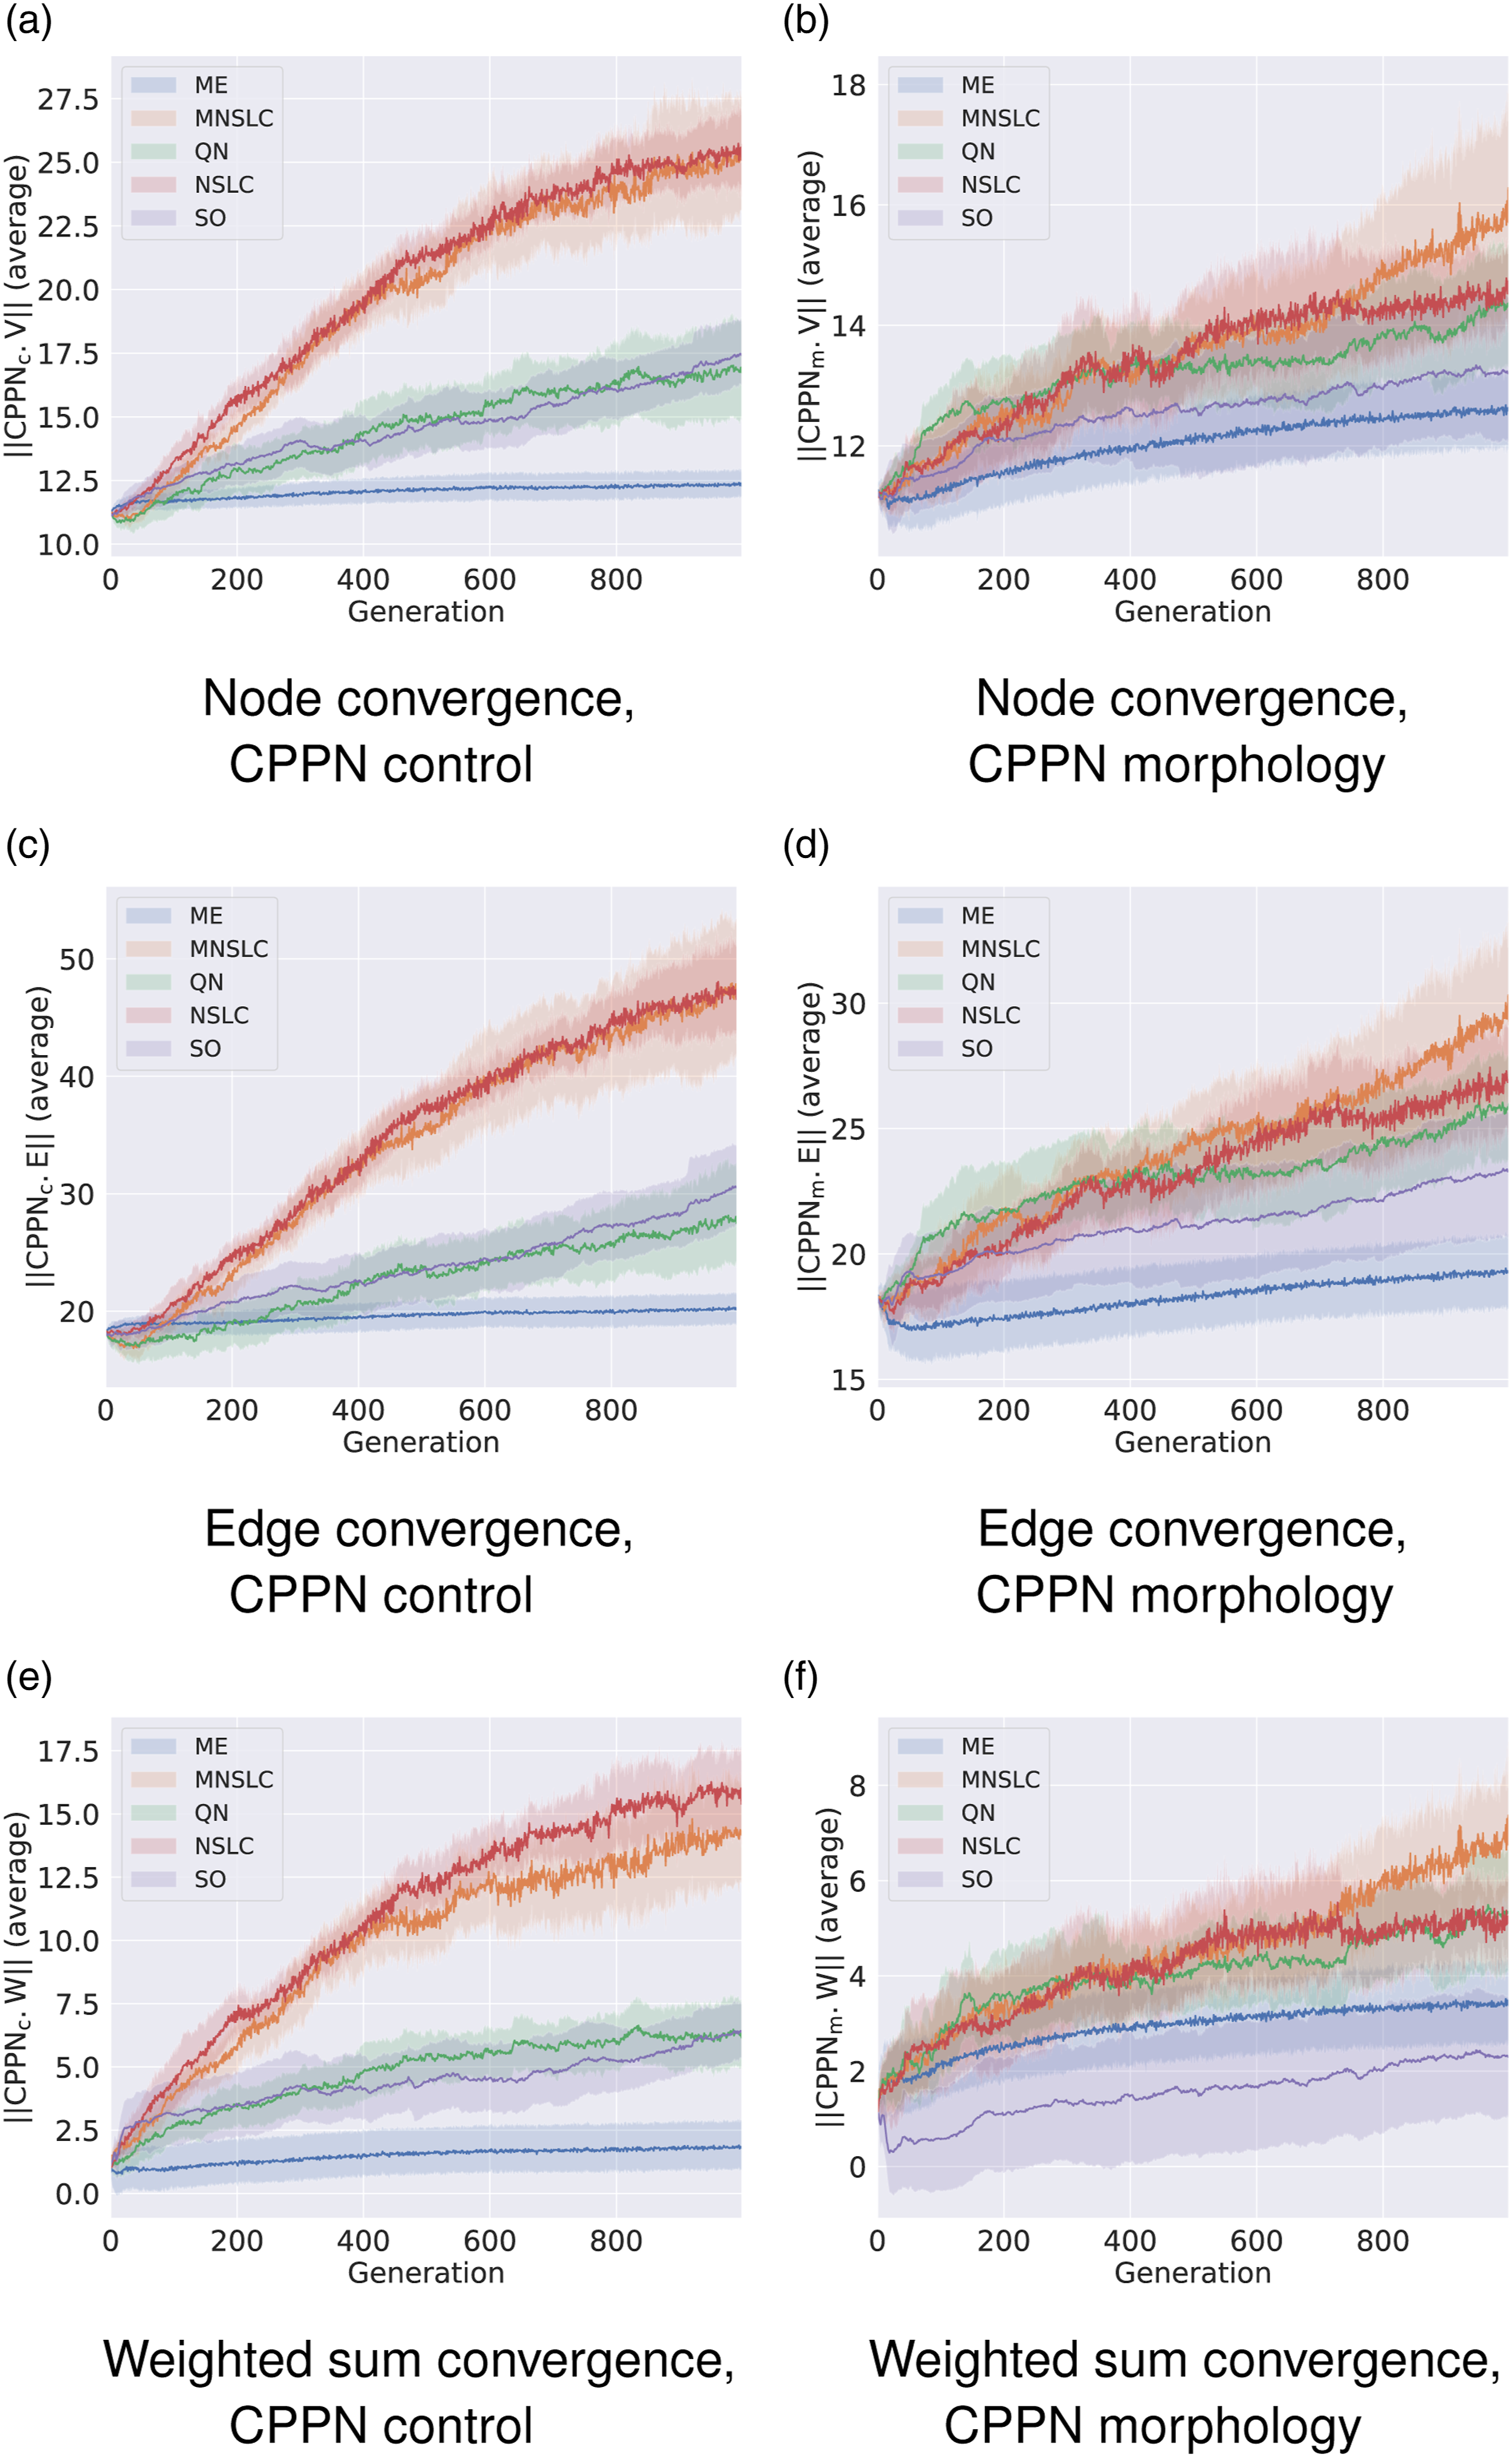
It is interesting to note that the experiment that maintained the lowest complexity in both morphology and control neural networks was ME, while MNSLC and NSLC consistently obtained the largest neural networks and total weight sum. It could be desirable to find diverse and high-quality solutions with the least complex genotypes possible, something that seems to be achieved by ME.
5.4.2. The behavior space
Figure 5 shows the contour curves of the joint distribution of the softbots’ positions at the end of the simulations, on the XY plane. This is a way to visually examine the effects of aligned novelty and fitness. For example, in the case of SO, it becomes evident why aligned novelty is so low, but fitness is high, due to the exploitative nature of the experiment, which leads it to only find a very small family of trajectories. Joint behavior space KDE.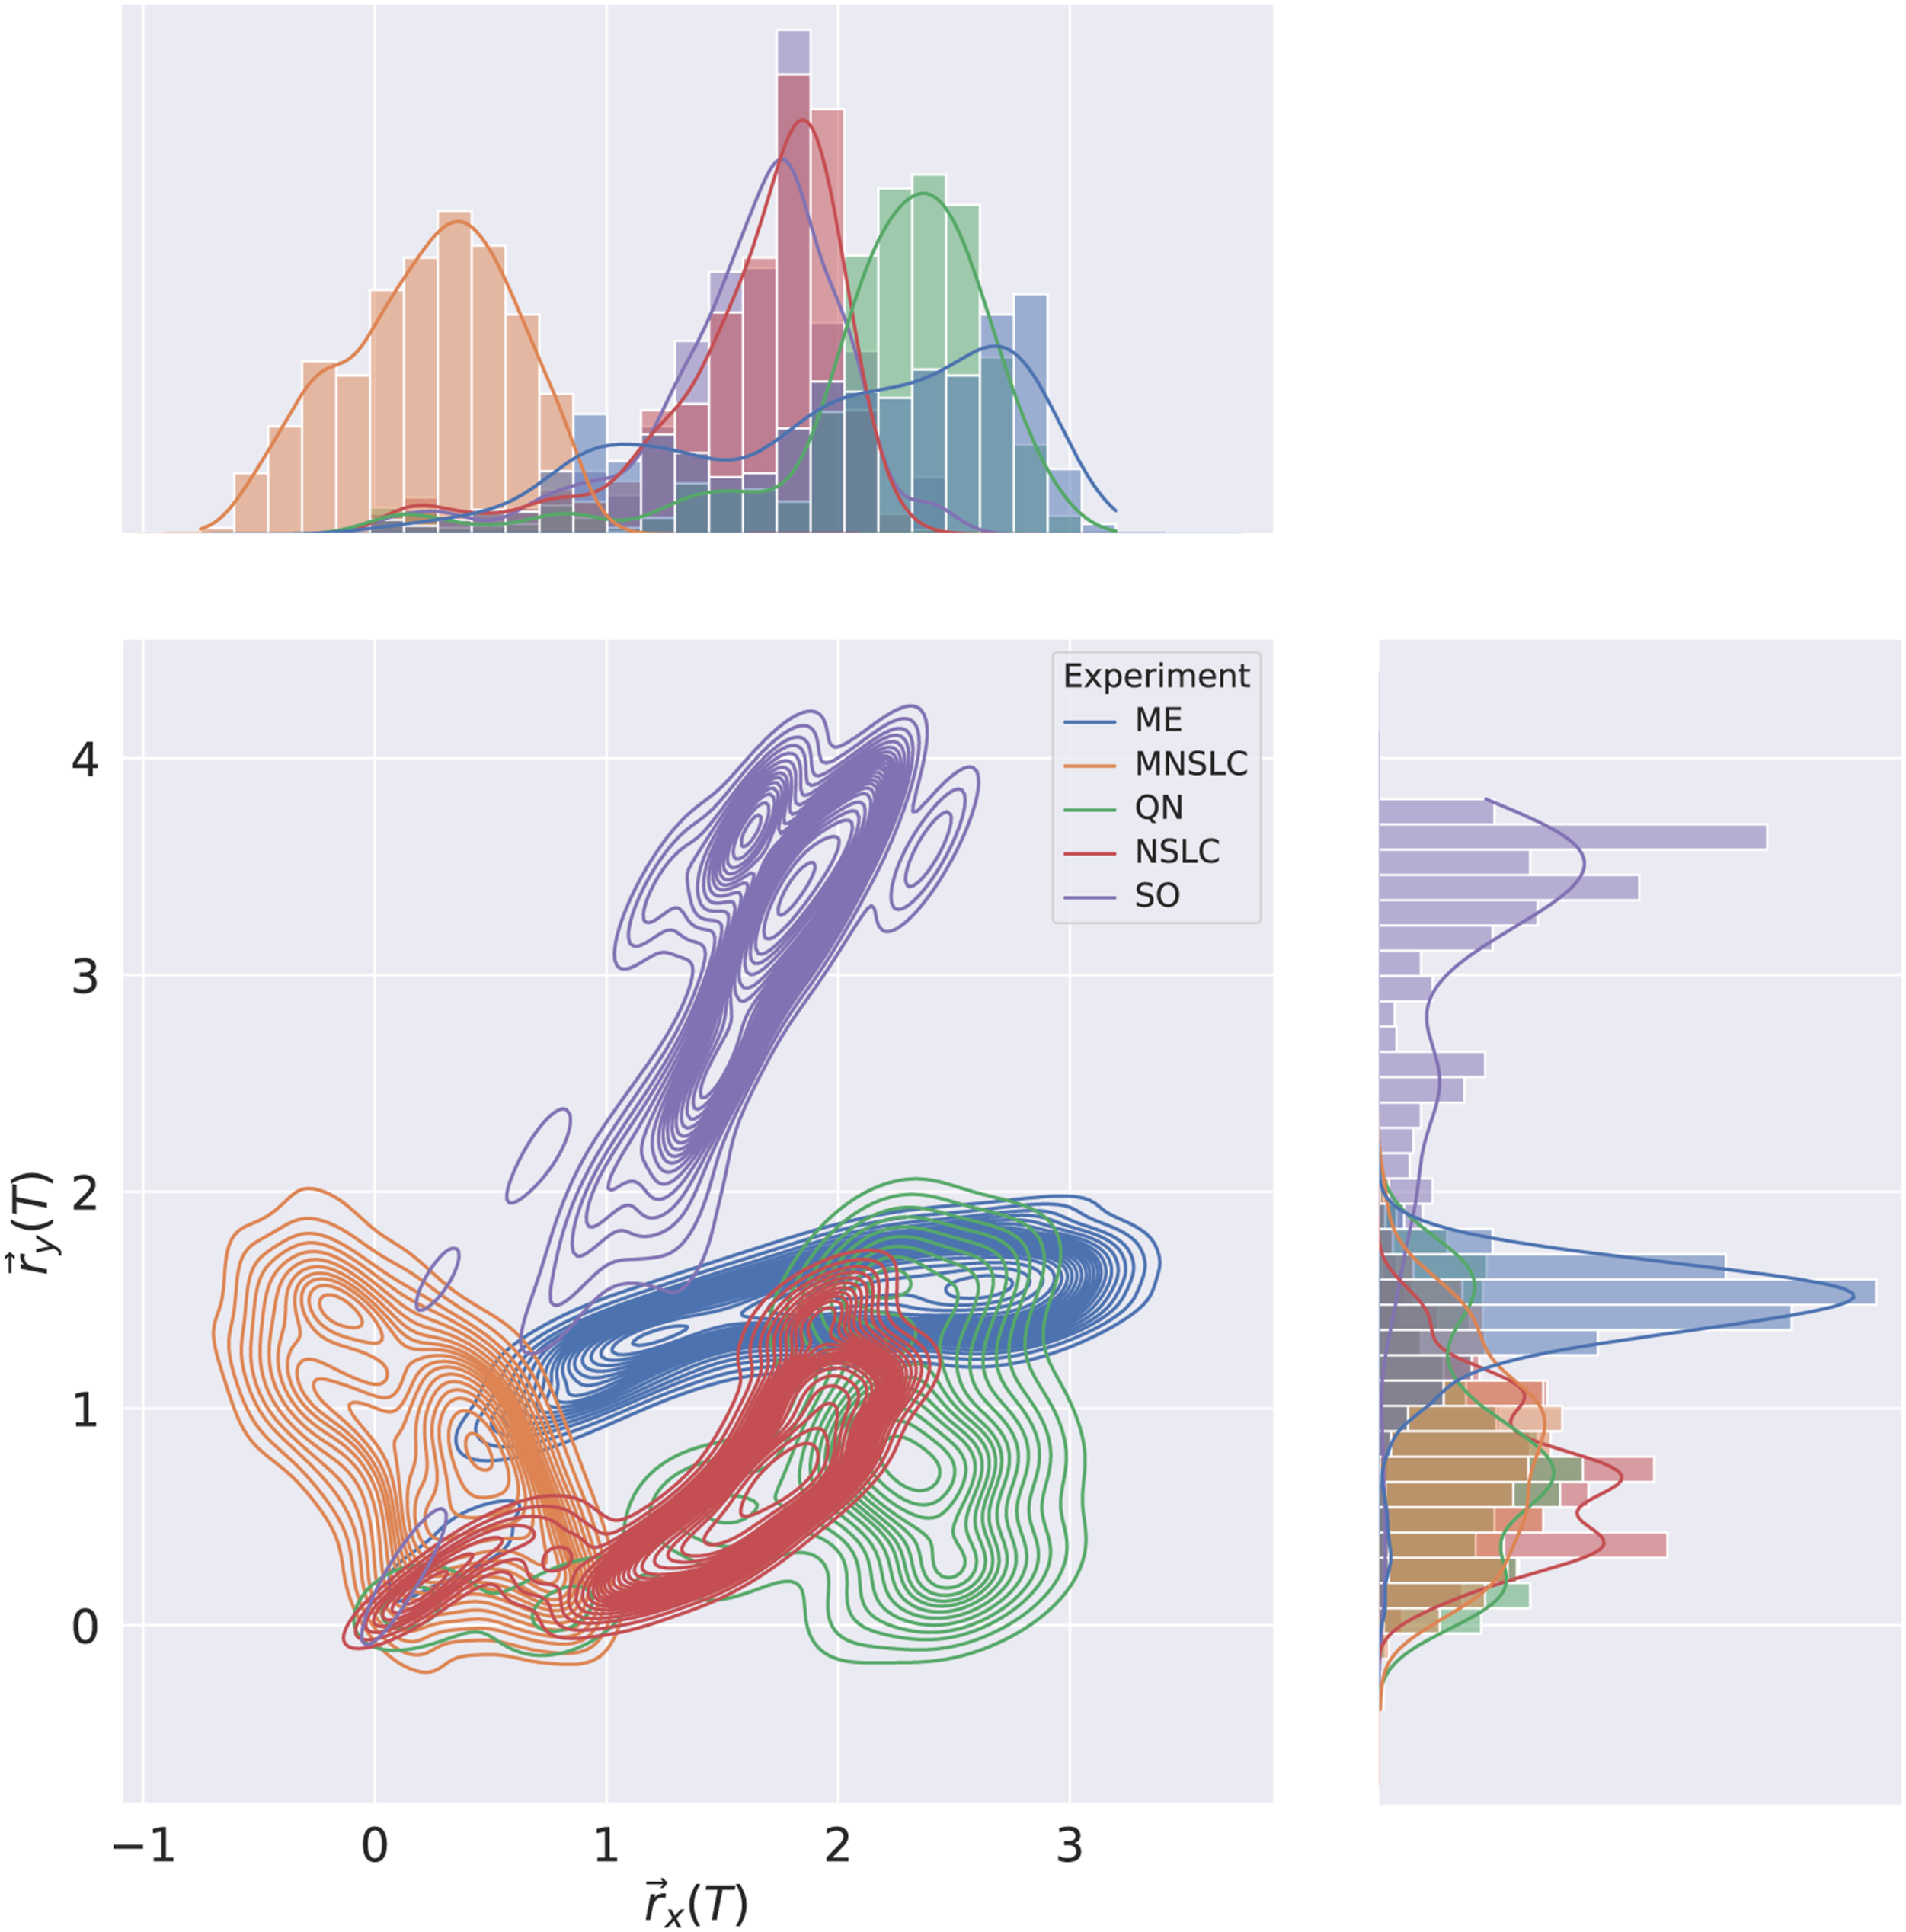
The case of ME makes evident the high result in both fitness and aligned novelty, given that it found high-quality solutions along different trajectories. QN presents a similar behavior to ME.
MNSLC presents a range of trajectories close to the origin, which highlights lower fitness than SO, ME, and QN, and lower aligned novelty than ME and QN.
NSLC presents a similar story to MNSLC, in terms of solutions closer to the origin, and also makes it clear that it has lower aligned novelty than MNSLC, as it has a smaller range of trajectories.
6. Discussion
In this section, firstly we present a methodology based on voting theory in order to choose the best algorithm in the fairest possible way, taking into account multiple indicators and multiple algorithms. Subsequently, we discuss the findings related to the application of this methodology to the results presented in Section 5. This methodology will be presented in its most general form, which takes into account several indicators, algorithms, and benchmark problems Bartz-Beielstein et al. (2020), but will be applied, for a single benchmark problem, multiple algorithms, and multiple indicators. By applying such methodology, to the main experiments and indicators, our ambition is to obtain in an exhaustive and multifactorial fashion, which algorithm presents the most desirable behavior for dealing with the challenge of premature convergence of morphology with respect to control, while compromising as little as possible other desirable aspects, especially of exploitative nature, leading to ultimately find solutions that are not only diverse morphologically but also functional.
For completeness, it is worth explaining that, based on the methodology for the analysis of optimization algorithms benchmarking, presented in Bartz-Beielstein et al. (2020), what was done in Section 5 corresponds to the first step, that is, exploratory data analysis. This section corresponds to confirmatory analysis, which consists of comparing each pair of algorithms relative to each pair of benchmark problems and indicators
6.1. Hypothesis test
Since the data does not meet the assumptions for parametric statistics, namely, normality, we used the non-parametric Wilcoxon Rank-Sum test for conducting pairwise comparisons. Additionally, considering the high computational cost of the experiments, we avoided conducting the full set of experiments for each hypothesis (5 ⋅ 4 ⋅ 11 = 220), and instead, we only executed twenty trials per experiment. Therefore, the Wilcoxon Rank-Sum test was performed with Bonferroni correction. We choose α = .05/220 = .000227 as the minimum p − value threshold to reject the null hypothesis.
6.2. Expressing the preferences
With a method in place to compare algorithms, we can arrange them in order based on this comparison. In the simplest case, we have 2 algorithms, 1 problem, and 1 indicator. • Perform multiple independent runs • Apply the chosen statistical test, with 3 possible outcomes


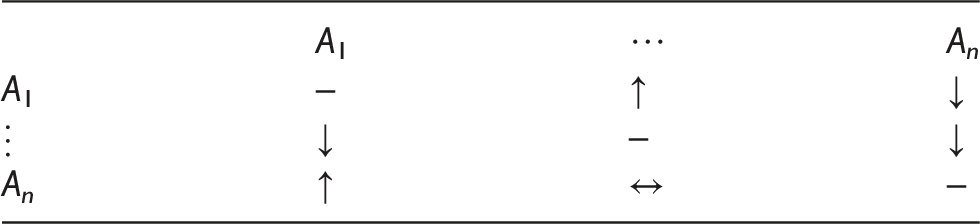
The matrix can be read row-wise, from left to right as: • A
i
≺ A
j
= A
i
↑ A
j
. • A
j
≺ A
i
= A
i
↓ A
j
. • A
i
∼ A
j
= A
i
↔ A
j
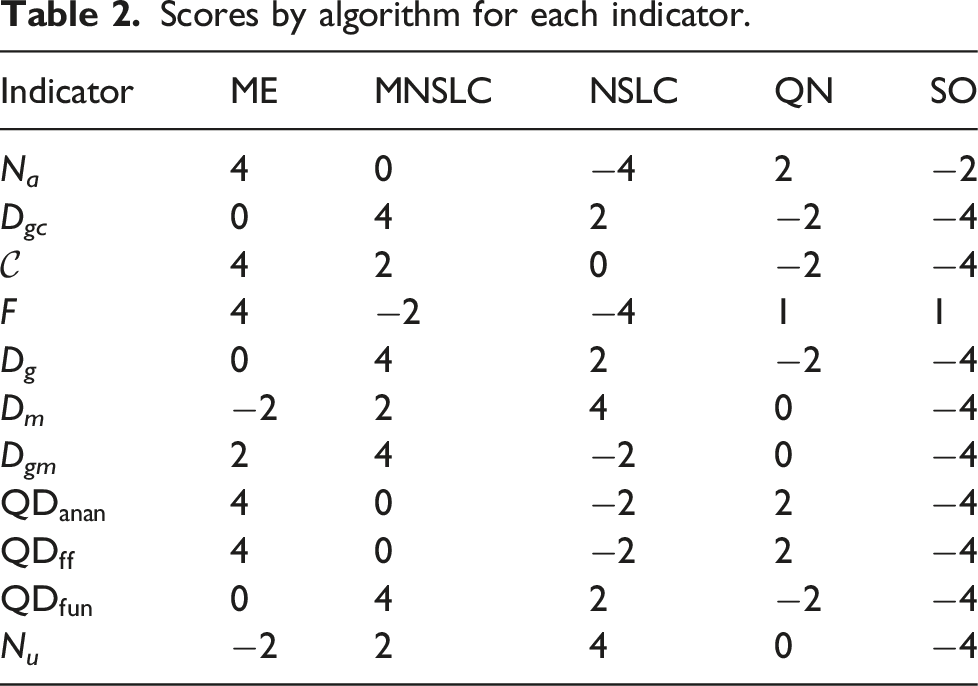
The table can be summarized into a count: • +1 for the preferred algorithm. • −1 for the algorithm that loses. • 0 for indifference.
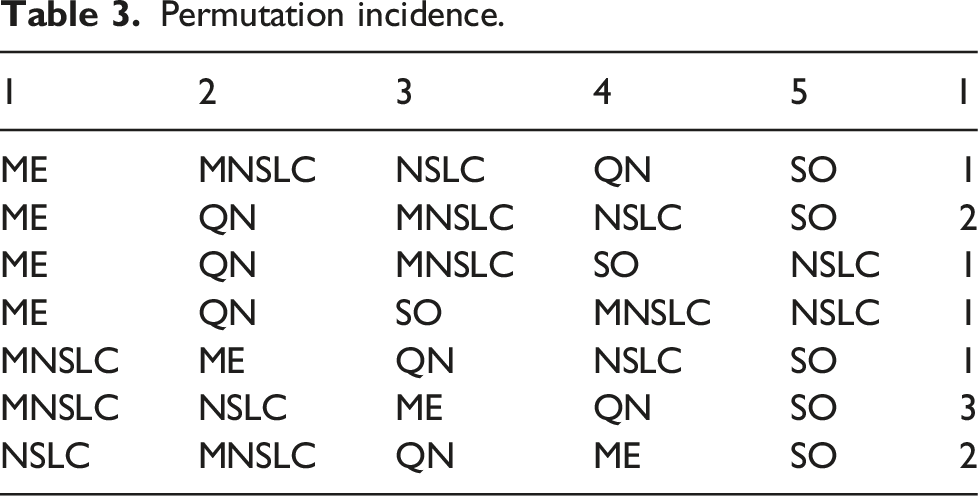
Using this counting method, we can order them from highest to lowest, and such ordering would express the preference for (P1, I1). If we wanted to generalize for
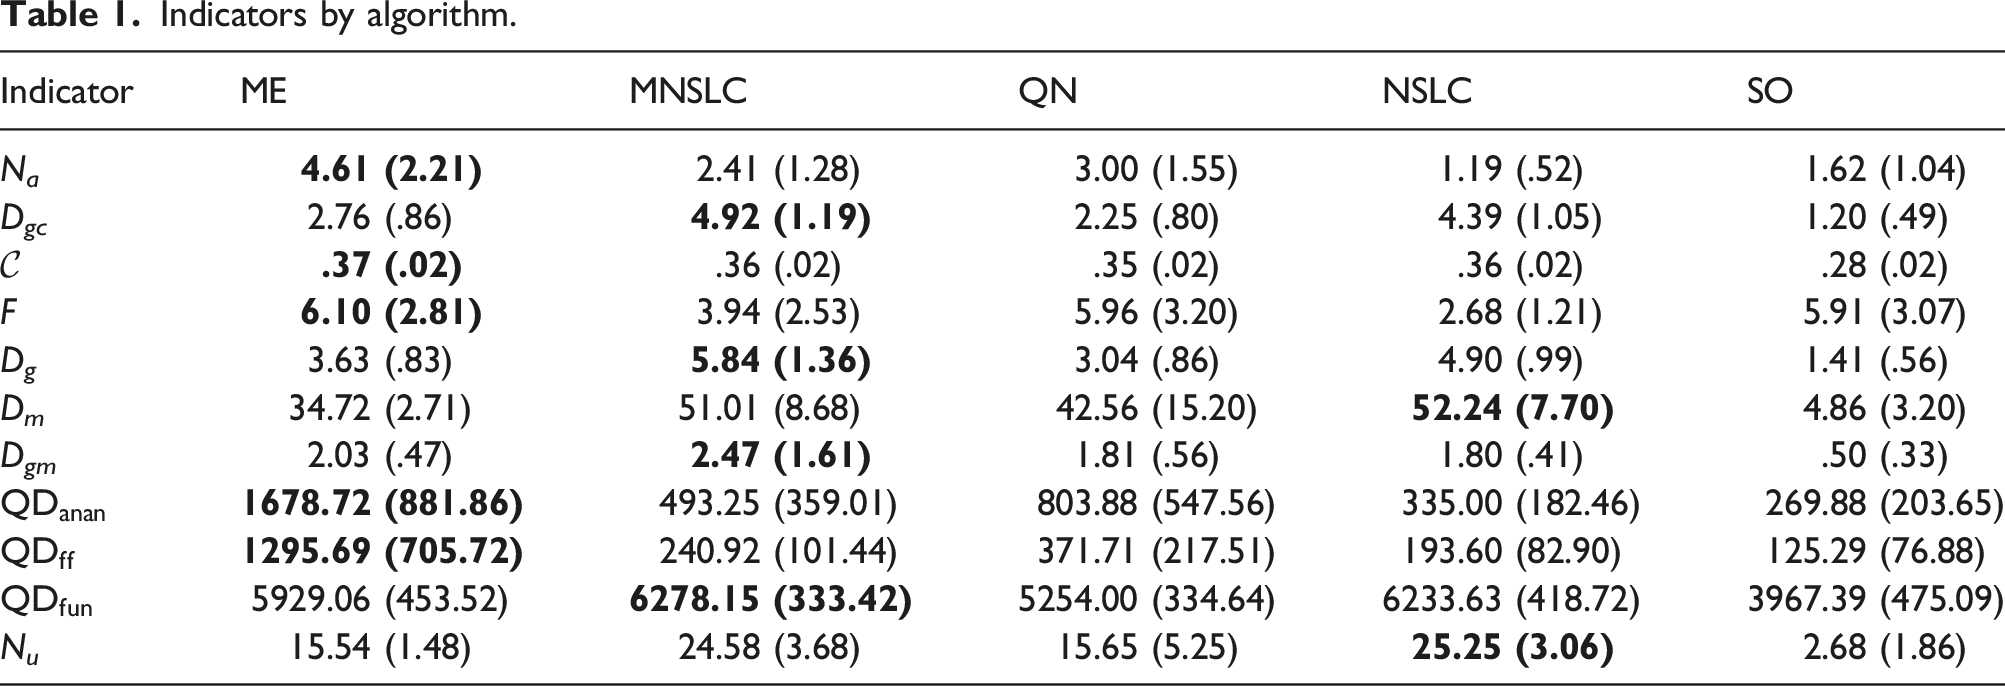
Indicators by algorithm.
Scores by algorithm for each indicator.
Permutation incidence.
6.3. Choosing the winner
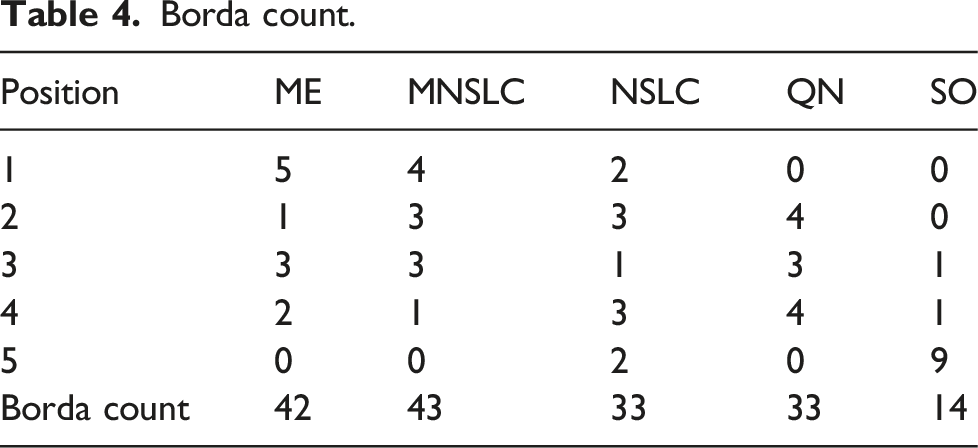
To choose the winner, we applied the Borda count method, which is obtained as follows for each algorithm


Borda count.
Another way to choose the winner is through the Condorcet method, where: • A matrix of n × n is created. • It is filled with the times that a candidate A
i
is preferred to A
j
. • A Condorcet winner is one who wins all of their one-on-one “matches.” That is, the candidate A
i
who has been preferred over A
j
more times than A
j
has been preferred over A
i
∀j; i ≠ j.
Condorcet method.
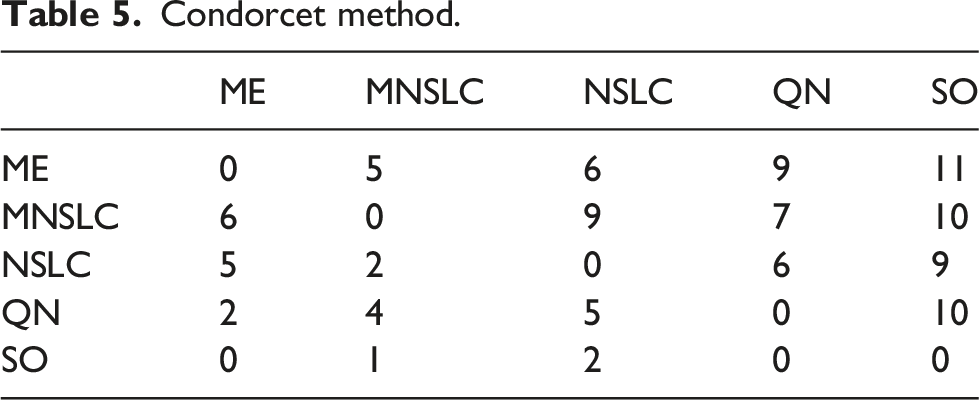
Now, let’s go back to the questions raised in Section 3.5.4. With the above analysis, we have answered how ME compares with a Multi-BC QD algorithm. To answer how the introduction of global pressure affects a QD algorithm like MAP-Elites and if it still maintains desirable characteristics of QD algorithms, we need to compare it against NSLC.
Returning to examine the Borda count in Table 4, we can observe that ME significantly outperforms NSLC. However, examining the Condorcet method in Table 5, we realize that ME only marginally outperforms NSLC, with six wins compared to NSLC’s five, winning in almost the same indicators as MNSLC, with the addition of D gm . This brings us to a similar conclusion as with ME and MNSLC. Considering the desirable characteristics of a QD algorithm, we find that ME was superior to both MNSLC and NSLC in terms of the quality found in diversity, but generally inferior in terms of the notions of diversity considered.
When considering the results of MNSLC versus NSLC, it seems that the victory was quite considerable in both Borda count and Condorcet method. Examining the matches one by one in Table 5, we can see that MNSLC won 9 out of the 11 matches against NSLC, while NSLC won the remaining ones. Furthermore, if we examine the two indicators in which NSLC won, we can observe that the only advantage NSLC has is that it achieves slightly more morphological diversity and novelty (D m , N u ), specifically 1.23 and .67 on average, respectively, small but statistically significant differences. In both indicators, NSLC is in first place, followed immediately by MNSLC. Therefore, we can say that, although there is a loss of diversity and novelty relative to NSLC, and both indicators are key to premature convergence of morphology, this loss is minimal, albeit statistically significant. Similarly, taking into account the 9 indicators in which MNSLC was superior, we can observe that not only was MNSLC superior in all those related to fitness performance in the task, but it was also superior in two out of the four related to phenotype diversity and in all those related to genotype diversity. Moreover, the phenotypic diversity indicators in which it performed better were those related to the fitness grid. Considering the observations regarding the comparison of MNSLC and NSLC, it seems that the addition of aligned novelty, firstly, and as already mentioned in the results, is indeed an appropriate notion of aligned novelty, and secondly, effectively mitigates the problem of slow fitness progress in QD algorithms, specifically in NSLC, without compromising performance in terms of morphological diversity.
When comparing the performance of QN with its “purely” QD counterparts (MNSLC and NSLC), we find that MNSLC outperforms QN both in Borda count and in the Condorcet method, while QN and NSLC have equal performance in Borda, and NSLC outperforms QN in Condorcet by one encounter. We can notice that the 4 victories of QN over MNSLC were exclusively in the indicators that consider global or local quality, and similarly, the 7 victories of MNSLC over QN were exclusively in the indicators that consider genotypic and phenotypic diversity. Regarding the 5 victories of QN over NSLC, we have a situation very similar to the previous one, except that a very marginal victory in genetic diversity of morphology (D gm ) is added to the QN victory count. Therefore, we can say that taking QN as a reference, the use of local competition leads to more diverse results in both genotype and phenotype, while the use of global fitness leads to results with higher global quality and higher quality on the diversity found.
We have already talked about the relative advantages and disadvantages among the different algorithms that present diversity protection, now we will talk about the absolute advantages and disadvantages that algorithms with diversity protection present compared to not presenting any type of diversity protection, using the simple genetic algorithm (SO) as a reference.
As far as the performance of QN compared to SO is concerned, the former outperforms the latter by more than double the number of Borda points, and QN wins all its encounters against SO, except for one, where there was a tie (the null hypothesis could not be rejected), which corresponds to the fitness, that is, the effect of adding morphological novelty as a second objective to the fitness of solutions to the virtual creature morphology and control optimization problem in the walking pattern task, when the first objective is global quality, is null. And while there is no effect on fitness, there are improvements in all other fitness-related indicators (
Comparing NSLC against SO, we found again an advantage of more than double the Borda count points, and NSLC wins 9 of its 11 encounters against SO. SO outperforms NSLC in the two population indicators related to fitness (F and N
a
), and loses in any other indicator that incorporates some notion of diversity, from quality indicators in diversity (
Moving on to MNSLC versus SO, we now have the best algorithm versus the worst one with respect to the Borda count ordering. This time, MNSLC wins 10 out of 11 encounters, while SO outperforms MNSLC only in one indicator, the global fitness, so it is noteworthy the effect of adding aligned novelty as a third objective, since MNSLC now outperforms SO in that indicator. With these observations, we can affirm that adding novelty in morphology and alignment as second and third objectives respectively, and changing global fitness for local fitness, leads to more diverse genotype and phenotype results, with higher quality over the found diversity, and with higher aligned novelty, but at the expense of worse global fitness.
Finally, comparing ME and SO, we observe that ME ranks second by a narrow margin, with SO coming in last. In this case, ME outperforms SO in each and every indicator, indicating that adding a selection pressure proportional to global fitness to MAP-Elites results in an algorithm that not only finds solutions that are more diverse and of higher quality in terms of diversity but also solutions that are globally fitter.
NSLC exhibits the worst progress in terms of fitness, which is consistent with the findings in the literature (Pugh et al., 2016). However, it is difficult to determine with this indicator alone whether it is only slow progress or a complete stall. On the other hand, MNSLC manages to outperform NSLC, but it appears that, when examining the last generations in the convergence graph, it would not grow much in subsequent generations after 1000. In the other algorithms, we can see that there is still a growing trend in those last generations, with ME presenting the clearest trend. However, even SO shows signs that it will continue to grow beyond generation 1000. Therefore, it is possible that if the experiments had been allowed to run for more generations, the convergence of SO to a final fitness value would have been observed.
As mentioned several times, behavioral novelty is indeed aligned with fitness; however, it is possible to obtain aligned novelty with high fitness through a not-so-novel trajectory, if the creature covers a greater distance than any previous solutions within its own niche. Conversely, aligned novelty can also be low if the creature does not achieve such improvement. Another way to achieve aligned novelty is through novel trajectories, which are not necessarily associated with high fitness values and may be associated with changes in morphology that lead to erratic behaviors. Therefore, the reason why ME and QN outperform MNSLC in aligned novelty may be because both algorithms are capable of finding solutions that are both morphologically novel and have higher global fitness than MNSLC, covering both scenarios in which high aligned novelty can occur, that is, through diverse trajectories and consistent progress in global fitness. One way to examine this would be to explore the angles of the trajectories of each individual and the frequency of times per generation that the individual with maximum fitness was surpassed. This last metric could also be related to progress relative to fitness, and therefore to convergence to the final fitness value. Thus, it could also be tested whether higher aligned novelty is related to greater progress in terms of fitness.
Regarding the main findings that the examination of morphological diversity provides, it can be mentioned that there is undoubtedly a clear effect in the introduction of diversity protection mechanisms, which allows for much more diverse populations (i.e., with higher values of average morphological distance), and that not only is there a slower loss of morphological diversity, but also that morphological diversity is maintained, thus avoiding premature convergence of morphology with respect to the control. Regarding unaligned novelty, something very similar can be mentioned, except that in this case, it is not maintained for any algorithm, but rather, at best decreases slowly. It should be noted that this indicator is closely related to the parameters chosen for the archive, whereas at least the test problems, plots with logarithmic shape (with small values of k) or plots that reach a maximum value only to immediately start decreasing (when the archive had reached its maximum size) could also be found.
The coverage provides information about the ability of each algorithm to explore different morphologies, and in consistence with all indicators that incorporate some type of diversity, SO is found to perform much worse than the other experiments. ME outperforms all other experiments in this regard, despite having a probability of bin selection proportional to fitness, however, a uniform selection probability would likely achieve greater coverage.
Similarly, a loss of genetic diversity was found to varying degrees in all algorithms, with SO showing the greatest loss of genetic diversity, consistent with diversity indicators of the phenotype at the population level. The experiments that showed the least loss of genetic diversity were the QD algorithms. Just as in novelty and morphological diversity, ME had the worst performance of the three QD algorithms. These indicators are population-based, so it makes sense to argue that when introducing a parent selection proportional to global quality, rather than uniform, certain individuals have a greater probability of being selected as parents of the next generation, sharing characteristics that make them fitter, and therefore similar to one another, which in turn results in less diversity and novelty.
It is worth noting that both MNSLC and NSLC, after performing the non-dominated sorting of NSGA-II, choose the survivors of the last front with a ranking based on genetic diversity, instead of crowding distance, which can also play a role not only in genetic diversity, but also in novelty and morphological diversity. If we compare with QN, we can argue something similar about how global selection pressure affects diversity, and the possible role that genetic diversity may play as a cutoff criterion in the last front of NSGA-II. It does not seem too risky to assume that the higher genetic diversity, morphological diversity, and morphological novelty presented by MNSLC and NSLC are due not only to local competition but also to the use of genetic diversity in NSGA-II; however, the necessary data collection was not carried out to determine this conclusively.
The genetic diversity of control presents the same ordering as genetic diversity and seems to cause a greater diversity of behavior, which in turn causes a higher aligned novelty (with MNSLC being the best in this indicator). Furthermore, the two experiments with local competition present greater diversity in the controllers and it could be argued that maximizing both local competition score and aligned novelty increases the genetic diversity of the controllers.
It is interesting to see that NSLC and QN are so similar in terms of morphological genetic diversity. It seems that morphological genetic diversity ignores local competition, and is only interested in morphological phenotypic diversity, and the increase in aligned novelty that it entails.
7. Conclusions
The co-evolution of morphology and control is a crucial concept in evolutionary robotics, where changes or adaptations in one aspect can influence and shape the development of the other, leading to mutual interaction between the two. A challenge in this process is the risk of premature convergence, where the evolution of morphology stagnates early on, resulting in a limited variety morphologies. This issue has been widely observed in studies involving virtual creatures or robots, as highlighted by Lipson et al. (2016), Kriegman et al. (2018), and Joachimczak et al. (2016). Previous research has investigated different strategies to tackle this problem. However, there has been a lack of comprehensive comparisons among these approaches using consistent evaluation criteria and benchmarking methodologies for optimization algorithms.
In this article, we presented a comparative analysis of several state-of-the-art algorithms proposed for mitigating the issue of premature convergence of morphology with respect to control in evolutionary robotics. To evaluate the performance of these algorithms, we introduced a set of carefully chosen indicators that capture key aspects of the problem.
We concluded that MNSLC is the absolute winner, given that the majority of the indicators used for comparison aimed to measure diversity, whether it was at the genotype or phenotype level, and whether it was based on population or grid-based metrics. Despite ME exhibiting a more balanced trade-off between exploitation and exploration, MNSLC demonstrated a competitive preservation of diversity akin to NSLC. Additionally, MNSLC maintained a competitive level of exploitative capacity that remained unaffected by the integration of diversity protection measures. Notably, its exploitative capabilities, upon examination of the task-based indicators, even surpassed those of SO. Therefore, ME is a worse algorithm than MNSLC in terms of protection of morphological diversity but probably represents a better option in practice for the co-evolution of morphology and control of virtual creatures due to its balanced trade-off between exploration and exploitation.
In the most general case, comparing ME against MNSLC and NSLC, we can reiterate the same conclusion: ME is a worse algorithm than its “pure” QD counterparts (without global quality) in terms of protecting morphological diversity.
Regarding NSLC and MNSLC, the introduction of behavioral-driven novelty as a third objective served indeed as an adequate notion of aligned novelty necessary for the effective application of the Multi-BC version of NSLC. Its addition helped alleviate the slow progress of NSLC without compromising its performance. Comparing it to QN, the use of local competition instead of global quality led to more diverse results, while the use of global quality led to results with higher overall quality and quality over diversity. Therefore, MNSLC and NSLC yielded more desirable outcomes than QN in terms of diversity protection.
Comparing the different algorithms that incorporate diversity preservation allows us to identify their relative advantages and disadvantages, providing insights into the trade-offs made by each algorithm. However, for a more objective assessment of what each algorithm gains and losses, and to better understand their absolute advantages and disadvantages, it is important to compare them against a baseline algorithm. In this case, the baseline algorithm is one without any form of diversity preservation (SO).
In the case of QN, when the primary objective was global quality, it was determined that the incorporation of morphological novelty as a secondary objective in the fitness function did not have any significant impact. Furthermore, QN improved related criteria such as aligned novelty, aligned novelty found in morphological diversity, quality in morphological diversity, and all aspects related to diversity itself, including morphological diversity itself. Therefore, QN exhibited greater robustness.
The incorporation of morphological novelty and the shift from global to local fitness in NSLC demonstrated several advantages. It led to increased resilience against premature convergence of morphology in relation to control, as well as enhanced quality in terms of the discovered diversity. However, this came at the expense of a lower overall fitness level.
In relation to MNSLC, it was found that incorporating morphological novelty and aligned novelty as the second and third objectives, respectively, and shifting from global to local fitness, led to more robust outcomes. Additionally, it resulted in higher quality in terms of the discovered diversity and increased aligned novelty. However, there was a trade-off with lower overall fitness.
Lastly, concerning ME, incorporating a fitness-proportional selection pressure to MAP-Elites led to the resulting algorithm not only achieving more robust solutions against premature convergence of morphology with respect to control and higher quality in terms of diversity but also attaining solutions that are more globally fit.
Footnotes
Acknowledgements
Luis Eguiarte-Morett would like to express gratitude to CONACYT for the scholarship awarded.
Declaration of Conflicting Interests
The author(s) declared no potential conflicts of interest with respect to the research, authorship, and/or publication of this article.
Funding
The author(s) received no financial support for the research, authorship, and/or publication of this article.
About the Authors