
Abstract
The emergence of altruistic behaviors in heterogeneous populations of autonomous robots, especially in signaling tasks, has proven to be a difficult problem to solve. However signaling and altruistic behaviors are present throughout the tree of life. Specially giving that, signaling behaviors seem to have evolved multiple times whenever there is a channel to emit a signal and one to receive it. In this work, this problem is addressed, using evolutionary algorithms, and modeling phenomena such as kin selection and kin discrimination in a biologically plausible way. We also used self-organizing maps to analyze the behavior of these populations during the evolutionary process, within the solution space. We believe that this approach can shed light on the predictive power of the Hamilton rule, the importance of kin selection in the evolution of altruistic behaviors, and how self-organizing maps can allow us to observe the different solutions in which the evolutionary algorithm converges through time.
1. Introduction
Altruism has been defined as a behavior that reduces the expected reproductive performance (fitness) or survival of the agent performing the behavior, while simultaneously increasing the fitness of the recipient of the action (Kay et al., 2020; Floreano et al., 2008; Bourke, 2021; Axelrod & Hamilton, 1981). At first glance, this appears to be in conflict with the Darwinian conception of natural selection understood as “survival of the fittest” (Kay et al., 2020); nevertheless, this apparent paradox dissolves when we consider the genes of the individuals as the main unit for selection.
Modeling the emergence of altruistic behavior in heterogeneous populations of autonomous robots has proved to be a difficult problem to tackle. Several works have attempted this using evolutionary algorithms (
To model the evolution of these behaviors in autonomous robots, foraging tasks are often used. In the majority of these experiments (Perez-Uribe et al., 2003; Palacios-leyva et al., 2017; Floreano & Keller, 2010; Floreano et al., 2008; Floreano et al., 2007), experimental designs have manipulated two main factors: the relatedness of individuals in a population, as well as the type of selection used to determine which agents will reproduce.
In the aforementioned works, two experimental groups were established according to the relatedness between agents (relatedness factor): homogeneous groups, composed of genetically identical agents, and heterogeneous groups, where the genetic composition of agents is a stochastic product of the evolutionary process. To determine which agents were selected for reproduction, two types of selection (selection factor) were used: group selection, where agents that performed a task together and accomplish the best fitness as a group were selected, and individual selection, where agents that achieved the best fitness of the overall population were selected. These experimental designs did not successfully evolve altruistic behaviors using heterogeneous relatedness with an individual type of selection. (Mitri et al., 2009) for example, found that in such conditions, a suppression of what they call “communication” happened instead of the emergence of altruistic behaviors. This was a result of the fact that given the random initialization of the populations in genetic algorithms, at the beginning of the evolutionary process the average emission of light that the population of robots produces is close to 50%. This amount of light emission inadvertently produced information about the position of the food, which improves the performance of the other robots (Mitri et al., 2009; Borg & Channon, 2017) creating evolutionary pressure against the robots that emit light, consequently, causing the extinction of this conduct. Nevertheless, this phenomenon of suppression represents a problem, since it is well known that cooperative and altruistic behaviors exist in the natural world in heterogeneous populations.
Given the definition of altruism as: “Cooperation with a cost […] the cooperator helps other individuals at its own expense” (Floreano et al., 2008, pp. 233), there is an important aspect to note in Floreano (2007, 2008, 2010), and it is the claim that altruistic behavior emerges under homogeneous groups and group selection. Here, it is argued that where group selection was used, what actually evolved was a behavior of cooperation, given that it is the only behavior individuals could use to increase their own fitness as only when the group was selected the individual would reproduce. Such behavior is equivalent to the biological model of group selection described by Nowak (2006), who claims that groups of cooperators have more reproductive success than groups of defectors, with the additional constraint that only if the group is selected the individual would reproduce. On the other hand, in those conditions where robots evolved in homogeneous groups, regardless of the type of selection (group our individual), the agents were in fact clones. In such conditions, there were not any differences if a specific agent or his clone was selected because those agents were “genetically” identical and their resulting progeny would be the same; strictly speaking, they were not “helping other individuals at its own expenses” they were only “helping” themselves.
A more biological plausible approach to the evolution of altruism in autonomous robots can be seen in the work of Waibel (2011). In this work, the authors attempted to model the kin selection mechanism, based on the Hamilton rule. This rule states that, if the product of the benefit (B) provided by the altruistic behavior and the relatedness between individuals (r) is bigger than the cost (C) of that behavior, then such behavior is an evolutionary stable strategy (see Eq. 1). However, in this work, groups of clones were used while “kinship” among agents was manipulated during the evolutionary process by varying the percentage of clones inside each group. The authors performed kinship manipulation by substituting a certain number of clones with agents with different genomes. For these reasons, the work cannot account for how these behaviors could have emerged in non-cloned populations, and, given that the cooperative behavior evolved by these individuals was performed for helping their clones, this work presents the same problems as those that use homogeneous groups.
There are works where the goal was to evolve cooperative behaviors instead of altruistic ones. In Bernard (2016), the robots had the option of cooperating to hunt a big prey or not cooperating by hunting a small one in solitary. Cooperating to hunt big prey was a vastly superior strategy, in terms of fitness gain, as hunting a large prey had a reward of 500 units for each individual participating in the hunt. On the other hand, hunting a small prey had a fitness gain of only 50 units. Still, the cooperation behavior only evolved in less than 10% of the evolutionary runs. Furthermore, even when the option of hunting bigger preys was presented after the hunting behavior had already evolved, cooperation only evolved in 1 of the 30 independent runs. In similar works, when cooperation is the only feasible strategy to perform a task (e.g., Rollins & Schrum, 2017), a team of robots had to hunt preys that were preprogrammed to escape from the nearest predator. The scenario was a torus-shaped grid that allows the prey to move from one edge of the world to the other. In this particular configuration, it is almost impossible to corner and catch a prey without another predator acting as a blocker, and as a result, cooperation emerges consistently.
The work presented here follows the premise that evolution is a substrate-independent process (Dennett, 2002; Lehman et al., 2020), and the known fact that in the natural world, altruistic behaviors are present in heterogeneous populations of individuals. So, there should be no ground to believe that those altruistic behaviors would not emerge in heterogeneous populations of artificial agents using individual selection. One of the main issues behind the present shortcomings might be the variables that were modeled. For example, even though the kin selection hypothesis does not include an explicit mechanism to allow individuals to give preferential treatment to their kin (Penn & Frommen, 2010), it appears to be necessary for the evolution of these conducts to evolve and stay in the genetic pool. The works that have attempted to model kin selection neglect the fact that some form of kin recognition or discrimination is needed for kin selection to work on heterogeneous population. In Leonce (2012), the authors modeled the evolution of nurturing conducts without any kin discrimination mechanism, and the conduct of helping their own progeny evolved if the robots had to interact only with family members. This conduct disappeared from the genetic pool when the already evolved population had to solve the same task interacting indistinctly with family and non-family members, presumably as a result of the lack of a discrimination mechanism. In the work presented here, the inclusion of kin selection, as a mechanism different from natural selection that allows the emergence of altruistic behaviors, is of key importance.
2. Proposal
The aim of this work is to have altruistic behaviors emerge in a population of artificial agents using the minimum necessary conditions. To achieve this, two fundamental considerations were taken. First, there was no specific reward for altruistic behavior in the fitness function and second, the populations used were heterogeneous.
Multiple mechanisms have been proposed to account for the emergence of cooperative behaviors such as direct reciprocity, indirect reciprocity, networks of reciprocity, and group selection (Nowak, 2006). However, these are cases that do not satisfy the definition of altruism, given that these cooperation behaviors ultimately improve the fitness of the individual performing such behavior (Bourke, 2021). One of the main theories about how altruism could emerge in the natural world, that satisfies the definition of altruism as “cooperation with a cost”, is the

The Hamilton rule states that if the benefit (B) of the altruistic behavior multiplied by the relatedness (r) between the altruistic individual and the receiver of the action is bigger than the cost (C) of the behavior, then this behavior is an evolutionary stable strategy.
The Hamilton rule does not specify a mechanism for kin recognition or discrimination among agents, so a mechanism that fulfills those tasks is needed for kin selection to work as an evolutionary force (Penn & Frommen, 2010; Tang-Martinez, 2001). In this sense, some works explore how cooperation can emerge and evolve among individuals who recognize and preferentially interact with others who share some arbitrary traits or tags, namely, those that model tag-based altruism. This approach has been applied successfully to various scenarios that do not involve autonomous robots. For instance, Riolo (1997) and Hales (2000) showed that cooperation can evolve in an Iterated Prisoner’s Dilemma game, where individuals only cooperate with those who have the same tag as themselves. Riolo (2001) extended this model by introducing a tolerance parameter that determines how much individuals are willing to cooperate with others who have different tags. Cooperation can also arise when individuals use tags to infer the strategies or reputations of others, as in the case of indirect reciprocity, for example, Masuda (2007) studied a model where individuals play the Prisoner’s Dilemma game and can observe the strategies of others, even if they do not interact again. Tag-based altruism can also be useful for large-scale, decentralized, and dynamic multi-agent systems, such as peer-to-peer networks, where kin selection and direct reciprocity are not feasible (Hadzibeganovic, T., Cui, P. & Wu, Z., 2019). However, most of these models assume that the tags or the discrimination mechanism are given and fixed. We propose a model where the discrimination mechanism evolves by itself, and where the relatedness of the individuals can be seen as a phenotypic expression of their genotypes. A better way to explain this model is by using the concept of the green beard effect. This is when a gene or a set of genes makes an individual act altruistically toward others who have a noticeable trait. However, we are aware that this could also be interpreted as a form of tag-based altruism, in which the trait produced by the green beard gene effect acts as a tag that signals cooperation.
Furthermore, we chose to model the green beard effect as a kin selection mechanism because it relies on individual recognition of kinship cues, rather than on the structure of the population.
Other models, such as the island model, explain the discrimination mechanism based on the average relatedness of the population similar to the work of Waibel (2011). In contrast, our model does not require controlling the level of relatedness in the population during the evolutionary process. Unlike the island model, which assumes that a species is subdivided into a number of discrete finite populations, between which some migration occurs. Also, our model has sufficient granularity to avoid the problem of having to control for the kin competition that could arise in populations with usually very high relatedness and no dispersal as the genetic algorithms have. This could be happening in the tag-based model as the results of Hales, (2005) could suggest. However, it would be interesting to overcome the practical difficulties and test the island model in future investigations.
The green beard effect proposed by Dawkins (1976) considers kin discrimination and recognition as processes that allow altruistic behaviors to evolve. Dawkins (1976) claims that natural selection could improve the fitness of a certain gene if such gene favors altruistic interactions between two individuals who possess the same copy of the gene.
A common criticism to the green beard effect theory is the fact that there are not many clear examples of green beard genes in the natural world. Such lack of examples is probably caused by the strict requirements that a single gene must fulfill to be considered a green beard gene. Namely, the gene has to be able to produce a perceptible trait, produce a mechanism for the recognition of that trait, and induce a preferential treatment to those individuals who own the same trait (Penn & Frommen, 2010). Even Dawkins (1976) who theorized the existence of this kind of genes claims that it is improbable that one single gene can perform all these tasks.
Despite the complexity of the traits that green beard genes have to elicit (Madgwick et al., 2019), there is evidence of their existence in the biological world. One such case is gene CSA found in the Amoeba Dictyostelium discoideum which codes for a cell adhesion protein on the cell membrane (Queller, 2003). The CSA gene has been related to the preferential association that the D. discoideum exhibit to their kin in the development of the multi-cellular fruit body that allows the survival of the 80% of the individuals that compose it, at the cost of the death of the remaining 20% (Li & Purugganan, 2011). Another example is gene Gp-9 found in the fire ant (Solenopsis invicta) (Keller & Ross, 1998) that produces an odor-binding protein and is part of the supergene Sb that determines the type of social organization of the colony. It has been shown that queens owning the BB allele of the gene are killed by b-carrying workers. It is important to note that while the Gp-9 gene does not generate altruistic behavior, it generates kin discrimination behavior. Finally, gene OBY found in side-blotched lizards, Uta stansburiana, is a gene that presents three different alleles: o, b, and y. The gene generates six possible genotypes and produces three different phenotypes for throat color (orange, blue, and yellow) and different reproductive behaviors (Sinervo et al., 2006). It has been found that males with blue color throat produced by the homozygote b allele exhibit a conduct of selective cooperation among, and they settle on adjacent territories and cooperate in the defense of their territory and their female partners from the aggressive orange males in the vicinity. Despite the potential benefits that could be gained from defecting or acting in a self-interested manner, the blue male chooses to engage in cooperative behavior, protecting his unrelated partner from the aggression of the orange males. By doing so, he incurs in cost to his own fitness but ensures the survival and reproductive success of his partner (Sinervo et al., 2006).
Furthermore, as West (2013) stated, the green beard genes are extreme cases of a more complex biological mechanism. “Mechanisms and the social responses to them are based on complex phenotypes caused by multiple genes scattered across the genome; for example, a gene (or genes) for the cue on which genetic recognition was based, such as smell, a gene for the cue and a gene for the social behavior” (West & Gardner, 2013, p. p. R580). All this evidence suggests that modeling a mechanism that functions as a green beard gene, in that it allows agents to identify the level of kinship among them, could be sufficient for altruistic behaviors to evolve and be maintained in the genetic pool during the evolutionary process.
3. Environment and robot description
All the evolutionary processes and tests in this work were performed using the open-source robot simulator
A simulated version of the E-puck robot was used as an agent. The robots were equipped with a 360
o
camera with a 720*1 pixel resolution, two wheels with differential motors, a camera directed to the ground and capable of detecting whether the robot was inside the
3.1. Neural controller
The behavior of each robot was controlled by a feed-forward artificial neural network ( Artificial neural network architecture for all robots for all evolutionary process and tests, and the simulated version of the E-puck robot with the ring of LEDs switched-on, in the Enki simulator.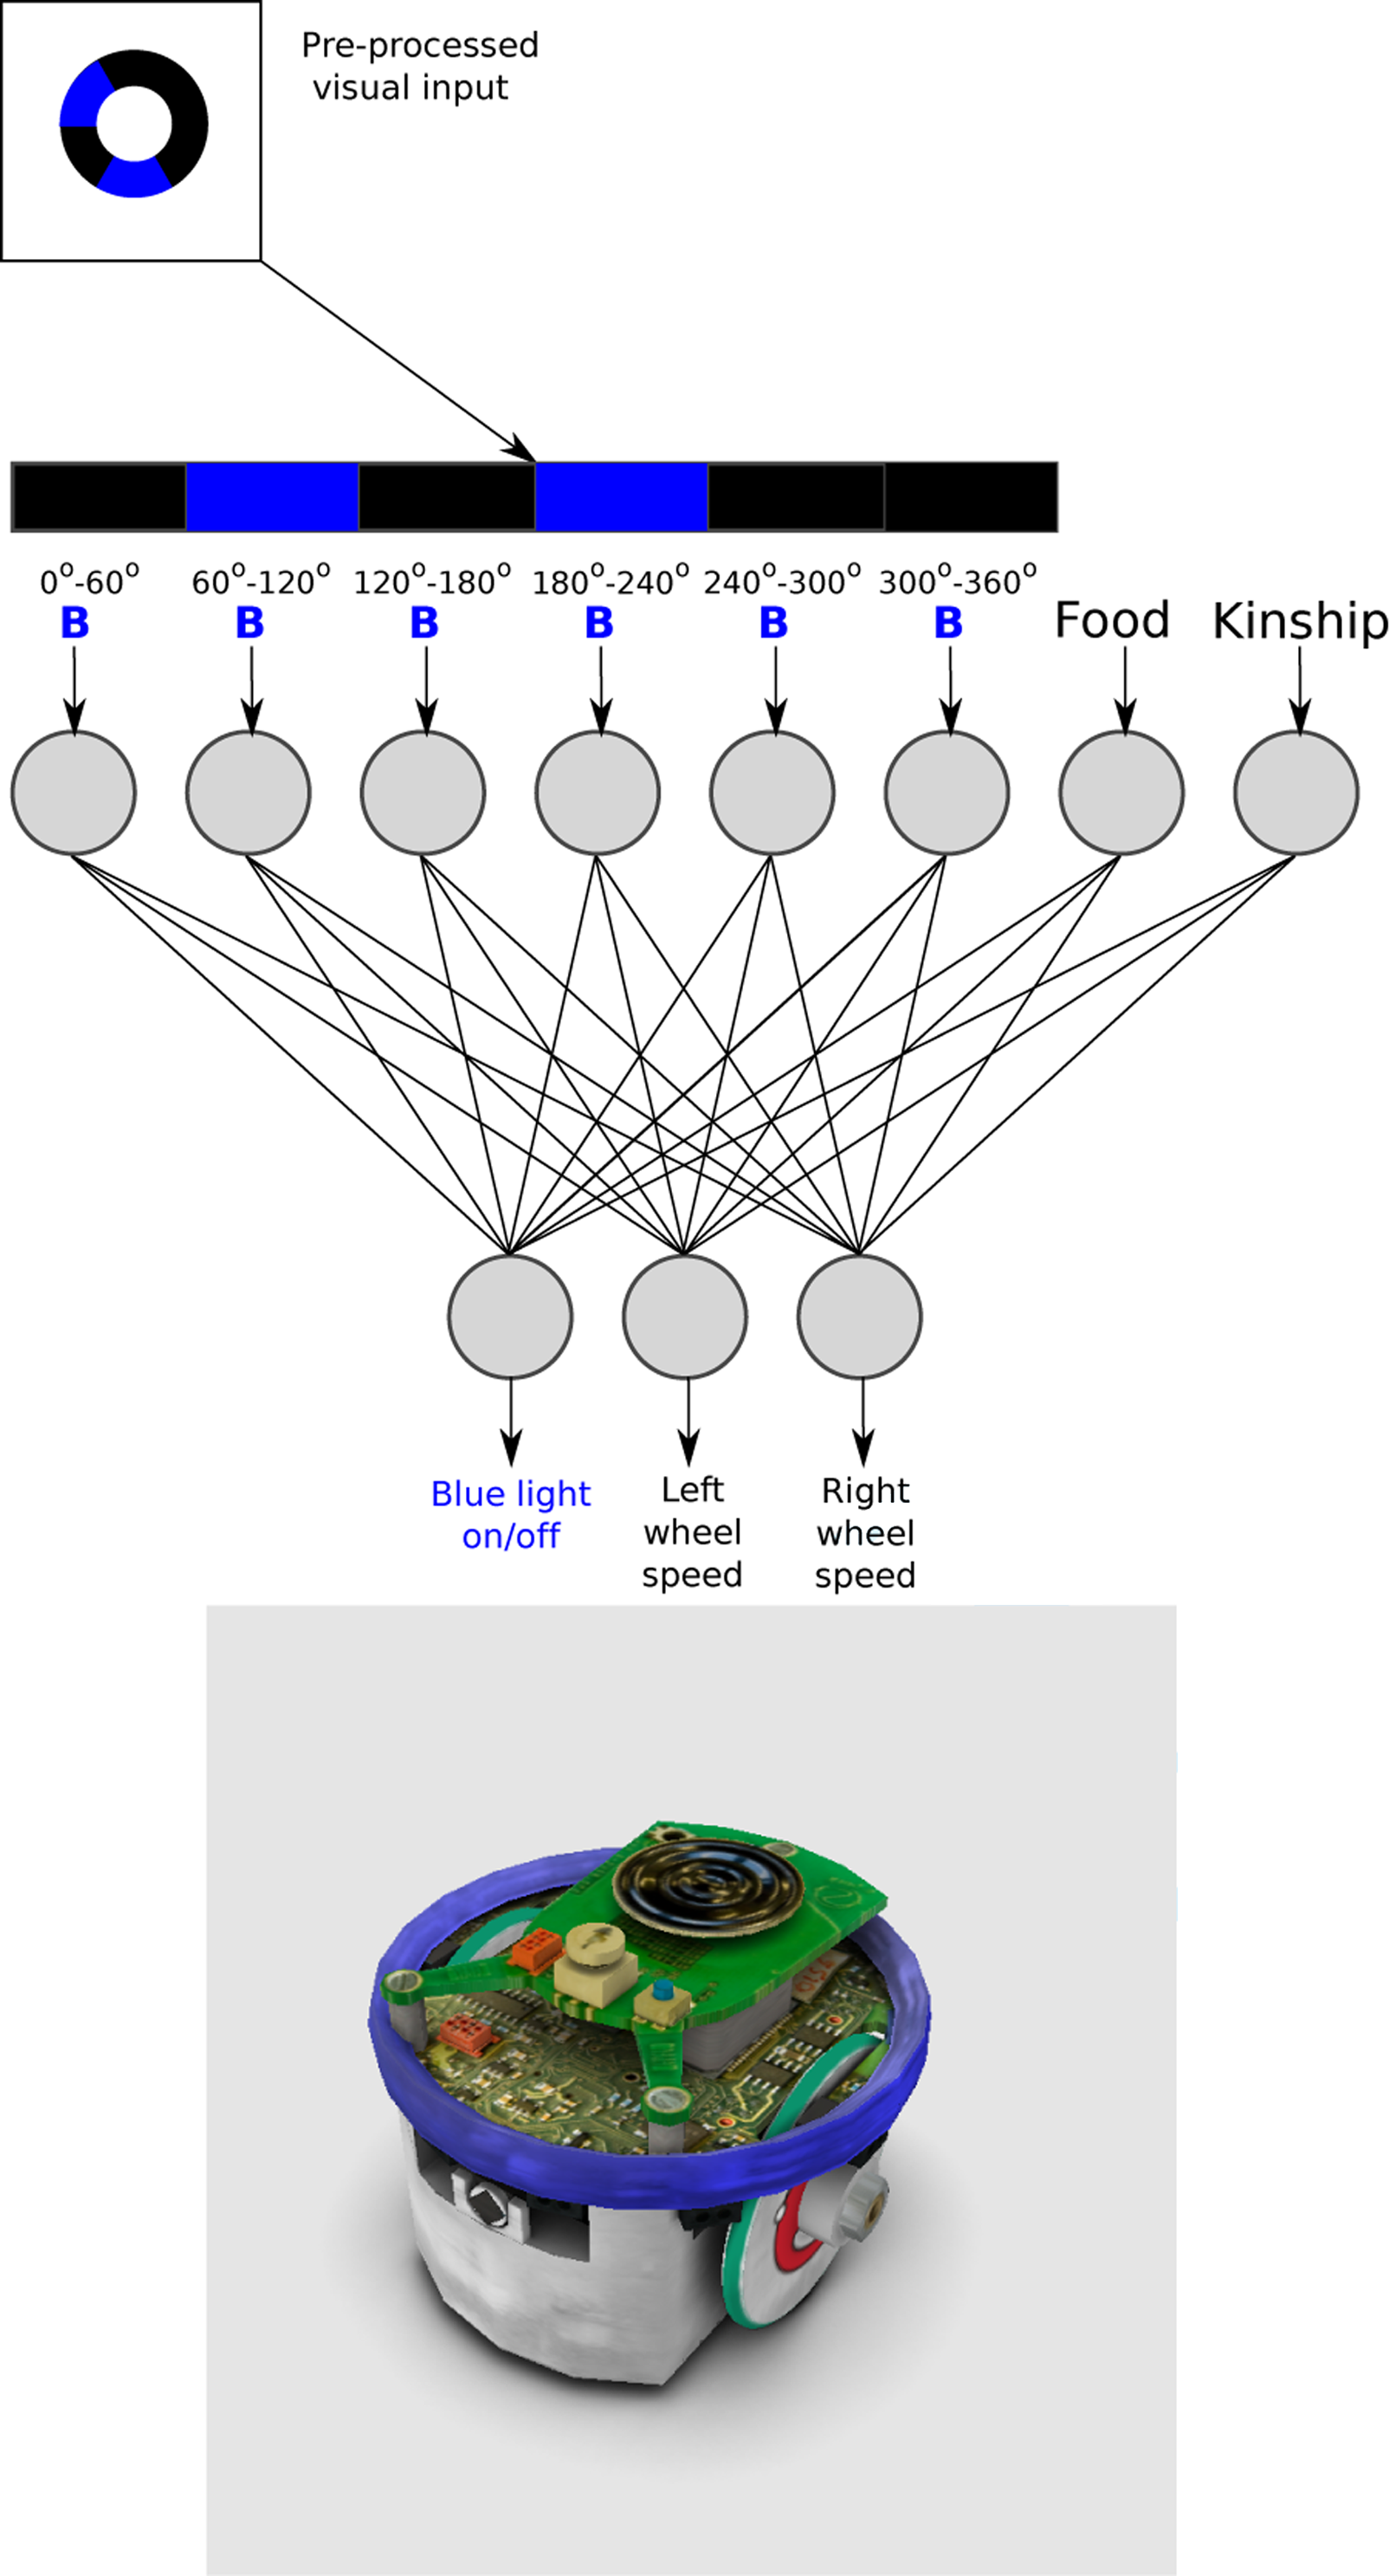
The first 6 neurons of the input layer of the ANN receive the presence or absence of blue light. Incoming visual information from the 360 o camera was pre-processed, by dividing the image into six segments of 60 o each. If there was blue light in any of the segments, the input value of the correspondent neuron was set to 1 and 0 otherwise. The seventh input neuron received 1 if the robot is inside the ROI and otherwise 0. The last input neuron receives the value of kinship between the two robots present in the environment. This value was calculated using the Hamming distance between the genomes of the two individuals in the arena (see section: Evolution of altruistic behavior). The Hamming distance between two strings of equal length is the number of positions at which the corresponding symbols are different. The kinship value was normalized so that a value of 1 indicated identical individuals and 0 individuals with an entirely different genome.
The output layer consisted of three neurons. The first two neurons controlled the velocity and direction for each wheel. The output values [−1,1] were then multiplied 15 times to achieve the motor’s speed range, with positive values for forward turning and negative values for backward turning. It is important to note that the velocity of the motors was set to 0 when the robot was inside the
4. Evolution of altruistic behavior
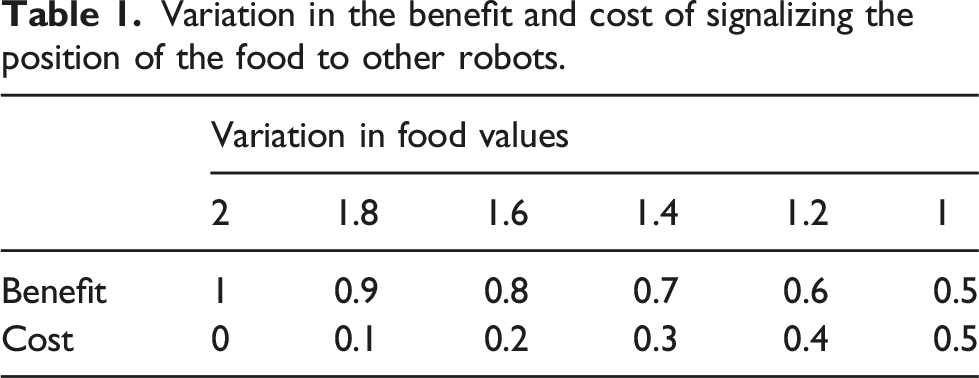
Variation in the benefit and cost of signalizing the position of the food to other robots.
4.1. Environment and fitness function
For every generation, all individuals in the population played two roles for 1200 cycles: signaler and searcher. The signaler robot was placed inside the ROI, where food was located and did not move, meanwhile, the searcher robot appeared at a random position and orientation inside the arena (see Figure 2). Given that the presence of blue light was the only visual input for the agents, the only way for the searcher to know the location of the food was if the signaler indicated its position by emitting blue light. This process was repeated until all the robots of each generation played both roles (signaler and searcher) with all the other robots from their generation. This means that each robot participated in 98 simulations, 49 as signaler and 49 as searcher. Representation of the environment where all simulations are run, and the gray circle represents the region of interest that contains food for the robots. The blue circle indicates the initial fixed position of one of the robots (signaler), and the white circle indicates a possible random initial position of the other robot (searcher).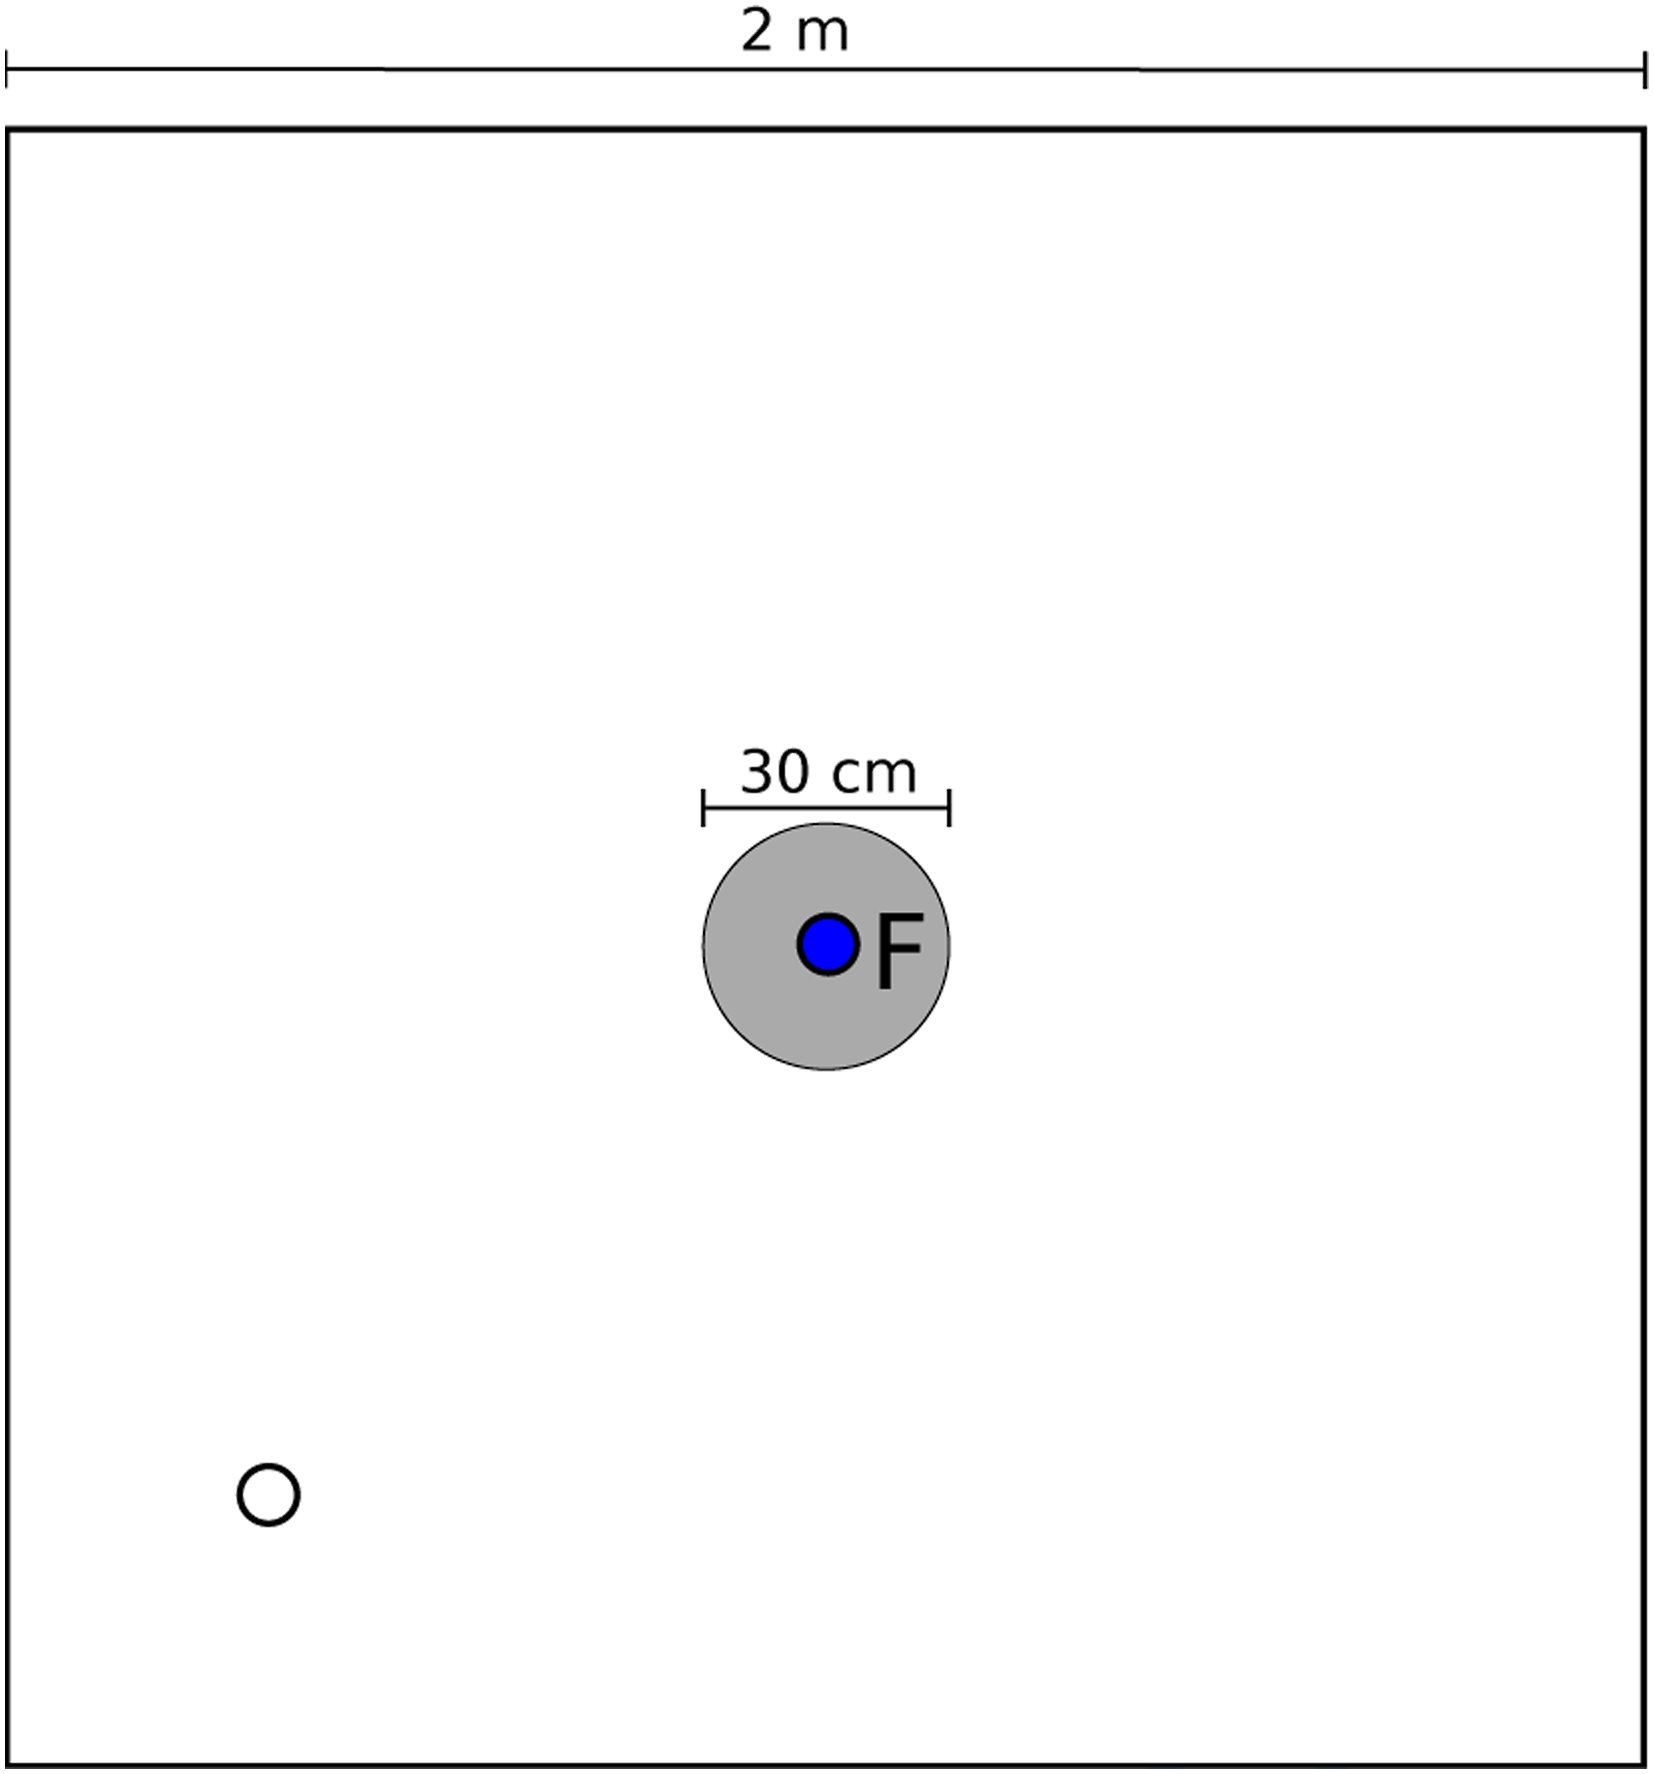
The same fitness function was used for the robots in both roles in all the simulations. The task can be described as follows: in each cycle of the simulations, there was a prefixed amount of food in the 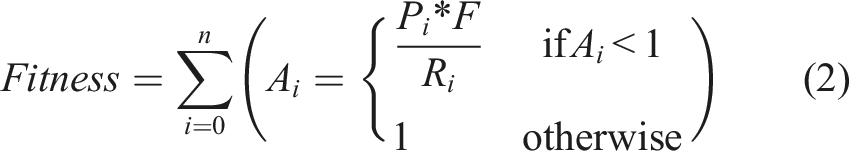
This fitness function was designed to allow the modification of the benefit and cost of signalizing food in each condition by changing only the quantity of food present in the ROI. As an example, with 2 units of food in the ROI the cost of sharing was 0 and the benefit for the recipient of the altruistic behavior was 1. On the other hand, with only 1 unit of food in the ROI the cost of sharing was 0.5 and the benefit was 0.5, as can be seen in Table 1.
Given that during the evolutionary process there was a conflict of interest between the robots that interact in each simulation, there are diverse strategies that could emerge to improve the possibility of reproduction for each individual. For example, an individual could be selected not only by increasing his fitness but also by decreasing the fitness of the other robots by not signalizing the food at all, signalizing the food only to certain individuals, begging for food by emitting blue light outside the ROI, or some other unforeseen strategy.
Given these facts, the fitness measured during the life of the robots and even their conduct across the evolutionary process was not a reliable indicator on how good an individual or a population was at finding the
4.3. Was the blue light used as a signal?
The first thing to determine was whether the blue light inside the ROI was a signal for food and how reliable it was. The operational definition of signal adopted here is “Signals are defined as behavioral, physiological, or morphological characteristics fashioned or maintained by natural selection because they convey information to other organisms” (Otte, 1974, pp. 385). This definition has the advantage of being abstract enough to not be linked to any specific substrate and being compatible with the ritualization theory of the emergency of signaling, where “signals evolve from behaviors that were originally only cues. For example, the use of urine to mark territory may have begun as a marker of fear, produced by animals at the periphery of territory in which they felt safe, which other animals used as the cue of the focal individual’s presence” (Scott-Phillips et al., 2012, pp. 1943). In the task presented here, something similar could be seen to happen. This is, in the first generations of the evolutionary process, blue light emission is close to 50% in average as a product of the random initialization of the first generation of robots. So, starting as a random conduct, this cue evolved into a signal indicating the presence of food, for some individuals.
Here, signals are considered as reliable when they fulfill the criteria set by Searcy (2005), namely, a signal is reliable when it fulfills two conditions: first, the signal must consistently correlate with some attribute of the signaler or its environment and second, the receiver must benefit from the information of the signal.
In practical terms, the reliability of the signal is determined by examining which strategy the robots used to find the ROI. It is expected the robots used the blue light, emitted by the signaler robot, as a signal of the presence of food; however, they could have used any other unforeseen strategy. It is important to note the fact that searcher robots were initialized in a random position and orientation, ruling out the possibility that the robots “learned” the position of the ROI. Furthermore, if the robots were consistently using the blue light to find the ROI, then the blue light should be considered as a signal of food, otherwise the emission of the blue light has to be considered meaningless.
For testing the use of blue light as a signal for food, six experimental groups were arranged, each one corresponding to the last generations of each of the six evolutionary conditions (different amounts of food for each condition). Four runs for each condition were used to control the effects of the random initialization.
All the robots played both roles with all the other robots from their population, for a total of 98 simulations, 49 as a signaler and 49 as a searcher in the same arena. The time the searcher spent in the ROI was measured under two conditions and for 1200 cycles. • •
4.4. Light versus Blind condition results
For each of the six groups, a paired t test was conducted to compare the normalized number of cycles that the robots spent inside the ROI while playing the role of the searcher in the blind condition against the light condition (see Figure 3). For all comparisons, the difference was significant (p < 0.05), and the full results can be seen in Appendix Blind versus Light test. Differences between blind and light conditions for the six groups evolved under different values of food, a paired t test was conducted to compare the number of cycles that the robots spent inside the ROI, and whiskers show the standard deviation (***p < 0.05).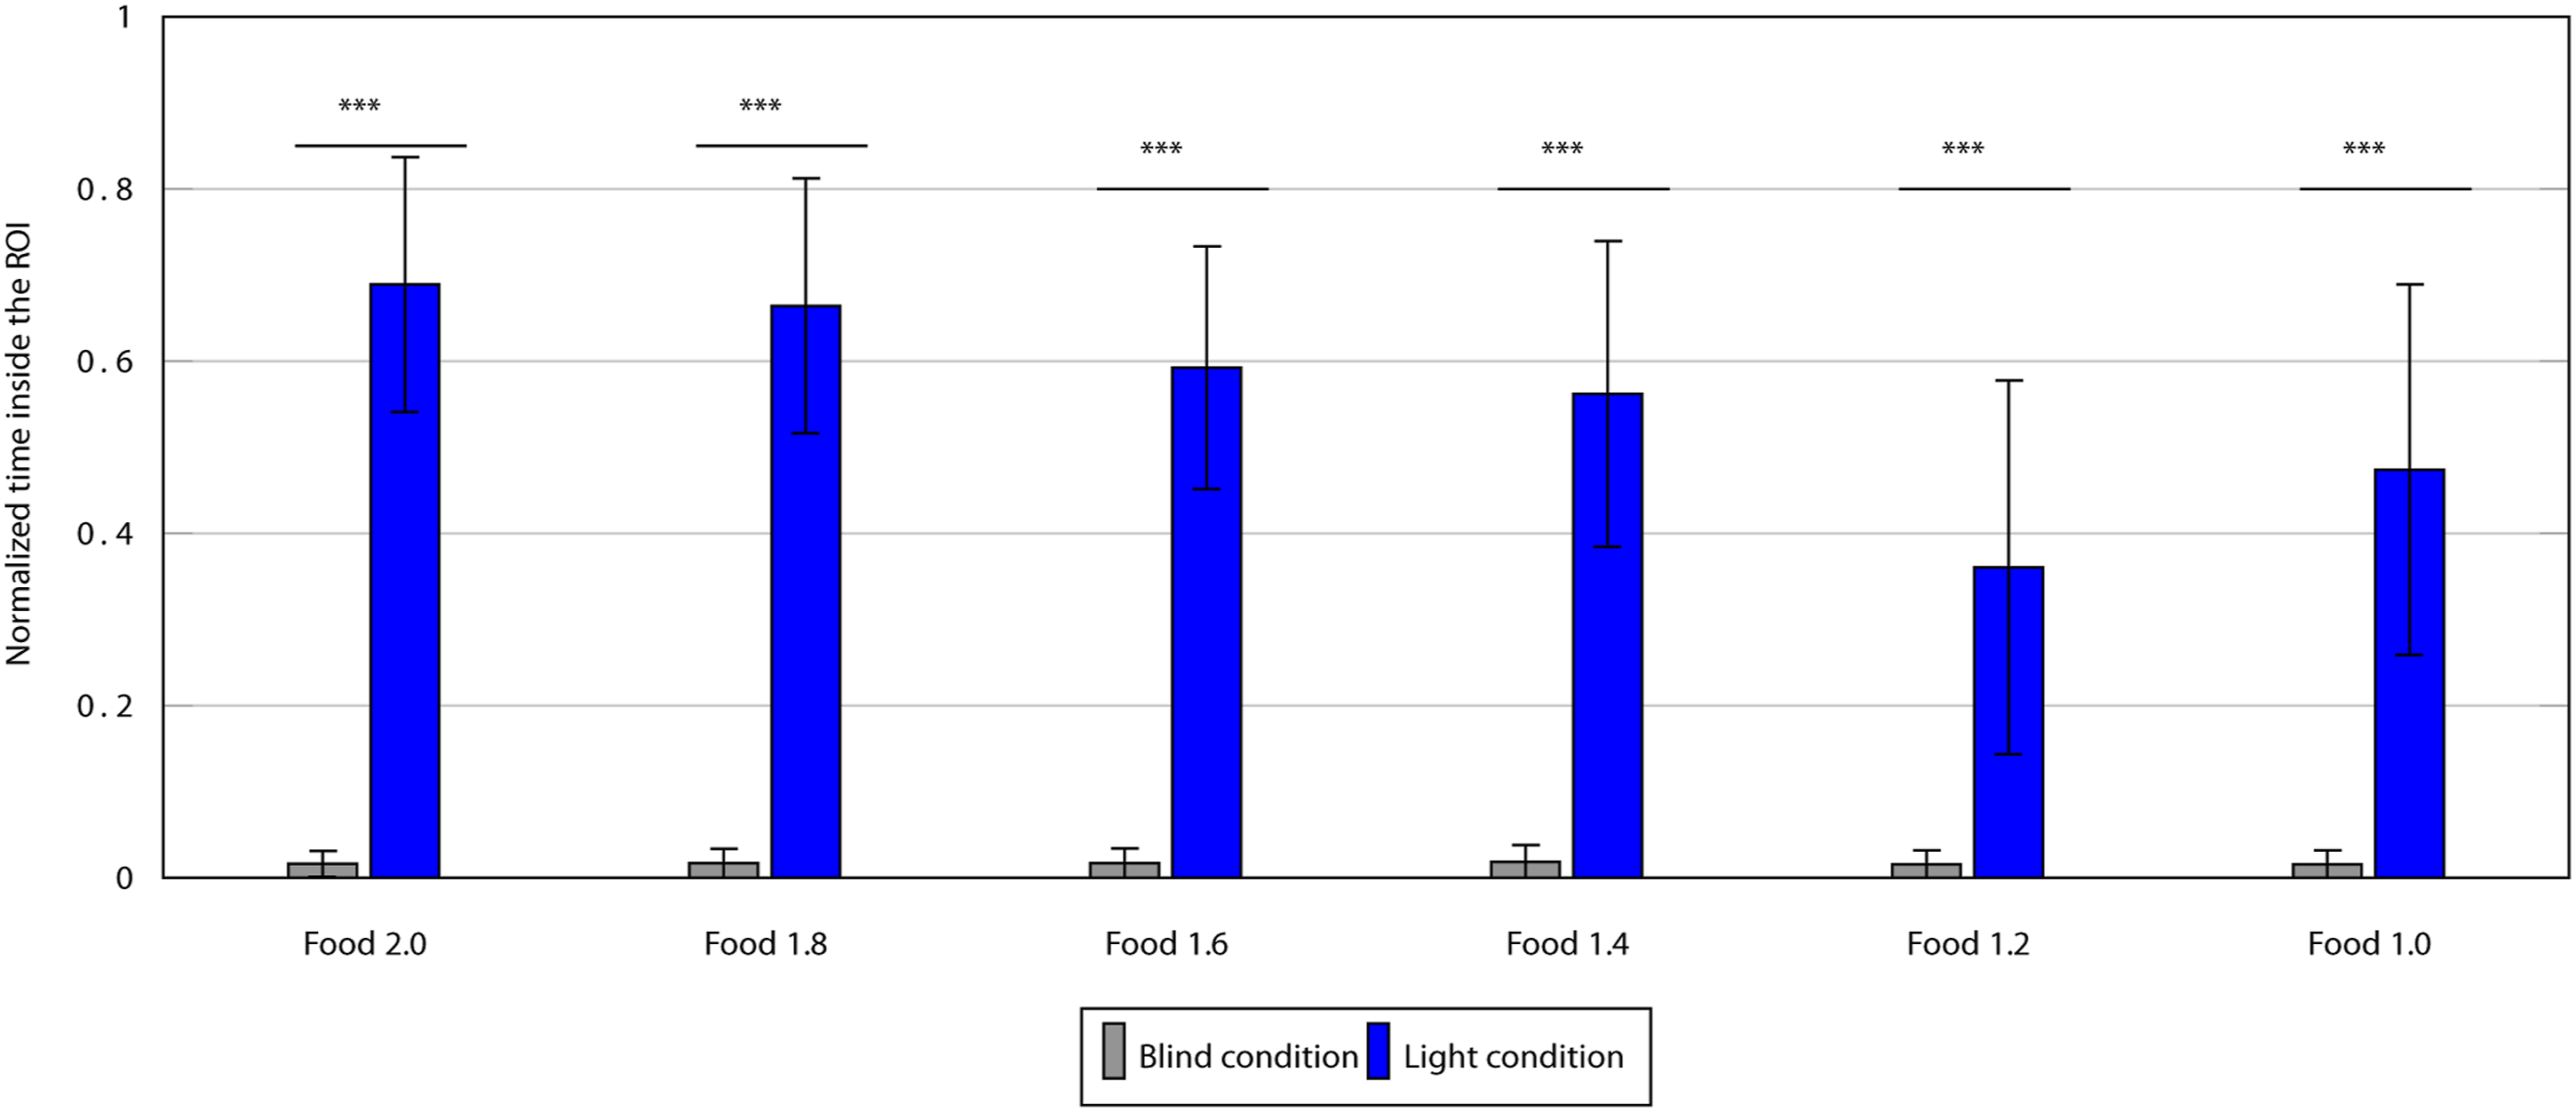
From the above results, it can be said that the presence of blue light at the ROI was the main factor that allowed the robots to find the ROI, confirming that the robots learned during the evolutionary process that the blue light was a signal of food. It follows that the claim can be made that the behavior of signaling inside the ROI is an “altruistic” one. This claim is based on two facts: first, the data shows that blue light emission, performed by the signaler, was the only reliable information the robots had in order to find the ROI. This is important, first, as it rules out that the robots find the ROI by having evolved a blind navigation behavior and not due to the signaling, which would cause blue light emission to lack any meaning. And second, because given the fitness function (equation 2), if the signaler allows the searcher to find the ROI by emitting blue light, this hurts the fitness of the signaler, which makes the act of signaling the ROI an altruistic behavior.
4.5. Test for the level of altruism
Once it was demonstrated that the emission of blue light inside the ROI functioned a signal of food and altruistic behavior, it was necessary to determine whether there was any discrimination as to when light emission was performed by the robots evolved under the six different conditions. That is, it was necessary to test if, as the Hamilton rule suggests, the altruistic behavior performed by these robots relates to the level of kinship between the robots present in the arena.
For this, a two-factor 6x6 experimental design (Kinship * Level of food) was used. Each experimental group consisted of all the robots of the last generation of every evolutionary condition, for a total of 200 robots per group. Each of these groups was tested under the same conditions that they evolved, this means that the ROI contained the same amount of food as during the evolutionary process. The same six different levels of kinship were used. For the test, the values of kinship that the neural network of the robots received in the simulations were substituted with fake values irrespective of what the real value was, and these fake values varied across the conditions between 0 and 1, in steps of 0.2 for each condition, for a total of six different fake kinship values (Figure 4). Inputs for the ANN of the robots during the altruism tests, and each experimental group was tested under six different levels of fake kinship.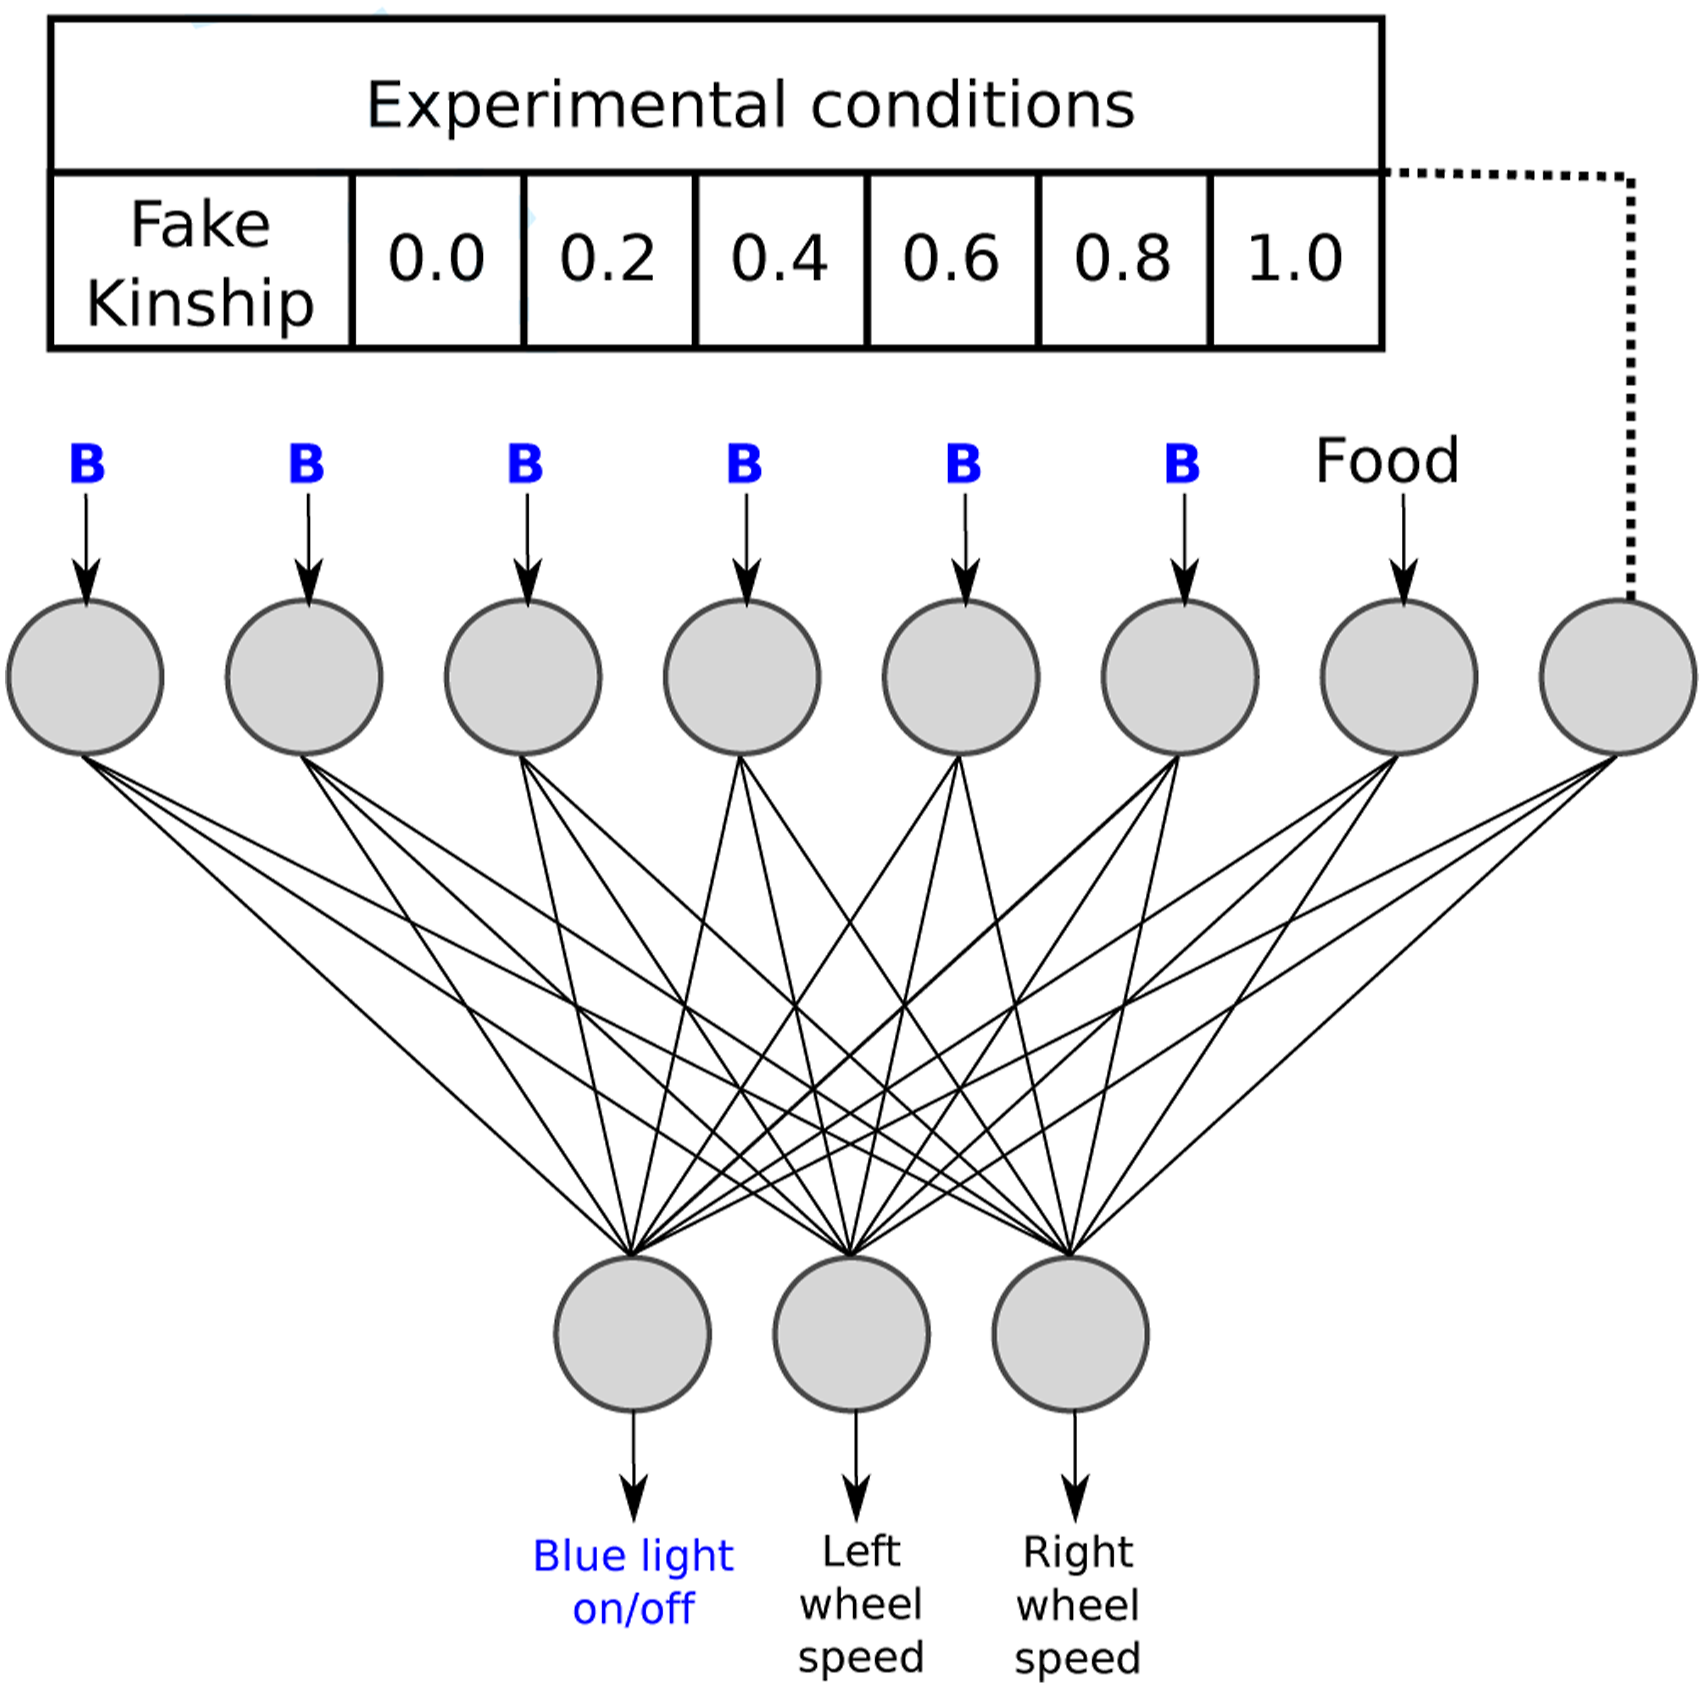
As in the evolutionary processes during these tests, all the robots performed the role of the signaler robot and the role of the searcher robot with all the other robots within their generation for a total of 98 simulations per individual. The interesting variable to quantify was the level of emission of blue light when the robots were inside the ROI. The result is that each robot as a signaler was tested with 49 searcher robots where their kinship was 1.0, 49 searcher robots where their kinship was 0.8, and so on, each time during 1200 cycles.
4.5.1. Results of altruism test
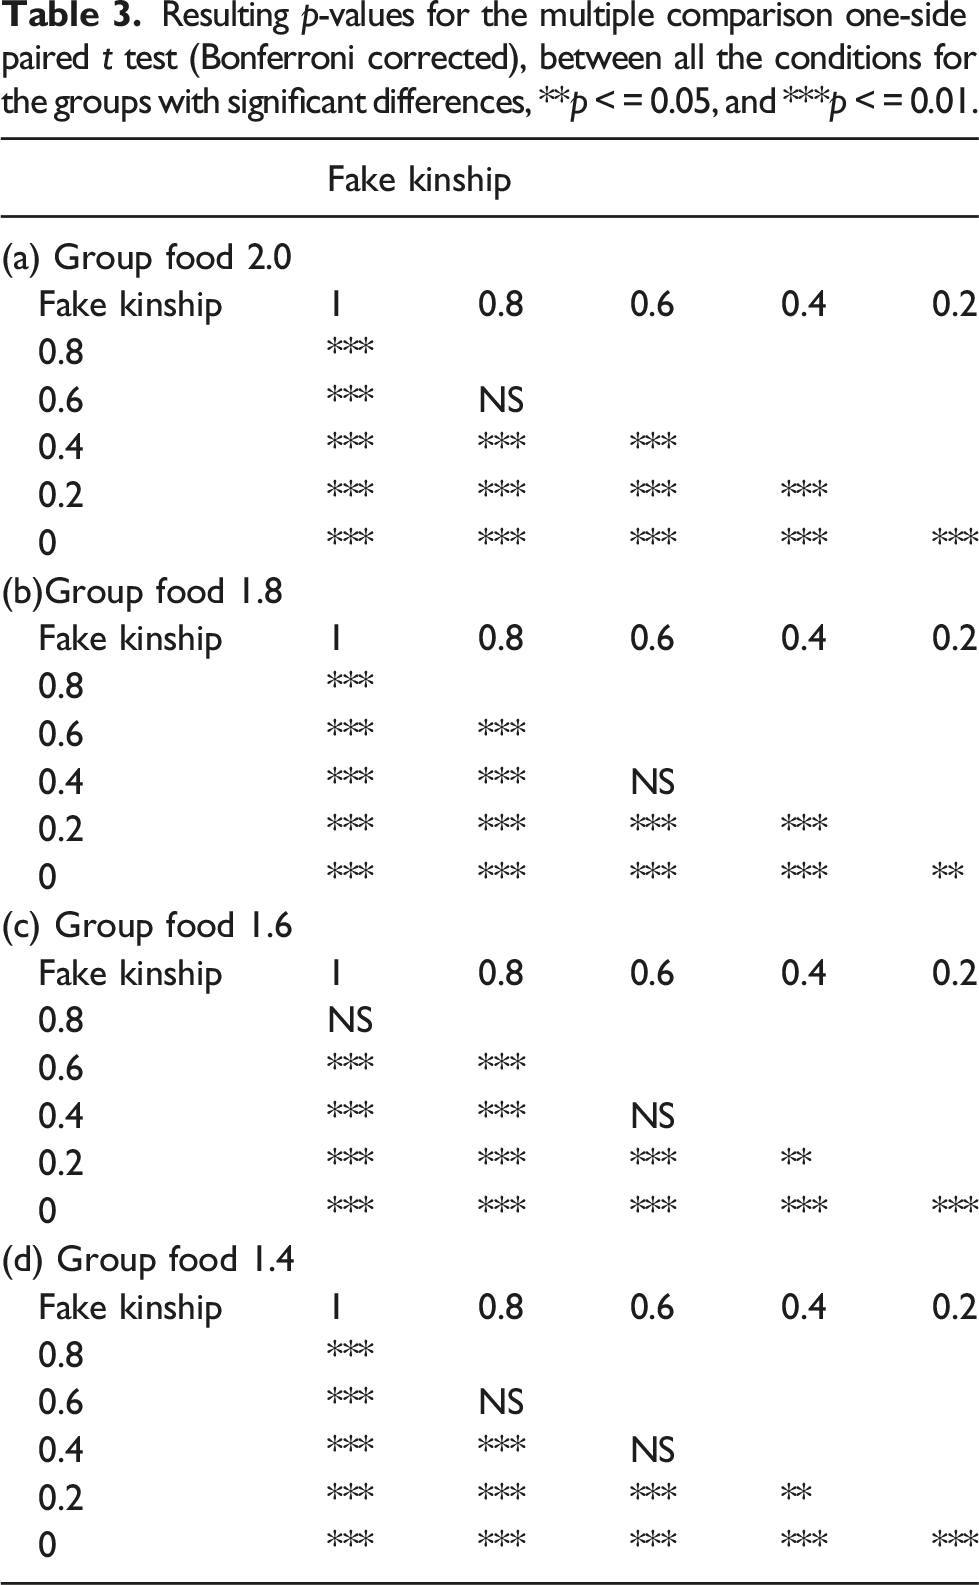
Given that the interest lays in the robots that showed altruistic behavior (emitting blue light inside the ROI) and whether this emission was related to the level of kinship, for the statistical analysis, we only used the 20% of individuals with the highest emission levels in each group across the six conditions. For the statistical analysis, we performed a one-way repeated measure ANOVA for each group (Figure 5). The ANOVA revealed a significant effect of kinship on the emission of blue light inside the ROI, and Greenhouse–Geisser adjusted for the groups evolved in the following conditions: food 2.0 F (1.4, 55) = 47, p < 0.05, food 1.8 F (2.7, 107) = 72, p < 0.05, food 1.6 F (1.5, 60) = 28, p < 0.05, and food 1.4 F (2.5, 96) = 29, p < 0.05. Meanwhile, there were not significant differences for the following conditions: food 1.2 F (1, 40) = 5.3, p > 0.05 and food 1.0 F (1.4, 77) = 0.84, p > 0.05. Differences between the different levels of kinship for each evolutionary condition, and whiskers show the standard deviation, repeated-measures ANOVA, and ***p < 0.05.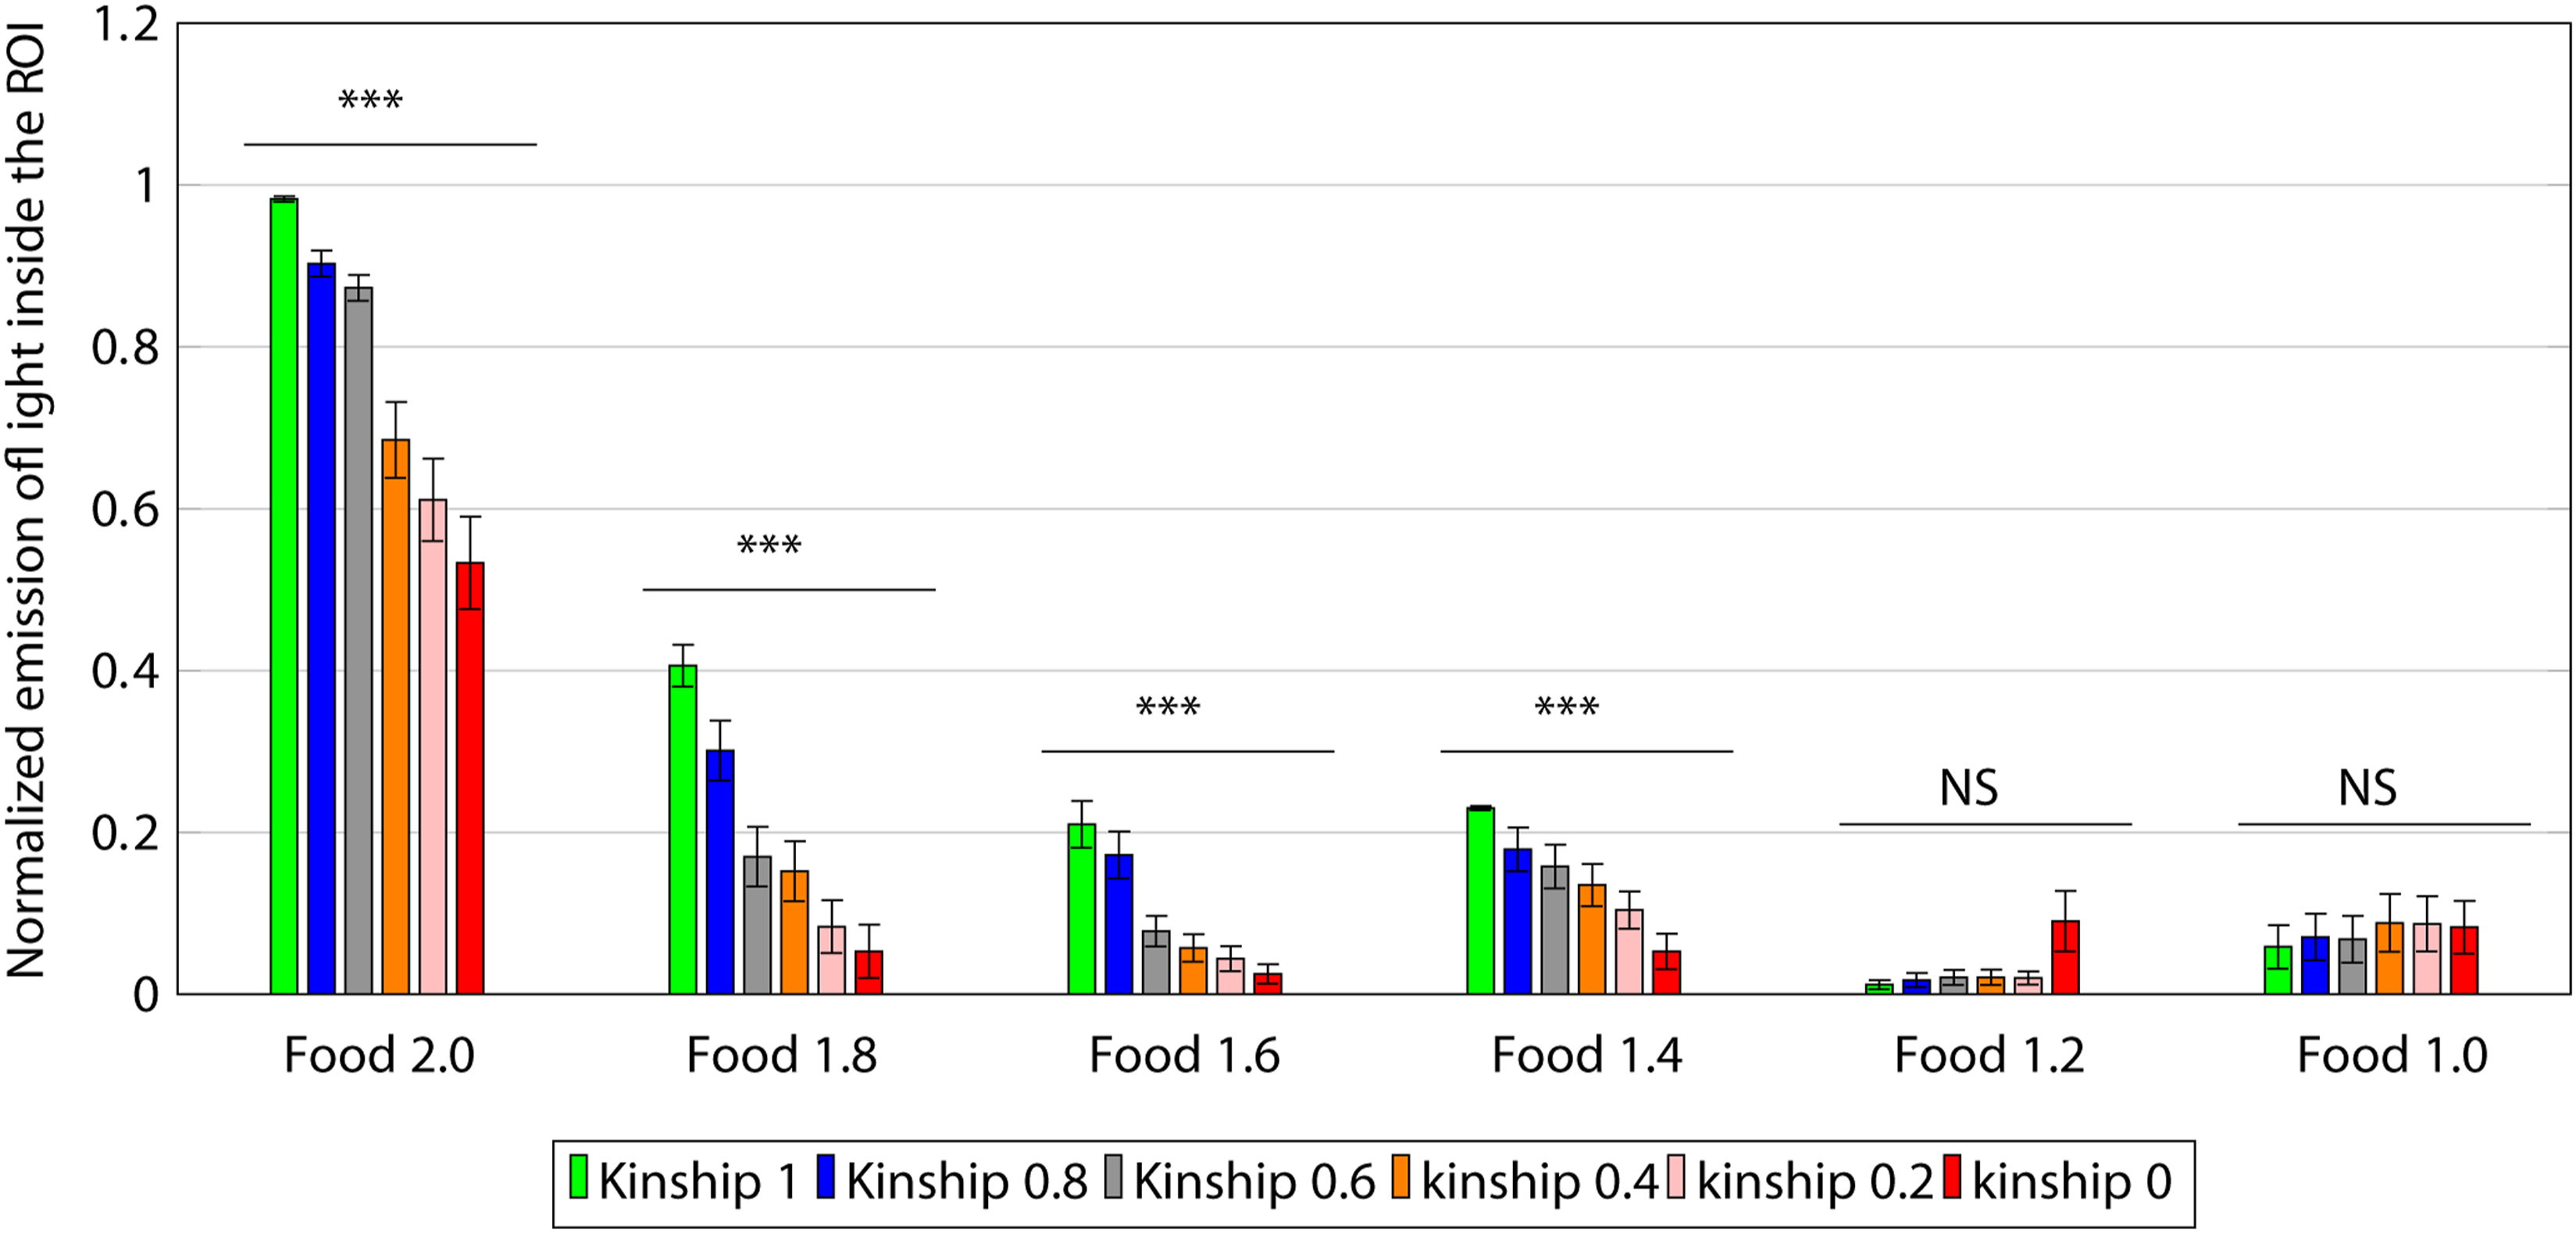
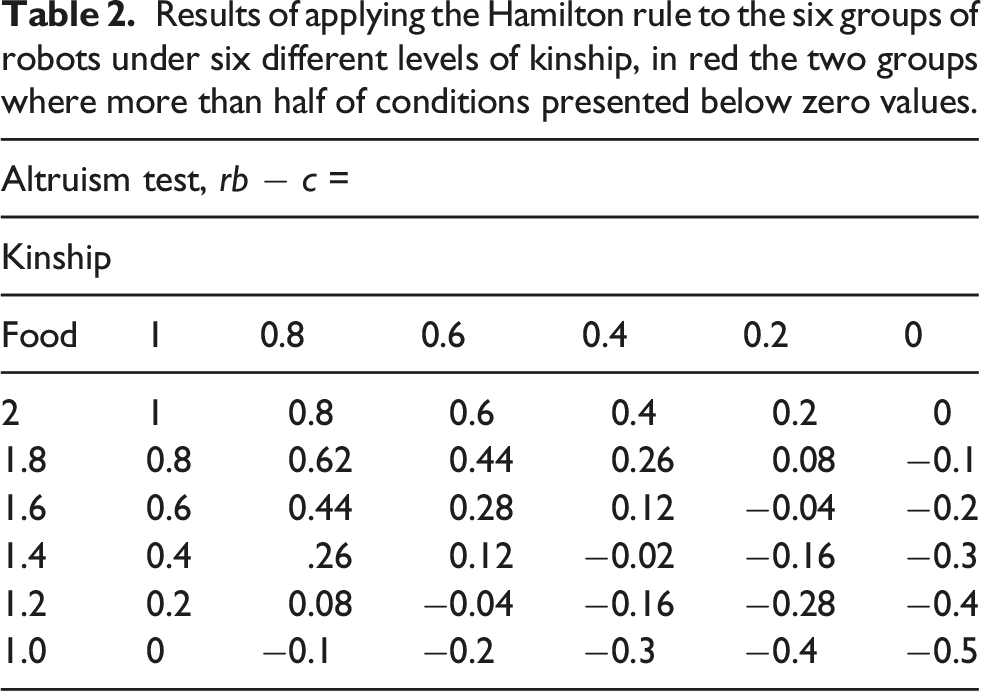
Results of applying the Hamilton rule to the six groups of robots under six different levels of kinship, in red the two groups where more than half of conditions presented below zero values.
Resulting p-values for the multiple comparison one-side paired t test (Bonferroni corrected), between all the conditions for the groups with significant differences, **p < = 0.05, and ***p < = 0.01.
5. Visualization of the solution space
Most problems being solved using genetic algorithms present an immense number of possible solutions; also, the solution space usually has a high dimensionality. These two characteristics make it particularly difficult to understand and visualize the movement of evolved populations within the solution space across generations. The
Shine (1997) pointed out that a good visualization technique for the moving of the algorithm within the solution space should be able to perform four tasks: mapping an n-dimensional space to 2 or 3 dimensions, preserve the distance between the solutions, have a way to visualize the fitness, and allow visualization of the changes on the population over time. The way Shine (1997) accomplished this was by using the binary representation of the
In the work presented here, the binary representation of the solutions is converted to a real number, and this allows a better spatial visualization of the distribution in the solution space. Moreover, it is important to highlight that a single bit in the binary representation has very different effects on the real number, depending on its position, and therefore on the agents behavior. This entails that in the real numbers space, the similarity between solutions is more likely to mean a similarity in the behavior of the solutions than in the binary representation.
One way to overcome these two problems is the use of Self-Organized Maps (SOMs). SOMs are a type of non-supervised
An SOM has certain characteristics that make it ideal as a tool to visualize the behavior of populations within the solution space. First, there is no need to know beforehand how the solutions are distributed in the solution space. It can be used to reduce the dimensionality, from an n dimensional solution space to 3 or 2 dimensions allowing the plotting of the distribution of evolved solutions. Given the geometric relationship between the nodes of the SOM, similar solutions get clustered together, mapping the solutions in a 2- or 3-dimensional space while preserving the spatial relationship between them in the original n-dimensional space. It doesn’t need for the solutions to be coded in a specific way. Finally, it’s possible to plot the performance of each individual in the SOM by using a color or heat map.
SOMs have some advantages over other popular methods for dimensionality reduction, such as UMAPs and t-SNE, to plot the solution space. One such advantage is that SOMs preserve more local structure and neighborhood relationships in the data because they use a fixed grid of neurons that are updated based on their distance to both the current input and the neurons respective neighbors. UMAPs use a stochastic optimization process that can introduce some randomness and variability in the low-dimensional representation, especially for small datasets or high-dimensional spaces as it is our case.
Another advantage of using SOMs instead of UMAPs and t-SNE for dimensionality reduction is that SOMs can provide more interpretability and insights about the data, as SOMs assign each data point to a specific neuron on the grid. The discrete representation in the SOM allows to know the prototypical weights of the artificial neural network of the individuals that occupy the same point in the SOM. In contrast, UMAPs do not assign each data point to a discrete cluster or region but rather project them onto a continuous low-dimensional space. Further, SOMs can preserve more global structure in the data, while t-SNE tends to focus on local structure and may distort the distances between clusters. Finally, SOMs are better than t-SNE in that SOMs are faster and more scalable for large datasets and high dimensions, while t-SNE is slower and more computationally intensive.
5.1. SOM training
To train the SOM, the genotypes of the individuals were used, that is, the training was performed using vectors with 24 real values which represent the weights of the ANN for each individual. Given that each real value was codified in 4 bits, this leaves us with 296 possible solutions. The training of the SOM is as follows: 1. 2. 3. 4.
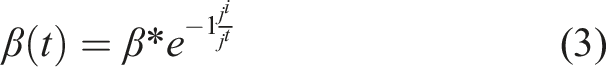
Neighborhood function, β, is the initial neighbor value β = 5, j
i
is the number of the current iteration, and j
t
is the total number of iterations. 5.
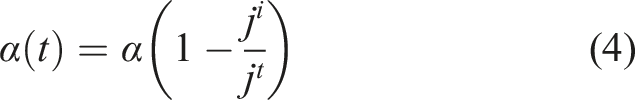
Learning rate function α has a preset initial learning value (α = 0.5), j
i
is the number of the current iteration, and j
t
is the total number of iterations. 6.
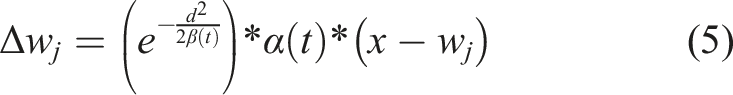
Learning function, w, is the vector of weights from the node to change, d is the Euclidean distance between the wining node and the node to change, in the SOM space, x is the training vector, and α(t) is the current learning rate. 7. The steps 3 to 6 are iterated until the 35 million training vectors are used to train the SOM.
5.2. Plot the population using the SOM
The trained Position of each individual of one run of the genetic algorithm at different stages of the evolutionary process (Food 2.0 condition). The solution space is represented by a cubic 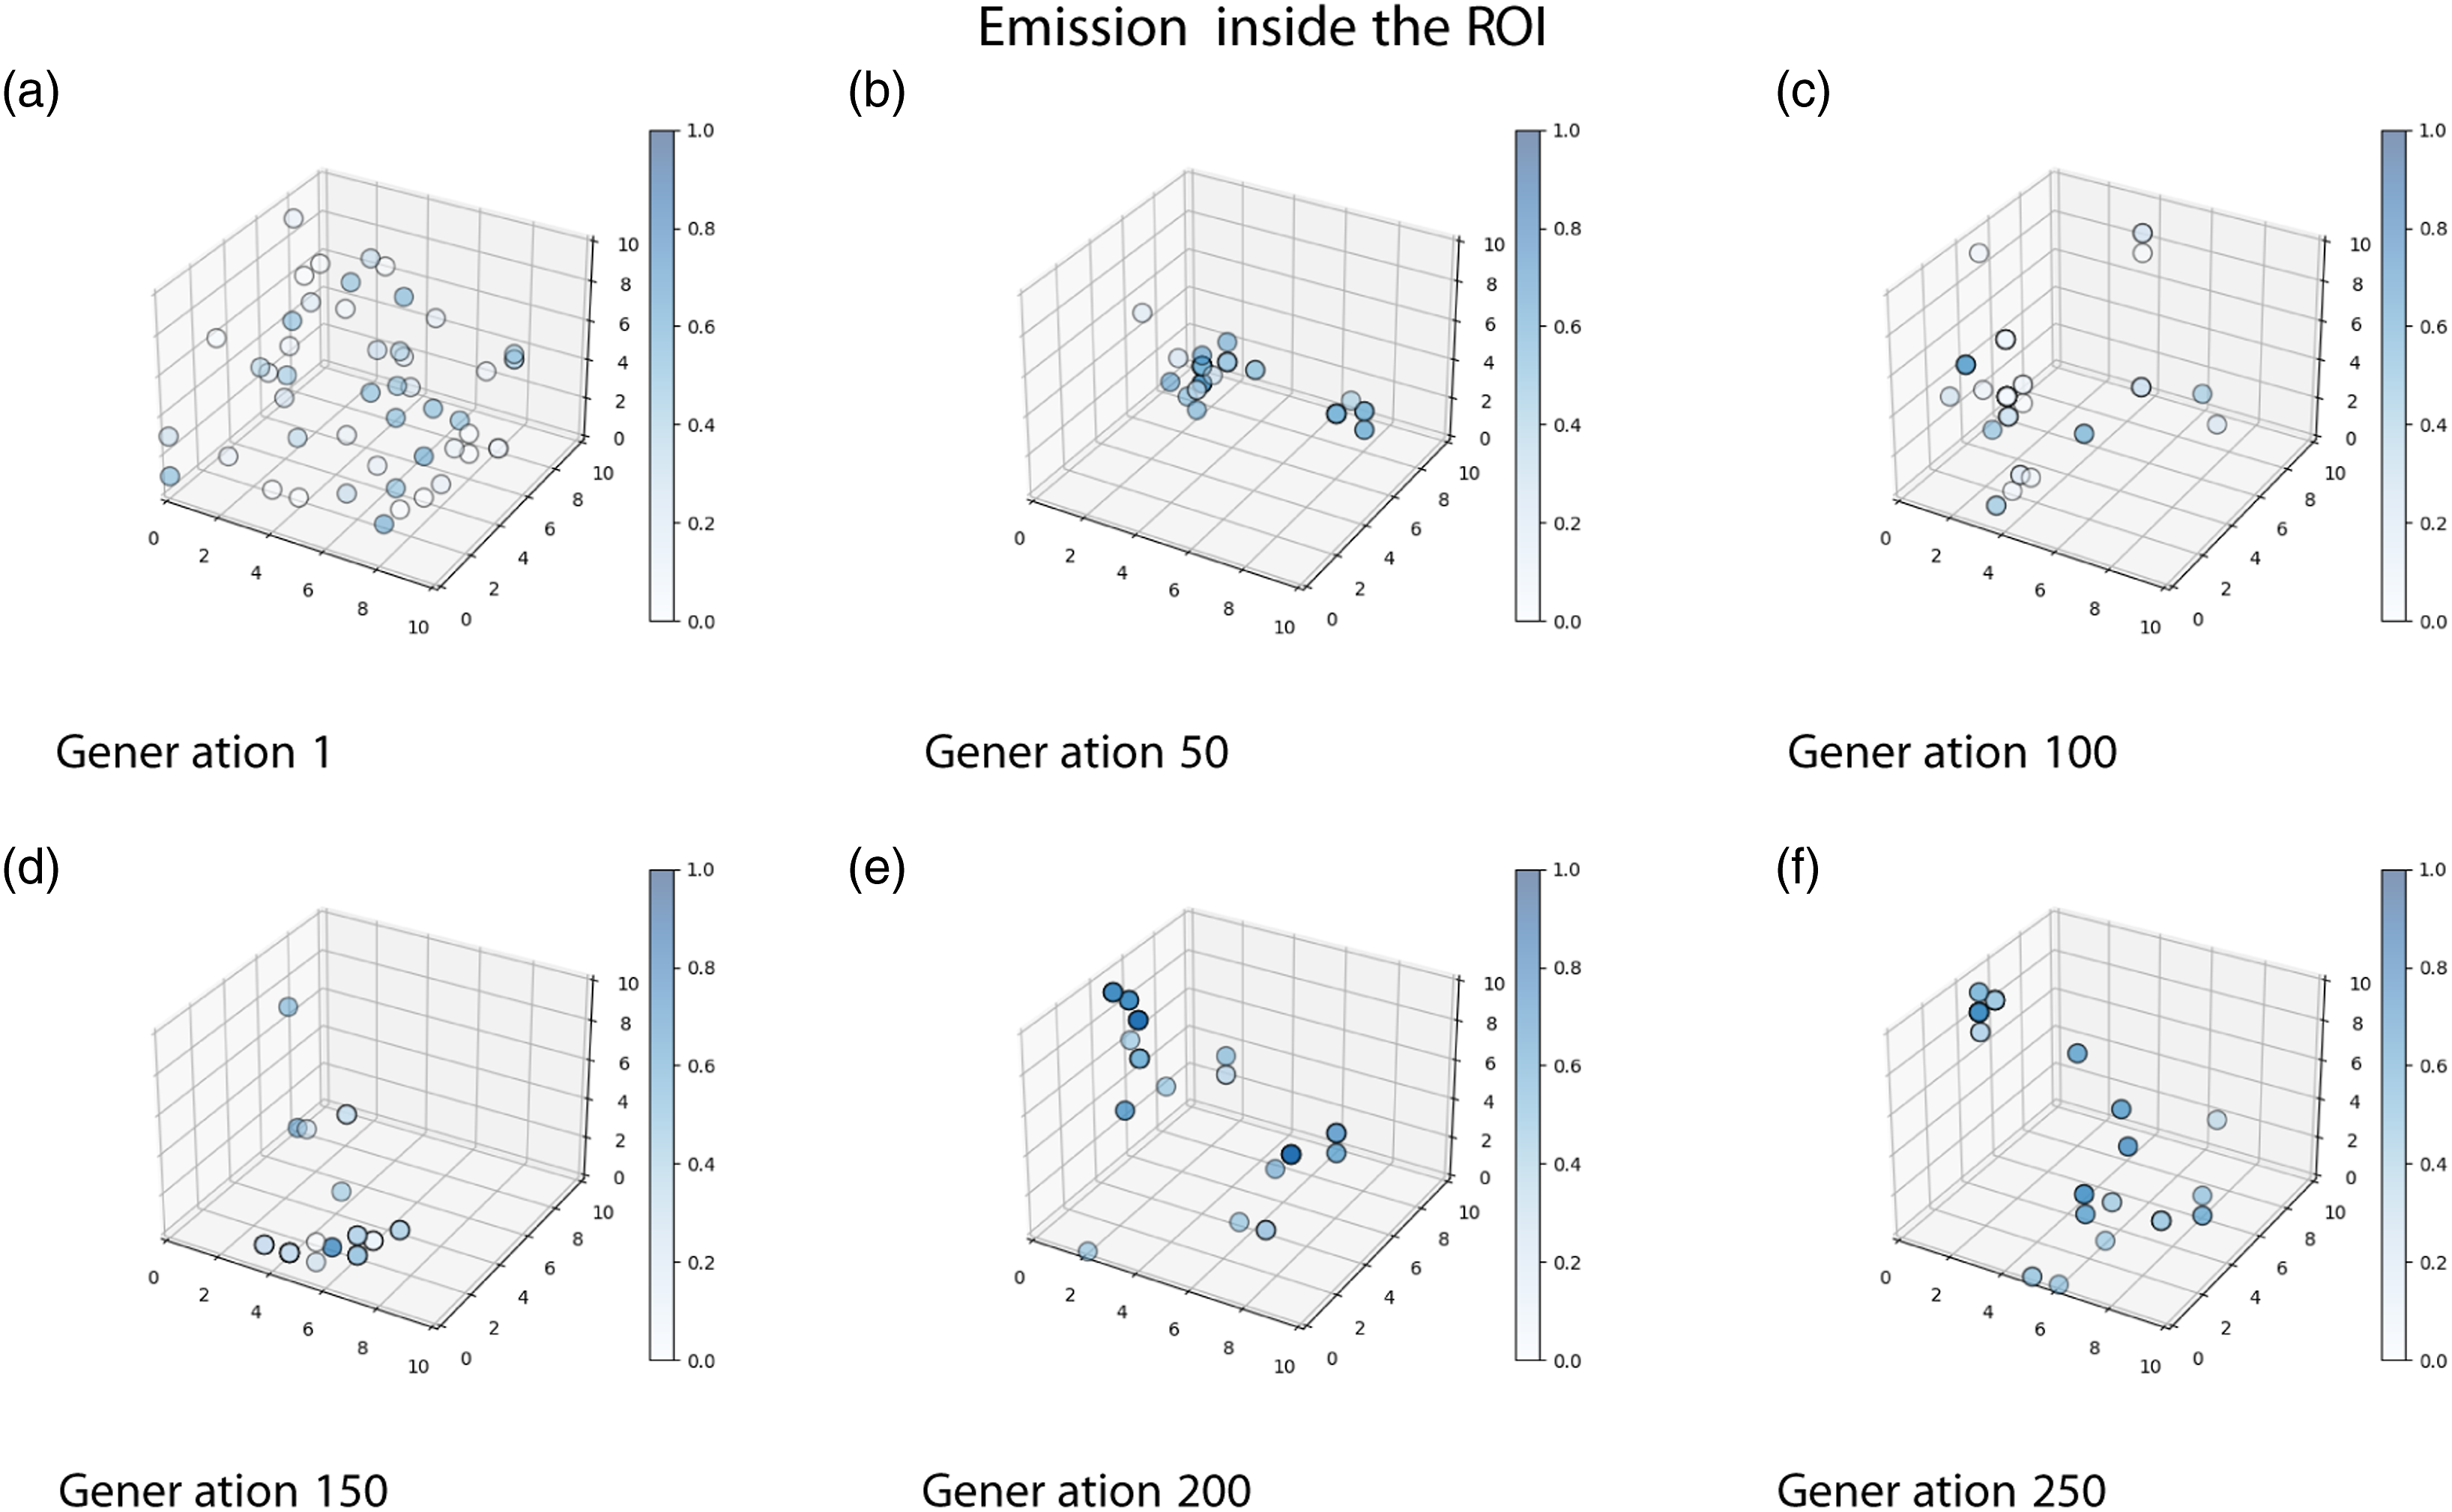
As can be seen in Figure 6(a) in the first generation of the genetic algorithm, the individuals were scattered randomly across the solution space. This is to be expected, as the individuals of the first generation were randomly generated. As the generations passed, a clustering process can be observed. However, it is important to note that even when there were relatively clear clusters, individuals do not converge in only one cluster or area within the solution space.
This indicates that there were always alternative solutions (phenotypes) in the genetic pool, fighting for survival. The fact that multiple phenotypes survived during the evolutionary process produced very interesting dynamics in the movement of populations across the solution space because even when the individuals seem to have converged in two clear clusters (see Generation 50 in Figure 6(b)), the algorithm doesn’t stagnate at that point and continues to explore new areas within the solution space. This occurred in all the runs of the genetic algorithm, and at the last generation of the genetic algorithm all of the runs maintained between 2 and 5 clear clusters.
The phenomenon of continuous movement within the solution space is the result of a co-evolution process, given that the success of any given strategy strongly depends on the strategies of the other individuals. For example, a strategy like not ever emitting light may be a good strategy if there were individuals in that population that emitted light indiscriminately, but if there was a significant number of individuals that evolved to be altruistic only between them, then the strategy of never emitting light would be detrimental for the individuals who performed it.
A wide variety of light-emitting conducts can be observed in the solutions found by the genetic algorithm. This is shown in Figure 7, where Generation 250 of one run evolved under the Food 2.0 condition is shown in the solution space. The blue color shows the percentage of time that the individuals emitted light inside the Light emission levels inside the 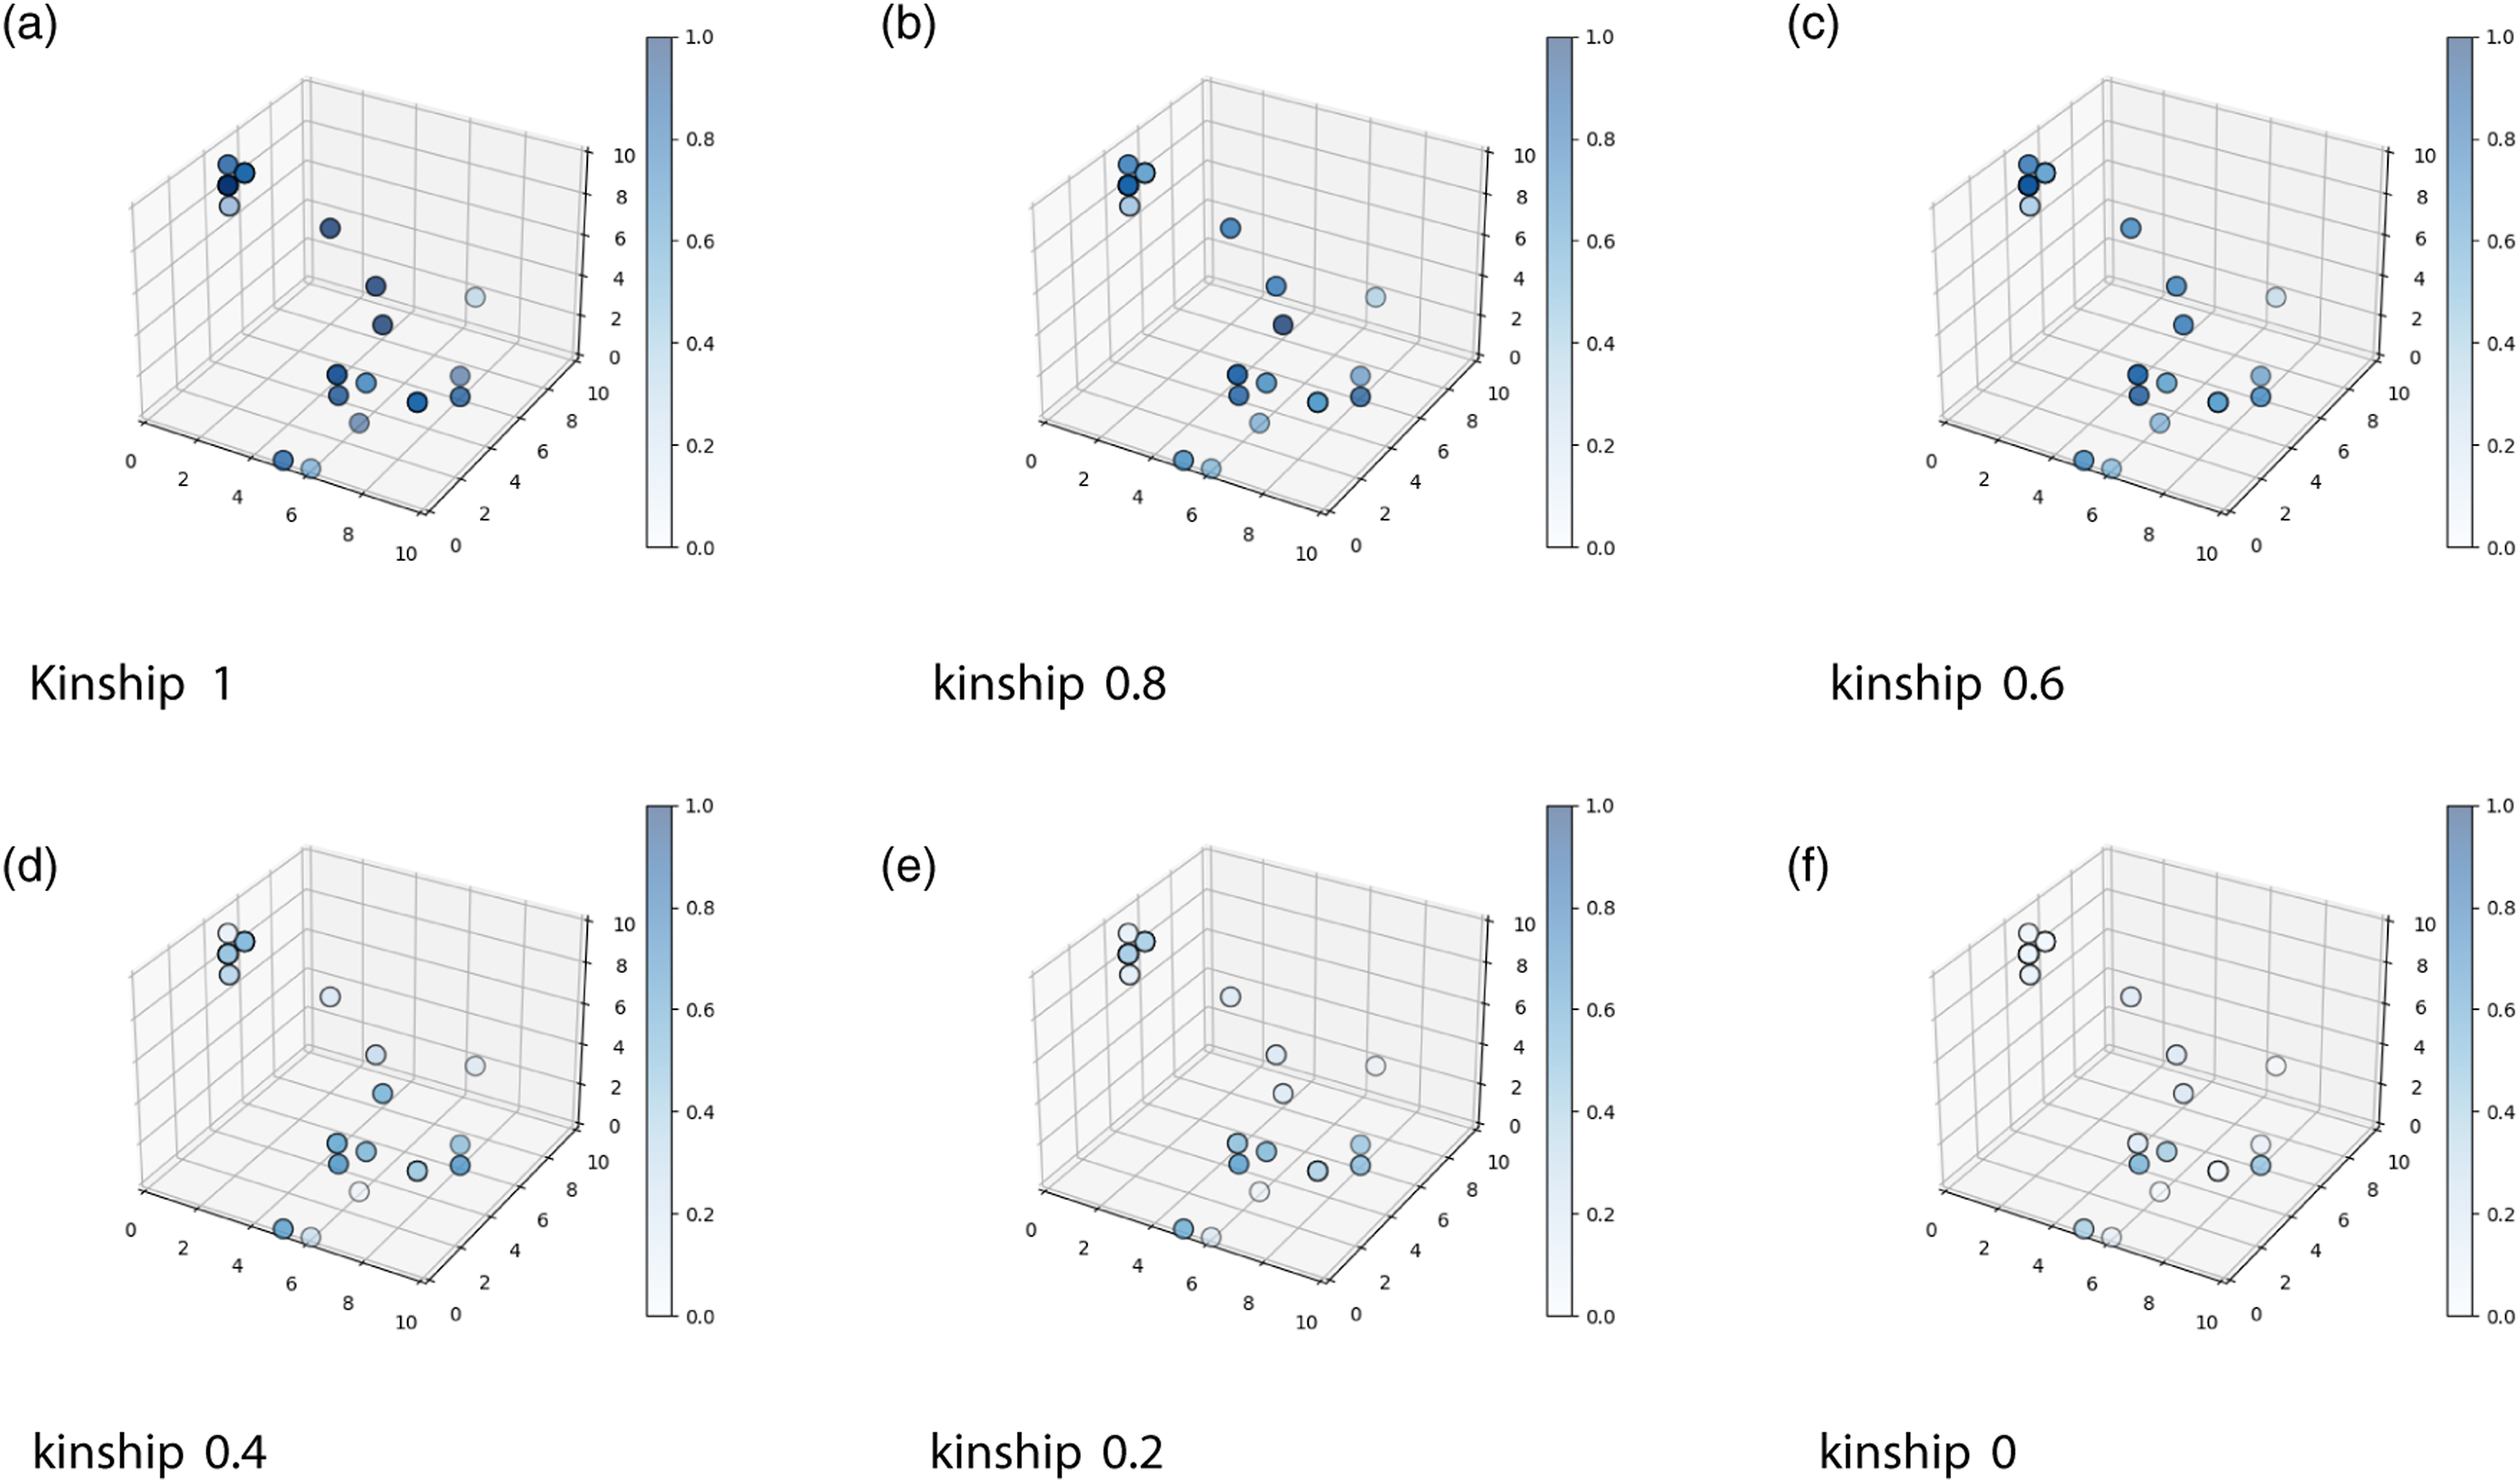
Throughout the evolutionary process, evolutionary pressure was constantly changing depending on the behavior of the individuals who belonged to the population. This phenomenon is similar to that found in the co-evolution of predator/prey behaviors (Nolfi, 2012; Nolfi & Floreano, 1998) when competition between alternative solutions occurs (Sims, 1994), generating what is called an “open-ended” evolutionary process (Nolfi, 2012), where the evolution process does not stop and enters into a stable cycle.
6. Discussion
The work presented here shows how a possible initial random cue can become a useful signal during an evolutionary process (Scott-Phillips, 2012). The first generations of all runs presented here show random emission of light, given the random initial conditions of the evolutionary process. This cue becomes a signal for all conditions, as is clearly shown by the results from the light-blind condition test (Section 3).
In contrast to the previous works, the results presented here show that it is possible to evolve altruistic behaviors in artificial autonomous robots using heterogeneous populations and individual selection levels, without manipulating the kinship during the evolutionary process. This was possible by modeling kin selection and kin recognition mechanisms, as this produced the emergence of altruistic behavior on almost all the evolutionary conditions where the application of the Hamilton rule generated positive results. The first four Food Conditions show clearly how the signaling for food is highly dependent on the perceived kinship. In the last two conditions, food is so scarce, that the evolved behavior is to not signal for its presence, no matter the perceived kinship.
An interesting phenomenon to mention was the apparent increase in light emission in the 0 kinship condition within group Food 1.2 (even when there were no statistical differences). We explain this phenomenon as a consequence of the fact that during the evolutionary process, the kinship level rapidly increased over 70%. From this point on, the robots rarely shared the arena with other robots with a kinship level below 50%. This quick convergence of the genomes during the evolutionary process was the consequence of the limited number of genotypes that could perform well at any given task compared to the number of all possible genotypes.
Furthermore, the suppression of signaling inside the ROI in this condition was better for the robots according to the Hamilton rule. So, the evolutionary process could have promoted the use of the kinship value received by the neural network as a suppression signal. When the kinship value was reduced to zero in the altruistic test (Section: Test for the level of altruism), the suppression signal disappeared. Our claim does not contradict the predictive power of the Hamilton rule, rather it shows the known capacity of evolution and genetic algorithms of taking advantage of environmental regularities in very unexpected ways (Lehman et al., 2020).
Certainly, there are shortcomings in our capacity to show the predictive power of the Hamilton rule concerning the quantity of food present in the environment because, even when we evolved our robots under 6 conditions of food, we cannot make any assumptions about how the quantity of food available could originate an increase or a decrease in the altruistic behavior once this behavior has already evolved. In this sense, further research is needed to determine how the prevalence or scarcity of food correlates with the altruistic behavior when individuals evolved in an environment where the quantity of food is constantly changing.
In general, our results show that kin selection and kin recognition mechanisms appear to have a fundamental role in the emergence of altruistic behavior, and if such behavior remains in the genetic pool of heterogeneous robots, providing strong evidence of the Hamilton rule predictive power.
Finally, it has been shown how useful an SOM can be for the visualization of the solution space and the movements of individuals throughout the evolutionary process. The SOM is capable of reducing the initial 296 dimensionality of the solution space, to a 10 × 10 × 10 space, which can be further characterized as an emission map. The clustering shown in Figure 6 shows that the evolutionary algorithm converges not in one single solution to the problem but various. We are convinced that this tool can be used to further investigate the behavior of individuals and solutions to problems with high dimensionality. In particular, we are doing further research in terms of the clustering occurring during the evolutionary process and how this relates to better conducts of the individuals.
Supplemental Material
Supplemental Material - Emergence of altruistic behavior in heterogeneous populations of artificial agents by evolution of kin discrimination mechanism
Supplemental Material for Emergence of altruistic behavior in heterogeneous populations of artificial agents by evolution of kin discrimination mechanism by Manuel Pardo, Alejandra Ciria, and Bruno Lara in Adaptive Behavior.
Footnotes
Declaration of conflicting interests
The author(s) declared no potential conflicts of interest with respect to the research, authorship, and/or publication of this article.
Funding
The author(s) received no financial support for the research, authorship, and/or publication of this article.
Supplemental Material
Supplemental material for this article is available online.
About the Authors
References
Supplementary Material
Please find the following supplemental material available below.
For Open Access articles published under a Creative Commons License, all supplemental material carries the same license as the article it is associated with.
For non-Open Access articles published, all supplemental material carries a non-exclusive license, and permission requests for re-use of supplemental material or any part of supplemental material shall be sent directly to the copyright owner as specified in the copyright notice associated with the article.