
Abstract
Interestingly, the interactions between members of a social group and across people of different social groups often happen through mutual understanding and reciprocate behaviour by means of gestures or eye contact. A controlled laboratory experiment is used to test the effect of interactions between members of a social group and across social groups on the walk dynamics of people. This study tries to discover the trade-off made by people between the need to communicate/interact between group members and the need to avoid collision with opposing pedestrians in a bidirectional flow. Thirty adults participated in a series of controlled experiments. The individuals and group characteristics were compared to study the effect of social groups. Spatial patterns/group formations, average walking speeds, and deviation from the desired direction of motion were assessed. The analysis shows that time to cross the platform is the least when triads adopt the river and inverted V group formations. In contrast, V and line-abreast group formations require slightly more time and are better suited to promote interactions between the group members. Irrespective of the initial formation adopted by participants, there is a higher tendency for the groups to shift to river formation or inverted V formations. This may be a result of the higher group speeds observed in the Inverted V and river formations, which accelerates their progress in the direction of motion. The understanding of walking dynamics of social groups from this study can enable better planning of pedestrian facilities and crowded events.
Highlights
• Studied trade-offs made by people between the need to communicate/interact between group members and the need to avoid collision. • There is a significant difference between the mean velocity of Inverted V and river formations with Line-abreast formations. • Inverted V and river formations are better strategies if the interest is in traversing the corridor quicker. • A higher transition probability is observed for moving to the river from both V and inverted V formations. • Group cohesiveness and level of interaction decide the formation and transition of formations.
Introduction
Spatio-temporal interactions between pedestrians often result in collective behaviour such as spontaneous lane formation, clogging and arching at bottlenecks, staggered walking, or stripe formations. In a single channel with a bidirectional pedestrian flow, pedestrians must avoid collisions with those moving in the other direction and keep up with their group members. Interestingly, the interactions between members of a social group and across people of different social groups often happen through mutual understanding and reciprocating behaviour through gestures or eye contact. Circumstances such as evacuations from a confined building or space are examples of high pedestrian interaction among people. In addition, such situations warrant that people try to ensure the safety of their group members as well. The proxemic behaviour of people may influence the walking dynamics of people (Gorrini et al., 2015), especially if the space is constrained by the infrastructure. Therefore, it’s crucial to understand the effect of social groups on the behaviour of pedestrians and the overall dynamics in narrow corridors. By social groups, we refer to groups of people who have some social ties or share a bond, like family, friends, and colleagues (Moussaïd et al., 2010). Social groups exhibit more social cohesion than a collection of individuals (physical groups) and have a sense of togetherness and mutual awareness.
In this study, we aim to examine the group interactions that significantly affect pedestrian behaviour in terms of the walking strategies they might adopt to avoid collisions with opposing pedestrians and keep pace with group members. We sought to assess the impact of being a part of a social group on the walking dynamics of people in a bidirectional flow by testing two scenarios – a) the first scenario where each subject is independent/a single pedestrian and b) the second scenario where each subject is assigned to a group. In a bidirectional flow, where group members also must look out for opposing pedestrians, group patterns/formations are likely to change over time, which has not yet been explored. Evaluating the spatial formations/group patterns adopted by subjects and if they change these formations over time could yield useful insights into the trade-offs made by people while walking. Finally, we attempt to quantify the relation between the time required to cross the corridor and the spatial patterns adopted by subjects. Presumably, understanding social groups in bidirectional flow would lead to designs that enable safety (Gorrini et al., 2017) and greater use by the potential beneficiaries, which can help improve pedestrian facilities and ensure crowd safety.
It has been reported that the walking speed of pedestrian groups tends to decrease with an increase in group size (Moussaïd et al., 2010; Köster et al., 2011; Gorrini et al., 2015), that egress time during evacuation increases with social groups (Bode et al., 2015). Turgut and Bozdag (2022) ran simulations using a modified social force model and conclude that leader-centric behaviour outperforms group-centric behaviour considering the evacuation time of small groups. However, with multiple exits, group-centric behaviour gives lesser evacuation time than leader-centric behaviour. Socially interacting groups are also found to walk in a more ordered manner (Zanlungo et al., 2019). Large groups of people have been proven to behave in an orderly and cooperative manner and often extend help to others (Sieben et al., 2017). However, such generalizations cannot be extended to small groups in constrained situations. Therefore, it is not just the presence of groups, but rather how they behave – are they cooperative or competitive, communicative or inhibited, and have intense or muted interaction with group members and outsiders which influence the inferences we draw from such studies.
Several approaches have been proposed over the years to understand and model crowd dynamics. A detailed and critical review of the studies on pedestrian models that account for group behaviour can be found in Cheng et al. (2014) and Nicolas and Hassan (2023). It is seen that most of the initial models treated the crowd as an agglomeration of pedestrians, without accounting for the social interactions that happen in groups. For instance, the original social force model predicts the motion of a pedestrian as governed by three kinds of social forces – a driving force motivating the pedestrian to reach their goal, a repulsive force from other pedestrians and a repulsive force from boundaries/obstacles. Another popular approach is based on cellular automata (Blue & Adler, 2020; Burstedde et al., 2016; Köster et al., 2011). In this model, the entire space can be viewed as a grid of cells. Each cell can be occupied by at most one pedestrian, in most of the cellular automata models. The rule set applied to each cell is used to predict the position of a pedestrian based on the state of the cell and its neighbours. Köster et al., (2011) use a lattice of hexagonal cells, where each cell could either be empty or occupied. The set of rules used to update the movement of a pedestrian is derived from electrodynamics. Each pedestrian is treated as a negatively charged particle and exits as a positive charge. Therefore, pedestrians get repelled by like negative charges and are attracted to the positive charges. Several agent-based pedestrian models have also been proposed with agent characteristics including the preferred gap size, personal space preference, desired walking speed, lateral placement, etc. (Kukla et al., 2001; Willis et al., 2000). Later, modifications were proposed to these existing models to include the group dynamics of pedestrians. These range from simple heuristic-based models/measures to modifications in the Social Force model (Moussaïd et al., 2010; Xie et al., 2021), cellular automata (Köster et al., 2011; Ma et al., 2022)) or agent-based models (Saeed et al., 2022) to model the tendency of group members to stay together. Moussaid et al., (2010) model the social interaction of the group members by considering the gazing direction vector, which captures the need of group members to adjust their heading to facilitate verbal exchange. Koster et al. (2011) instead impose no repulsive forces between group members and attractive potential for the leader within each group. Zhang et al. (2019) use a hybrid version of the social force model and shoulder rotation model to simulate crowd movement in both pedestrian flow by simultaneously modelling the evading and pushing behaviour. Ma et al., (2022) explore how groups, cooperation behaviours and the intensity of their interaction influence evacuation efficiency by combining a cellular automata model with game theory concepts. However, very few models explicitly account for preferred spatial structures among groups or consider the dynamics of these formations while walking.
When people are part of a social group, they adopt several walking strategies to stay together. This could include adjusting their walking speed or stride length to match the other members of the group or walking in specific formations to facilitate easy communication between group members (Costa, 2010). Evaluation measures such as offset angle (Xiaoge et al., 2014), walk path (Xiaoge et al., 2014), detour coefficient (Hu et al., 2020), and splitting ratio have been proposed to measure the various aspects of group dynamics. Another interesting walking manoeuvre of pedestrians in the presence of social groups in a bidirectional flow is collision avoidance or evasive behaviour. Karamouzas and Overmars (2010) used a velocity-based approach for simulating collision avoidance manoeuvres of pedestrians. They conducted an experimental study in a square room, and pedestrians were asked to walk diagonally towards the room’s opposite corner to develop a visually compelling realistic collision avoidance model for virtual characters. Pedestrian interactions are explored based on the predicted time to collision and deviations in the velocities. Fujiyama and Tyler (2009) investigated the microscopic collision-avoidance behaviour of pedestrians on stairs and found that this behaviour is different on plains and stairs. On stairs, pedestrians avoid the collision by choosing an empty lane from the beginning of a flight. They called this ‘lane-collision avoidance’. It is also noted that the type of staircase and movement on the right or left also affects the direction of collision avoidance. Along similar lines, Yuan et al. (2017) investigated how the relative position of pedestrians can influence their movement preferences. They propose a collision-avoidance force based on the social force model, which considers potential conflicts.
As mentioned before, pedestrians, either in groups or alone, tend to change their walking direction to avoid collisions with oncoming pedestrians. How does the presence of friends, colleagues, or family influence these decisions? Ideally, such situations should be observed in natural environments (walkways or footpaths, or recreational facilities). However, identifying social groups from video data is highly challenging (Ge et al., 2012). Some of the studies in this direction use visual clues such as hand holding, verbal communication, body orientation, proximity, and the presence of children to identify social groups from video data (Costa, 2010; Gorrini et al., 2015; Aparna et al., 2020).
Recently, controlled laboratory experiments have been proposed as an alternative way to collect data on pedestrian and crowd behaviour (Daamen & Hoogendoorn, 2003; Daamen, 2006; Hoogendoorn et al., 2007; Zhang & Seyfried, 2014; Sieben et al., 2017; Adrian et al., 2020). These experiments are designed to control for some exogenous factors, for instance, weather, which is impossible while collecting data from natural environments. It also gives the analyst the flexibility to vary certain variables and test their effect on the variable of interest. For instance, the density/number of pedestrians per run is varied over the different scenarios to understand the impact of density on pedestrian speed. Yet another example is varying the width of bottleneck/exits as a control variable (Adrian et al., 2020).
Next, we focus on studies which exclusively study the impact of social groups and the spatial structure of the groups. Costa (2010) investigates the spatial behaviour of groups during a walk and tries to associate walking speed with group size, composition, and spatial arrangement of groups. With the increase in the number of people, walking groups try to adopt an inverted U-shape (Frohnwieser et al., 2013). Moussaïd et al., (2010) investigate the change in the spatial pattern of groups with density and observe that at low densities, people walk horizontally. As density increases, the group configurations change to a V-shape pattern to enable better communication. However, this negatively influences the flow due to the ‘non-aerodynamic’ shape. Gorrini et al., (2015) report more line-abreast formations in dyads and V-like formations followed by line-abreast and river formations in triads using field data collected from a walkway. They were able to identify significant differences in walking speed across singles, couples, triples and groups of four people through two-tailed t-tests. Hu et al., (2021) also emphasize the paucity of controlled experiments to study the effect of social groups in non-panic situations. In this regard, they present the results of the controlled experiment with varying levels of dyadic social groups in unidirectional flow. They conclude that the impact of social groups at a macro level is insignificant, whereas it is important to consider their impact at a micro level. (Ye et al., 2021) note that only one member of the dyad actively tries to resolve conflicts by either getting closer to their group member, rotating their body, or adjusting their spatial alignment from line-abreast to diagonal or river pattern. However, the trade-offs that people might be doing between the degree of communication and ease of navigation are still not clear, especially for groups with more than two members.
In short, limited studies have explored the differences across formations or changes in the spatial structure of groups over time. Exploring the transition of these spatial structures would help us in uncovering the balance people attempt between maintaining cohesion in a group and avoiding collision with others (Hu et al., 2021). In this context, we hypothesize that inter-group and intra-group interactions and the resultant spatial arrangement adopted influence walking speed. The present study attempts to investigate the dynamics of these interactions by observing social groups over time and correlating the effect of the transition of spatial formations with walking speeds.
The data to study the impact of social groups can be taken either from field or through a controlled laboratory setup. There are issues and challenges associated with both methods. In the former, identifying social groups from the field poses difficulty to the analyst, especially groups of more than two members (Zanlungo et al., 2019). As noted by Köster et al., (2011), ‘How do crowd modellers know what makes a group or even a crowd’? Likewise, there are difficulties with regard to camera positioning, infrastructure-related challenges and getting informed consent. In the latter approach, since social groups are known apriori, there is no difficulty in allocating people to social groups. Also, issues related to camera positioning or volunteer coordination are much more reduced.
Therefore, in this work, laboratory experiments were conducted under controlled conditions to collect data on group behavioural dynamics. This study contributes to the existing research on group behaviour through the insights derived from the experiment involving a bidirectional flow of pedestrians in social groups in a narrow corridor. It establishes that the group members adjust the group shape or formations through a trade-off between the degree of communication vs. ease of navigation. It is seen that most groups tend to transition from line-abreast or V formation to inverted V and river formation. This is perhaps because of the increase in speed and better progress in the direction of motion in the latter formations.
Data
This section describes the controlled experiment setup adopted to understand the stated objectives. A schematic diagram of the experimental design is shown in Figure 1. The entire experiment was conducted in an L-shape room. Two holding areas (waiting areas) were arranged on either side of the corridor to hold the participants moving in either direction. The entire length of the corridor was 7 m, out of which the measurement area is as demarcated in the schematic diagram. The dimensions of the measurement area (4.2 m) are decided based on the camera’s field of view and the height at which the camera is placed. Schematic diagram of the experimental setup.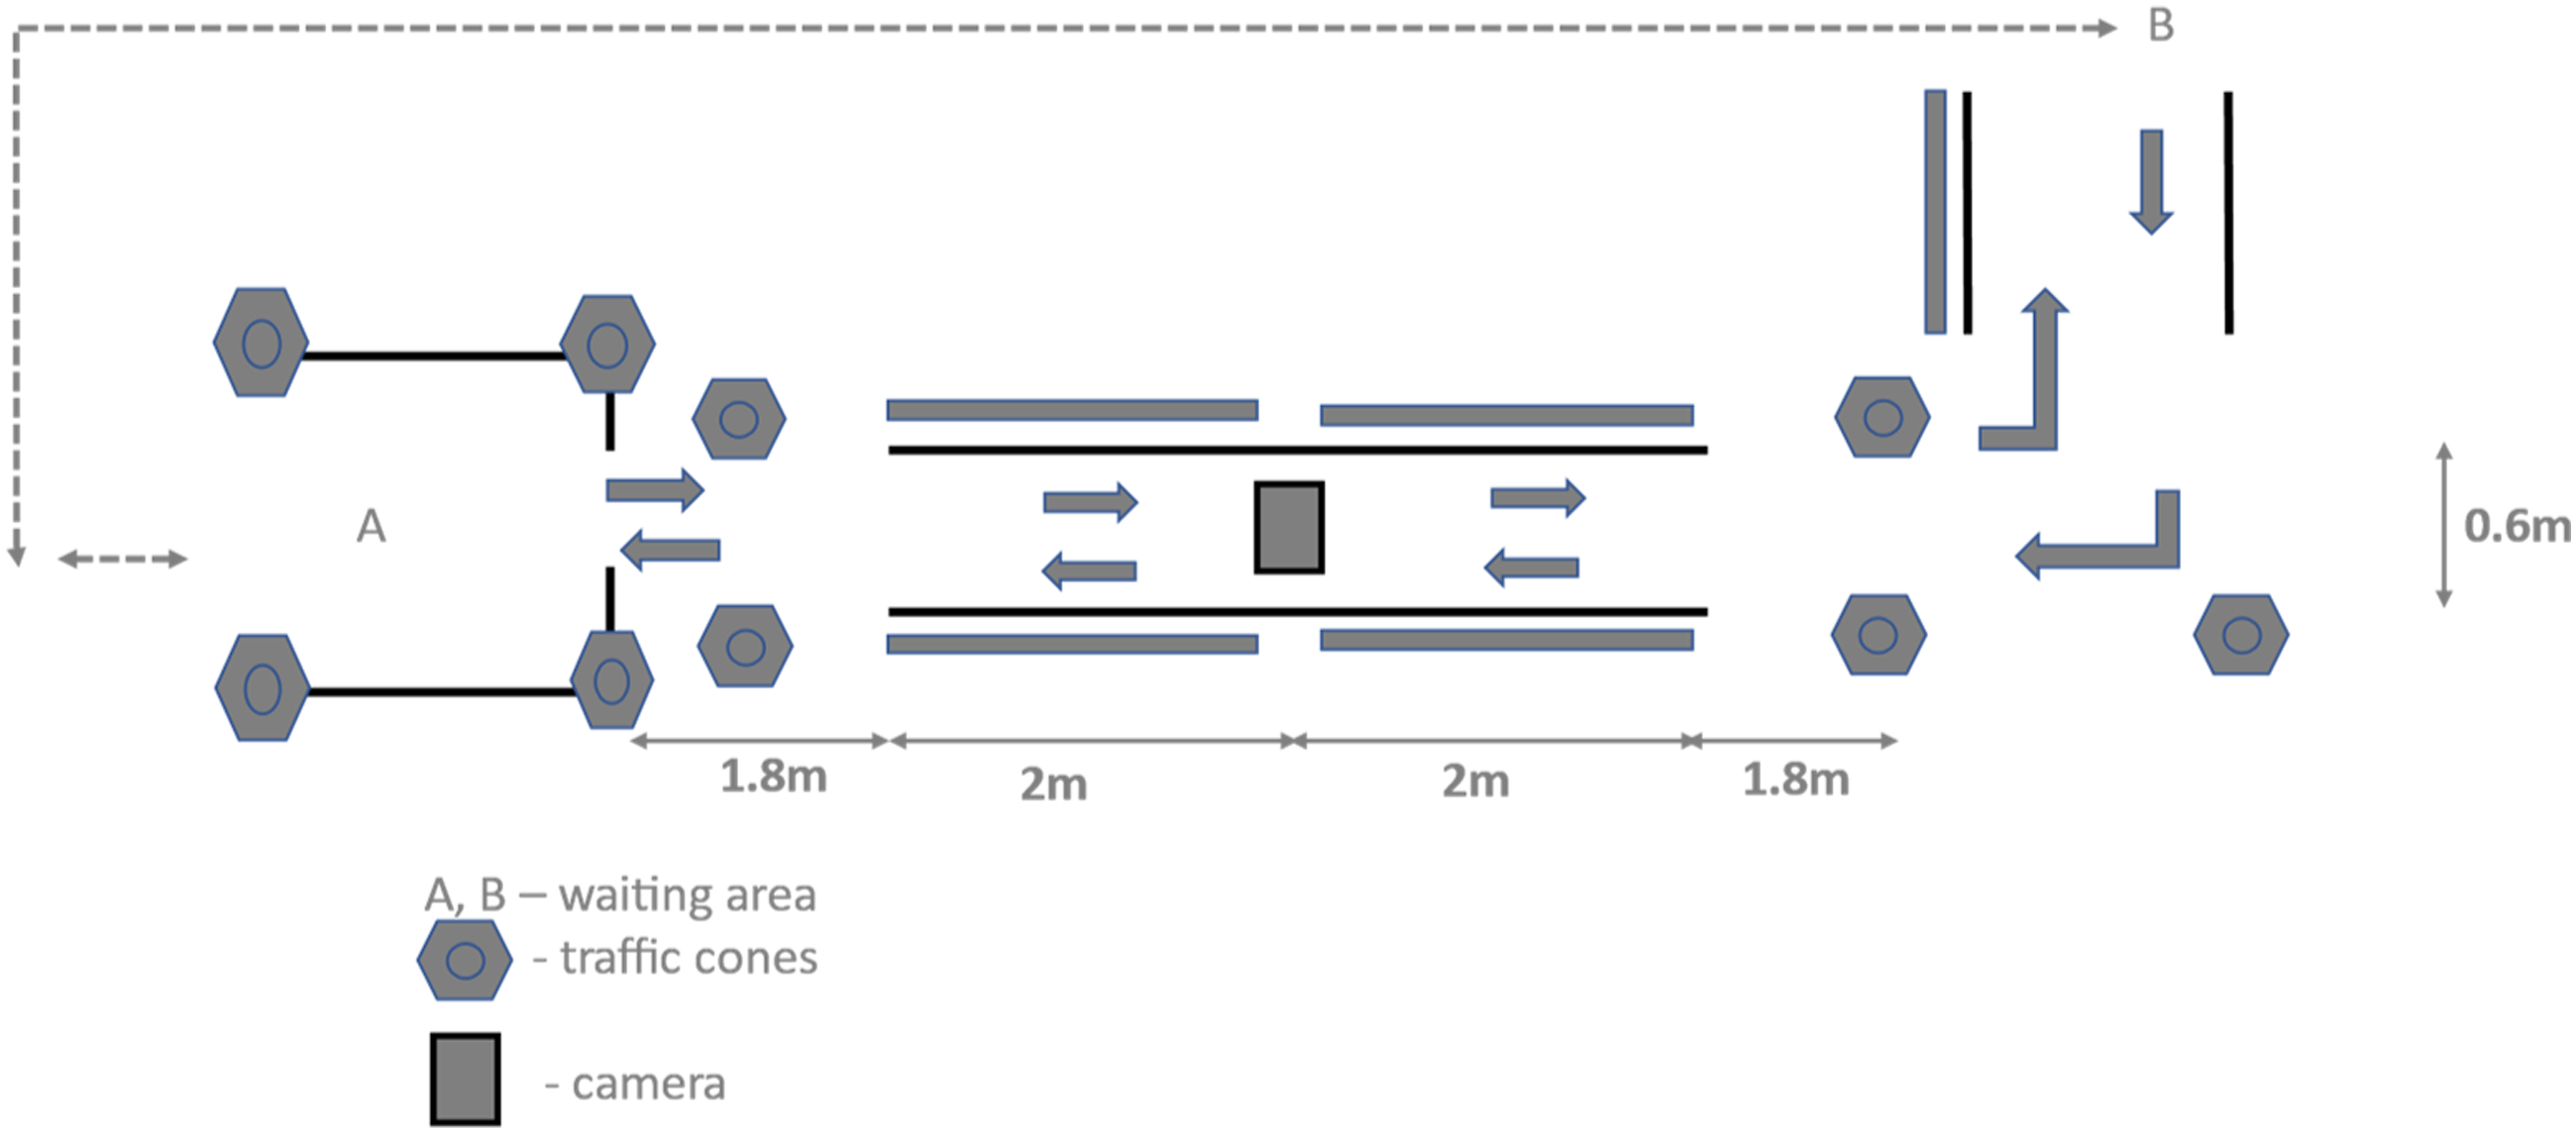
A longer corridor was marked to ensure that the participants adopt their natural gait. The participants entered the room and were distributed randomly to the two holding areas initially. Before the experiment, we did two trials to ensure that the participants understood the instructions properly. At the beginning of each run, a card indicating the run would be shown to all the participants. The experiment happened in two phases – a) without social groups and b) with social groups. The participants were asked to walk normally through the corridors after the ‘ ⁃ No overtaking is allowed in any of the experiments. ⁃ Participants should not cross over traffic cones or barricades. ⁃ It was recommended not to have phones during the runs. ⁃ Participants were asked to wear the white cap so that they could be easily tracked by marking their head positions as a top-down facing camera was used for data collection. ⁃ Participants were asked not to wear white shirts/t-shirts during the experiment to avoid confusion while marking pedestrians during data extraction.
A total of 30 (20 males and 10 females) student volunteers agreed to take part in the experiment. The participants were adults in the age group of 20–40 years. The participants were then divided into three sets consisting of 10 members each. The same set of participants was required to take part in both phases of the experiment (Wei et al., 2022; Ye et al., 2021). The group behaviour experiment was designed to capture small social groups like friends or families. For the second phase of the experiment, where the participants were asked to walk in social groups, the participants were allotted into groups of 2 first. The participants were primed as follows: ‘Assume that you are walking with your friends and would like to stay close to each other. Please walk and behave accordingly’. To control for the effect of previous social ties, we instructed the participants to not communicate with pedestrians outside the group and to maintain close contact or interaction with their respective group members (similar to Hu et al., 2021). The members of a group were also given time to interact with each other before the start of the experiment. While conducting the controlled experiment, instructions were given to assume each one to consider the group behaviour as instructed. It is therefore assumed that for all practical purposes, the participants would temporarily disassociate from their previous relationships (acquaintances) for the benefit of the conduction of the experiment. This is also monitored and ensured in principle through a mock demonstration and the experiment.
Details of Experiment Runs.
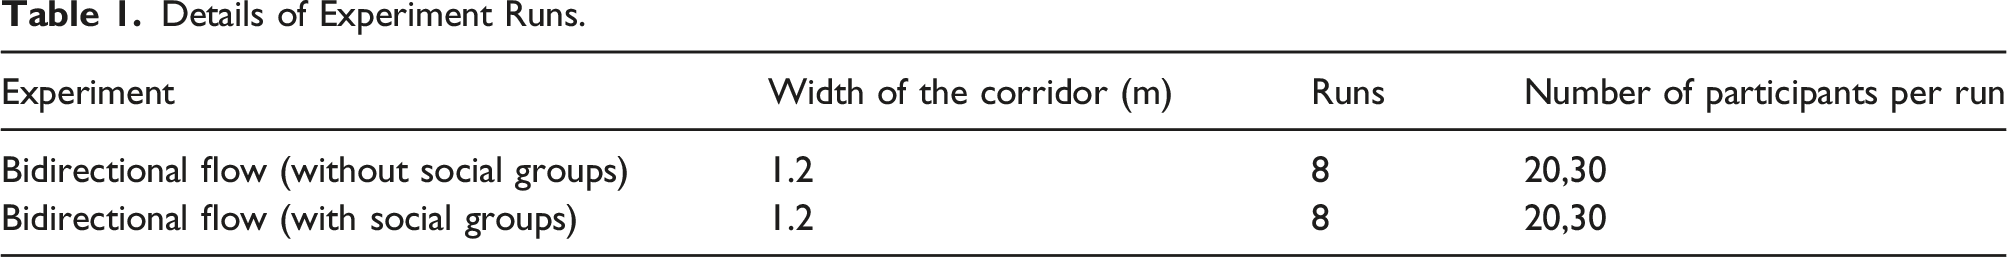
This was conducted with 20 participants who were split into two batches of 10, who were asked to walk in opposite directions through a single channel of 1.2 m width to simulate the bidirectional flow. This scenario was repeated for four runs.
This was conducted with 30 participants who were split into two batches of 15 walking in opposite directions for four runs.
In this scenario, 20 participants were split into groups of two randomly. Hence, ten groups were formed. The experiment was conducted with five groups walking in opposite directions. This experiment was also conducted four times.
For this, 30 participants were split into ten groups of three participants each. Then they were asked to walk in a bidirectional flow with five groups in each direction for four runs.
Method
As mentioned, the experiment was performed with 4 runs with each varying group size. The data was collected using a top-down facing GO-Pro Hero 4 with a resolution of 1280 × 720, resulting in fisheye distortion. The data was extracted using semi-automatic tracking software IPS (IISc PedSense, a pedestrian data extraction tool developed by the authors), in which the video was imported and converted to 5 fps. The pedestrian head positions at start and exit locations were marked manually, and linear interpolation was done to generate trajectory. Wherever discrepancies are there between the interpolated trajectory and the actual trajectory, the data points are corrected manually. The pixel-based trajectories were then transformed into real-world trajectories using a projection matrix similar to the studies by Cheng et al., (2019). IPS calculates the projection matrix based on the Region-Of-Interest (ROI). ROI is a quadrilateral marked in an image that represents a rectangular stretch in the real world for which the real dimensions are known. The ROI was marked with the same dimensions as the platform (i.e. 1.2 m x 4.2 m) at the head plane, considering the average pedestrian height to be 5 ft 4 inches. The attributes considered were gender, group size, group ID, Individual/group, direction, and formation. The formations considered for this study were line-abreast, riverlike, V-shaped, and inverted V shapes. The different steps in the data analysis are explained in detail in the further sub-sections.
Correction due to fisheye distortion
The extracted data had errors due to the fisheye distortion, which needed to be rectified. It was decided to extract data with distorted video instead of removing the distortion, as removing distortion resulted in cropping the video footage and the loss of valuable data (Qian et al., 2020). The correction for distorted data is carried out using the correct values for ROIx, which were manually calculated for one run and plotted against the distorted data.
Calculation of pedestrian velocity and acceleration
For the estimation of velocity and acceleration, first, the difference between ROIx of two consecutive time frames for the same pedestrian is calculated (
Collision Avoidance
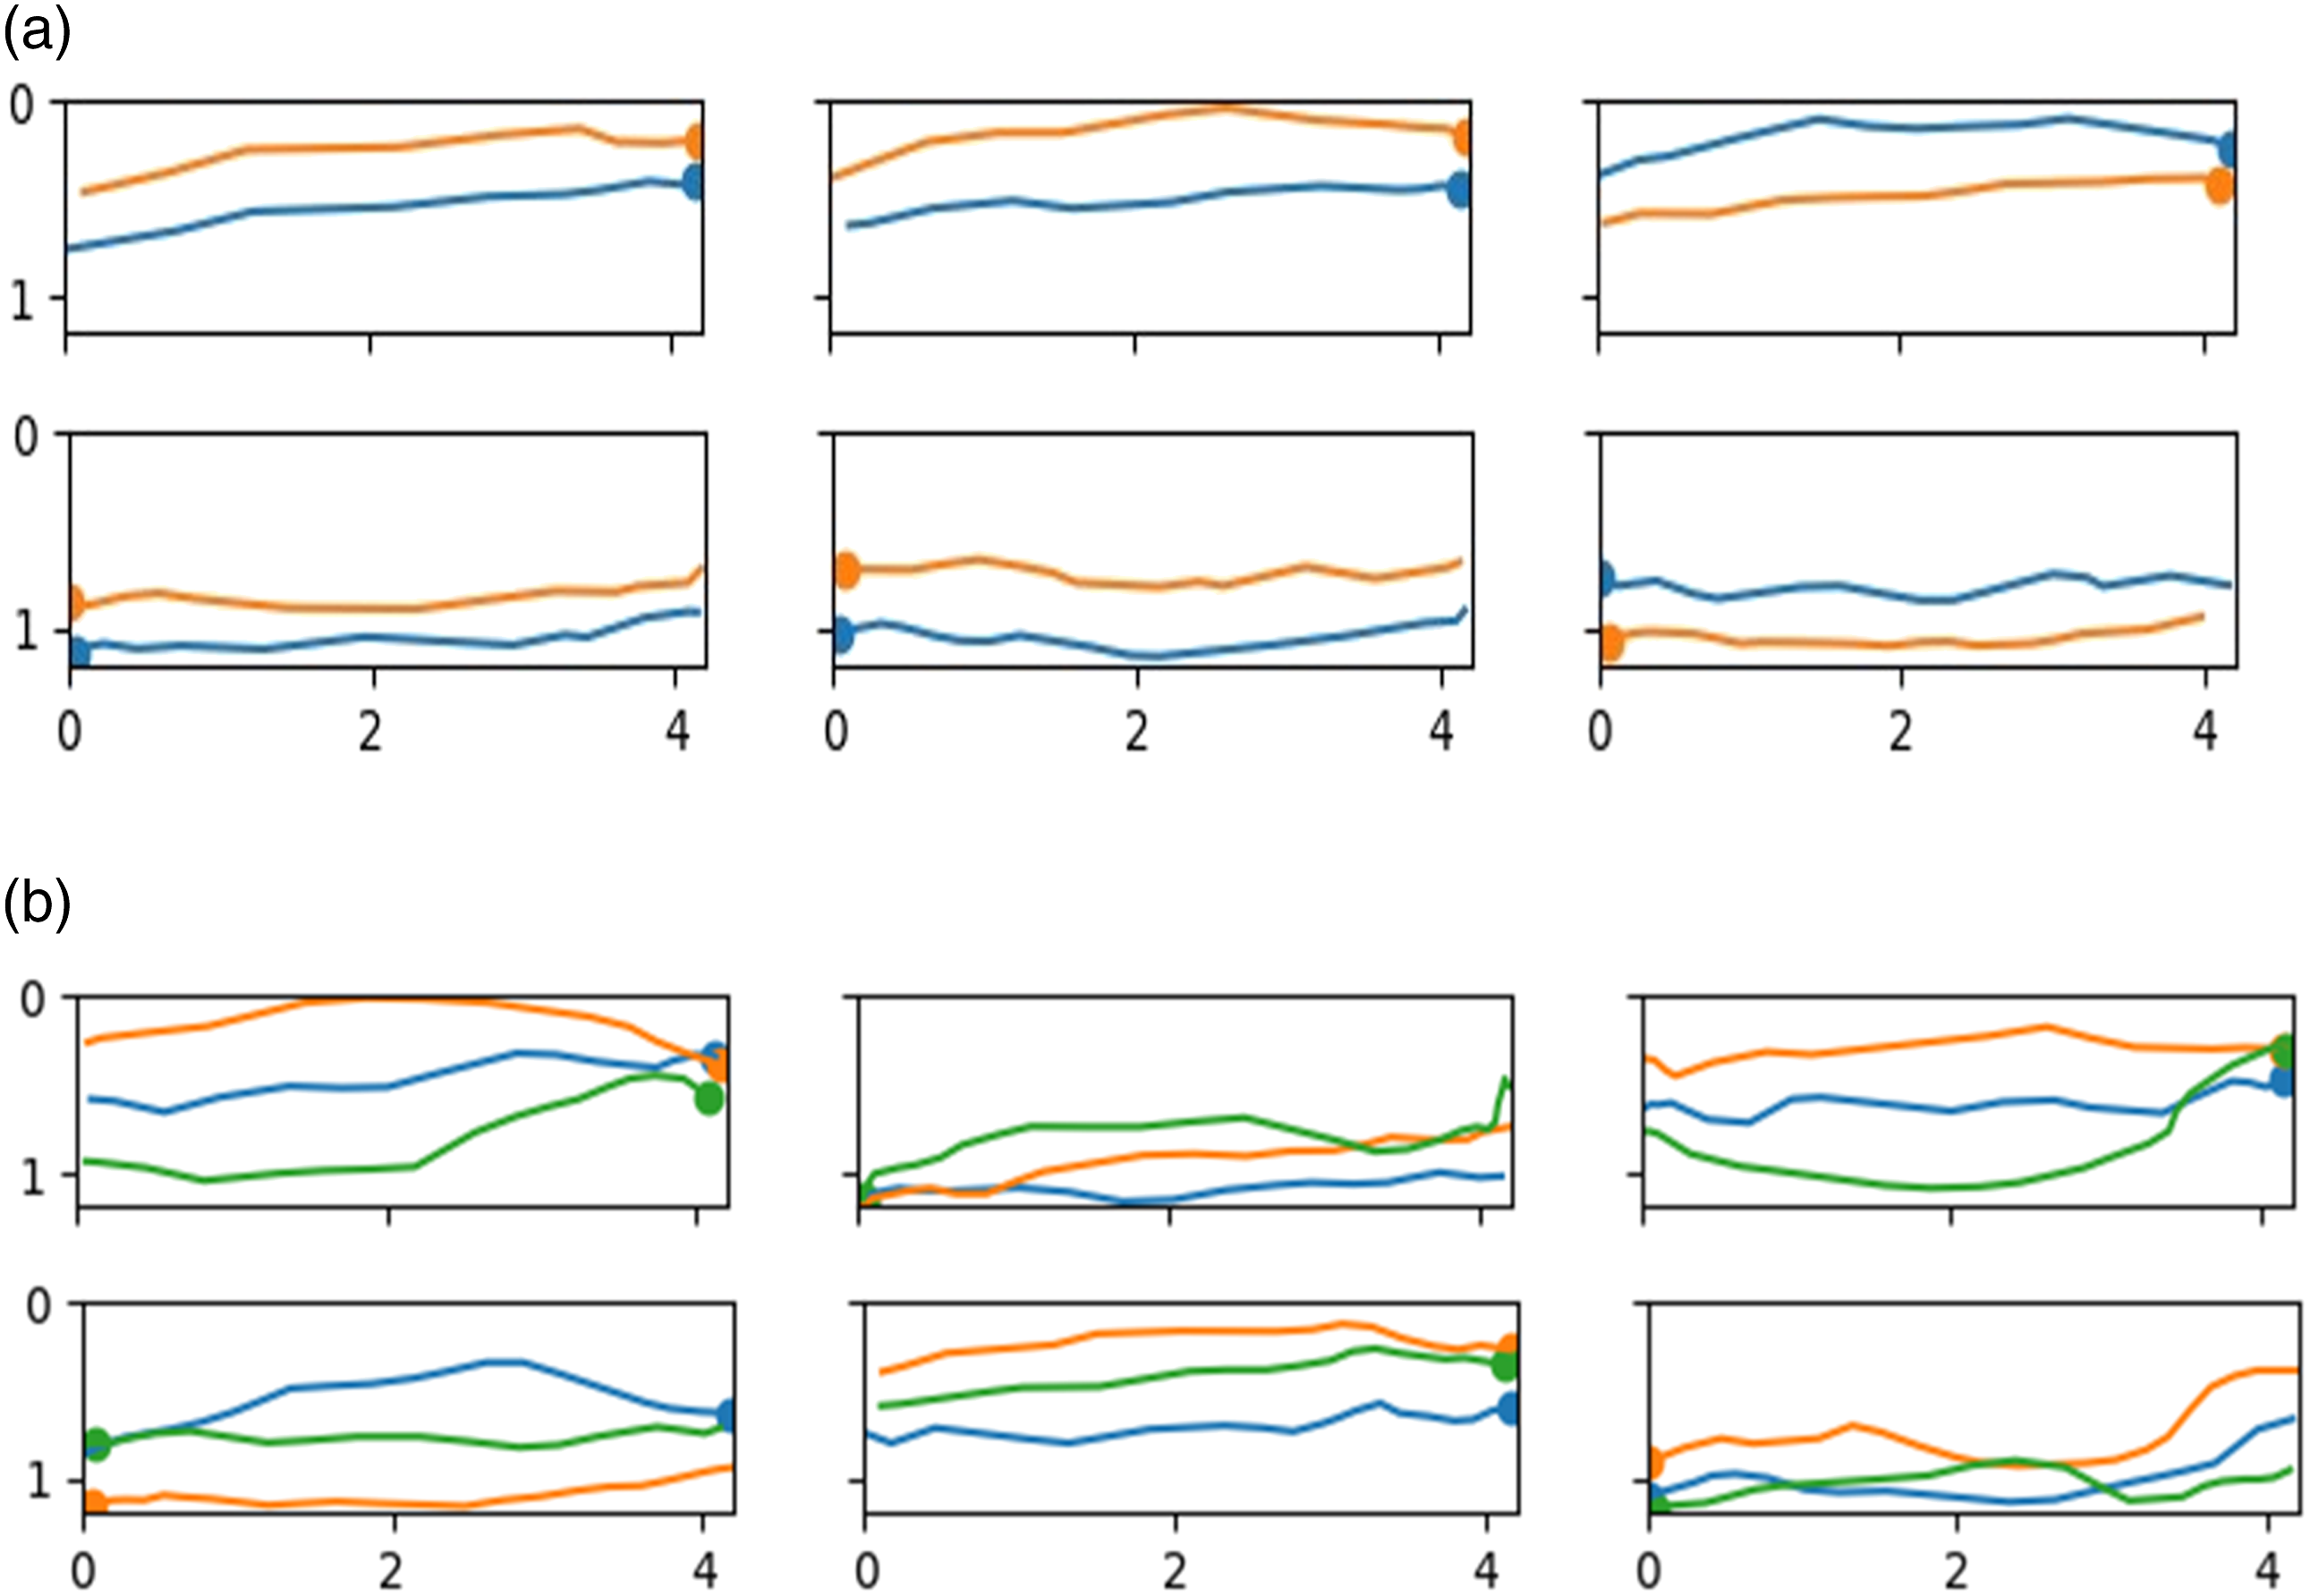
The collision avoidance behaviour is analysed by first plotting trajectories group-wise. Sample plots of trajectories are shown in Figure 2(a) and Figure 2(b). Then the data were sorted according to groups facing each other in a bidirectional flow. Using the first few frames, the ROIx and ROIy were predicted using linear extrapolation, and the desired velocity was calculated from the predicted ROIx and ROIy. The predicted time to the collision was calculated using equation (2). (a) Group size 2 run 1 real-world coordinate. (b) Group size 3 run 1 real-world coordinate.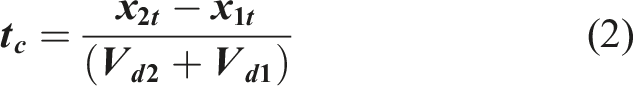
Spatial arrangement/Group Formation
Further analysis is then done to understand the group formations that were adopted by participants during the experiment. The formations considered are line abreast, river, V, and inverted V, as shown in Figure 3. It was seen that the groups did not maintain a single formation throughout. The transition across different spatial arrangements was analysed to understand how the change in formation affected the time required to travel across the platform and how the formations got optimized with repetitive runs. Observed Formations in triads - Line, Inverted V, V and River in clockwise direction from bottom-left.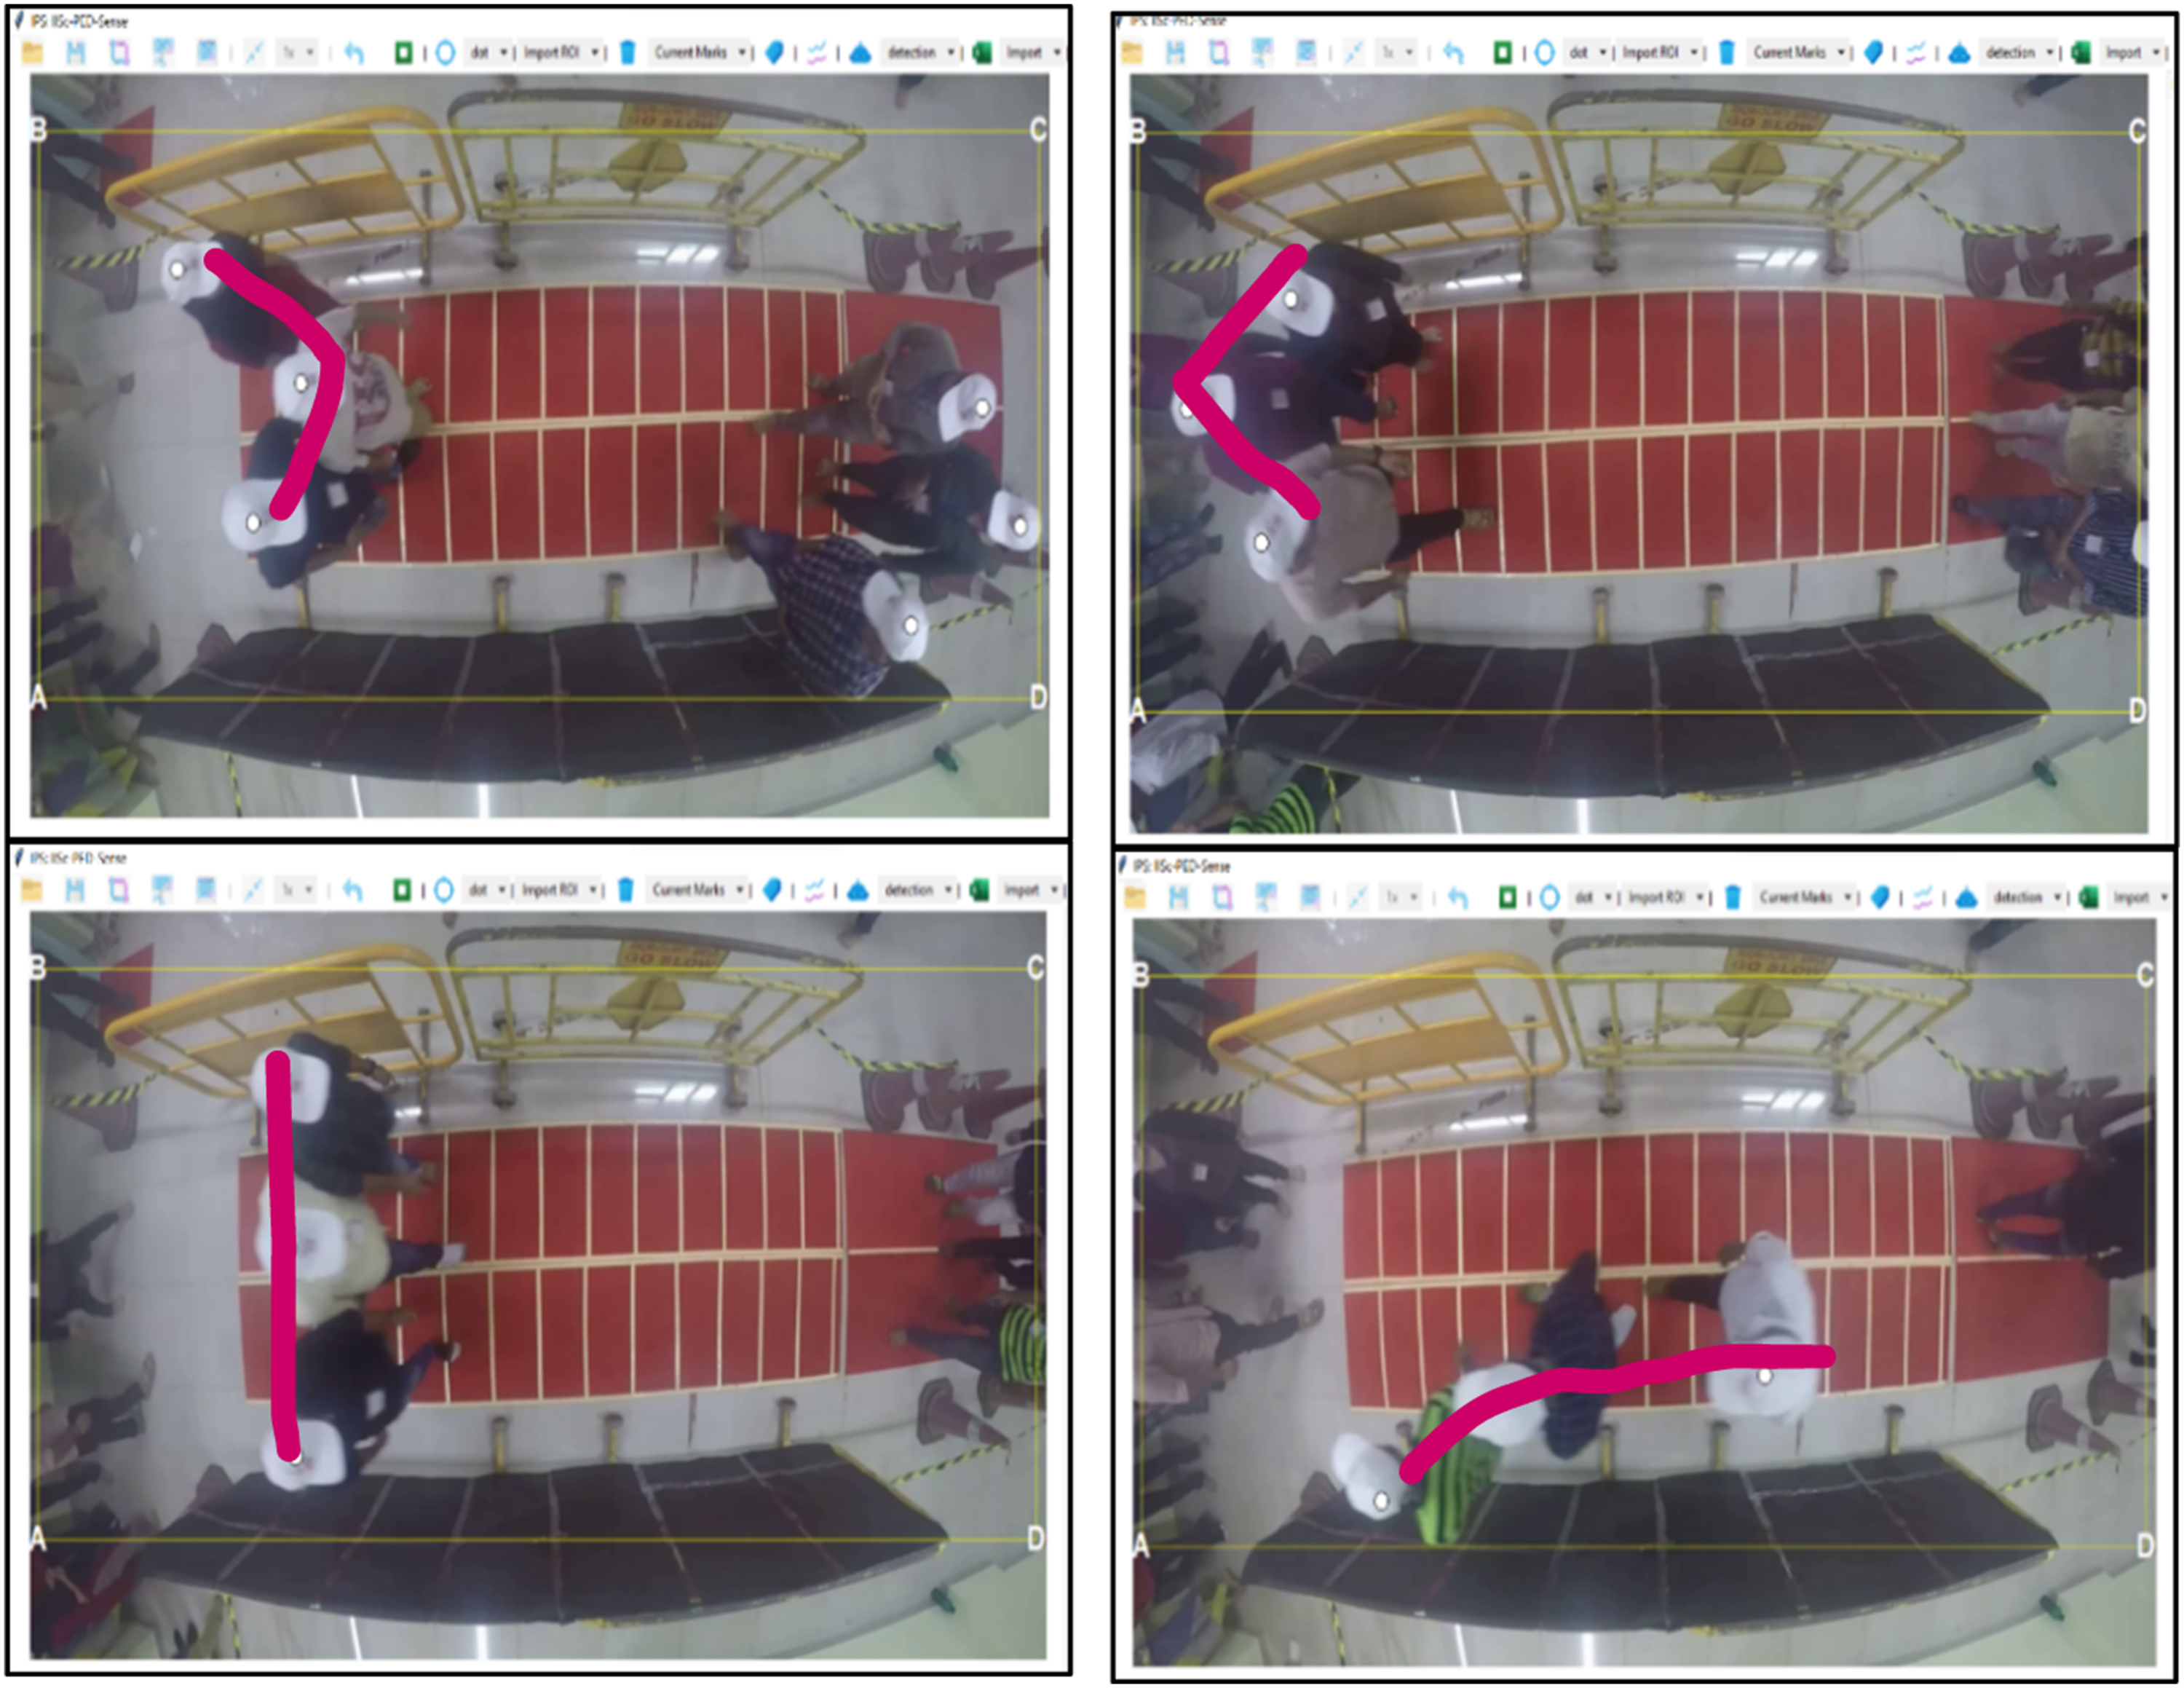
Statistical analysis
We performed statistical tests to check the influence of group size on mean speeds. ANOVA test with a 95% confidence interval was done to test for the differences in mean velocities across different group sizes. We also analyse the spatial patterns of social groups. Single transitions and multiple transitions of formations made by groups over time are noted and a probability of transition is estimated. Also, we test for the influence of group formations and mean velocities for which ANOVA is carried out. Based on the results of the ANOVA, Tukey’s post hoc tests are then carried for the pairwise comparisons across different groups.
Results
We hypothesized that being in a social group would affect pedestrian walk dynamics. For this purpose, we explore the differences in average velocities between individuals and people in groups. Since people of the same group use different ways to communicate with each other while walking, they continuously evaluate their situation and adjust their positions to facilitate this interaction. As analysts, these nuances can be better understood by studying the group formations/spatial arrangement between group members. This section describes in detail the major inferences derived from the study on the impact of social groups on the walk dynamics of people.
It is seen that for group size two, speeds mostly vary from 0.6–1.2 m/s and acceleration varies from −2.0 m/s2 to 1.8 m/s2. Pedestrians walking at speeds more than 1.2 m/s are found to be lesser in groups of size 2. Comparing the speeds of groups of varying sizes, the average speeds range from 0.81 m/s to 1.2 m/s. It is observed that single pedestrians walk faster than pedestrians in groups. It can also be seen that the average speed of pedestrians decreases with an increase in group size (refer to Figure 4). However, the average acceleration is observed to increase with group size (−0.026 for single pedestrians to 0.047 for pedestrians in groups of 3). This could be because, in bidirectional flow, group members accelerate to catch up with the other group members. This implies that when pedestrians walk in groups, interactions between group members and other pedestrians slow down the pedestrians. Comparison of the average speed of pedestrians across group size across all runs.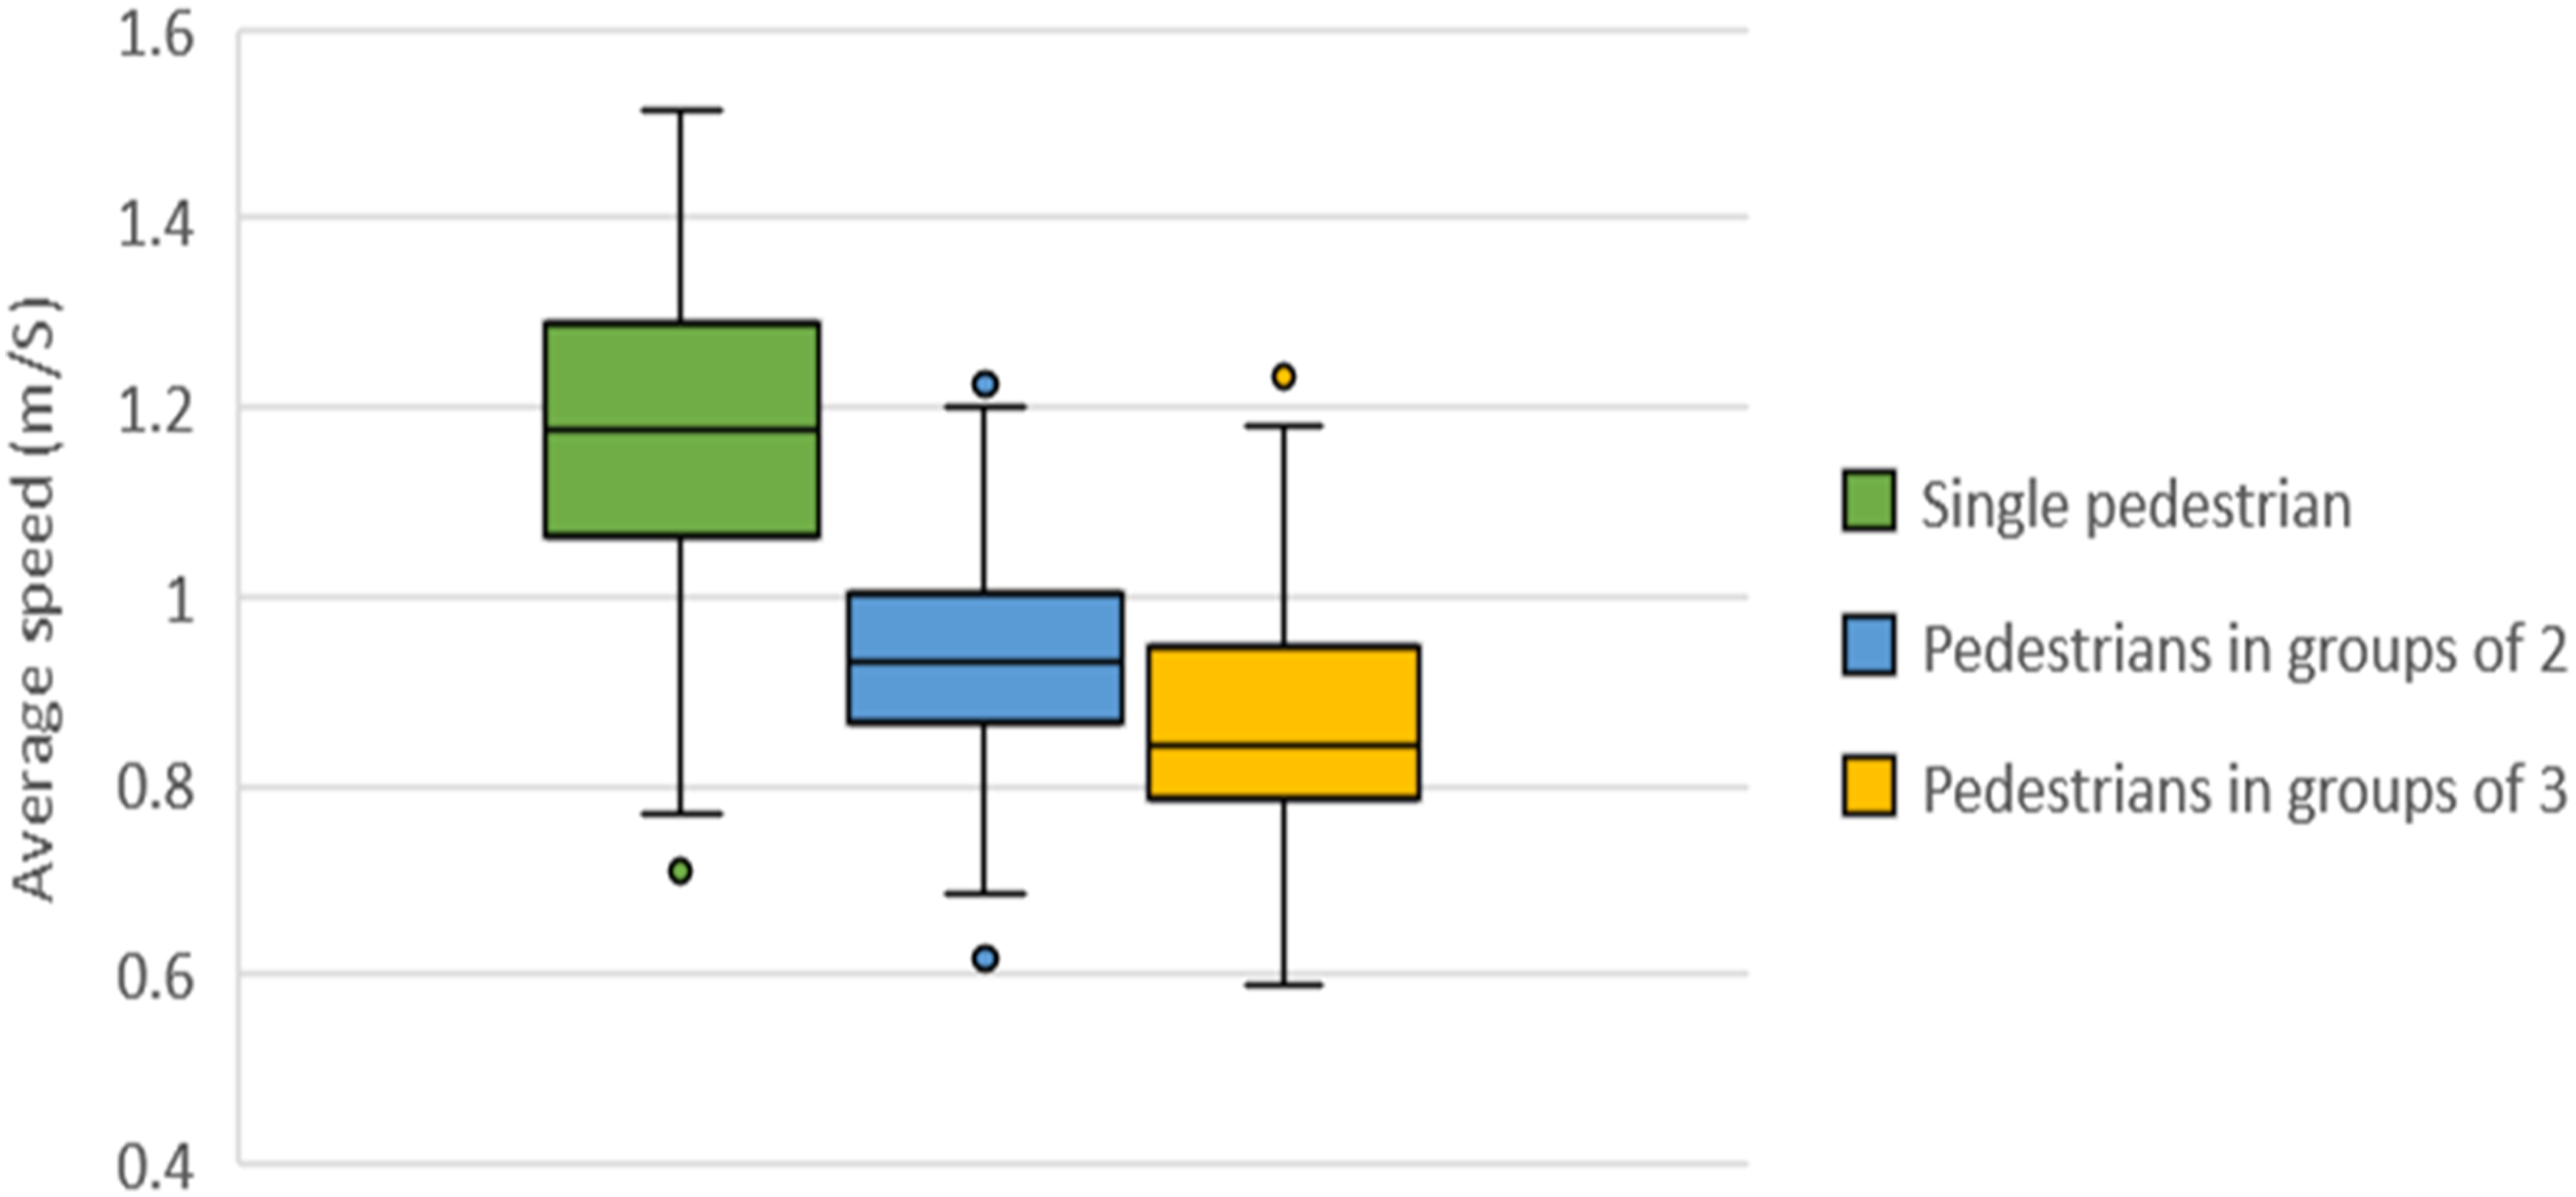
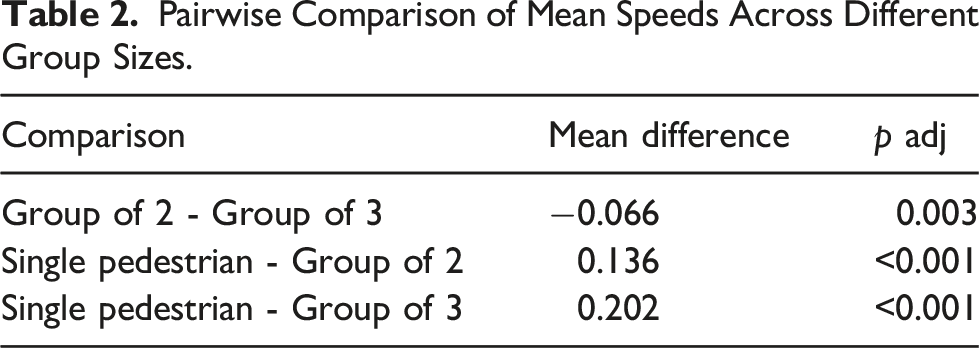
Pairwise Comparison of Mean Speeds Across Different Group Sizes.
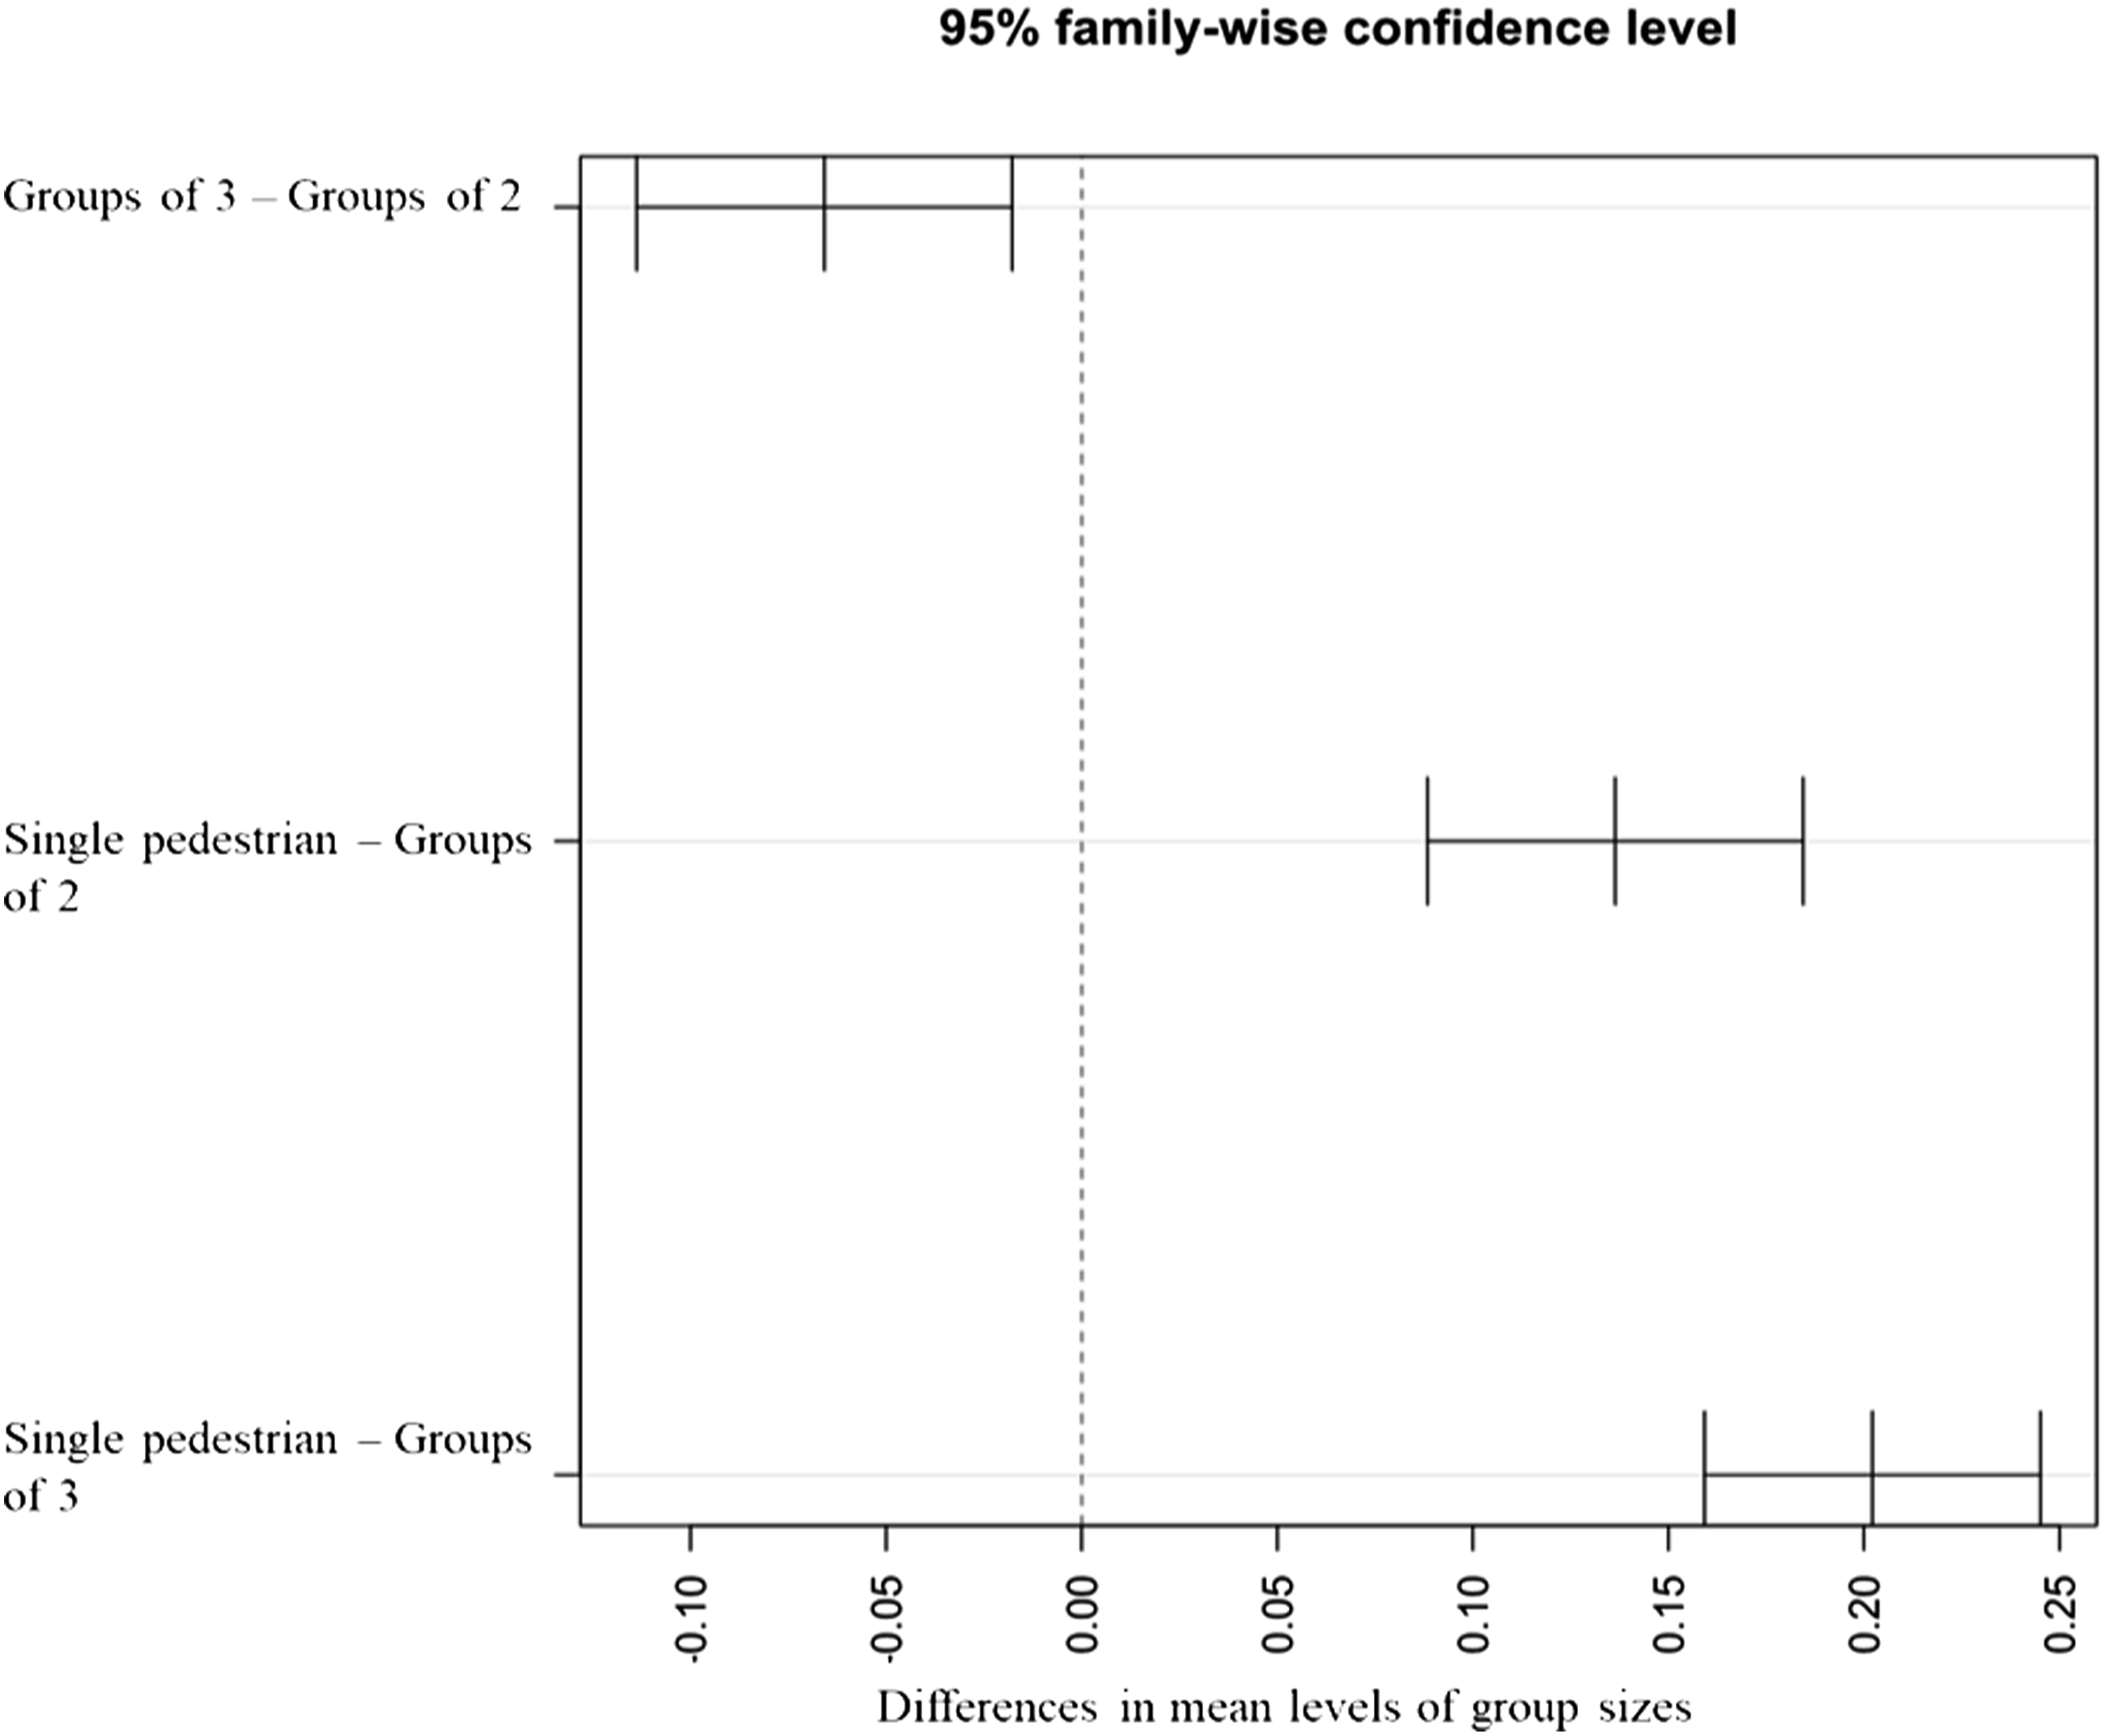
95% Confidence interval across different pairwise comparisons of speeds among groups of varying size.
Group formations in bidirectional flow
Group Formations Across Runs.
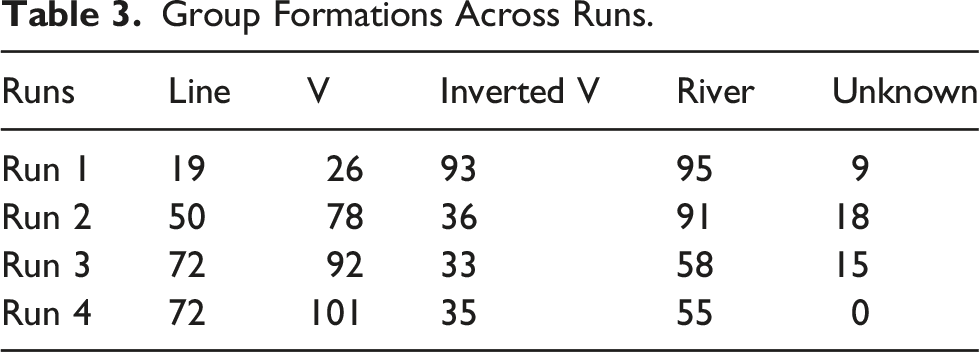
The analysis shows that the time to cross the platform is the least when the river and inverted V are the dominant formations adopted. In contrast, V and Line formations require slightly more time because of interactions. The formations also include combinations where not one formation is predominant. Group formations or spatial patterns change over time in response to the surrounding environment. This is similar to the body twisting/tilting behaviour exhibited by individuals to avoid collision with oncoming pedestrians.
Effect of spatial arrangement/formations on velocity
Comparing the average group velocity across different formations indicate that the mean velocity is the least in Line-abreast formations (refer to Figure 6). In a three-member group, often people might feel more constrained when walking side-by-side in narrow corridors, thereby reducing their speed. Inverted V and river formations are better strategies if the interest is in traversing the corridor quicker, as these formations afford the least interaction between group members but greater speed. Interestingly, only three groups continue a single formation to traverse the entire length of the corridor (V −1, Inverted V-2, River-1). All the other groups transition to one or more spatial formations over time. Average group velocity across different formations.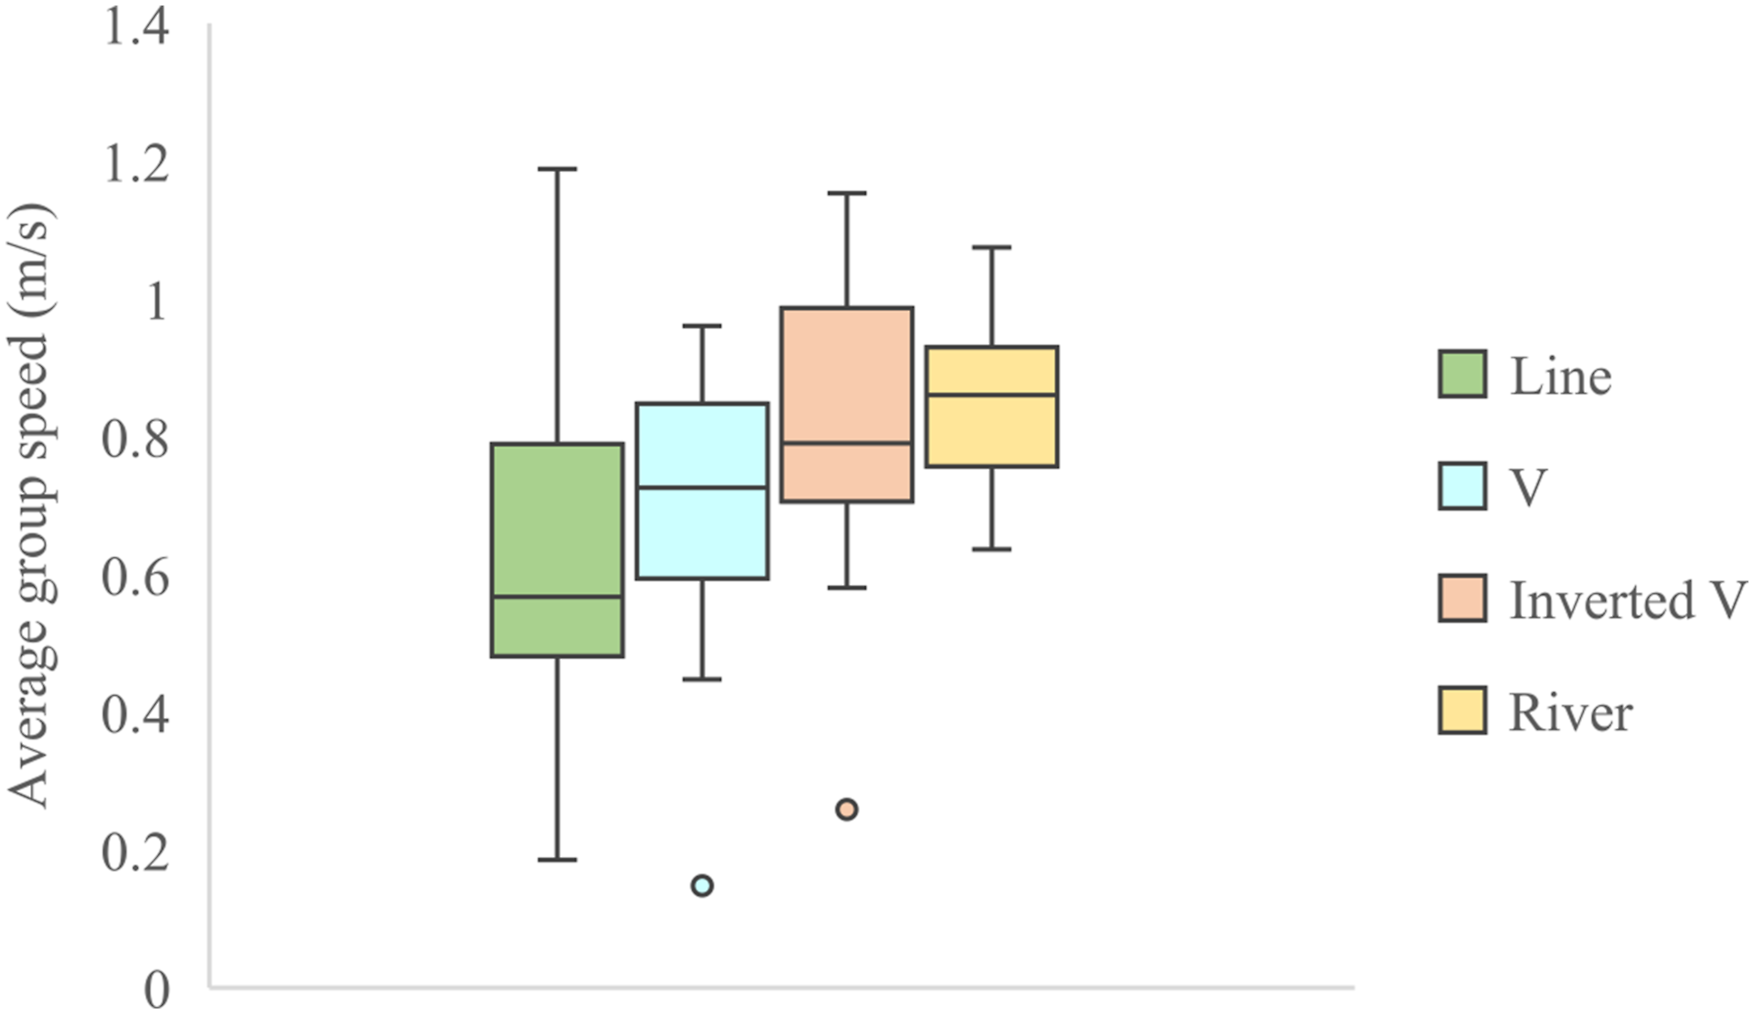
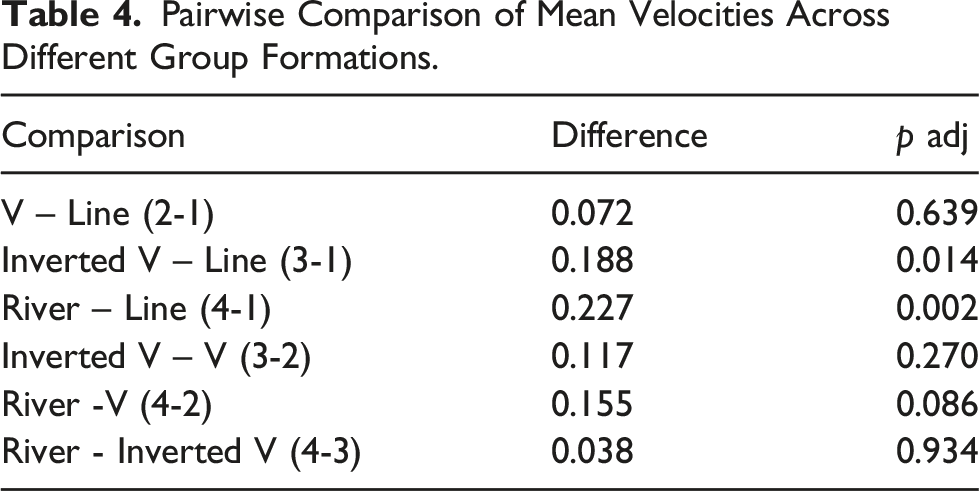
Pairwise Comparison of Mean Velocities Across Different Group Formations.
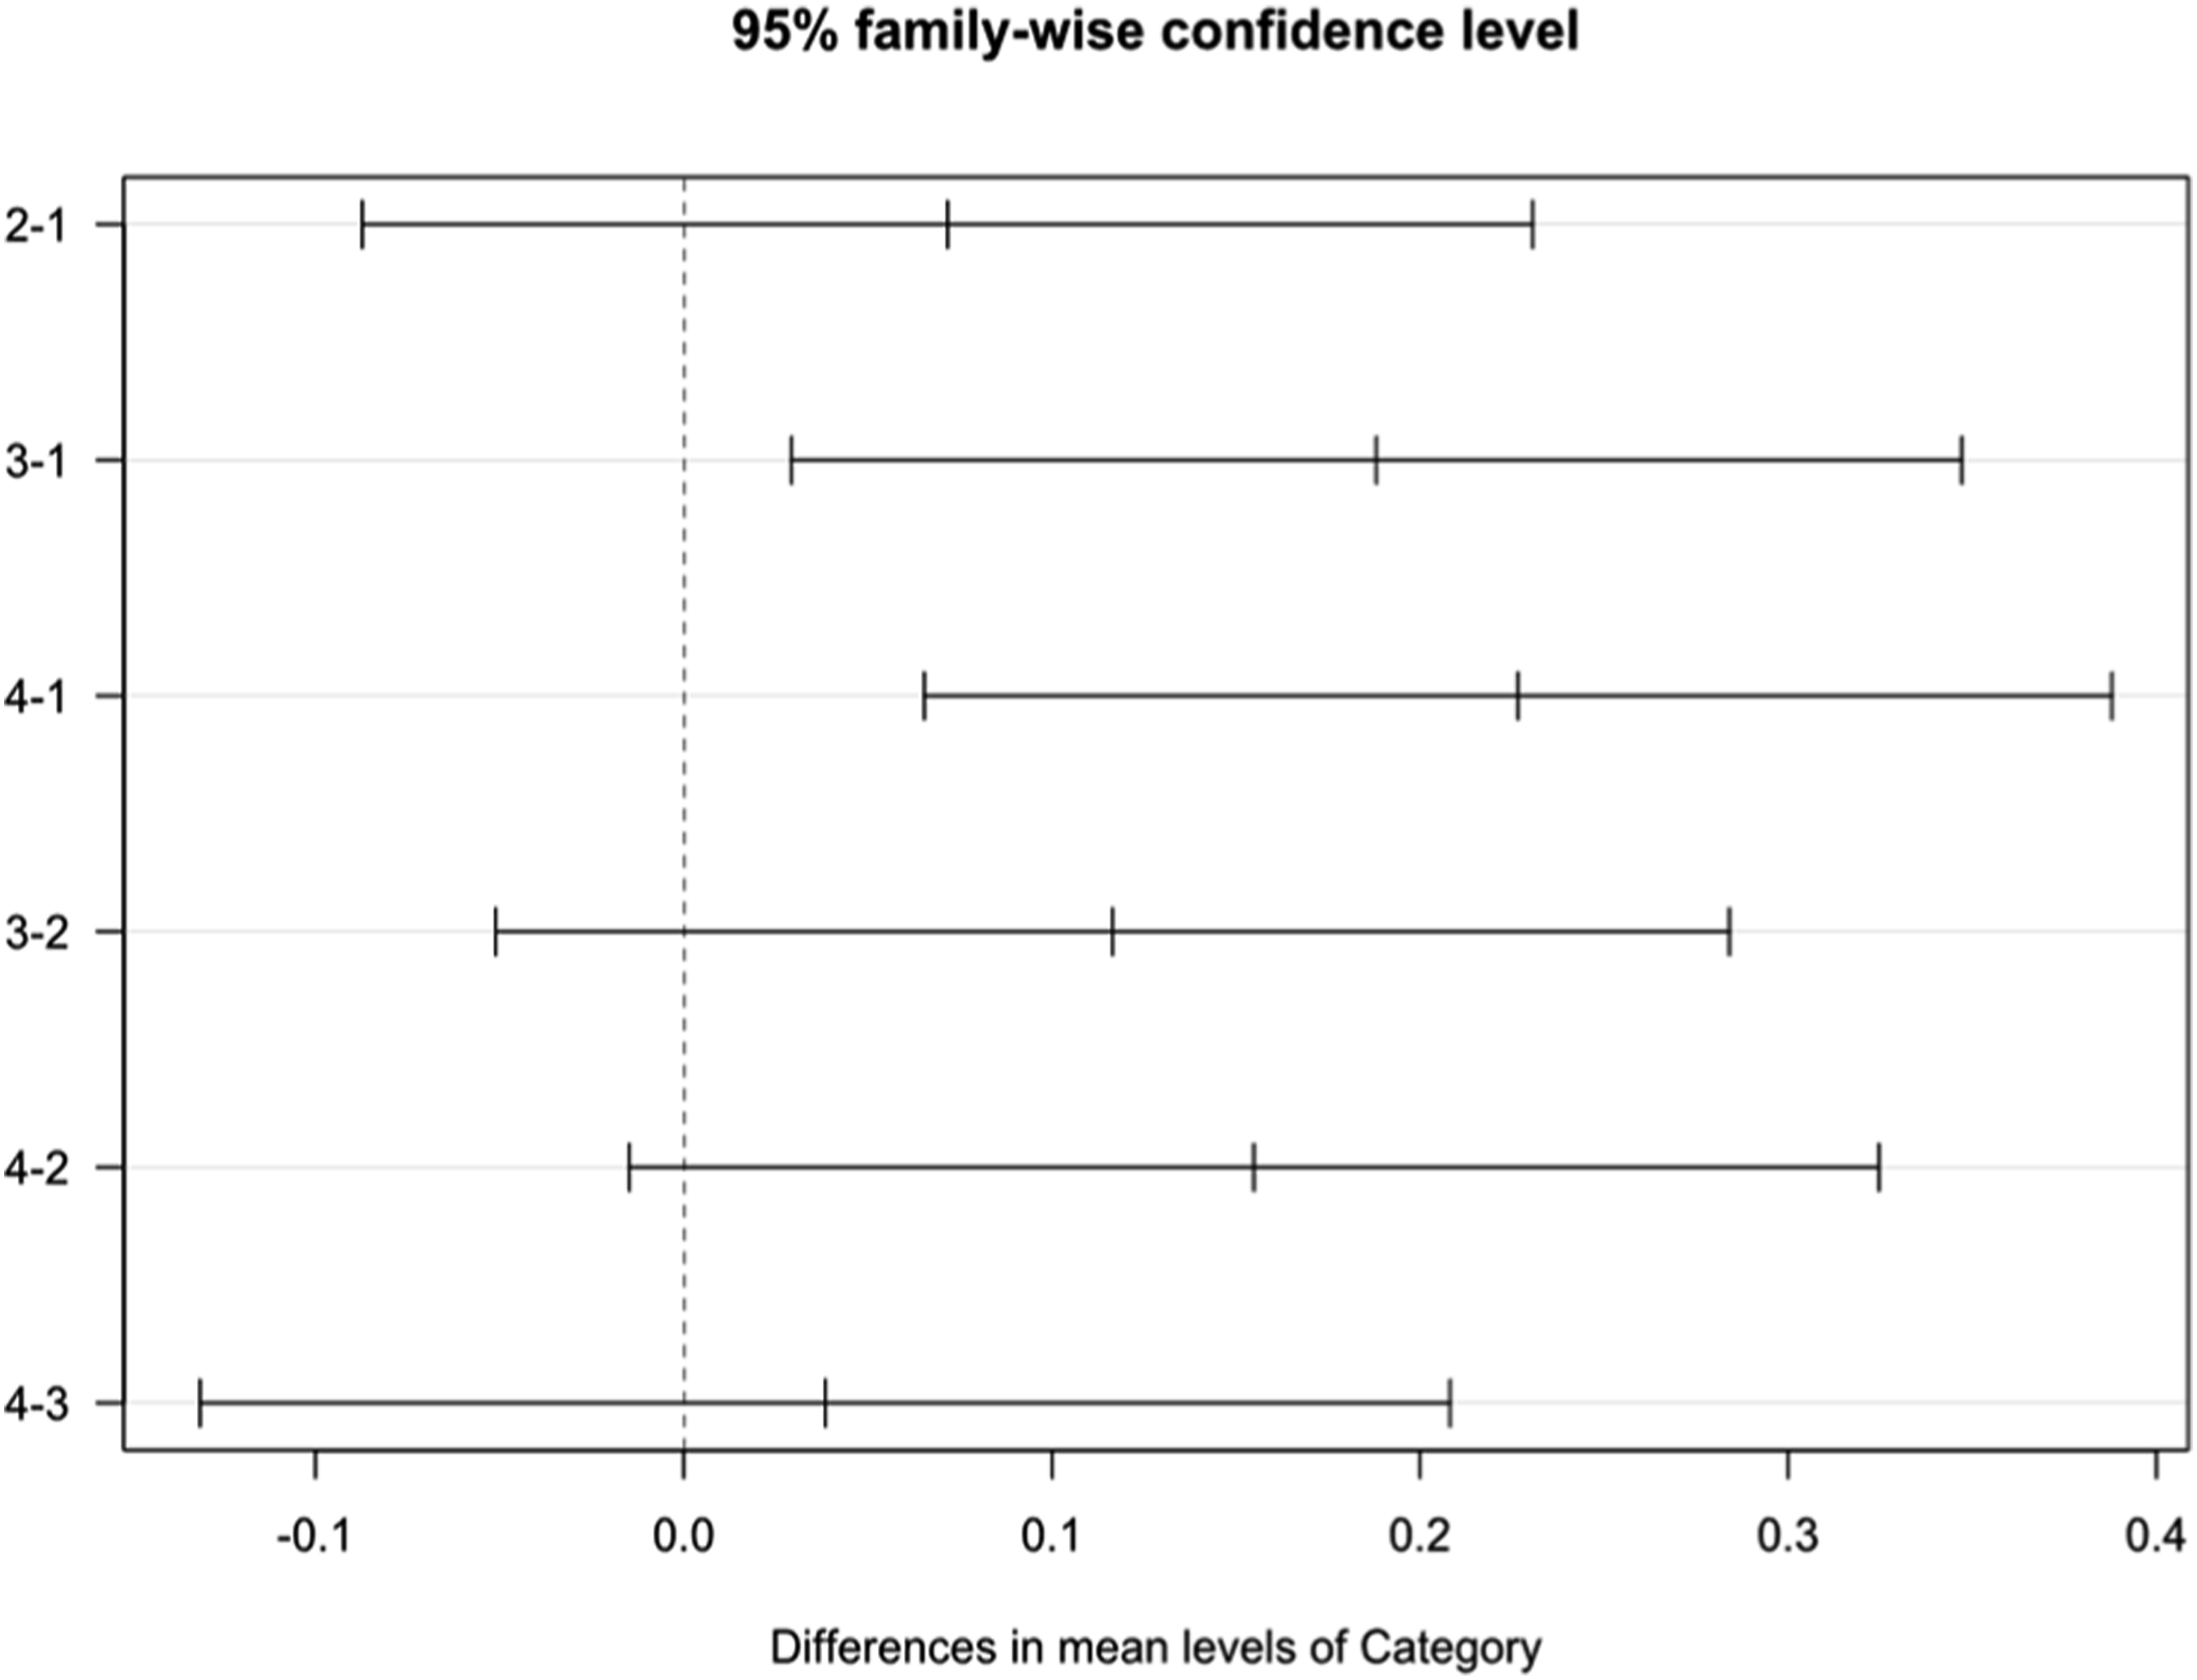
95% Confidence interval across pairwise comparisons of speeds in different group formations.
Tukeys HSD test for multiple comparisons found that there is a significant difference between the mean velocity of Inverted V and Line-abreast formations (padj = 0.014, 95% CI = [0.029,0.347]). It is also seen that there is a significant difference between the mean velocity of River and Line formations (padj = 0.002, 95% CI = [0.066, 0.388]). However, there was no statistically significant difference between the mean velocity of V and Line (padj = 0.639, 95% CI = [−0.087, 0.231]), Inverted V and V (padj = 0.27, 95% CI = [−0.051, 0.284]), or River and Inverted V (padj = 0.934, 95% CI = [−0.131, 0.208]) formations. Figure 7 shows the pairwise comparison results where the means are statistically significant when the confidence interval does not contain zero.
Identifying the transition of group formations
To examine the change in formations over time, and to see the time required for formations/combinations of formations used by the participants to traverse the corridor, we computed the average time for each group. It is noted that the groups with a combination of inverted V and river formations take the least time (23.33s), followed by river formation (23.38s) to traverse the corridor. The highest time is taken by Line formation alone (28s).
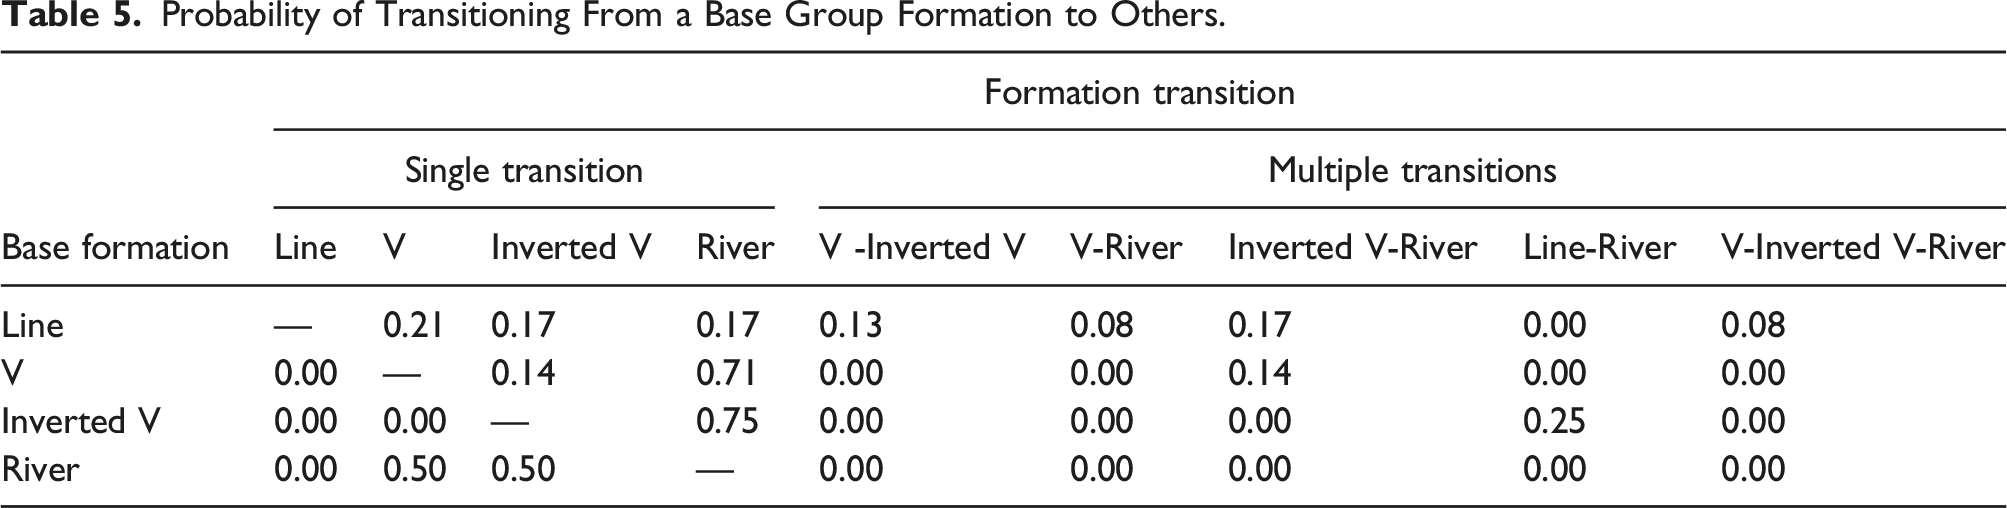
The participants shift formations to the river to gain speed and move quickly as is evident from Figure 8. It is also evident that though the participants initially begin with a line-abreast pattern that ensures maximum group interaction, most groups shift to Inverted V or river pattern to cross the corridor quicker. On the other hand, moving to a V formation or inverted V does not offer much gain in speed. Interestingly, when people shift directly from Line to river, there is only a marginal improvement in speed as opposed to transitioning from V or inverted V to river. A better understanding would probably be gained from studying the transitions of a group individually. To this extent, we have formed a classification table (refer to Table 5) showing the probability of transition from a base formation to other formations. Most groups that begin with a Line formation show a tendency to transition to V, Inverted V, and river formations. The second transition for any of the groups who have shifted to V or Inverted V from Line is river formation. Similarly, a higher transition probability is observed for moving to the river from both V and inverted V formations. There are only a few instances where participants have chosen river formation initially. Change in velocity with respect to change in spatial formation. Probability of Transitioning From a Base Group Formation to Others.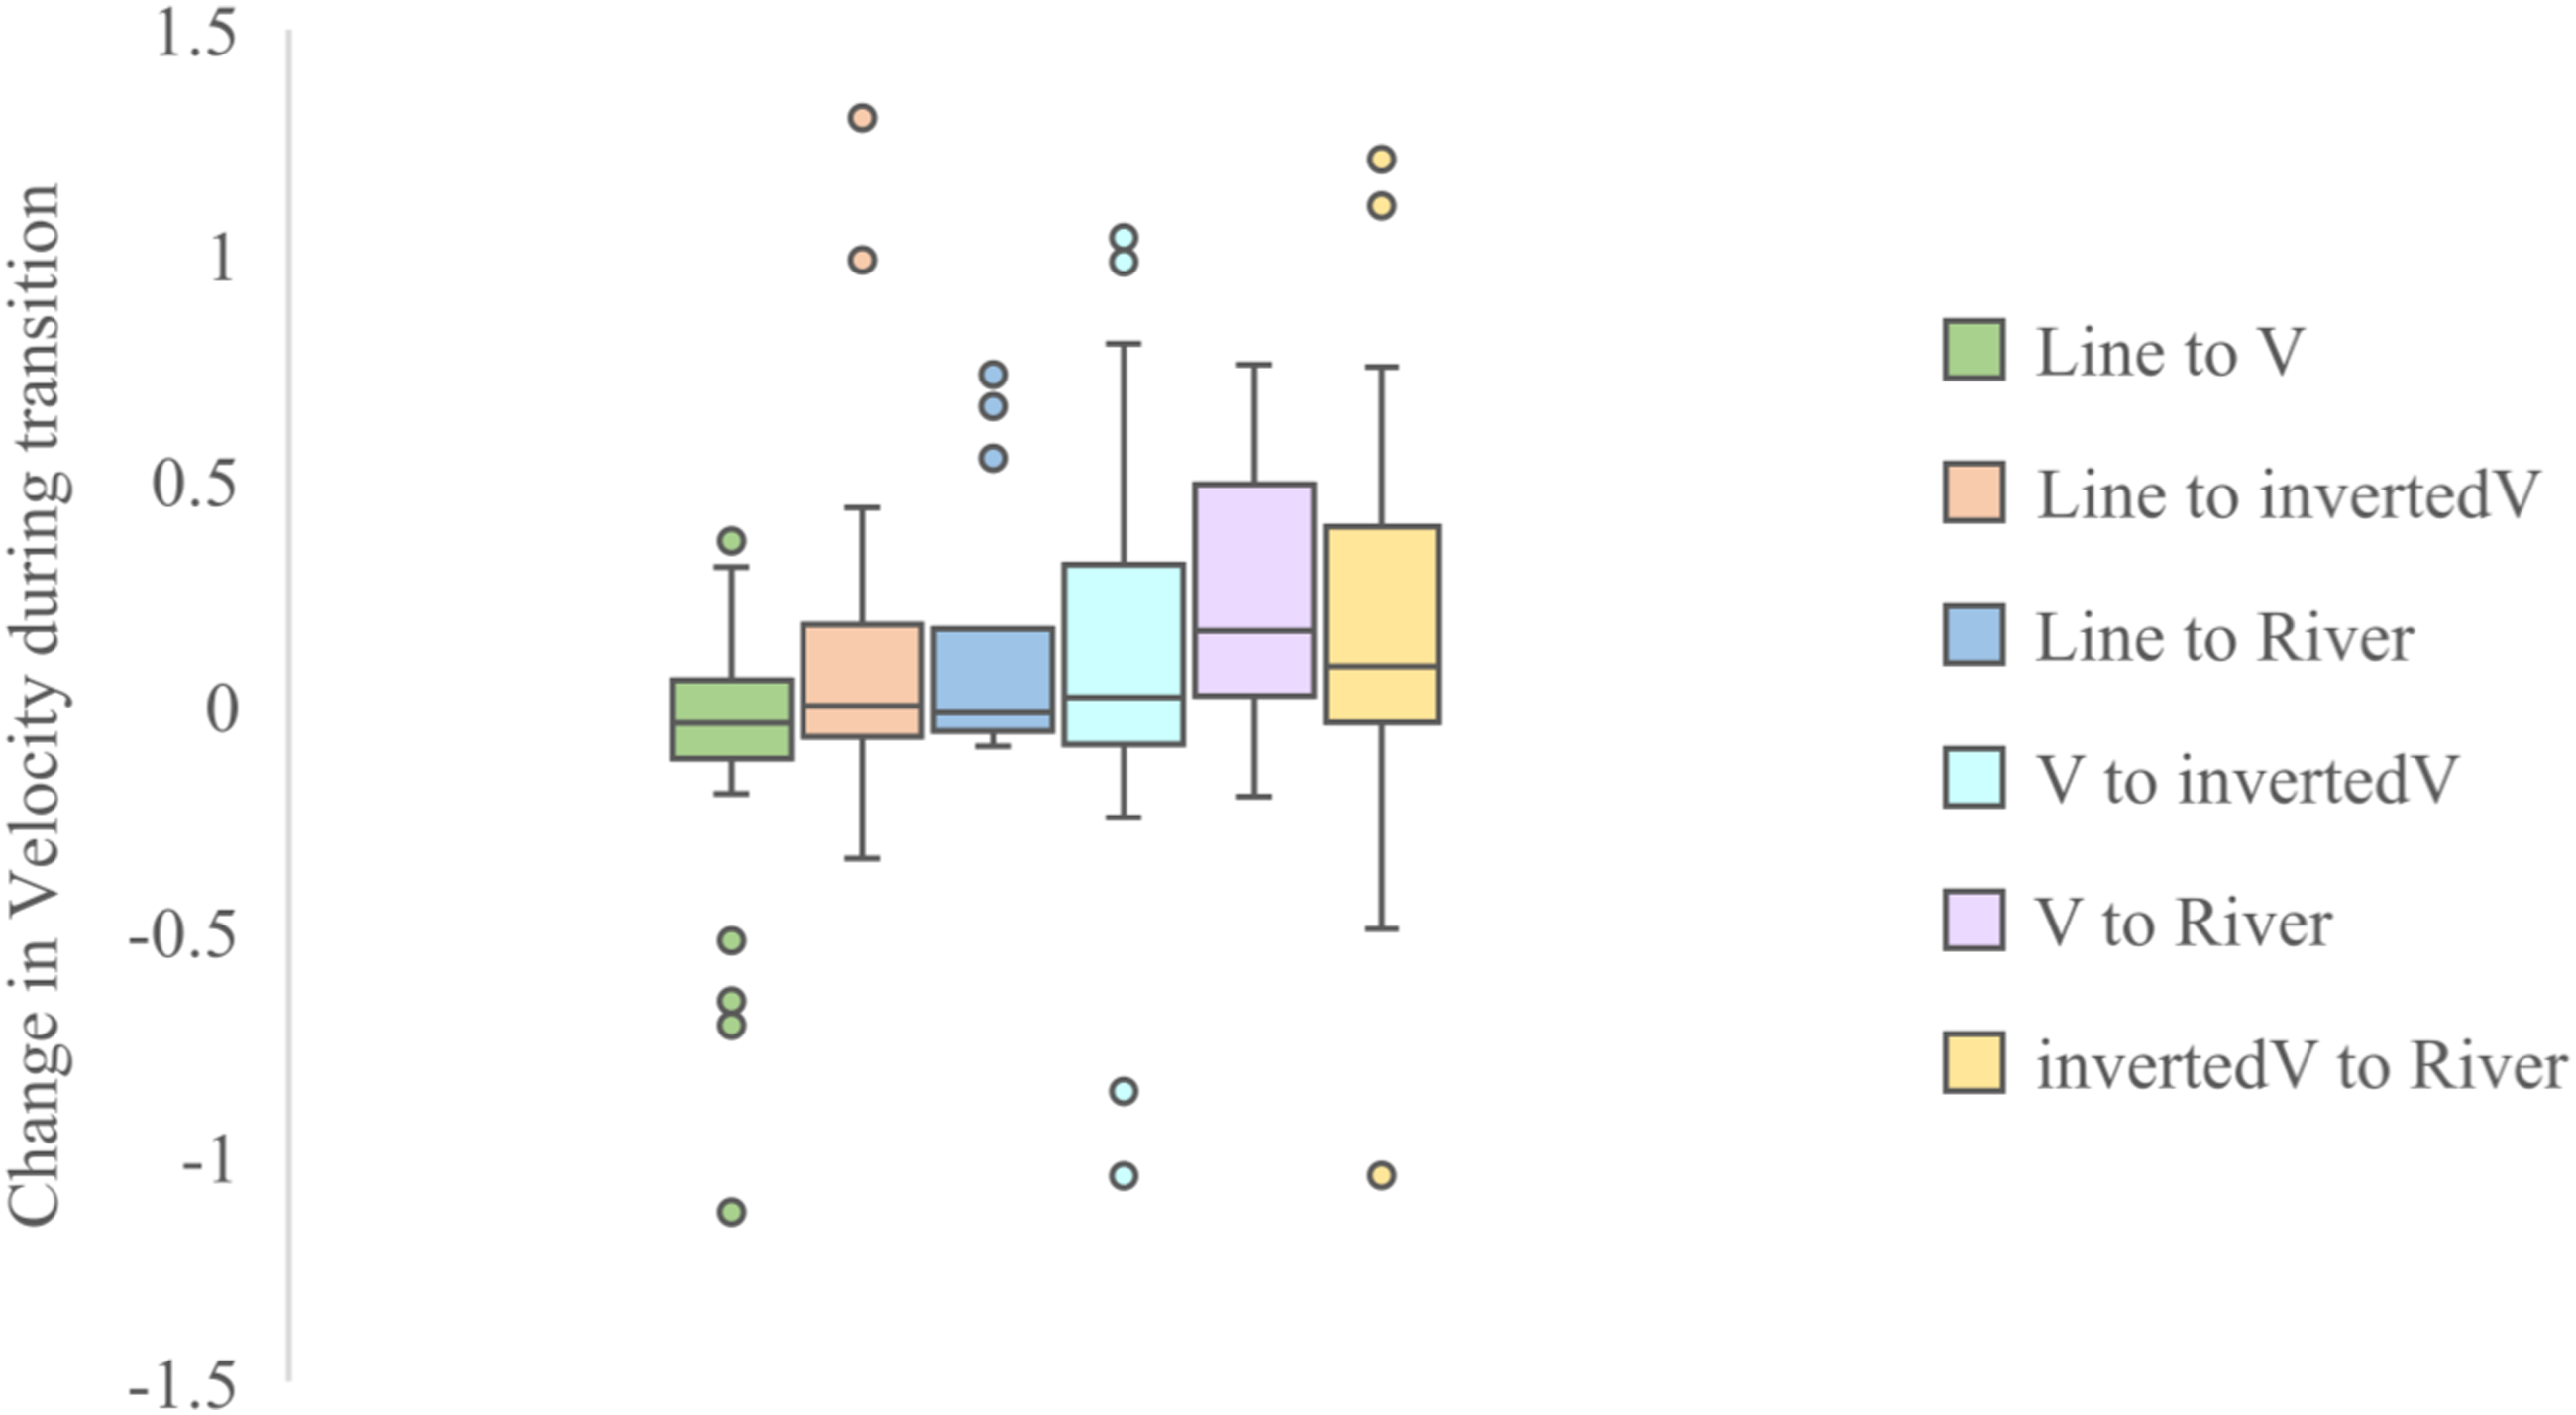
Collision avoidance behaviour
As all participants were aware of the group coming from the opposite direction, the participants would try to adapt their trajectories accordingly within the first few frames. Hence, the predicted trajectories were inclined instead of straight. Then the predicted time to the collision was calculated as explained in the methodology section using equation (2). It is noted that a pedestrian in a group tries to avoid collision with opposite group members, not as a group. Instead, they try to avoid each member of the opposite group separately. Pedestrians can avoid collision with the opposite group by changing the velocity, direction, or both. The deviation from desired trajectories does not solely depend on the predicted collision time. Although the results show that with an increase in predicted time to collision, the deviation from desired trajectory decreases; it still depends on various factors such as a change in speed, the opposite pedestrian walk dynamics including change in speed and direction, and how closely spaced opposite group members are. For similar predicted time to collision for different pedestrians, the deviation angle needs to be the same as some pedestrians may decide to make a small deviation in trajectory but accelerate or decelerate more to avoid a collision or vice-versa. Therefore, change in speed and direction should be considered combinedly instead of separately.
Discussion and conclusions
This paper investigated how social groups affect pedestrians' walking dynamics in linear corridors. The idea was to explore the nuances in pedestrian walking behaviour, when they are a part of social groups vs. isolated pedestrians, and to assess the possibility of simulating such scenarios artificially using laboratory experiments. For this purpose, the data for the study is obtained through a set of controlled laboratory experiments. The study is limited to small social groups of two and three members. The same set of volunteers was asked to take part in the two phases of the experiment. The group behaviour is ensured by giving proper instructions to the participants and through a mock demonstration of the same. It is therefore assumed that the participants would temporarily disassociate from their previous relationships and make attempts to act and behave as a social group. Note that a social group is a broad term including both visually observable socially interacting groups and social groups without any explicit interaction at the time of observation (Zanlungo et al., 2019).
It was seen that with each additional member, the average speeds decrease. The pedestrian speeds were found to be 1.09 ± 0.087 m/s for single pedestrians, 0.92 ± 0.047 m/s for pedestrians in group size 2, and 0.86 ± 0.045 m/s for pedestrians in group size 3. Across pedestrians in social groups, there is a considerable decrease in the walking speed in the presence of an additional group member. This could be attributed to the constrained geometrical section used in the experiment, which forces the group members to adjust their positions laterally to ensure that they stay as a group.
Pedestrian groups adopt different formations, and they change this spatial arrangement over time. This depends on their priorities – whether they want to engage in group interactions or avoid collisions with the opposite flow of pedestrians. It is seen that most three-member groups adopt an inverted V-shape or river pattern. In general, V and Line formations are preferred for having conversations which result in increased travel time, whereas inverted V and river are used for avoiding collisions as they require less width and thus decreased travel time. Therefore, groups tend to make a trade-off between navigational easiness and communication/interaction among group members. We then tested for differences in speeds across different formations adopted by groups. Through the pairwise comparisons across different formations, it was noted that there is a significant difference between the mean velocity of Inverted V and river formations with Line-abreast formations.
At times, group members tend to keep physical contact with each other, through a casual draping of arms over the shoulders or holding hands/guiding others. Most often, involuntary movements are perceived by other group members in terms of lateral shifts or falling back. When other group members act in response to these perceived changes, sometimes by taking responsibility for each other and waiting for others to catch up, or at other times it could be in terms of speeding up and moving ahead. We investigated these interactions by exploring the changes in the spatial arrangement/formation over time. Single pedestrians walk faster, unburdened by the responsibility of taking care of others or making sure that other group members are keeping up. The analysis also shows that the time to cross the platform is the least when the river and inverted V group formations are adopted by three-member groups. In contrast, V and line-abreast group formations require slightly more time and are better suited to promote interactions between the group members. Groups that are reluctant to split up or want to engage in conversations or move together could be termed as more cohesive and such groups are more likely to prefer V formation or line formations. Therefore, group cohesiveness and level of interaction decide the formation and transition of formations. In most of these cases, there is no verbal communication between group members and between group members. Rather, these shifts happen through a natural transition based on the priority of the group. From the collected data, however, most of the groups tended to transition to river formation during the second/third transition. Therefore, irrespective of the initial formation adopted by participants, river formation is the ideal formation to move quickly and avoid collision with opposing pedestrians (as evident from the probability of transition). It is possible that laboratory experiments might not be able to fully replicate the social group behaviour, given the most preferred formation (through single/multiple transitions) to traverse the corridor.
Lastly, the collision avoidance analysis shows that the deviation from desired trajectories and velocities are inversely proportional to the predicted time to collision. Still, multiple factors might influence these decisions such as spacing between group members in the opposite direction, the relative velocity between the two groups, and gender differences. Most pedestrian facilities have bidirectional flow, and about 40–70% of the pedestrian crowds generally consist of social groups. Since most people walk in social groups (Cheng et al., 2014), it is important to understand the trade-offs people make while walking in terms of walking speed and intra-group interactions. This study is an attempt to investigate further the effect of personal characteristics and group interactions on the spatial arrangement of groups and their subsequent transitions over time. The findings from this study can be further utilized for better planning of pedestrian facilities where bidirectional flow exists within a single channel.
Limitations and future scope
The laboratory experiments offer several advantages in terms of better volunteer coordination, ideal camera positioning, and overall control compared to field data. However, it is observed that despite clear instructions and the disciplined nature of the volunteers, it is difficult to instil a feeling of natural togetherness or watchfulness in fellow group members. Reluctance to trust or acknowledge an individual from the group as a leader was also evident. However, even in a natural setting, individuals within a group might not be interactive. In other words, the degree of association/involvement/engagement within a group varies across individuals within the group and across the groups. Therefore, the insights obtained from such controlled experiments should ideally be treated with caution rather than generalizing to field situations. It would also have been interesting to see the differences in group behaviour across various classes of social groups, for example, family with children, friends, and older adults. All the volunteers were students in our study, which constrained our analysis. While it is both interesting and important to analyse the effect of group size on average speeds (especially larger groups), the current data’s sample size and variation in group size composition did not allow such analysis. The authors believe the average speeds might decrease at a faster rate till the group size reaches a critical value. However, the exact rate at which this might happen or the potential for non-linearity in this rate is a subject of further investigation.
Footnotes
Acknowledgements
The controlled experimented was conducted as a part of workshop funded through Accelerate Vigyan, SERB. The authors would like to thank all the volunteers for taking part in the experiment. We would like to thank Chetansinh Thakur and Ashish Patil for helping in data collection and extraction.
Author contributions
All authors contributed to the study conception and design. Material preparation, data collection and analysis were performed by Karthika P S and Ashish Verma. The first draft of the manuscript was written by Karthika P S and all authors commented on previous versions of the manuscript. All authors read and approved the final manuscript.
Declaration of conflicting interests
The author(s) declare(s) that there is no conflict of interest. The authors confirm that informed consent was obtained from all individual participants who participated in the study.
Funding
The author(s) received no financial support for the research, authorship, and/or publication of this article.
About the Authors