
Abstract
Movement trajectories contain important spatio-temporal information to characterise human activities that require displacements (eg grasp an object). A trajectory (dis)similarity measure is highly relevant in trajectory data analysis. The main purpose of this study was to develop a running version of the Procrustes Method to quantify dissimilarity between trajectories along time, as a method that can be used in further research. Empirical data was used to quantify changes in stroke patients’ movements in a daily life task (drinking water) after participating in a combined rehabilitation program (virtual reality plus conventional therapy). Results of the simulation study reflected the reliability of the Running Procrustes Method to quantify the dissimilarity between trajectories continuously over time. For the empirical data, this method identified critical parts of the drinking water task, providing information that might suggest beneficial effects of the combined program in stroke patients’ daily life tasks.
1. Introduction
The current technological improvement of motion tracking systems allows capturing trajectories of a broad set of movement systems. Those trajectories can be related to extensive movements, such as the trajectory of a Formula 1 car on a track, the displacement of team sports players on a pitch, the migration paths of dolphins, or daily life activities, such as to grasp a glass to drink water. For every kind of movement, the output is a large set of x, y and z time series, which illustrate the behaviour of that movement system in space over time.
Trajectory data contain highly relevant spatio-temporal information, which allows characterising the continuity and fluidity of movement patterns of different human activities that require displacements. Different types of moving objects or individuals may share similarities in their behavioural dynamics (Dodge et al., 2012; Dodge et al., 2009). For instance, daily life activities of an individual that require transporting an object using the upper limbs with a repetitive upward movement create different up and down trajectories, but with some similarity. Capturing fluctuations in the similarity of those trajectories along the path may allow identifying critical moments during the course of an action.
1.1. Stroke
The daily life activities can be severely disturbed due to negative life events as a stroke. Nowadays, stroke is one of the most common causes of neurological dysfunction affecting adult population (Miller et al., 2010; Roth et al., 2015). Motor impairments due to stroke are associated with the patient loss of the ability to perform accurate coordinated actions, with a significant impact on upper limb use in elementary daily life activities (eg drinking, dressing), as well as instrumental activities (eg cleaning the house, taking care of clothes, using household equipment or shopping) (Kasner, 2006).
Thus, analysing movement trajectories in people who suffer the impact of negative life events offers relevant information regarding the performance of specific movements at specific moments. For instance, in a simple drinking water task, there are critical moments that require an accurate control of the movement, as decelerating the movement to gently touch the glass to the mouth to drink water or to place the glass on the table.
The loss of control on movement velocity is a relevant cause of disability. Research shows that the control of movement velocity is a crucial issue for movement fluidity and quality. A study with stroke patients (Kusoffsky et al., 2001) highlighted the control deficit of the hand trajectory in a transportation task (reaching-lifting-placing) and multiple deflections during the deceleration phase corresponding to the object landing. Stroke patients frequently exhibit slowness and abnormal discontinuity in movements, with characteristic spatial segmentation of movement in actions like pointing, reaching, and transporting objects which affects daily life activities (Kamper et al., 2002; Levin, 1996). Therefore, improving movement velocity and continuity (by decreasing deflections), which diminishes the time to perform a task, are two features that may be set as criteria to assess the effects of rehabilitation programs. Movement continuity and fluidity can be captured from spatio-temporal trajectories and consequently differences between trajectories may suggest the efficacy (or not) of a rehabilitation program.
1.2. Virtual Reality
Virtual reality (VR) devices (eg game consoles) have been used, within the context of motor rehabilitation programs, to create interactive therapy contexts which increase patients motivation and engagement in multi-sensorial, motor and cognitive stimulated environments (Cameirão et al., 2011; Cameirão et al., 2010; Laver et al., 2017; Wallet et al., 2010). The benefit of practice in virtual environments is based on the assumption that the movement improvements due to motor practice in VR tasks will be transferred to usual daily life activities (eg drinking water, grasping an object) (Wallet et al., 2010). However, a recent review regarding the effects of VR based rehabilitation programs shows that VR training may improve upper limb function and daily life activities when applied in conjunction with usual therapies, probably due to the increase in the overall therapy time (Laver et al., 2017).
Thus, rehabilitation programs aim to recover movement control and fluidity and the inclusion of VR settings can be a suitable solution. Nevertheless, this solution still claims for evidence, perhaps due to the lack of methods that allow analysing information about movement improvements, which may prove the efficacy of this sort of rehabilitation programs.
The main purpose of this study was to develop a running version of an existing technique (the Procrustes Method) as a viable method to measure trajectories dissimilarity on time, and thus contributing to a more accurate analysis of movement. The features of spatio-temporal trajectories may help to evaluate movement patterns, based on the dissimilarity and the velocity/acceleration properties. Thus, a secondary effect of this study was to assess the efficacy of a rehabilitation program that combines VR practice with conventional therapy as suggested by Laver and colleagues (Laver et al., 2017). More precisely, to characterise changes in trajectories dissimilarity, along with the velocity and the acceleration profiles, of stroke patients’ movements before and after a rehabilitation program and to associate them with the efficacy (or not) of that program.
1.3. Trajectories Dissimilarity
A trajectory dissimilarity measure is one of the most important questions in trajectory data extraction, since it provides rich information for clustering and classification of displacement patterns in a broad set of human activities, as well as for prediction, simulation and modelling based on previous trajectories (Buchin et al., 2011; Dodge et al., 2012; Mao et al., 2017). The relation between trajectory dissimilarity and performance is highly context specific and the methods developed so far focused on increasing the accuracy of measuring displacement dissimilarity.
The human movement system displays an inability to perform exactly the same movement twice (Bernstein, 1967). This variability may, in some circumstances, produce a disruptive effect in performance, whereas, in other circumstances, is associated with different performance solutions which may lead to increased outputs. Moreover, the human movement variability itself fluctuates along time. At some moments of a trajectory, the movement variability is higher due to an increase in task complexity (eg to place an object on a table creates demanding space-time constraints that require a control over the movement velocity), whereas, at other moments, the movement variability decreases (eg less demanding space-time constraints). These are important motives that highlight the relevance of measuring dissimilarity between two trajectories over time, namely in human movement systems in which variability leads to time series which are inherently irregular and noisy. This allows identifying critical parts of a path where a movement system needs to explore different solutions to perform successfully.
The Procrustes Analysis for two shapes matching provides a normalised dissimilarity measure, as well as scaling, rotation, reflection, and translation parameters (Dryden & Mardia, 1998; Gower & Dijskterhuis, 2004). This method has been reported in movement science literature for some years (Decker et al., 2007; Haggard & Richardson, 1996). A recent study used the Procrustes Analysis to identify trajectories dissimilarity between movements in ‘real’ and ‘virtual’ scenarios of the shoulder, the elbow, and the wrist in a darts-throwing task (Passos et al., 2017). The novelty of the present study is to go beyond the calculus of the dissimilarity value between two time series using a Procrustes methodology, and to determine the dissimilarity values between two time series along time. A previous paper from Buchin and colleagues already stated that the similarity of parts (ie subtrajectories) of two trajectories is more relevant then the similarity of the whole trajectories. For that purpose, the subtrajectories similarity was computed using a distance measure defined as the Euclidean distance at corresponding times, with the subtrajectories length settled with time intervals (Buchin et al., 2011). In this study, we propose a Running Procrustes version using a moving window of fixed length that provides a continuous dissimilarity function between two trajectories over time, highlighting maximum and minimum values, as well as other statistics. On the one hand, this running version is a fairly straightforward process and the algorithm low complexity allows for easy implementation (in a software such as MATLAB or similar). On the other hand, it is not situation specific and it is free from biological and statistical assumptions inherent to other methods (usually difficult to validate).
Therefore, this study aims to assess movement dissimilarity during the course of an action providing information about critical moments of the task (eg moments with increased demand of velocity control). As we are proposing a running version of an existing technique (the Procrustes Method), the first part of the study was performed with simulated data to test whether this version is viable to be applied (or not) in real data sets. The promising results from the first part, allowed us to move forward to the second part which was undertaken as an exploratory study with real data from stroke patients’ movements to determine how different two trajectories are over time and thus to assess the influence of combining VR practice with conventional therapy in a rehabilitation program. This way we expect to create a viable version of the Running Procrustes Method that can be used in further research.
2. Materials and Methods
2.1. The Task
The experimental task was a drinking water task, which included reaching for, picking up the glass, lifting it off the table, drinking some water, return the glass to the centre of the table, and return the hand to the initial position. Participants were instructed to keep their trunk as straight as possible without compensatory movements.
Participants sat on a bench, 46 cm high with their feet firmly resting on the floor. A 73 cm high table was placed in front of the participants at a distance where, at the initial position, participants remained with their hands resting on the edge of the table, their elbows flexed by approximately 90°, and their arms vertically and close to the body. In addition, this distance should allow the participants to perform the drinking activity, without rotation or flexion of the trunk. A 200 mL acrylic cup, filled with 100 mL of water, was placed in the centre of the table (35 cm of the edge of the table).
2.2. Procedures
Neurological examination of patients was done by the National Institute of Health Stroke Scale (Lyden, 2017). Functional independence was measured by motor items of the Functional Independence Measure (Kimura et al., 2017), motor function was assessed by upper limb sub-items of the Fugl–Meyer scale (Fugl-Meyer et al., 1975), and subjective valuation of muscle tone was performed using the modified Ashworth scale (Biering-Sørensen et al., 2006) in the shoulder, elbow and wrist muscles.
For the kinematic analysis, the glass trajectory while participants performed the activity of drinking water was recorded in the sagittal plane of motion (ie flexion and extension of the arm) using the Qualisys Motion Capture System (Qualisys AB, 411 13 Gothenburg, Sweden). The image data were captured by Qualisys Track Manager 2.6 – QTM and exported to Visual 3D software.
In order to allow the tracking of the marker and the 3D conversion of data, information about the positioning and orientation of each camera was necessary and so the system was calibrated before data collection. An L-shaped structure was used, positioned on the floor where data collection would be performed, with four passive markers fixed. This structure allowed the definition of the coordinates represented by the X (mid-lateral), Y (anteroposterior) and Z (longitudinal) planes. On these planes, a T-shaped rod was scanned with two markers fixed at its ends for a period of 1 minute.
For the static kinematic analysis, the researcher positioned the glass marker on the outer surface of the glass, close to its upper edge and on the opposite side to where the participant would position the mouth to drink the water. Taking into account that the glass was resting in the centre of the table, the marker was positioned on a projection of the participant’s median line.
Patients were randomly assigned to a control group (CG) and to an experimental group (EG). The CG underwent a conventional physiotherapy program with stretching and strengthening exercises for the upper and lower limbs, as well as coordination, gait and balance, which lasted 30 minutes. The EG participated in a rehabilitation program with mixed sessions of 30 minutes of conventional physiotherapy plus 20 minutes of virtual reality practice in a game console. More precisely, participants of the EG trained the affected upper limb with the Kinect device of XBOX 360 (Microsoft®, Redmond, Washington, EUA) using the virtual darts game ‘Kinect Sports: Season 2’. In this virtual game, an avatar was created and the participant’s movements corresponded to the avatar’s movements. Patients performed the virtual darts game task with the upper limb remaining standing 2.5 m away from a 50-inch TV. At this position, the central target of the dartboard was 1.3 m high. Each patient performed 15 trials divided into 3 blocks of 5 trials, with a resting time of 45 s between blocks. The intervention program for both groups (ie CG and EG) lasted 4 weeks with 12 sessions (3 times a week).
After the intervention, another kinematic evaluation of the drinking water task was performed using the same procedures of the initial evaluation. For each participant of both groups, the three-dimensional glass trajectories (x, y, z), before and after the rehabilitation program, were recorded and saved as xls files.
2.3. Participants
The study included 12 stroke patients (6 in CG and 6 in EG). Inclusion criteria of stroke patients were i) first-episode stroke diagnosis; ii) unilateral brain injury (6 with right hemiparesis and 6 with left hemiparesis); iii) chronic stage of stroke (after 6 months); iv) right-handed individuals; v) aged under 70 years; vi) able to respond to clinical assessment instruments and vii) able to move the affected upper limb sufficiently to perform the experimental task (ie drinking task). The exclusion criteria were i) unilateral neglect; ii) uncorrected hearing or iii) primary visual impairment.
The sample size was estimated based on F-tests (ANOVA, Repeated Measures, Within-Between Interaction), for 2 groups and 3 measurements, with a large effect size of 0.40, an alpha error probability of 0.05, a beta error probability of 0.20, and a correlation among measures of 0.50, which provided a total sample size of 12 subjects (eg a sample size per group of 6 subjects). This procedure was performed using the GPower software (version 3.1, Universität Düsseldorf, Germany). The decision of selecting a large effect size (as a parameter for the sample size estimation) was based on some previous studies about clinical virtual reality practice that reported that kind of effect magnitude (Negut, Matu, Sava, & David, 2016; Rizzo et al., 2019).
The study was approved by the Institutional Ethics in Research Committee, according to the World Medical Association Declaration of Helsinki. All participants were informed about the research procedures and signed an informed consent form, agreeing to participate in the study. Patients were instructed to continue their physiotherapeutic treatment and their therapists not to perform therapies related to upper limb rehabilitation. The study was registered on clinical trials (NCT03583827).
2.4. Measuring Trajectories Dissimilarity – The Running Procrustes Method
The Procrustes Method is a mathematical procedure for relating two shapes (data matrices) U and V grounded on finding a linear transformation – scaling, rotation, reflection and translation – of the points in shape V to best match them to the points in shape U. For two shape matrices U and V with size n × p, where n is the number of points and p is the number of measurements per point, a new shape matrix W with size n × p is determined from the equation W = b V R + T, where b is a scaling factor that shrinks (b < 1) or stretches (b > 1) the shape, R is an orthogonal rotation/reflection matrix with size p×p, and T is a translation matrix with size n × p. The elements b, R and T are chosen to minimise the distance between the target shape matrix U and the transformed shape matrix W given by the sum of squared deviations. The dissimilarity measured between the two shapes is the minimised value of the sum of squared deviations standardized by the sum of squared elements of the mean centred target shape. The value of d varies between 0 and 1 (or 0% and 100%), with a value near 0 reflecting strong shape similarity and a value near 1 representing strong shape dissimilarity (Passos et al., 2017).
In this study, we propose an improved version of this method with a moving window of fixed length that provides a continuous dissimilarity function over time. More precisely, a window of length L is shifted point by point over the trajectories and, at each shift, the dissimilarity value d between the two subtrajectories is obtained. The value of L needs to be specified for each situation and some time series techniques with moving windows point to window lengths between 10 and n/2 where n is the series length (Lemoine et al., 2006). Recent studies with movement data series from Parkinson’s patients involving methodologies with moving windows suggest window lengths between 10 and n/8 where n is the series length (Lemoine et al., 2006; Marmelat et al., 2020). More specifically, the value of L can be selected within a range as the one maximising the coefficient of variation of the dissimilarity between the subtrajectories (and thus maximising the dispersion of the dissimilarity). Next, the set of dissimilarity values d is stored and plotted as a continuous function over time, enabling the identification of maximum and minimum values, as well as mean and standard deviation. Subsequently, the detection of increases in the dissimilarity values allows identifying critical moments of the movement trajectory, providing clues for a deeper investigation (eg analysis of velocity and acceleration profiles).
2.5. Simulation Study
To test the relevance and the reliability of the Running Procrustes Method proposed in this paper, a simulation study was undertaken using simulated sets of data with size n×p = 100×2, where n = 100 is the number of points and p = 2 is the number of coordinates (eg x and y coordinates). More precisely, the simulated data set were i) three ellipse shaped sets, E1, E2 and E3, with eccentricity 0.7, 0.3 and 0.9, respectively; ii) transformed versions of the previous sets, ETN1, ETN2 and ETN3, corresponding to each original set (with a small translation with direction (1,−1)) plus the values of a Gaussian white noise with mean 0 and standard deviation 0.1 from point 1 to point 25 and from point 51 to point 100, and plus the values of a Gaussian white noise with mean 0 and standard deviation 0.5 from point 26 to point 50. These geometrical shapes were selected since they are simple shapes that resemble some of the experimental trajectories (eg in the xy-plane). Then, the Running Procrustes Method was undertaken to perform pairwise comparisons between each original shape and the corresponding transformed one (with two noises), between the three transformed shapes (with two noises) and between the three original shapes. Throughout this procedure, the selected window length was L = 25 to match the length of the interval in which the white noise with larger variance was summed and therefore the larger coefficient of variation of the dissimilarity was obtained. All the procedures related to the proposed method were implemented in original routines in the MATLAB software based on the function procrustes (version R2020b, MathWorks Inc., USA).
Figure 1(a) and (b) displays the graphical representations of the ellipse shaped sets, E1, E2 and E3, with different eccentricities and the corresponding transformed versions, ETN1, ETN2 and ETN3, with two noises. (a) Simulated ellipse shaped sets, E1, E2 and E3, with eccentricity 0.7, 0.3 and 0.9, respectively, (b) Transformed versions of the ellipse shaped sets, ETN1, ETN2 and ETN3, with a small translation and the sum of white noise values with two standard deviations.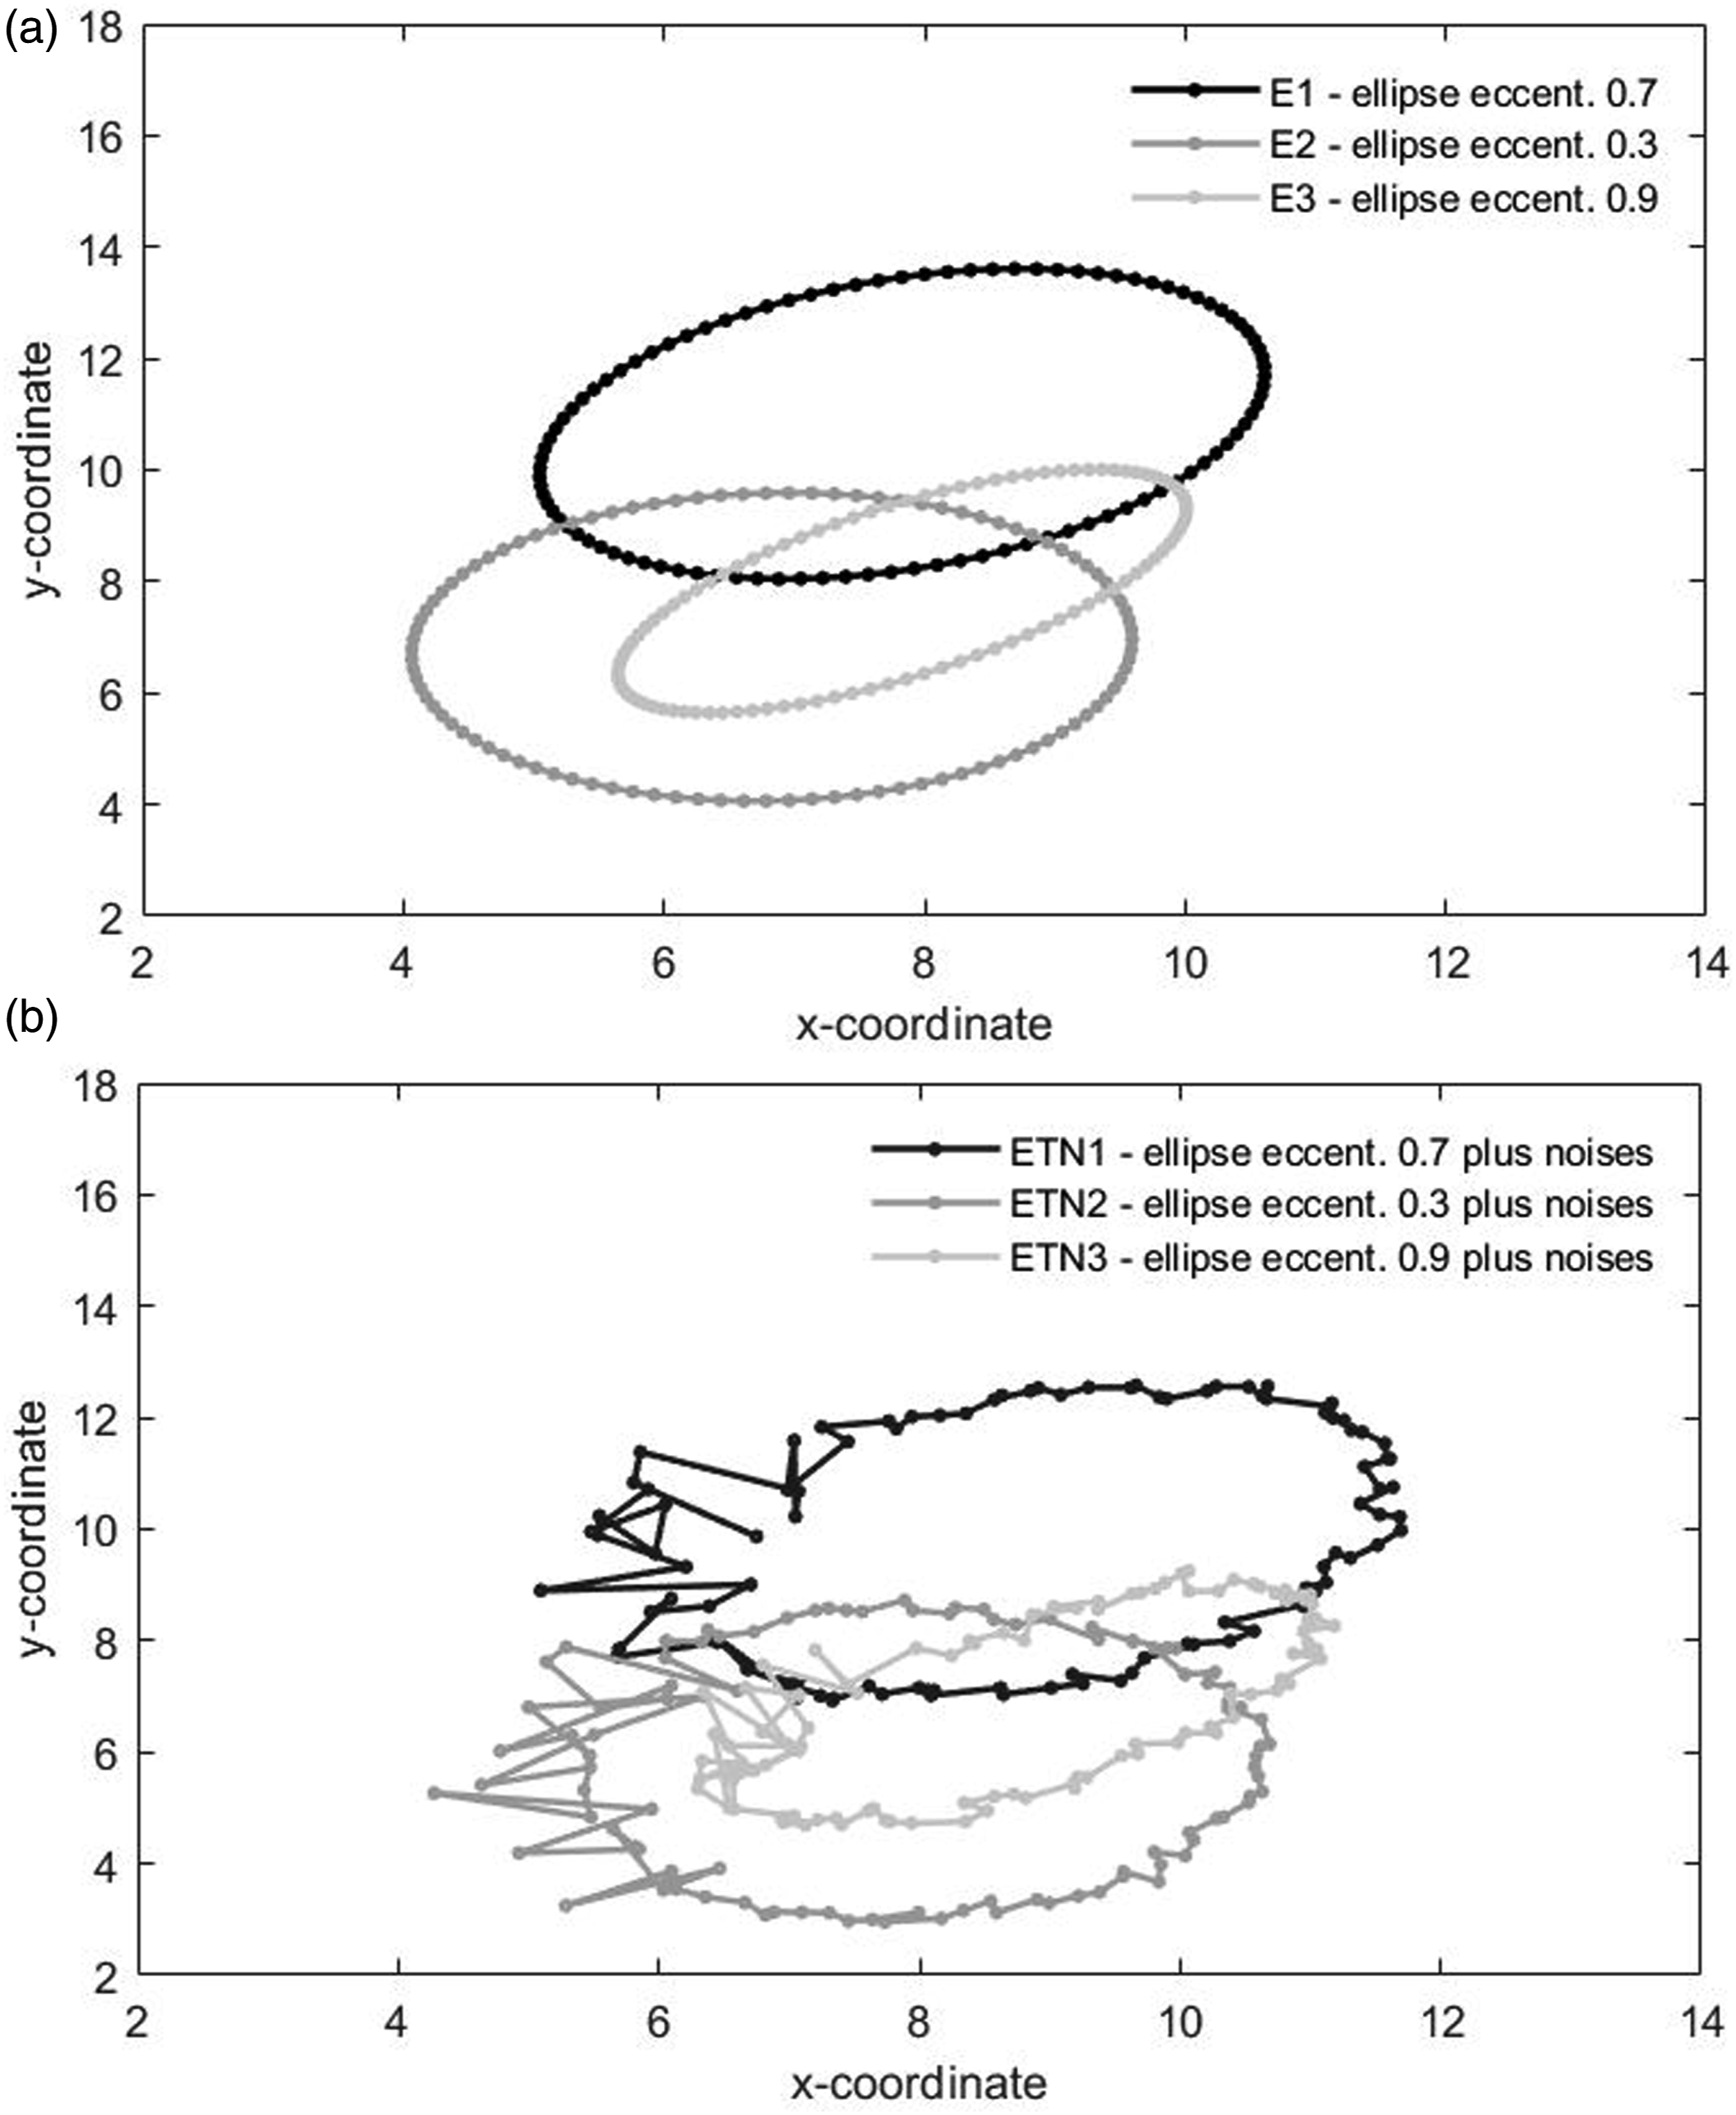
Figure 2(a) and (b) illustrates the outputs of the Running Procrustes Method applied to the pair of sets E1 (ellipse shaped set with eccentricity 0.7) and ETN1 (transformed set with two noises). As previously mentioned, a window of length L was shifted point by point over the trajectories and, at each shift, the dissimilarity value d between the two subtrajectories was obtained. Then, the set of dissimilarity values d was plotted as a continuous function over time, highlighting the maximum and minimum values, as well as the mean plus and minus the standard deviation. In a first step, the window length was set at L = n = 100, that is, the simple Procrustes Method was performed over the whole trajectories. In a second step, the window length was specified as L = 25, meaning that the Running Procrustes Method was undertaken over 76 moving windows. (a) Outputs of the Running Procrustes Method undertaken for the pair of sets E1 (ellipse shaped set with eccentricity 0.7) and ETN1 (transformed set with two noises), (b) Set of dissimilarity values d over time highlighting the maximum and minimum values, as well as the mean plus and minus the standard deviation.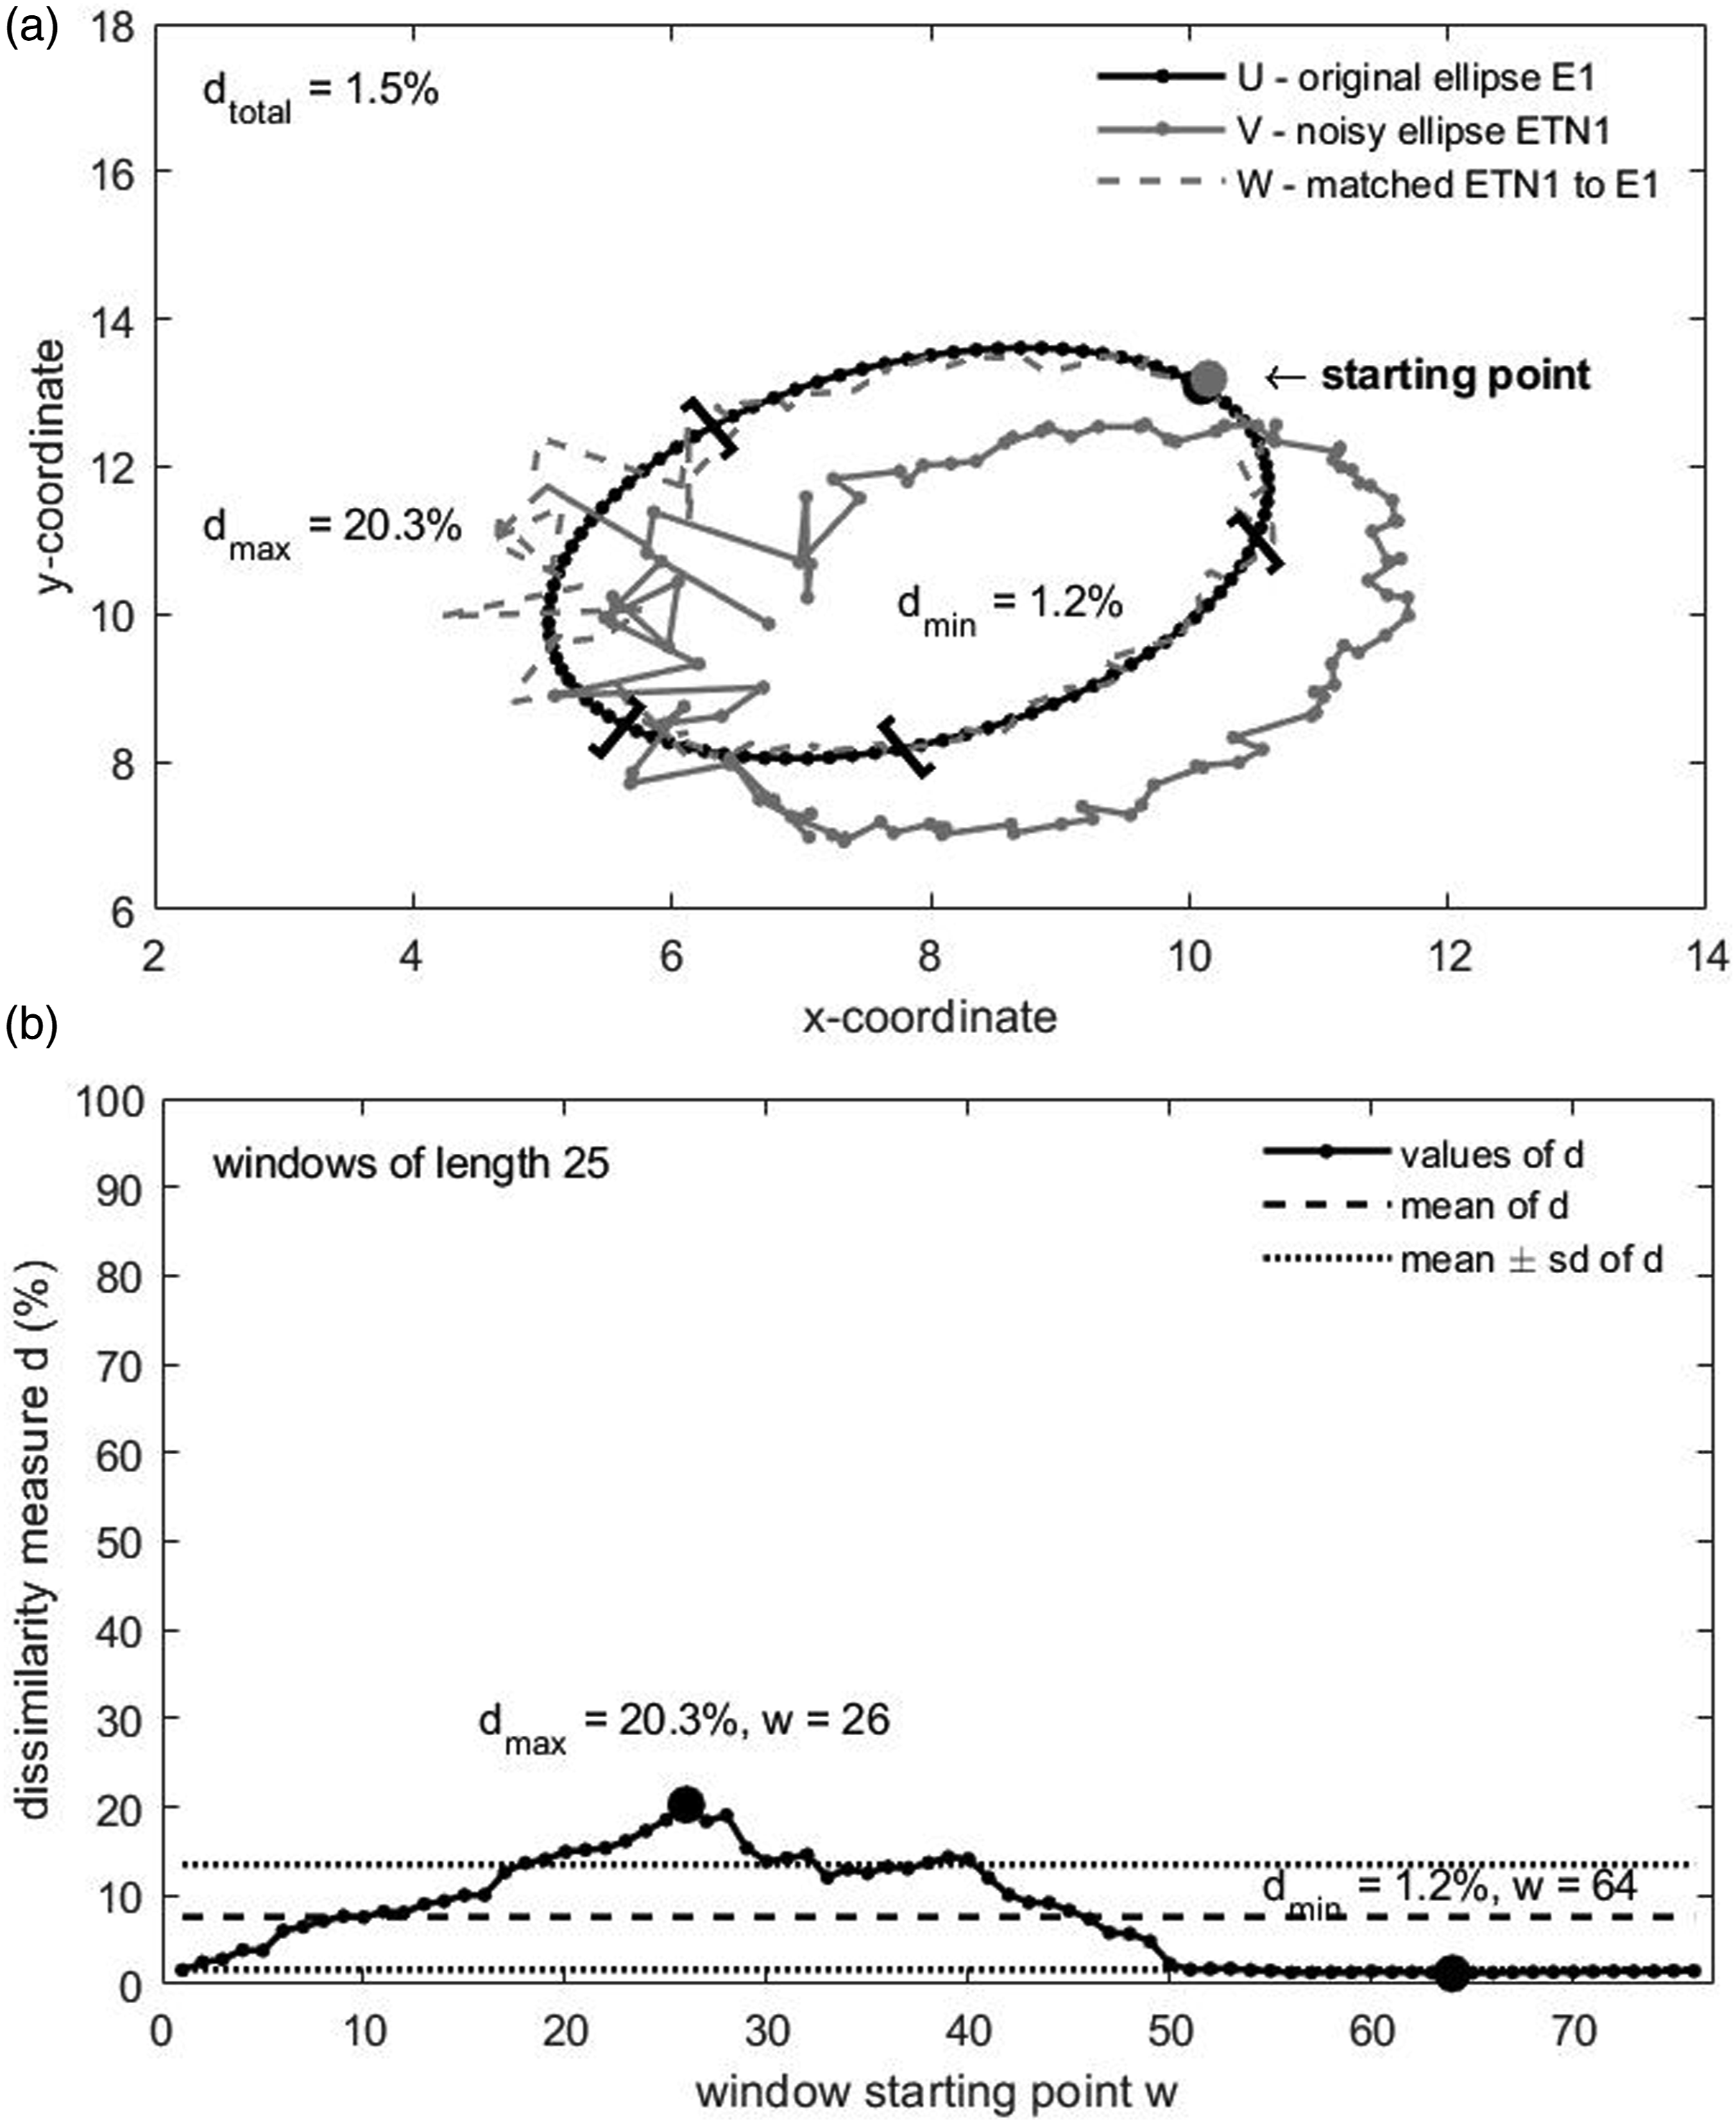
For the case when L = 100, the global dissimilarity value d (in percentage) between the two trajectories was 1.5%, the scaling factor b was 0.97, the rotation matrix R had angle 0.00°, and the translation matrix T had direction (−0.82, 1.35). For L = 25, the set of 76 dissimilarity values d (in percentage) had a maximum of 20.3% in the window starting at point 26 and a minimum of 1.2% in the window starting at point 64; the mean was 7.6% and the standard deviation 5.9%, implying that the mean plus the standard deviation was 13.5% and the mean minus the standard deviation was 1.7%. Similar outputs were obtained for the other pairs of simulated sets with original shape versus transformed shape. More precisely, for moving windows with L = 25, the sets of dissimilarity values revealed maxima and minima different from the global dissimilarity value (in general, above and below the mean plus and minus the standard deviation, respectively); also, the maxima were observed in windows starting at point 26 or near this point (recall that the simulated noise with the larger standard deviation was added from point 26 to point 50).
Resumed results of the running procrustes method with window length L = 100 and L = 25 undertaken for each considered pair of simulated sets.
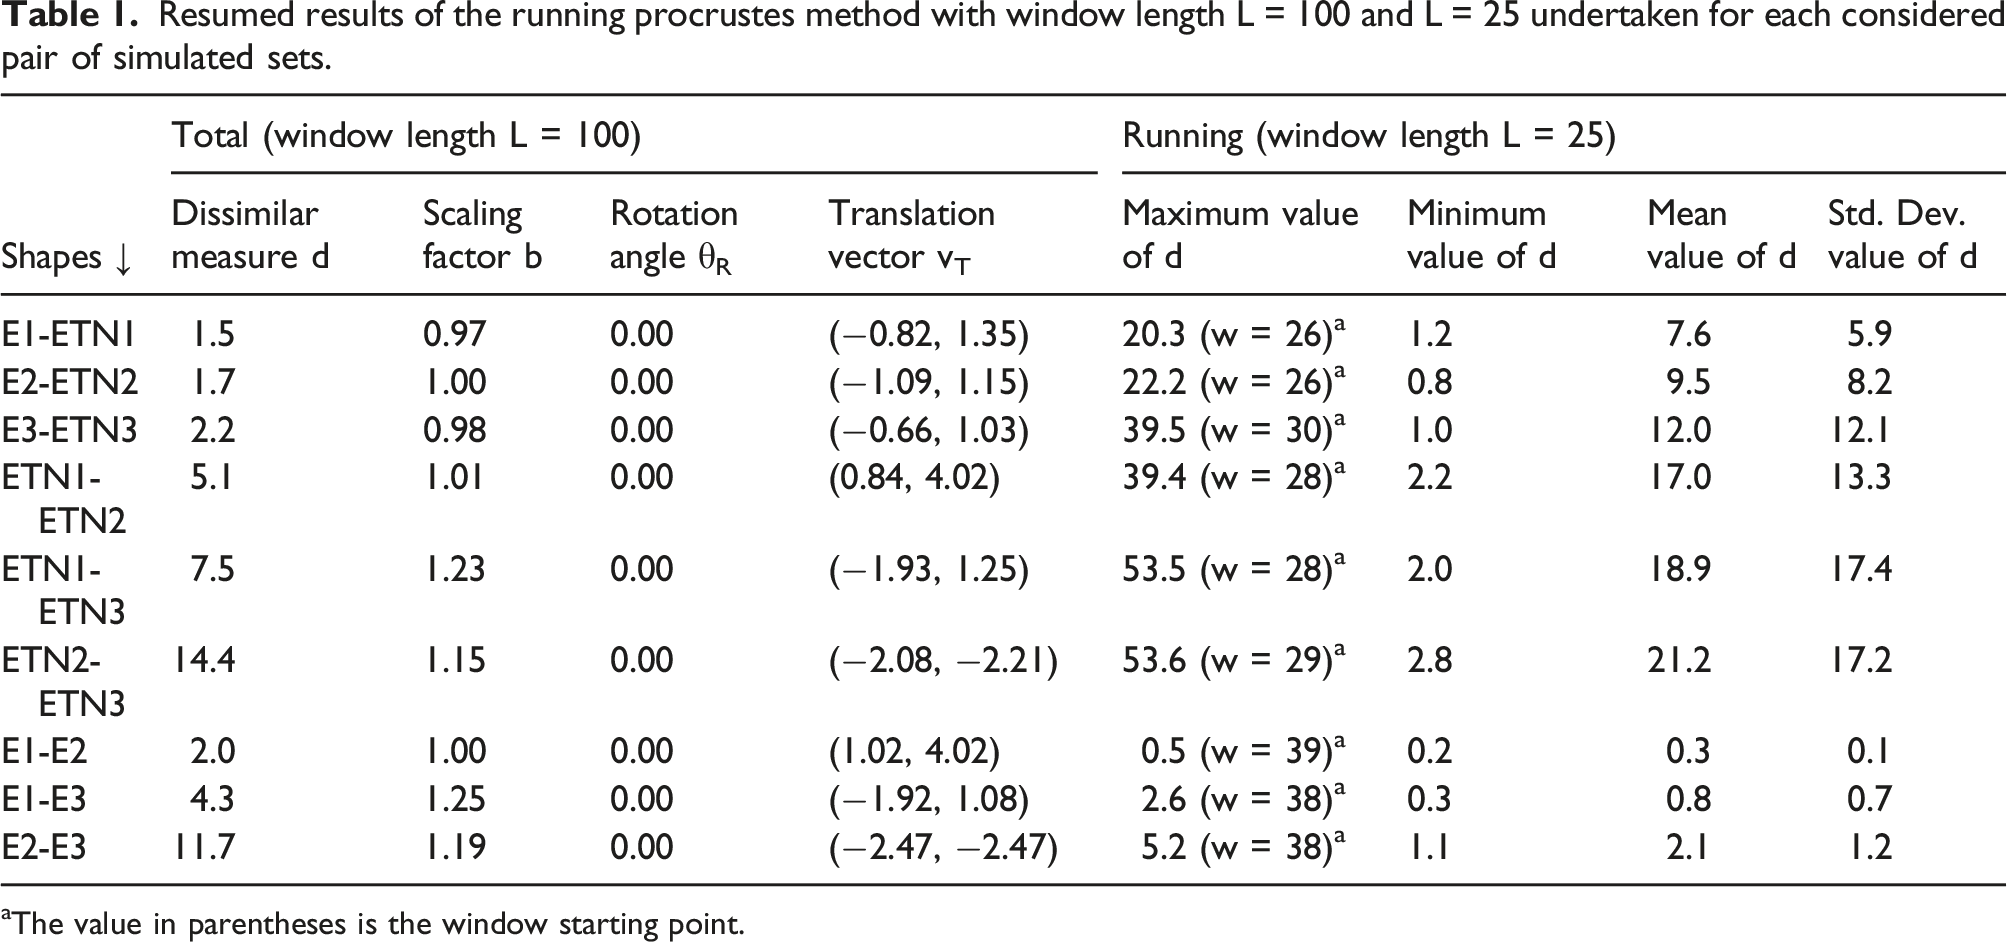
aThe value in parentheses is the window starting point.
These results confirm the proposed Running Procrustes Method as a reliable tool to quantify dissimilarity over time between two movement trajectories (eg under different conditions or at different times).
2.6. Statistical Procedures
The first step of the statistical analysis of the stroke patients’ data consisted on computing the dissimilarity mean values between the glass trajectories, before and after the intervention program, for the participants of each group in each plane (ie xy and xz). The maximum and minimum values of the dissimilarity measure were also identified and considered critical moments of the movements. Next, Shapiro–Wilk’s tests were used to examine the normality of the dissimilarity in each plane and in each group; Mauchly’s test and Levene’s tests were also used to check the sphericity and the equality of variances of the dissimilarity across planes and across groups, respectively. Subsequently, a mixed ANOVA for Repeated Measures × Two Groups was performed to evaluate the difference between the dissimilarity mean values of both planes and both groups, as well as to check the existence of interaction. Lastly, t-tests for one sample were performed in order to quantify the magnitude of the dissimilarity mean value in each group and in each plane.
To analyse hypothetical improvements in the fluidity of the drinking task, the second step comprised the determination of the velocities and the accelerations of the glass trajectories, before and after the intervention program, for the participants of each group in each plane (ie xy and xz). The velocities and the accelerations were smoothed with a Savitzky–Golay polynomial smoothing filter.
Following the previous step, the data series of the velocities and the accelerations were split into three thirds, according to the critical moments previously found with the Running Procrustes Method. Next, the mean values of the velocities in each third and the number of peaks (local maxima and minima) of the accelerations in each third were obtained. Then, the differences between the velocity means before and after intervention standardized by the velocity means before (ie the standardized variation of velocity means) in each third, as well as the differences between the acceleration peaks before and after intervention standardized by the acceleration peaks before (ie the standardized variation of acceleration peaks) in each third were stored. The purpose of these standardizations for the velocity and for the acceleration was to obtain relative measures of variation taking the initial values as reference (eg a standardized variation of velocity of 0.10 represents a decrease of 10% in the velocity relative to the initial velocity). Subsequently, Shapiro–Wilk’s tests were used to examine the normality of the standardized variation of velocity means and the standardized variation of acceleration peaks in each group and in each third (for each plane); Mauchly’s test and Levene’s tests were also used to check the sphericity and the equality of variances of the standardized variations across thirds and across groups, respectively. Ultimately, mixed ANOVAs for Repeated Measures × Two Groups were performed to evaluate the difference between the standardized variation of velocity means and the standardized variation of acceleration peaks of the three thirds and the two groups, as well as to check the existence of interaction (for each plane).
The probability p < .05 was set as the criterion for statistical significance. This part of the study was undertaken using the IBM SPSS software (version 26, IBM Inc., USA).
3. Results
Throughout this section, the data from participant P5, randomly selected, illustrate the outputs obtained through the Running Procrustes Method for the examination of (i) the dissimilarity of glass trajectories, which identify the movement critical moments; and (ii) the velocity and acceleration of glass trajectories, in those critical moments.
3.1. Dissimilarity of Glass Trajectories Over Time
Figure 3 (a, b, c, d) exhibits exemplar data from participant P5, concerning the outputs of the Running Procrustes Method applied to the pairs of glass trajectories, before and after the intervention program, in the xy-plane (which captures the transversal plane of movement, similar to a top-view) and the xz-plane (which captures the sagittal plane of movement, similar to a lateral-view). In this particular situation, the window length was specified as L = 100 since this value maximised the coefficient of variation of the dissimilarity between the subtrajectories. (a) Outputs of the Running Procrustes Method from participant P5 for the pair of glass trajectories before and after the intervention program in the xy-plane (transversal plane, top-view of movement trajectory), (b) Set of dissimilarity values d over time highlighting the maximum and minimum values, as well as the mean plus and minus the standard deviation, (c) Outputs of the Running Procrustes Method from participant P5 for the pair of glass trajectories before and after the intervention program in the xz-plane (sagittal plane, lateral-view of movement trajectory), (d) Set of dissimilarity values d over time highlighting the maximum and minimum values, as well as the mean plus and minus the standard deviation.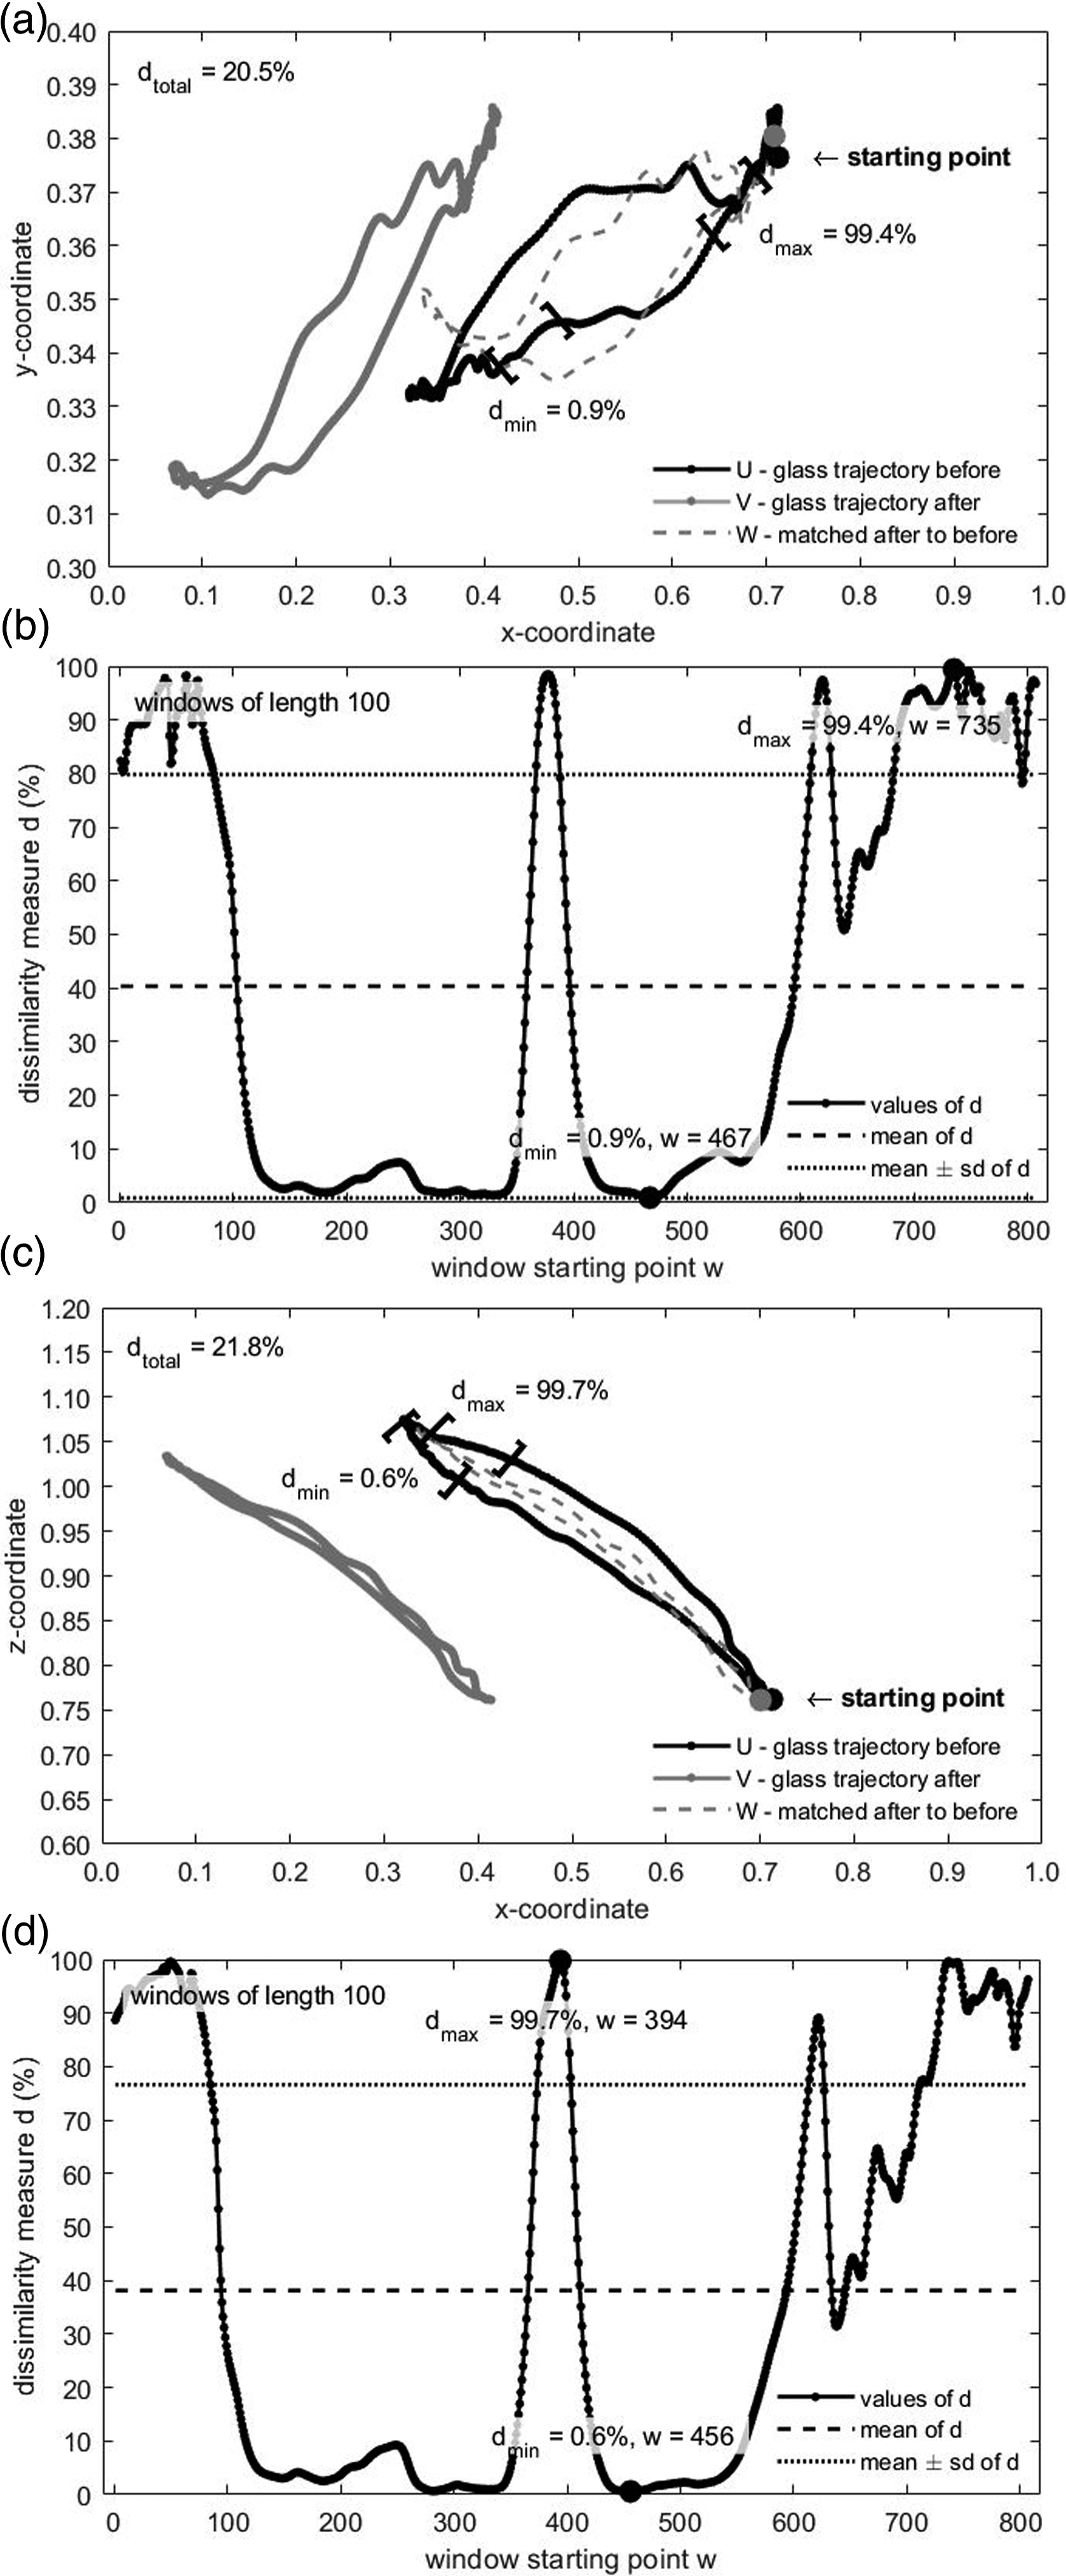
For the xy, transversal plane, the set of dissimilarity values d between the glass subtrajectories before and after the intervention program had a maximum of 99.4% in the window starting at point 735 and a minimum of 0.9% in the window starting at point 467; the mean dissimilarity value was 40.3% and the standard deviation 39.5%.
For the xz, sagittal plane, the set of dissimilarity values d between the glass subtrajectories before and after the intervention program had a maximum of 99.7% in the window starting at point 394 and a minimum of 0.6% in the window starting at point 456; the mean dissimilarity value was 38.1% and the standard deviation 38.5%.
Analysing the trajectories before and after the intervention, both planes of motion exhibited higher dissimilarity values n near the initial point (ie lift off the glass from the table), the midpoint (ie smoothly touch the glass to the mouth) and the endpoint (ie replace the glass on the table). Moreover, the dissimilarity mean value between the two trajectories before and after intervention was moderately larger in the transversal plane than in the sagittal plane.
The other patients, from the CG and the EG, produced glass trajectories with different and unique shapes, but with overall properties similar to the ones reported for patient P5 (ie higher dissimilarity values in both planes near the initial point, midpoint and endpoint and slightly larger mean values in the transversal plane).
3.2. Statistical Outputs
Next, the dissimilarity mean values between glass trajectories, before and after the intervention program, obtained for the participants of each group in each plane of motion were subjected to statistical inference.
Descriptive statistics of the dissimilarity measure d (in percentage) for each group and each plane.
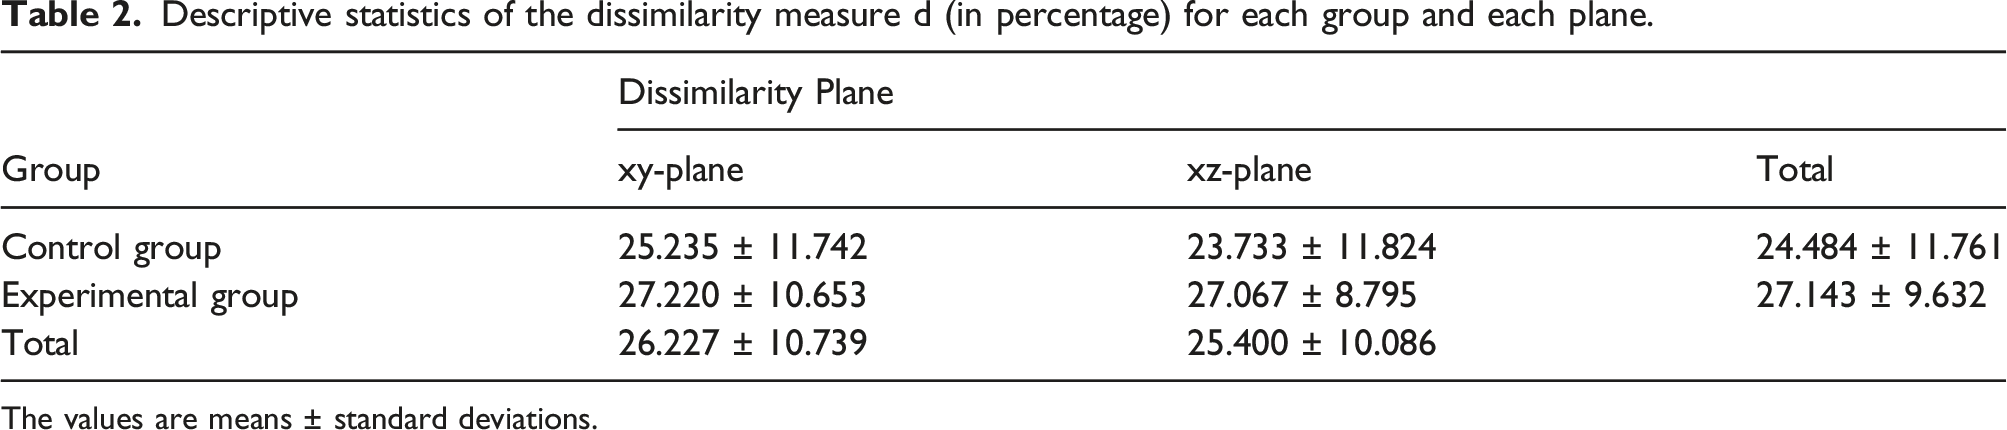
The values are means ± standard deviations.
Despite the between-groups result was not statistically significant, it is worth noting that the mean dissimilarity of the EG was larger than the one of the CG. The t-tests for one sample showed that, in each group and in each plane, the mean dissimilarity between glass trajectories before and after intervention was significantly higher than 0% (CG, xy-plane: t(5) = 5.264, p = 0.002, d = 2.149; CG, xz-plane: t(5) = 4.917, p = 0.002, d = 2.007; EG, xy-plane: t(5) = 6.259, p = 0.001, d = 2.555; EG, xz-plane: t(5) = 7.538, p = 0.001, d = 3.077).
In sum, the statistical tests for the dissimilarity between glass trajectories, before and after the intervention program, showed that (i) the dissimilarity means of both groups (and of both planes) were not significantly different, although the mean of the EG was larger than that of the CG; and (ii) the dissimilarity mean in each group and in each plane was significantly higher than 0%. This indicates that both rehabilitation programs induced a significant change in each group and in each plane regarding the movement pattern of the drinking water task.
To evaluate if this change was in fact an improvement in the task performance, the velocities and the accelerations of the glass trajectories, before and after the intervention program, for the participants of each group in each plane were determined. The data series of the velocities and the accelerations were split into three thirds, based on the critical moments identified with the Running Procrustes outputs. More precisely, these critical moments were characterised with the highest dissimilarity values and corresponded to the parts of the glass trajectories linked to the moments of (i) lifting the glass from the table (1st third); (ii) smoothly touching the glass with the mouth (2nd third) and (iii) replacing the glass on the table (3rd third). Next, the mean values of the velocities and the number of peaks of the accelerations in each third were obtained and their standardized variations were stored.
3.3. Velocity and Acceleration of Glass Trajectories
Figure 4(a)–(d) shows exemplar data from participant P5, regarding the velocities and the accelerations of the glass trajectories, before and after the intervention program, in both the transversal and the sagittal plane. The outputs revealed that, in each plane, the velocity means after the intervention were higher than the means before the intervention in the 1st and 2nd thirds, that is, in the initial and mid parts of the trajectory. Moreover, the acceleration peaks after the intervention were less than the ones observed before the intervention, again in the initial and mid parts of the movement trajectory. (a) Velocities from participant P5 for the pair of glass trajectories before and after the intervention program in the xy-plane (transversal plane, top-view), (b) Accelerations from participant P5 for the pair of glass trajectories before and after the intervention program in the xy-plane (transversal plane, top-view), (c) Velocities from participant P5 for the pair of glass trajectories before and after the intervention program in the xz-plane (sagittal plane, lateral-view), (d) Accelerations from participant P5 for the pair of glass trajectories before and after the intervention program in the xz-plane (sagittal plane, lateral-view).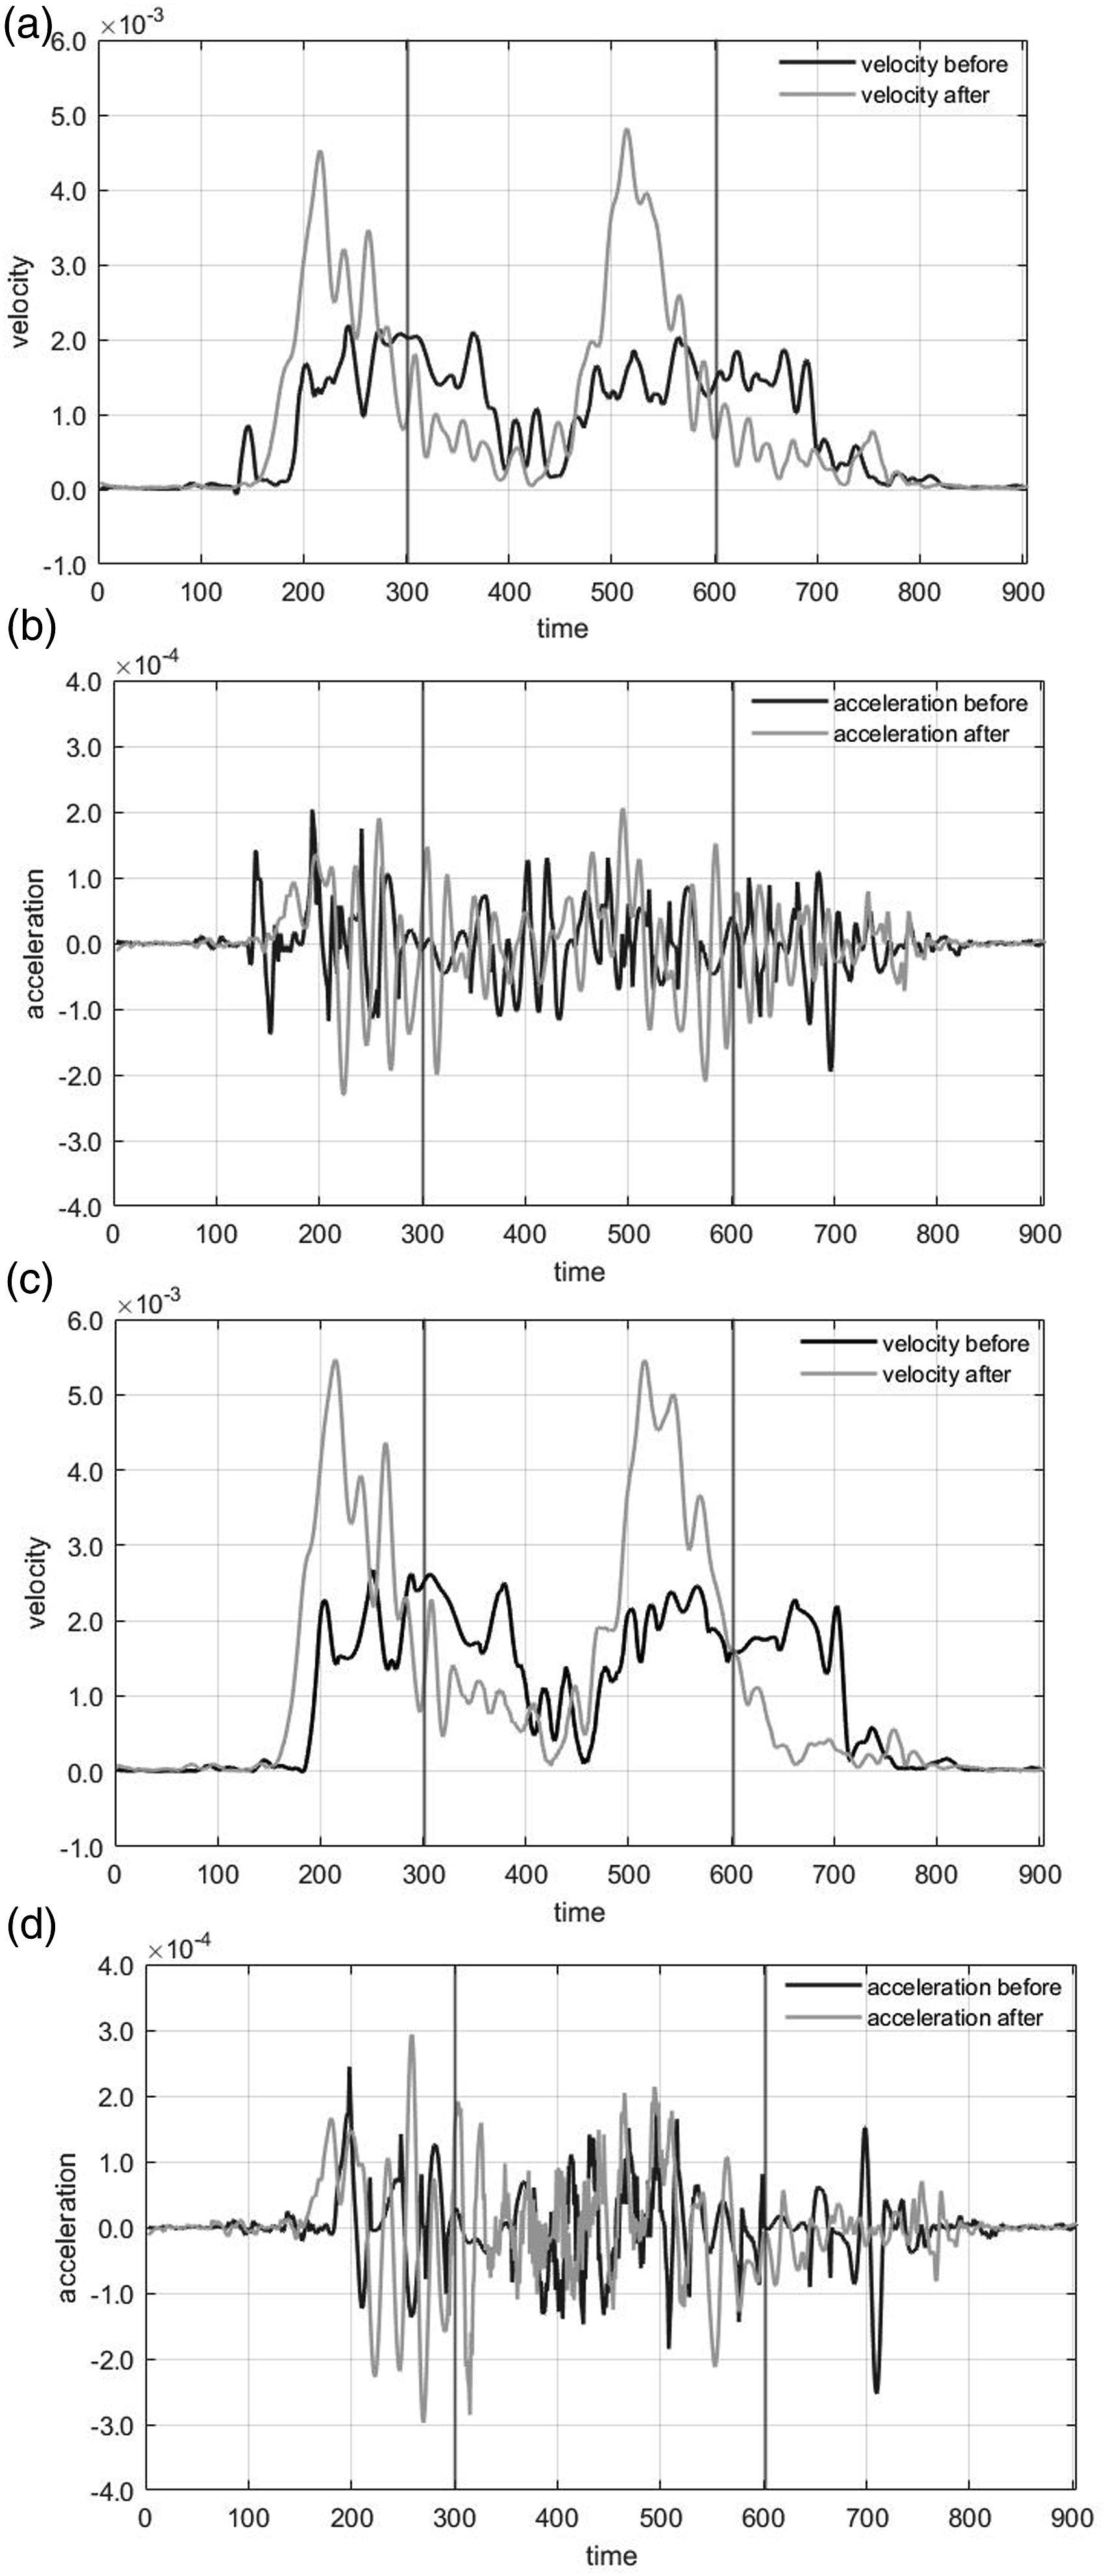
The remaining patients, from the CG and the EG, produced velocities and accelerations in both planes with some resemblance to the ones presented for patient P5.
Descriptive statistics of the standardized variation of velocity means and the standardized variation of acceleration peaks for each group, each third and each plane.
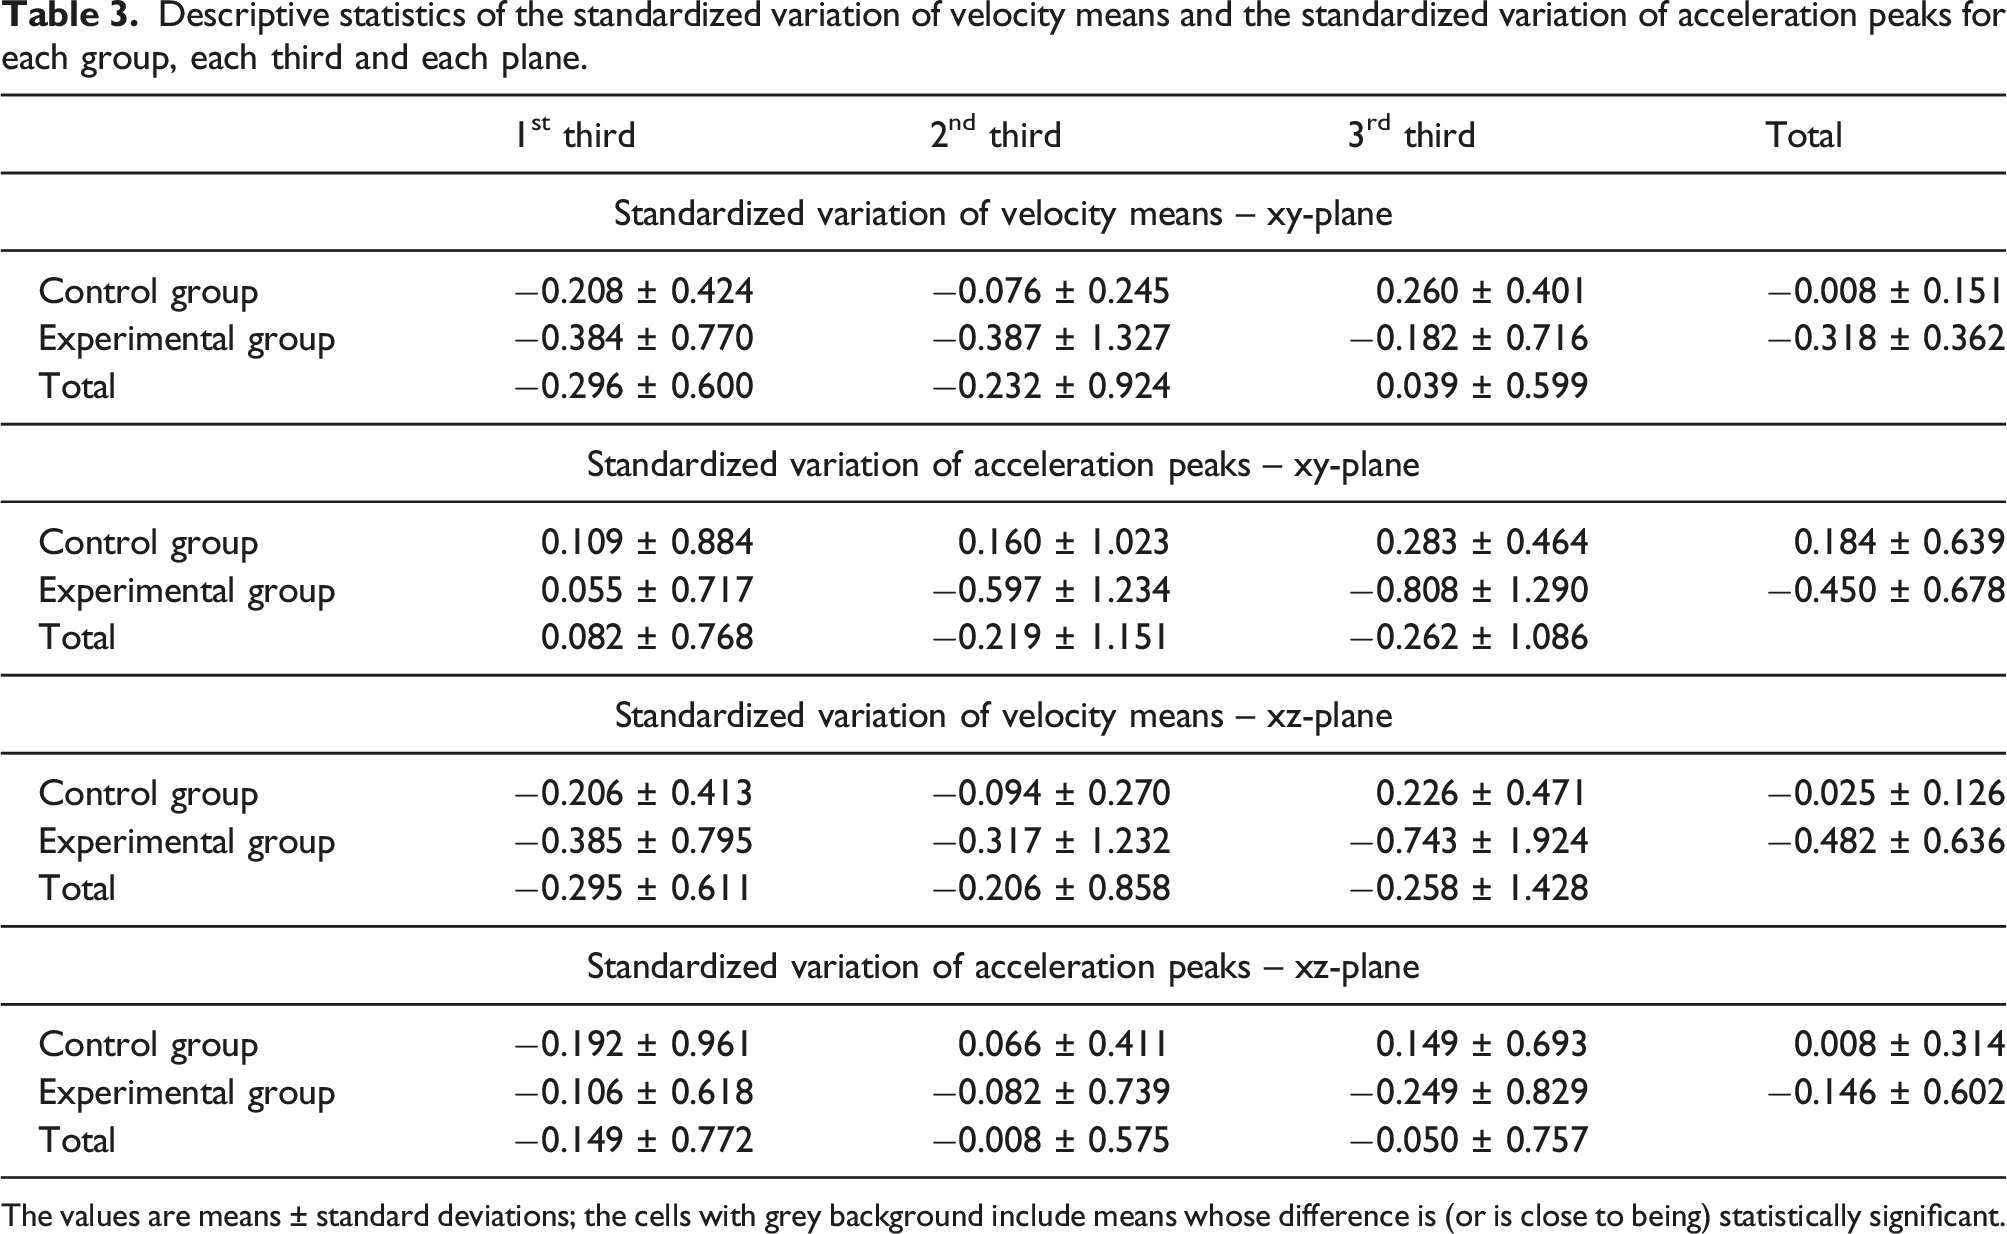
The values are means ± standard deviations; the cells with grey background include means whose difference is (or is close to being) statistically significant.
Despite the within-thirds results were not statistically significant, it can be pointed out that, in both planes, only the CG displayed a decrease in velocity means in the last third. Regarding the acceleration, in the transversal plane, the EG exhibited an increase in acceleration peaks in the last 2/3 of the glass trajectory and, in the sagittal plane, this group displayed an increase in acceleration peaks in the three thirds.
In short, in the transversal plane, the EG obtained a significantly larger increase in velocity means than the CG, but it also revealed an increase at the edge of statistical significance in acceleration peaks. In the sagittal plane, the EG obtained a larger increase at the edge of statistical significance in velocity means than the CG.
4. Discussion and Conclusions
The main purpose of this paper was to develop a running version of an existent technique (the Procrustes Method), to capture dissimilarity values between two trajectories along time. The main idea was to define a sliding window of fixed length that allows the determination of a continuous dissimilarity function of trajectories over time and enables the identification of important elements (eg maximum and minimum values). For this purpose, a first analysis with simulated data and a second analysis with experimental data were carried out.
The simulation study results reflected the reliability of the proposed method to quantify the dissimilarity between two trajectories with irregular variability, since the maximum values were registered in windows starting at point 26 or nearby as stipulated in the noise location. These results showed that the Procrustes Running version captures higher dissimilarity values in the subtrajectories with larger (noise) variability, which reinforces the specificity of the provided dissimilarity values.
This innovative running version also fulfilled the other purpose of this paper, which was to characterise movement trajectories in a daily life task (ie drinking water) for two rehabilitation programs (conventional physiotherapy program and conventional therapy with VR practice) in the recovering of stroke patients. The outputs obtained with this new methodology pointed to changes in movement trajectories for both rehabilitation programs in stroke patients. The results from this exploratory study with experimental data increase the expectancies regarding the use of the Running Procrustes Method in further research with similar experimental design.
The lack of statistical evidence for the difference between the dissimilarity mean values of both groups (ie CG vs EG) does not affect the reliability of this Running Procrustes version. In view of this outcome, the only thing we can say is that we cannot confirm with statistical significance the hypothetical beneficial effects of a mixed rehabilitation program in daily life tasks of after-stroke patients. Still, the mean dissimilarity before and after intervention of the EG was larger than that of the CG, but there was no statistical evidence that a VR based rehabilitation program produces highly different glass trajectories in a drinking water task.
The possibility of obtaining dissimilarity values over time provides information regarding critical moments of an action where movement velocity control is required. More precisely, the stroke patients’ data sets highlighted this specificity feature with the narrow part of the trajectories, corresponding to the moments of touching the glass to the mouth and lifting or replacing the glass on the table, exhibiting the higher dissimilarity values. Therefore, the largest dissimilarity values identified critical parts of the movement trajectory for the experimental task of drinking water, where the VR practice was supposed to have more influence (a hypothesis that was not confirmed). Still, these dissimilarity results emphasise the idea that a rehabilitation program does not have an equal influence on the course of a movement, that is, some parts of the movement trajectory get more benefits from the rehabilitation program then others. Data from our Running Procrustes version captured this difference with higher dissimilarity values at moments in which velocity control was required, namely i) the lifting of the glass from the table at the beginning of the movement towards the mouth; ii) the moment that the glass should smoothly touch the mouth (to drink water) and iii) the replacement of the glass on the table.
As stated in the introduction section, stroke patients frequently display slowness and abnormal discontinuity in movements, with a spatial segmentation of the movement in actions as reaching and transporting objects. (Kamper et al., 2002; Levin, 1996). Slowness and abnormal discontinuity characterise critical moments of a movement, such as to smoothly place an object on a table. It was expected that, after a rehabilitation program, stroke patients would exhibit patterns that are more functional at those critical moments, for instance by increasing velocity. In this study, it was hypothesised that the VR based program would produce more gains in movement control than the program with conventional therapy alone. In fact, the results of the transversal plane of motion displayed statistical significance for larger increase in velocity means for the EG (a decrease in slowness that can be associated with higher movement control). Nevertheless, this increase in the transversal plane of motion of movement velocity that can be linked to an increase in movement control had a cost. More precisely, the increasing of the velocity was related to a tendency to increase the acceleration peaks, which may characterise movement discontinuity, an issue that requires further research. In the sagittal plane of motion, although there was no statistical evidence, the EG also displayed a tendency for larger increase in velocity means. This lack of statistical significance was probably due to a small sample size. Regardless of this limitation, so far our results suggest that VR practice associated with conventional therapy produces beneficial effects on the rehabilitation of stroke patients. Notwithstanding, we are aware that further work is needed.
The innovative dissimilarity analysis along time provided relevant information regarding the identification of critical parts (ie the thirds) where the movement trajectory changed the most. Despite the results did not reach statistical significance, there were worthwhile outcomes to be discussed. The EG increased velocity in the three thirds (ie lifting the glass; touching the glass on the mouth; replace the glass on the table) of the movement trajectory, while the CG displayed a decrease in velocity in the last third (identified with the replacement of the glass on the table). This remaining slowness of the CG in the last third reflected no improvements on the control of this part of the movement task, which suggests no effects from the conventional therapy.
Our results reinforce the need for the VR practice not to be used singly, but within a complementary program that gathers other therapies and thus increases the overall therapy time (Laver et al., 2017). However, and despite some promising outcomes, this exploratory study had some limitations, which can be seen as issues for further research. First, the sample size was relatively small and perhaps insufficient to reach statistical significance. This was probably one of the issues of performing a longitudinal study with a special sample (stroke patients). Second, the time dedicated to the VR practice was eventually short and it can be conjectured that the slight improvements in movement velocity and fluidity (less acceleration deflections) could be enhanced by extending the time of the VR practice. Third, a mixed rehabilitation program was used and perhaps a cross-over design, with both groups practising conventional therapy and VR practice in isolation and with a sequential order, would reinforce these promising results regarding the use of VR practice in rehabilitation programs. The Running Procrustes version fulfilled our expectations, and we suggest that can it be used in the further work needed to investigate the questions above.
Footnotes
Acknowledgements
Our true acknowledge to all the patients who accepted to participate on this research study.
Declaration of conflicting interests
The author(s) declared no potential conflicts of interest with respect to the research, authorship, and/or publication of this article.
Funding
The author(s) received no financial support for the research, authorship, and/or publication of this article.
About the Authors