
Abstract
For omnichannel multi-brand retailers, store openings are consequential strategic decisions. Beyond whether to open a store, firms must choose a format, select product categories, and decide how to support them in-store. To inform these decisions, we study the openings of two large experience-centric stores and one small convenience-centric store operated by an omnichannel consumer electronics retailer. Using a staggered difference-in-differences model, we estimate the impact of store openings on retailer performance while accounting for product-category heterogeneity. We find that all three openings reduce online net revenue (online purchases minus returns), contrary to halo-effect expectations. However, only the large experience-centric stores offset these losses, increasing total net revenue (online plus in-store purchases, net of returns) by 21% to 23% in the short term, with effects that grow over time. The small convenience-centric store does not generate such gains. Total net revenue uplift also varies substantially across product categories within experience-centric stores. To explain this heterogeneity, we combine category-level sales data with survey-based measures of perceived in-store utility across three customer journey stages: information search, fulfillment, and returns. Using the retailer's classification, we distinguish between destination categories—higher-priced, complex products that motivate store visits (e.g., TVs)—and accessory categories—lower-priced complementary products (e.g., earbuds). For destination categories, variation in perceived in-store utility, especially at the information-search and fulfillment stages, explains differences in total net revenue uplift. For accessory categories, such variation is not statistically associated with revenue gains. These findings show that store format alone is not sufficient: the effectiveness of store openings depends on how well in-store capabilities align with category-specific customer needs across the customer journey, highlighting the importance of prioritizing destination categories while reconsidering the role of physical stores for accessory categories.
Keywords
Only very seldom did she order by post, because she wanted to see, to have the joy of touching the goods. —Au Bonheur des Dames (The Ladies’ Delight), Émile Zola, 1882 Translated and edited by Robin Buss
Introduction
Omnichannel, multi-brand retailers have become the backbone of modern retailing. Originally operating as either traditional brick-and-mortar chains or online specialists, most leading firms now integrate both physical and online channels. For these retailers, opening a new physical store is a high-stakes strategic decision with significant operational implications. Managers must decide whether to open a store, which format to adopt—experience-centric or convenience-centric—and which product categories should receive scarce space, staffing, and service resources. These decisions shape customer acquisition, category positioning, and, ultimately, long-term profitability. Given the capital-intensive and often irreversible nature of store investments, they also carry substantial risk.
These challenges are particularly acute for omnichannel, multi-brand retailers (e.g., Best Buy, MediaMarkt). Unlike single-brand firms, they sell widely available products across many categories and face competition not only from other retailers but also from platforms and brands selling directly to consumers. As a result, they cannot rely solely on product exclusivity or brand pull to attract shoppers; physical stores must create value by offering benefits that the online channel cannot easily replicate. One key lever for achieving this is store format: experience-centric formats emphasize high-touch service and multisensory 1 engagement, whereas convenience-centric formats prioritize accessibility and efficient fulfillment. However, the value of these in-store benefits depends on the product categories a retailer chooses to support with in-store presence. Specifically, value arises when the benefits a store provides align with what customers seek within a given category across the customer journey. This makes category selection, and the allocation of limited in-store resources across categories, a central strategic decision. Accordingly, this study places particular emphasis on how product categories differ in the extent to which they benefit from physical stores relative to the online channel.
Despite the importance of these decisions, prior research provides limited guidance for omnichannel, multi-brand retailers. Existing work largely examines single-brand settings (e.g., Bonobos, Warby Parker), focusing on how physical expansion affects demand generation and operational efficiency (Bell et al., 2018, 2020; Kumar et al., 2019; Pauwels and Neslin, 2015). For example, Bell et al. (2018) show that digitally native vertical brands (DNVBs) 2 benefit from opening zero-inventory showrooms (ZIS) that stimulate demand and improve efficiency, while follow-up work (Bell et al., 2020) demonstrates that experience-centric showrooms can increase spending, accelerate purchase cycles, and reduce returns. However, these findings are derived from single-brand settings in which firms control their value chain and focus on a relatively narrow set of products. In such settings, introducing a showroom or store tends to have relatively straightforward implications: it helps resolve fit/size uncertainty, reduces return rates (Bell et al., 2018) or strengthens brand attachment (Avery et al., 2012; Zhang et al., 2019). In contrast, omnichannel, multi-brand retailers face fundamentally different challenges. They lack such control, operate across diverse product categories, and must serve heterogeneous customer needs. Because the role of the store differs across categories—from information search to fulfillment—insights from single-brand (and often single-category) settings offer only partial guidance. Critically, we lack empirical evidence on how store format and category-specific needs jointly shape performance in omnichannel, multi-brand retailing.
We address this gap by studying store openings of a leading omnichannel, multi-brand consumer electronics retailer. The firm evolved from an online-first origin into a highly integrated omnichannel operation and faced two central decisions: which store format to deploy and which product categories to feature and support in-store. At the time of our study, the participating retailer was simultaneously expanding its network of large, experience-centric stores while experimenting with the introduction of a small, convenience-centric store. 3 Like many other retailers, it had to allocate scarce space, staffing, and service resources across categories with long-term consequences for performance. This setting allows us to ask: Under what conditions—specifically store format, and product category—can physical stores increase total net revenue (online plus in-store purchases, net of returns)? And how do category-specific differences in customers’ perceived in-store utility shape these outcomes?
To answer these questions, we move beyond aggregate store-level analysis and focus on the category level. Product categories differ systematically in the utility customers derive from physical stores. Categories for which customers value sensory evaluation or expert advice, such as TV or smartphone, are natural candidates for in-store experiences, whereas standardized products such as powerbank or router rely less on physical interaction. Yet even these may benefit from in-store availability when customers value immediate fulfillment. Understanding such differences is central to guiding assortment decisions, staffing, and the design of in-store customer experiences.
Our study makes three contributions. First, we provide causal evidence on the value of experience-centric formats in omnichannel, multi-brand retailing. Using an event-study difference-in-differences (DiD) design, we compare the openings of two large, experience-centric stores with that of a small, convenience-centric store and estimate their impact on total net revenue. We also examine whether these gains are accompanied by cannibalization of the online channel. Second, we shift the unit of analysis from the store to the product category level. This shift reveals substantial variation in revenue uplift across categories and shows that store performance depends critically on which product categories are emphasized in-store. Third—and most importantly—we offer a substantive explanation for this heterogeneity by linking category-level total net revenue effects to perceived in-store utility. Drawing on a framework grounded in the Theory of Reasoned Action (Fishbein and Ajzen, 1975), we use pre-registered survey data to measure perceived in-store utility across three stages of the customer journey: (a) information search via expert advice and multisensory inspection, (b) fulfillment by instant gratification, and (c) returns through easier processing (Avery et al., 2012). We then integrate these measures into our empirical analysis to explain cross-category differences in total net revenue uplift. 4 Substantively, we show when (i.e., under what conditions) and why experience-centric stores generate value in omnichannel, multi-brand retailing. Together, these contributions provide actionable guidance for decisions on format selection, category prioritization, and in-store resource allocation, while keeping the focus on empirically supported mechanisms.
Our results yield several key insights. First, all store openings reduce online net revenue (online purchases minus returns), indicating cannibalization. However, the large experience-centric stores more than offset these online losses through incremental in-store revenues, resulting in a 21% to 23% increase in total net revenue (online plus in-store purchases, net of returns) in the short term, with effects that grow over time. The small convenience-centric store, in contrast, does not increase total net revenue. Second, revenue effects vary substantially in large experience-centric stores across the 22 categories we studied. Categories such as desktop, TV, mobile phone, headphones, and Bluetooth speaker perform well above average, whereas monitor, electric toothbrush, printer, keyboard, dryer, washing machine, gaming headset, and smart light generate below-average uplifts. Third, using the retailer's classification, we distinguish between destination and accessory categories. For destination categories—higher-priced, more complex products that drive store visits (Briesch et al., 2013)—variation in perceived in-store utility, particularly at the information-search and fulfillment stages, explains a substantial share of the observed uplift. In contrast, for accessory categories—lower-priced complementary products—such variation is not statistically associated with revenue gains.
The rest of this paper is organized as follows. Section 2 reviews the relevant literature, and Section 3 presents our conceptual framework for understanding when and why physical stores add value. Section 4 describes the empirical context and data. Section 5 outlines the research design and modeling approach. Section 6 presents the main findings—first at the store level, then at the category level—including an analysis of how perceived in-store utility explains variation in category-specific revenue uplifts. Section 7 concludes with managerial implications and avenues for future work. Additional data and results are provided in the E-companion: Supporting Information.
Literature review
Our work builds on the omnichannel literature examining the impact of introducing and expanding physical retail store presence. Prior studies have primarily focused on two types of firms: single-brand, vertically integrated retailers and online retail platforms expanding offline. However, there is little evidence on how multi-brand retailers can structure store openings to generate value. In particular, we lack insights into how store format and category-level variation jointly determine whether physical expansion yields positive total net cross-channel sales.
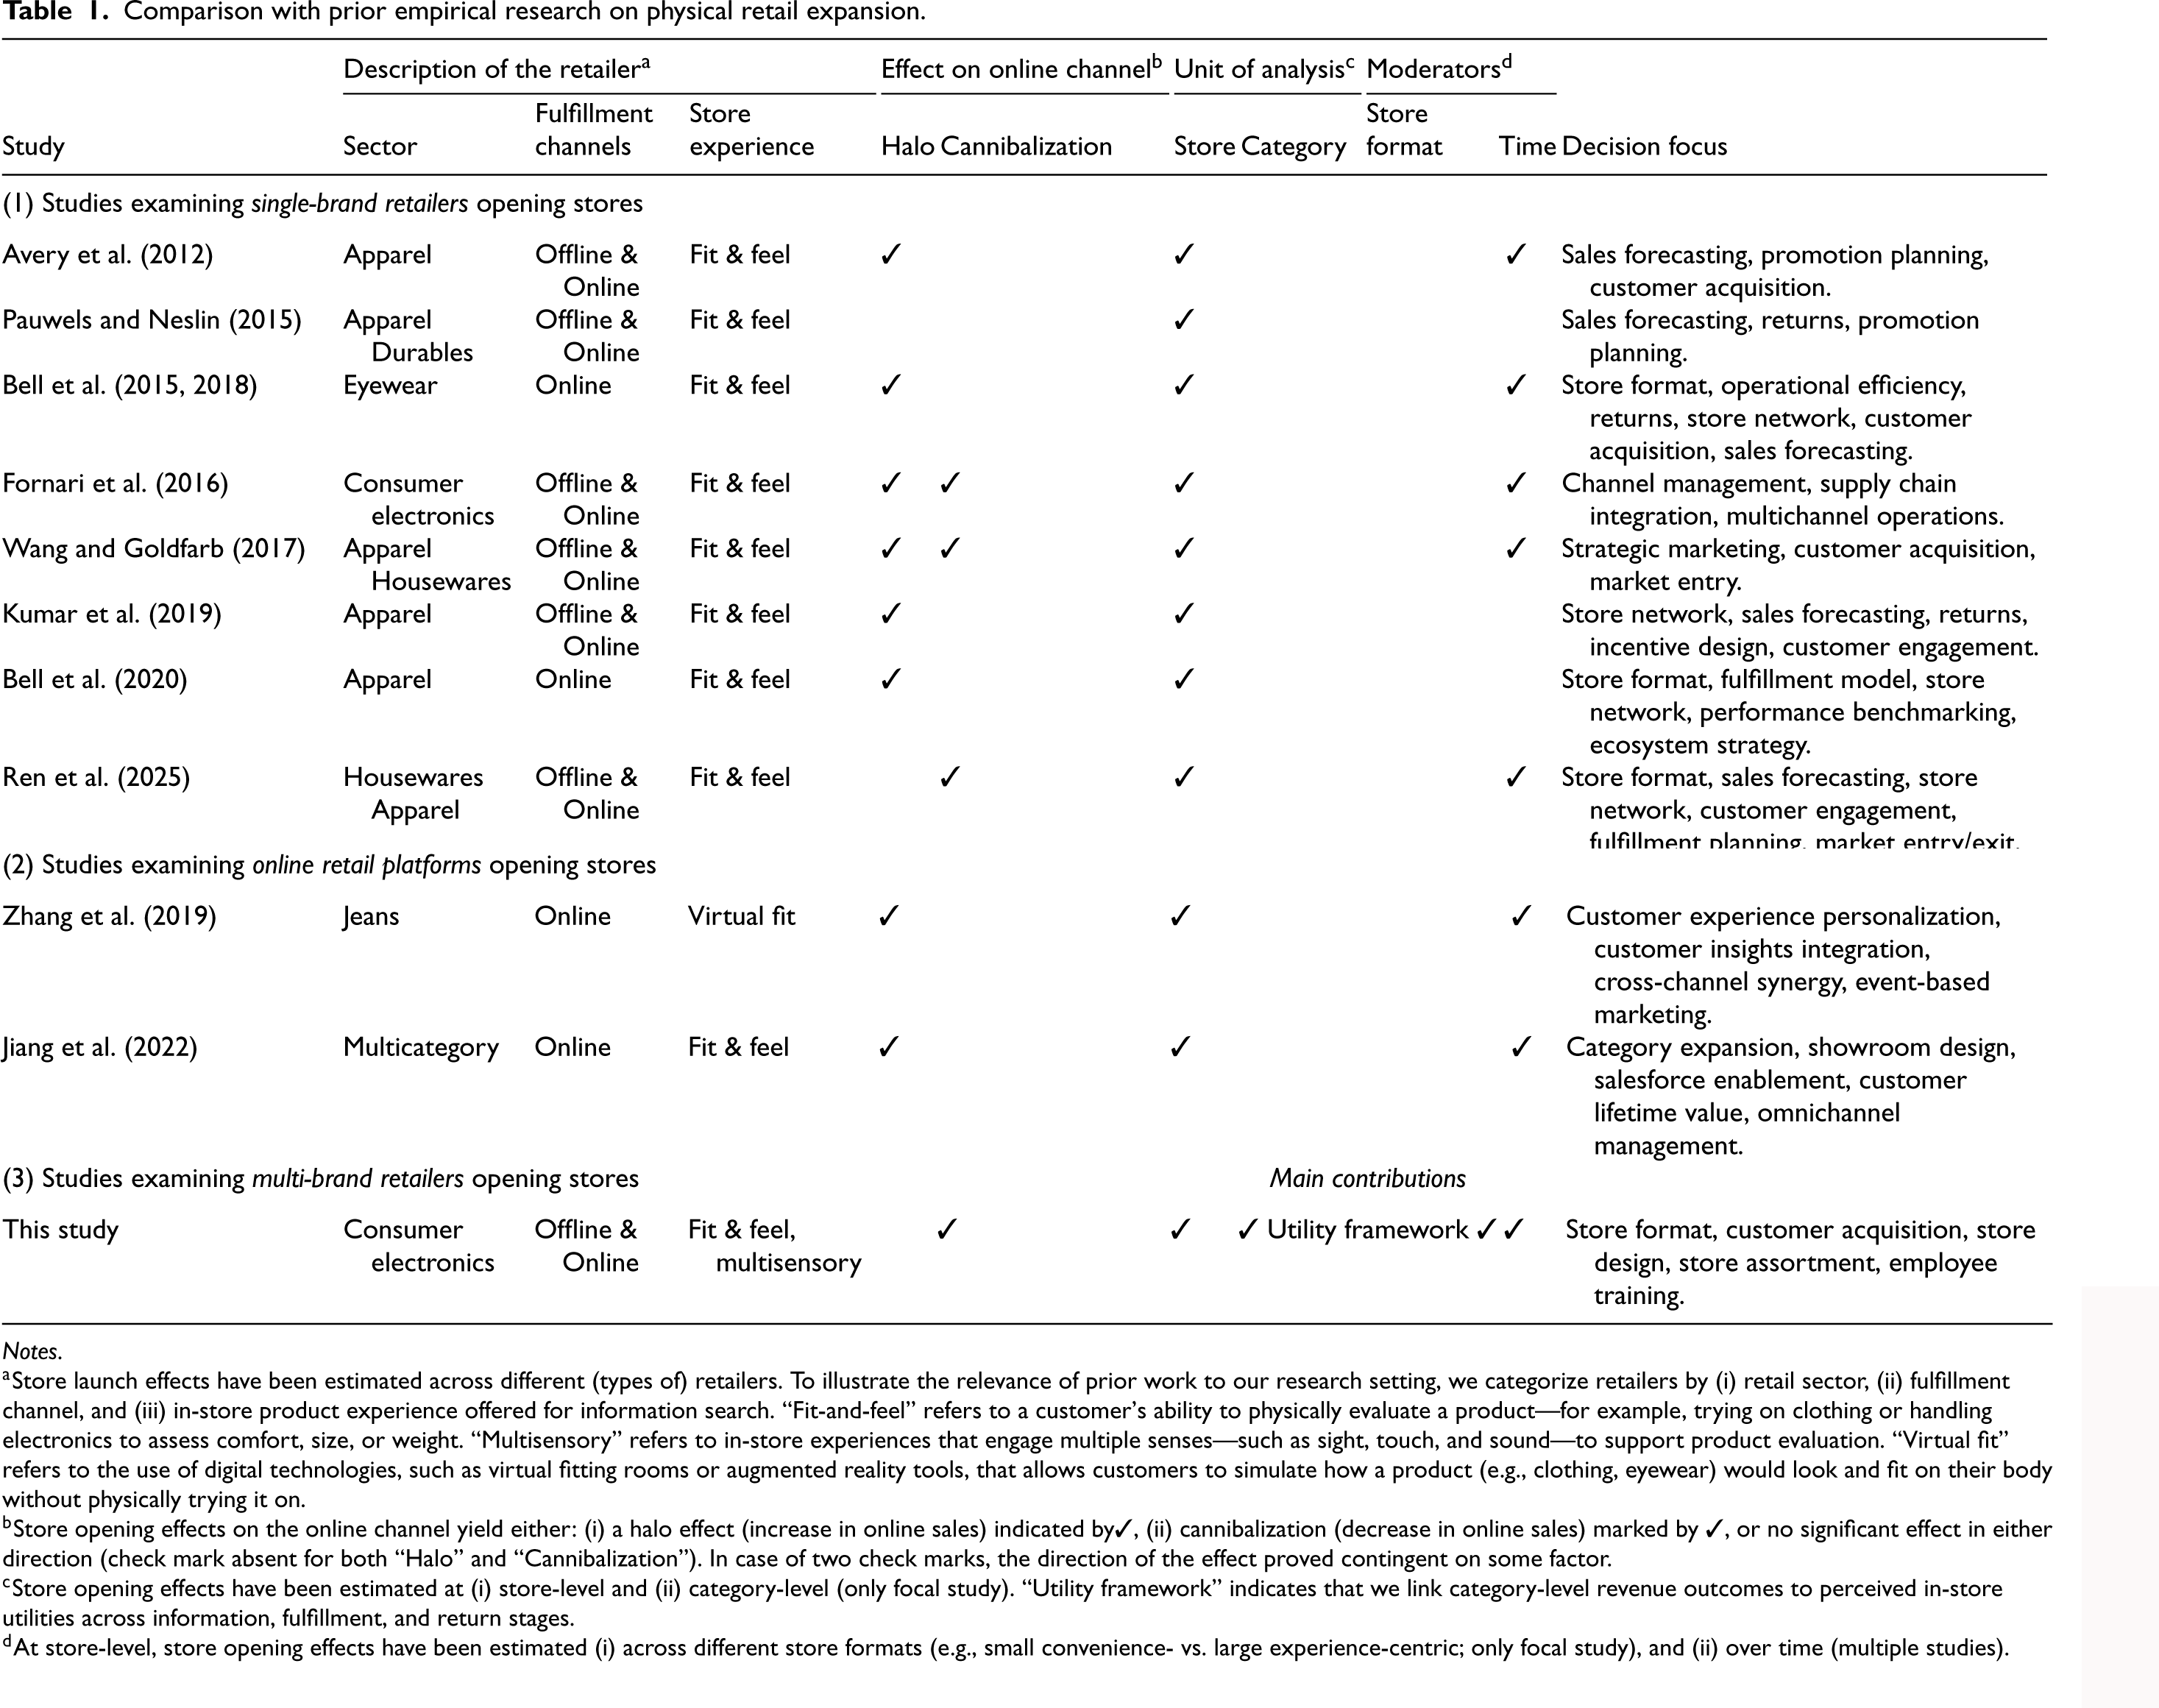
To situate our study, Table 1 summarizes prior empirical work by retailer type (e.g., single-brand, online retail platform, multi-brand), characteristics of the retail setting (e.g., sector, fulfillment channels, and in-store experience), unit of analysis (store- and category-level), moderators (e.g., store format and time since opening), and decision focus. Importantly, the table also documents whether store openings create halo effects (increases in online sales) or cannibalization (declines in online sales). We next position our study along these dimensions. 5
Comparison with prior empirical research on physical retail expansion.
Comparison with prior empirical research on physical retail expansion.
Notes.
Store launch effects have been estimated across different (types of) retailers. To illustrate the relevance of prior work to our research setting, we categorize retailers by (i) retail sector, (ii) fulfillment channel, and (iii) in-store product experience offered for information search. “Fit-and-feel” refers to a customer's ability to physically evaluate a product—for example, trying on clothing or handling electronics to assess comfort, size, or weight. “Multisensory” refers to in-store experiences that engage multiple senses—such as sight, touch, and sound—to support product evaluation. “Virtual fit” refers to the use of digital technologies, such as virtual fitting rooms or augmented reality tools, that allows customers to simulate how a product (e.g., clothing, eyewear) would look and fit on their body without physically trying it on.
Store opening effects on the online channel yield either: (i) a halo effect (increase in online sales) indicated by
Store opening effects have been estimated at (i) store-level and (ii) category-level (only focal study). “Utility framework” indicates that we link category-level revenue outcomes to perceived in-store utilities across information, fulfillment, and return stages.
At store-level, store opening effects have been estimated (i) across different store formats (e.g., small convenience- vs. large experience-centric; only focal study), and (ii) over time (multiple studies).
Retailer type. For single-brand retailers, a well-established finding is that physical expansion increases total cross-channel sales (Bell et al., 2018, 2020; Fornari et al., 2016; Pauwels and Neslin, 2015; Ren et al., 2025; Wang and Goldfarb, 2017), often accompanied by “halo effects” where physical stores stimulate online sales (Avery et al., 2012; Bell et al., 2018; Kumar et al., 2019). Positive online spillovers are especially observed when firms enter new geographic markets with limited brand presence (Wang and Goldfarb, 2017) or adopt innovative formats such as ZIS (Bell et al., 2018, 2020). At the same time, research also documents cannibalization of online sales when store openings occur in areas with strong existing brand presence (Ren et al., 2025; Wang and Goldfarb, 2017). In related work on omnichannel operations, similar substitution effects arise following the introduction of omnichannel capabilities, such as ship-to-store (Akturk et al., 2018) and enhanced cross-channel information provision (Gallino and Moreno, 2014). A second stream examines online retail platforms such as T-mall 6 that add physical touchpoints. These studies show that pop-up stores (Zhang et al., 2019) and ZIS (Jiang et al., 2022) can create halo effects by providing experiential or virtual interactions without the costs of full-scale inventory-holding stores. Our focus differs: we examine multi-brand retailers with strong brand recognition and mature omnichannel capabilities expanding into physical retail. Given parallels with the settings of Wang and Goldfarb (2017) and Gallino and Moreno (2014), we expect store openings in our setting to cannibalize some online sales, with overall net gains depending on whether incremental in-store revenue are large enough to offset those losses.
Product category. Our primary contribution lies at the category level. Prior research has largely overlooked how category variation influences total revenue after store openings. Most studies have focused on sectors such as apparel or eyewear, where customer needs are relatively homogeneous or concentrated within a single category. In contrast, consumer electronics include both experience-driven and transactional product categories, with customers valuing in-store benefits such as expert advice or immediate fulfillment very differently across categories.
A few studies have begun to explore category-type differences. Wang and Goldfarb (2017) distinguished between “fit-and-feel” and “non-fit-and-feel” goods but found no halo effects from in-store information search. Bell et al. (2018) argued that ZIS reduces uncertainty for tactile categories by enabling physical inspection. And Jiang et al. (2022) introduced a dual-function view of ZIS—an experience function supporting tactile evaluation and an exploration function encouraging discovery of unfamiliar “search goods.” They showed that showroom visits encouraged cross-category purchasing, especially for search goods, underscoring the role of in-store displays and sales support. Yet variation in the in-store benefits customers seek across categories remains underexplored—likely because prior research has often assumed that categories such as apparel inherently benefit from physical inspection. Moreover, the focus on ZIS has precluded analysis of fulfillment benefits that only inventory-holding stores can provide.
We address this gap by examining how category-specific in-store utility across information search, fulfillment, and returns shapes revenue outcomes in the consumer electronics sector, a setting characterized by substantial variation in both product category type and the in-store benefits customers seek. This approach allows us to explain when and why physical stores create value across heterogeneous product categories in multi-brand omnichannel retailing.
Store format. Prior research has mainly investigated store formats such as ZIS (Bell et al., 2018, 2020; Jiang et al., 2022) and pop-ups (Ren et al., 2025), emphasizing their experiential or branding roles. In contrast, we compare large experience-centric versus small convenience-centric formats within the same retailer, allowing us to assess how format shapes cross-channel performance within a unified omnichannel context.
Time since opening. Several studies have investigated the temporal dynamics of store opening effects, with mixed findings. Bell et al. (2018) and Jiang et al. (2022) report halo effects that strengthen over time—though in settings limited to ZIS, without in-store fulfillment. In contrast, Avery et al. (2012) and Wang and Goldfarb (2017) reported no immediate impact on online sales. However, Avery et al. (2012) also observed a lagged increase in online purchases, consistent with Wang and Goldfarb's (2017) observation that long-term halo effects emerge in areas without prior brand presence. Similarly, Fornari et al. (2016) documented an initial decline in online purchases followed by gradual recovery. These mixed findings suggest that time since opening moderates whether physical stores ultimately complement or cannibalize online sales, which our study explicitly examines.
Decision focus. While prior research has advanced understanding of omnichannel retail strategy, most studies have focused on high-level decisions—such as financial forecasting, customer acquisition, and store network design—typically treating stores as homogenous units and analyzing aggregate revenue effects. As summarized in Table 1, studies such as Avery et al. (2012) and Pauwels and Neslin (2015) emphasized firm-level forecasting and returns management, whereas others, including Wang and Goldfarb (2017) and Kumar et al. (2019), examined how physical stores influence customer engagement and retention. Research on store concepts (e.g., Bell et al., 2018; Ren et al., 2025) has explored innovative concepts such as showrooms and pop-up stores, but generally without differentiating performance across product categories.
In contrast, our study spans strategic, tactical, and operational dimensions, providing causal evidence on how store format and category-specific in-store utility interact to drive revenue outcomes in a multi-brand omnichannel context. By shifting the focus to the product category level and integrating perceived utility across information search, fulfillment, and returns, we develop a utility-based framework that can inform assortment, staffing, and layout decisions—tactical and operational levers that remain underexplored in existing literature.
Our focal metric is net revenue—gross revenue minus returns. 7 Using a quasi-experimental design, we estimate changes in total (online plus in-store) and online net revenue. We first analyze net revenue at the store level, then by product category. Positive total uplift indicates overall channel complementarity; a positive online change suggests a halo effect; a decline points to cannibalization. Unlike prior research that treats store openings as homogenous events, we allow impact to vary by store format, product category (most critically), and time since opening.
Store format. Format shapes how well a physical store complements the online channel. Large experience-centric stores can better convey product information through immersive experiences and broader assortments, but are less likely to be located in high-traffic areas. In contrast, smaller, centrally located stores often function more as brand billboards, offering greater convenience but limited capacity for rich in-store interaction. We assess these differences empirically by comparing revenue uplifts across these two formats.
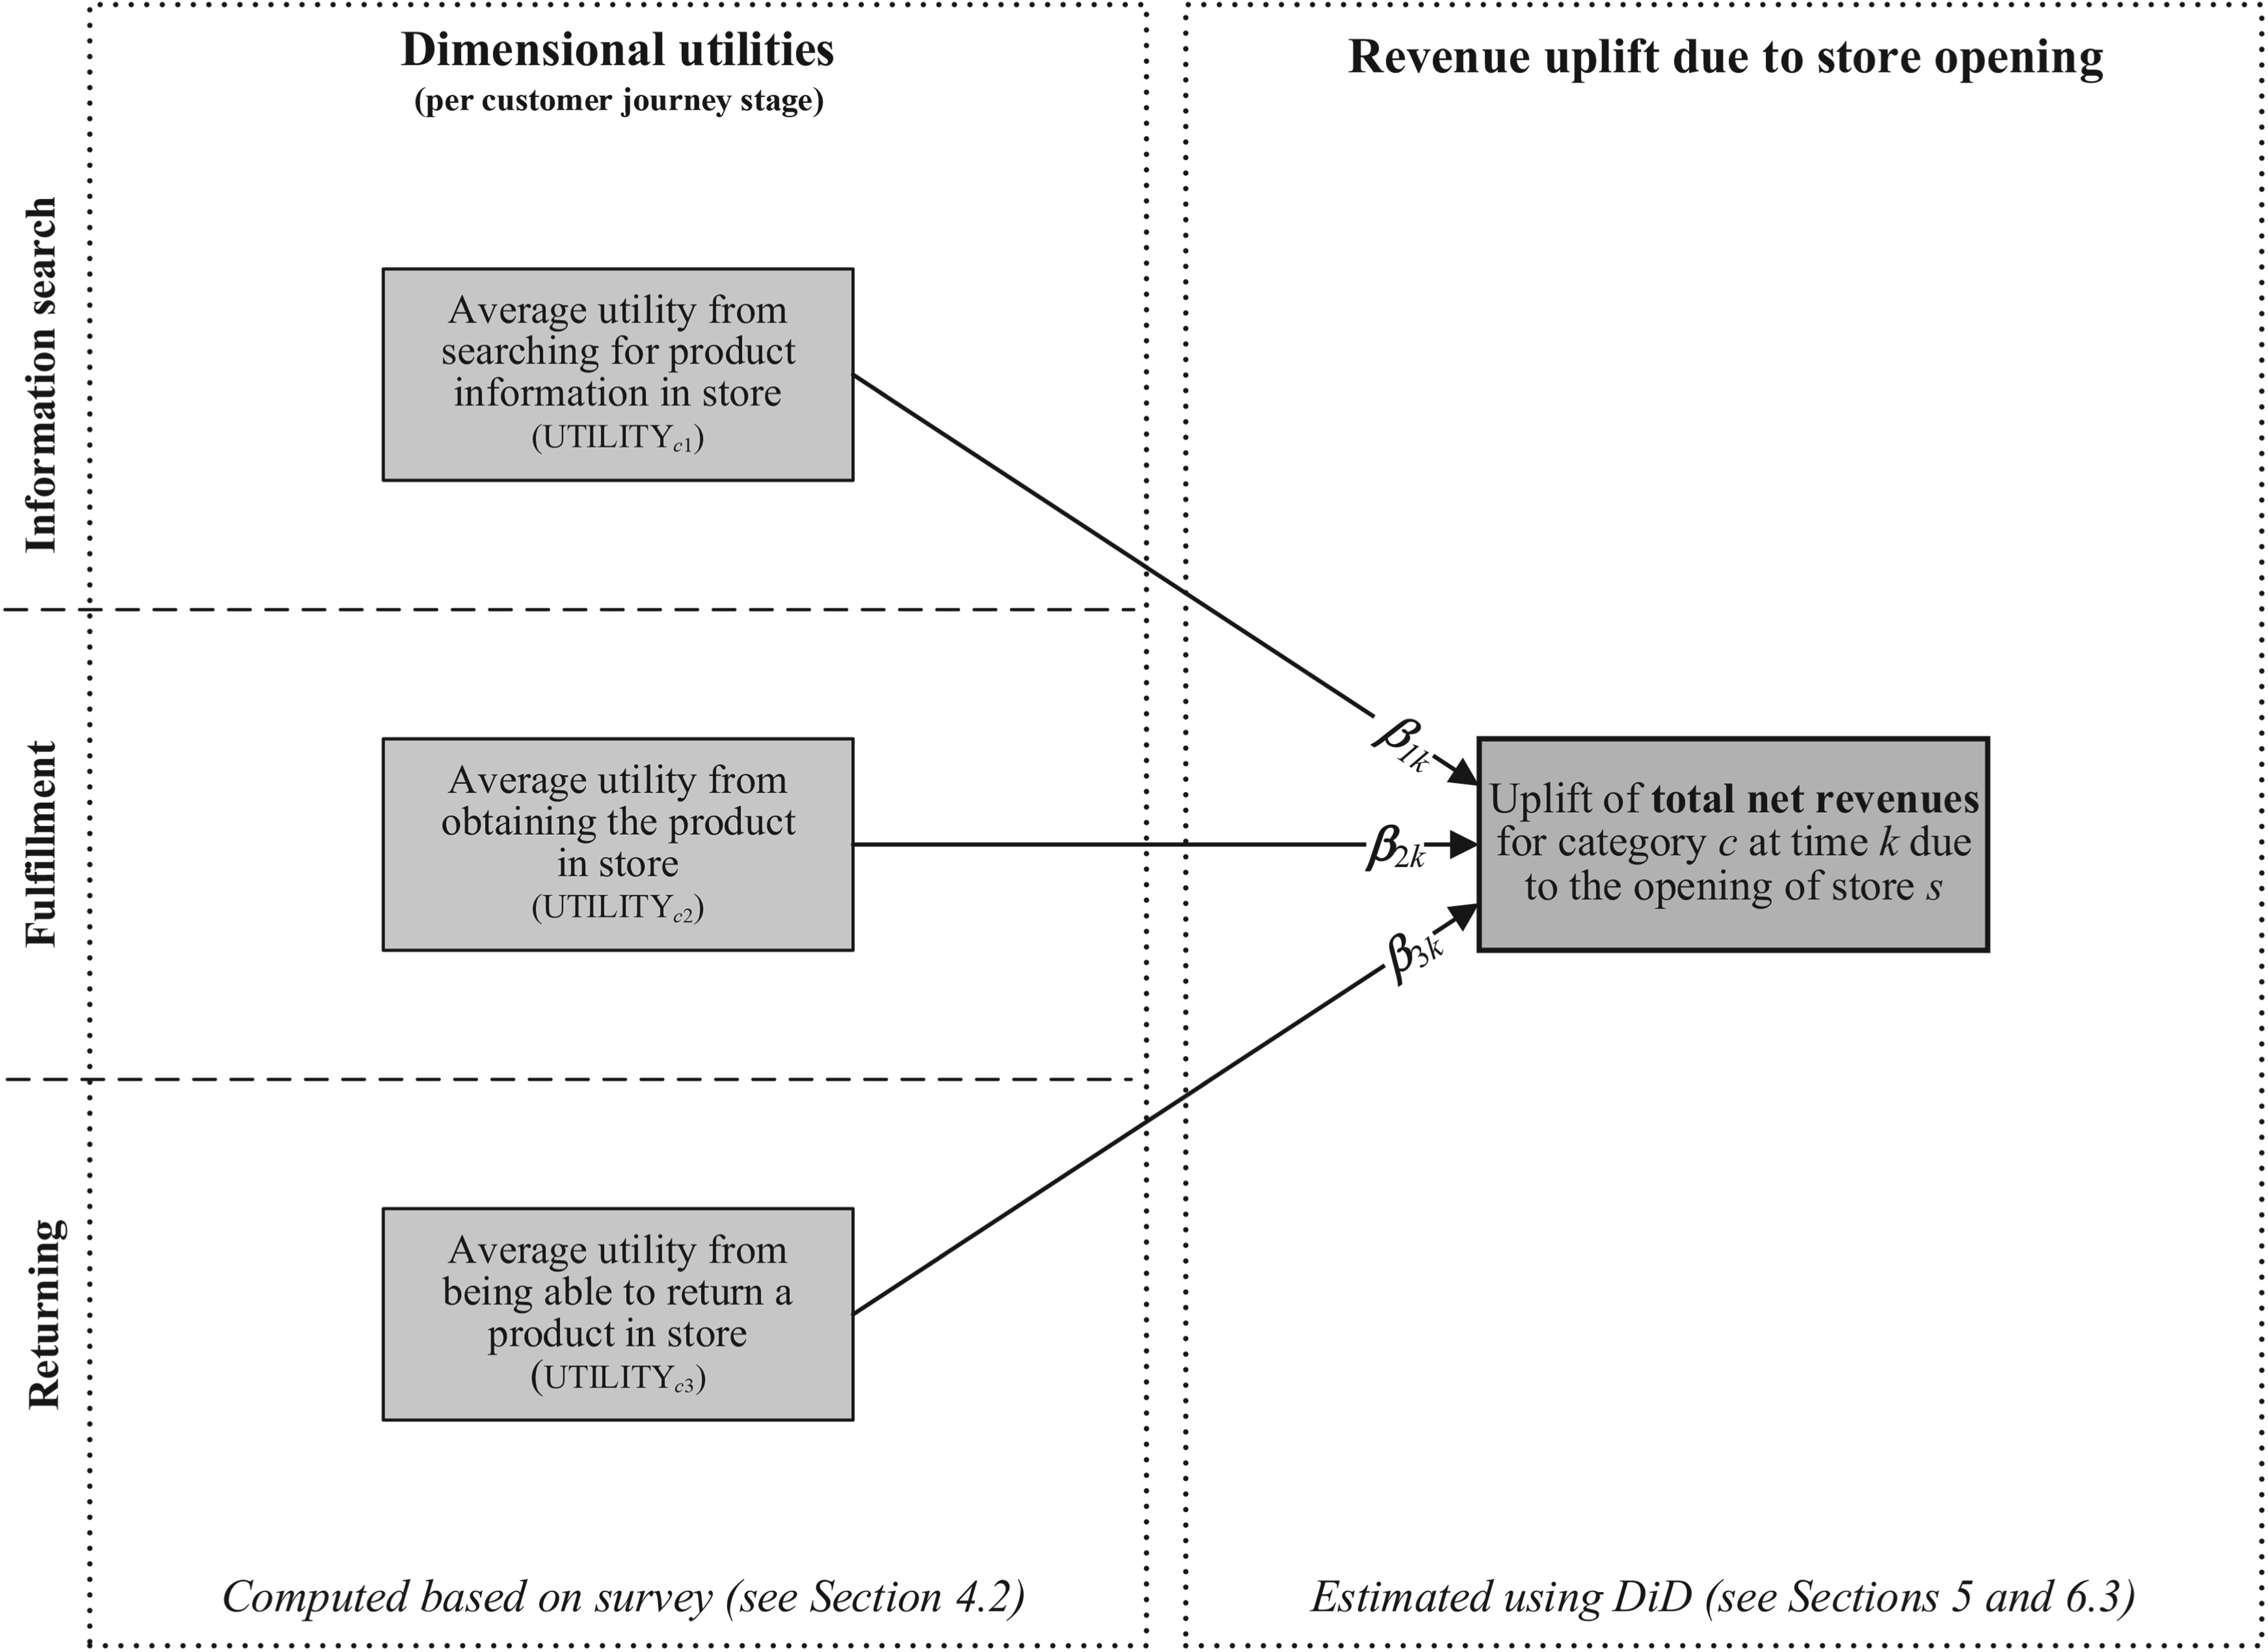
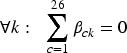
Research design unearthing why stores add value. βdk represents the effect of a category's dimensional utility for stage d on its revenue uplift at time k since store opening (see Section 5).
Product category. Our primary focus is category-level variation, a dimension largely absent in prior work. While most studies have examined sectors having uniform in-store benefits (e.g., apparel and eyewear), consumer electronics vary widely in size, complexity, and the importance of search versus experience attributes. 8 These differences give rise to distinct utility profiles across categories. Beyond fit, customers may value multisensory product evaluation, expert advice, immediate fulfillment, and easier returns, and the importance of these benefits differs across categories. For example, TVs offer high information-search value through sensory testing and consultation, but limited fulfillment benefit unless they are urgently needed (e.g., replacing a broken unit), or portable. In contrast, powerbanks offer high fulfillment utility because they are compact, immediately usable, and easy to tote. Return utility also varies: bulky or high-value categories like TVs are tough to repack and ship, thus making in-store returns more attractive by offering instant resolution and refunds through human interaction (Ertekin, 2018). Prior work has begun to recognize such heterogeneity. Zhang et al. (2021) distinguish between “deep” and “shallow” products, 9 showing that offline presence enhances learning for the former. While insightful, this binary distinction focuses primarily on the information stage. We extend this perspective by adopting a continuous, multi-dimensional utility framework spanning information, fulfillment, and returns, capturing a broader range of category-level differences.
Unearthing why stores add value. To explain variation in total net revenue uplift, we examine the utility customers expect to derive from visiting a physical store. We focus on three stages of the omnichannel customer journey: (a) information search—via sensory experience and expert advice, (b) fulfillment—through instant access, and (c) returns—via enhanced efficiency (Avery et al., 2012). Consumers shopping within a specific category seek different forms of in-store benefits (e.g., need to inspect through sensory experience), and retailers create value when store capabilities (e.g., ability to provide sensory experience) align with those needs. We conceptualize this value as dimensional utilities—category-specific measures of the store's relative advantage over the online channel at each stage of the customer journey. Figure 1 illustrates how these stage-specific utilities map to revenue uplift, allowing their effects to vary across stages in the model. We measure these utilities using survey data (Section 4) and combine them with transaction data to estimate the conceptual model. Higher perceived utility at a given stage should translate into greater total net revenue uplift, as it strengthens the store's relative advantage over the online channel for that category. In this sense, variation in uplift across categories reflects how effectively the store delivers stage-specific value aligned with underlying customer needs.
Time since opening. While early revenue gains may reflect curiosity and immediate demand, long-run uplift depends on whether customers incorporate the store into their regular shopping routines, driven by positive in-store experiences and experiential learning (Zhang et al., 2021). We therefore distinguish between short- and long-run effects following store opening.
Research setting
We partnered with a leading omnichannel, multi-brand consumer electronics retailer in Western Europe. The company launched as a purely digital retailer, curating and selling a broad assortment of products from multiple independent brands through its own website and mobile app. Over time, it expanded into physical retail as part of a broader strategic shift. At the study's outset, the retailer operated a website, mobile app, and 11 brick-and-mortar stores across two neighboring countries.
Data
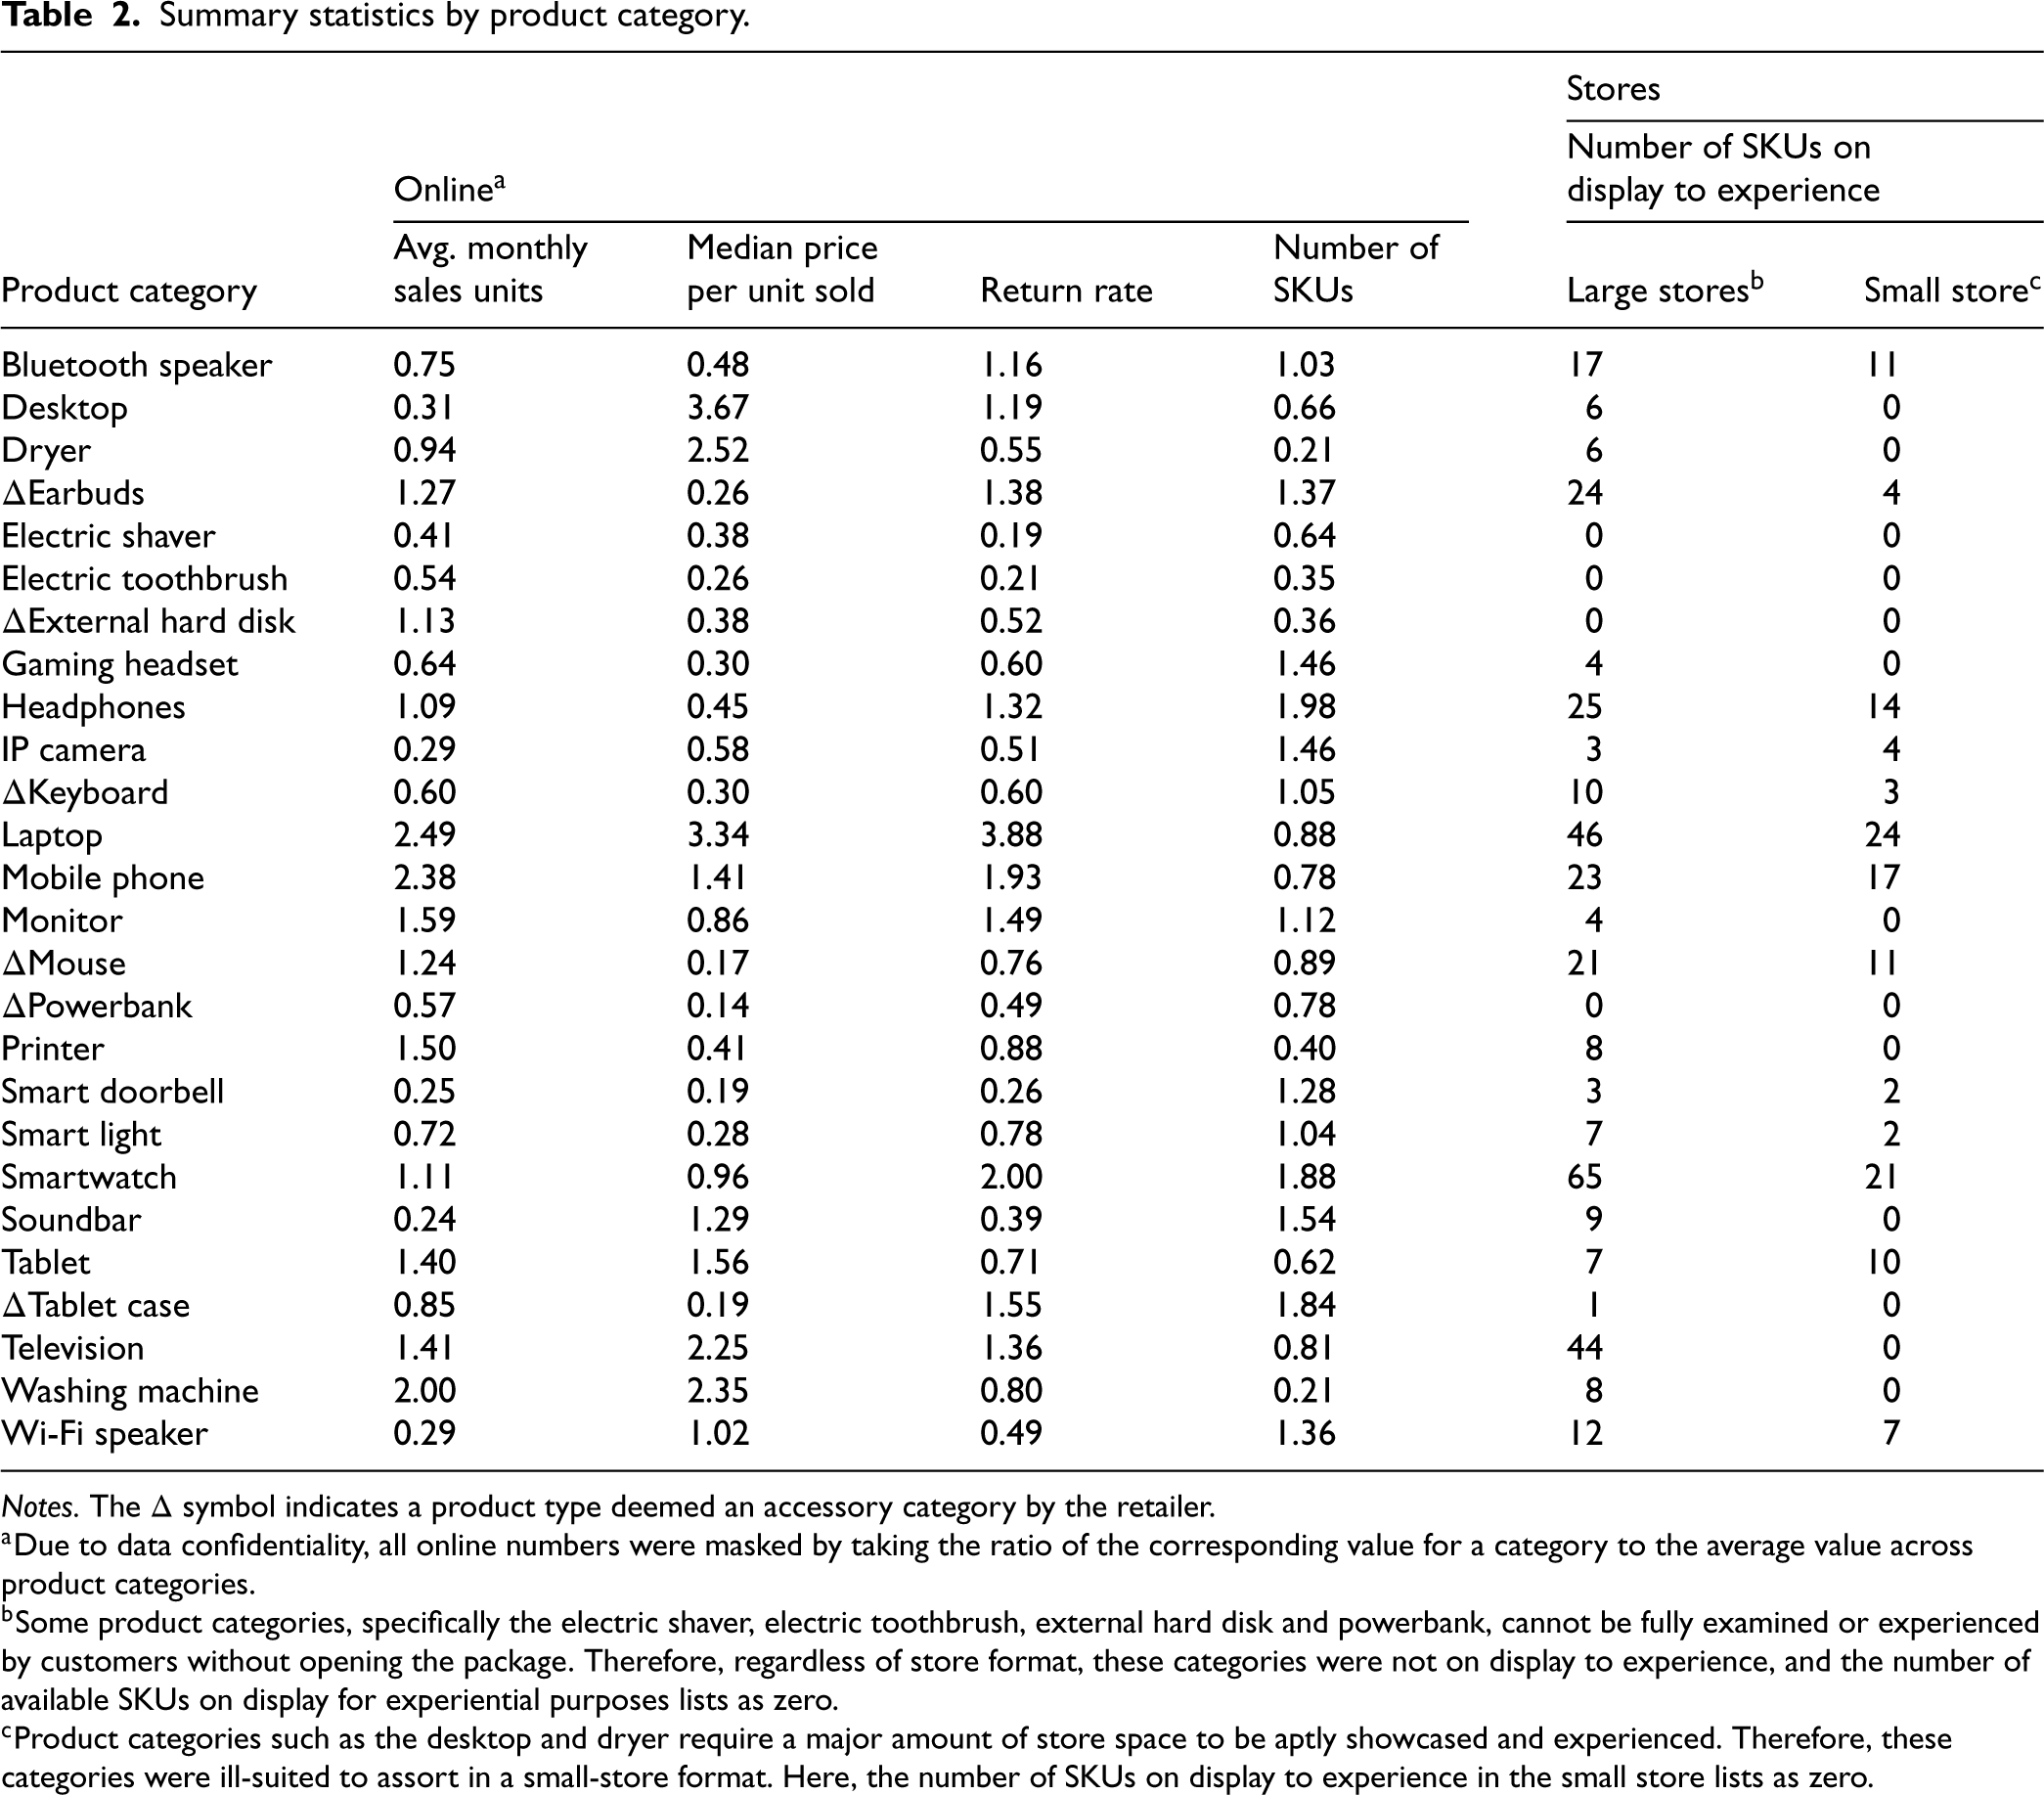
We selected 26 focal categories that varied in complexity, price, return rate, category size and relevance to the store benefits under study. The selection aligns with the retailer's classification of destination versus accessory categories. Destination categories (e.g., washing machine, TV, mobile phone) require more consideration, research, and decision-making due to their higher prices, functional importance, and broader lifestyle impact. As such, they often drive store visits (Briesch et al., 2013). Accessory categories (e.g., mouse, tablet case, powerbank) are small, lower-priced products that are typically purchased alongside destination category products. Table A3 (Supporting Information) details the attributes and estimated store benefits by category. Table 2 presents the descriptive statistics.
Summary statistics by product category.
Summary statistics by product category.
Notes. The Δ symbol indicates a product type deemed an accessory category by the retailer.
Due to data confidentiality, all online numbers were masked by taking the ratio of the corresponding value for a category to the average value across product categories.
Some product categories, specifically the electric shaver, electric toothbrush, external hard disk and powerbank, cannot be fully examined or experienced by customers without opening the package. Therefore, regardless of store format, these categories were not on display to experience, and the number of available SKUs on display for experiential purposes lists as zero.
Product categories such as the desktop and dryer require a major amount of store space to be aptly showcased and experienced. Therefore, these categories were ill-suited to assort in a small-store format. Here, the number of SKUs on display to experience in the small store lists as zero.
Figure 2 shows substantial variation in perceived utilities across the three dimensions—information search, instant gratification, and return efficiency—using standardized z-scores. Destination categories such as TV, mobile phone, and headphones score high on information search, reflecting the value of sensory evaluation and expert advice, whereas small accessories (external hard disk and power bank) score low. Fulfillment utility is highest for portable, time-sensitive products (e.g., laptop, mobile phone) and lowest for bulky categories requiring delivery (e.g., washer-dryer). Return utility is strongest for high-value or fragile products (e.g., laptop, TV) and weakest for low-cost, compact accessories (e.g., tablet case, mouse). Importantly, utilities vary not only across categories but also across dimensions within categories, reinforcing the value of a multi-dimensional approach. For example, TV ranks high on information search and returns but low on fulfillment, whereas desktop exhibits moderate information search and fulfillment utility alongside high return utility. Correlation analysis further supports the discriminant validity of the three dimensions: information search and return efficiency moderately correlate (r = 0.57, p = .005), while instant gratification weakly relates to either (r = .18 and –.05, p = .424 and .824), thus validating our dimensional utility framework.
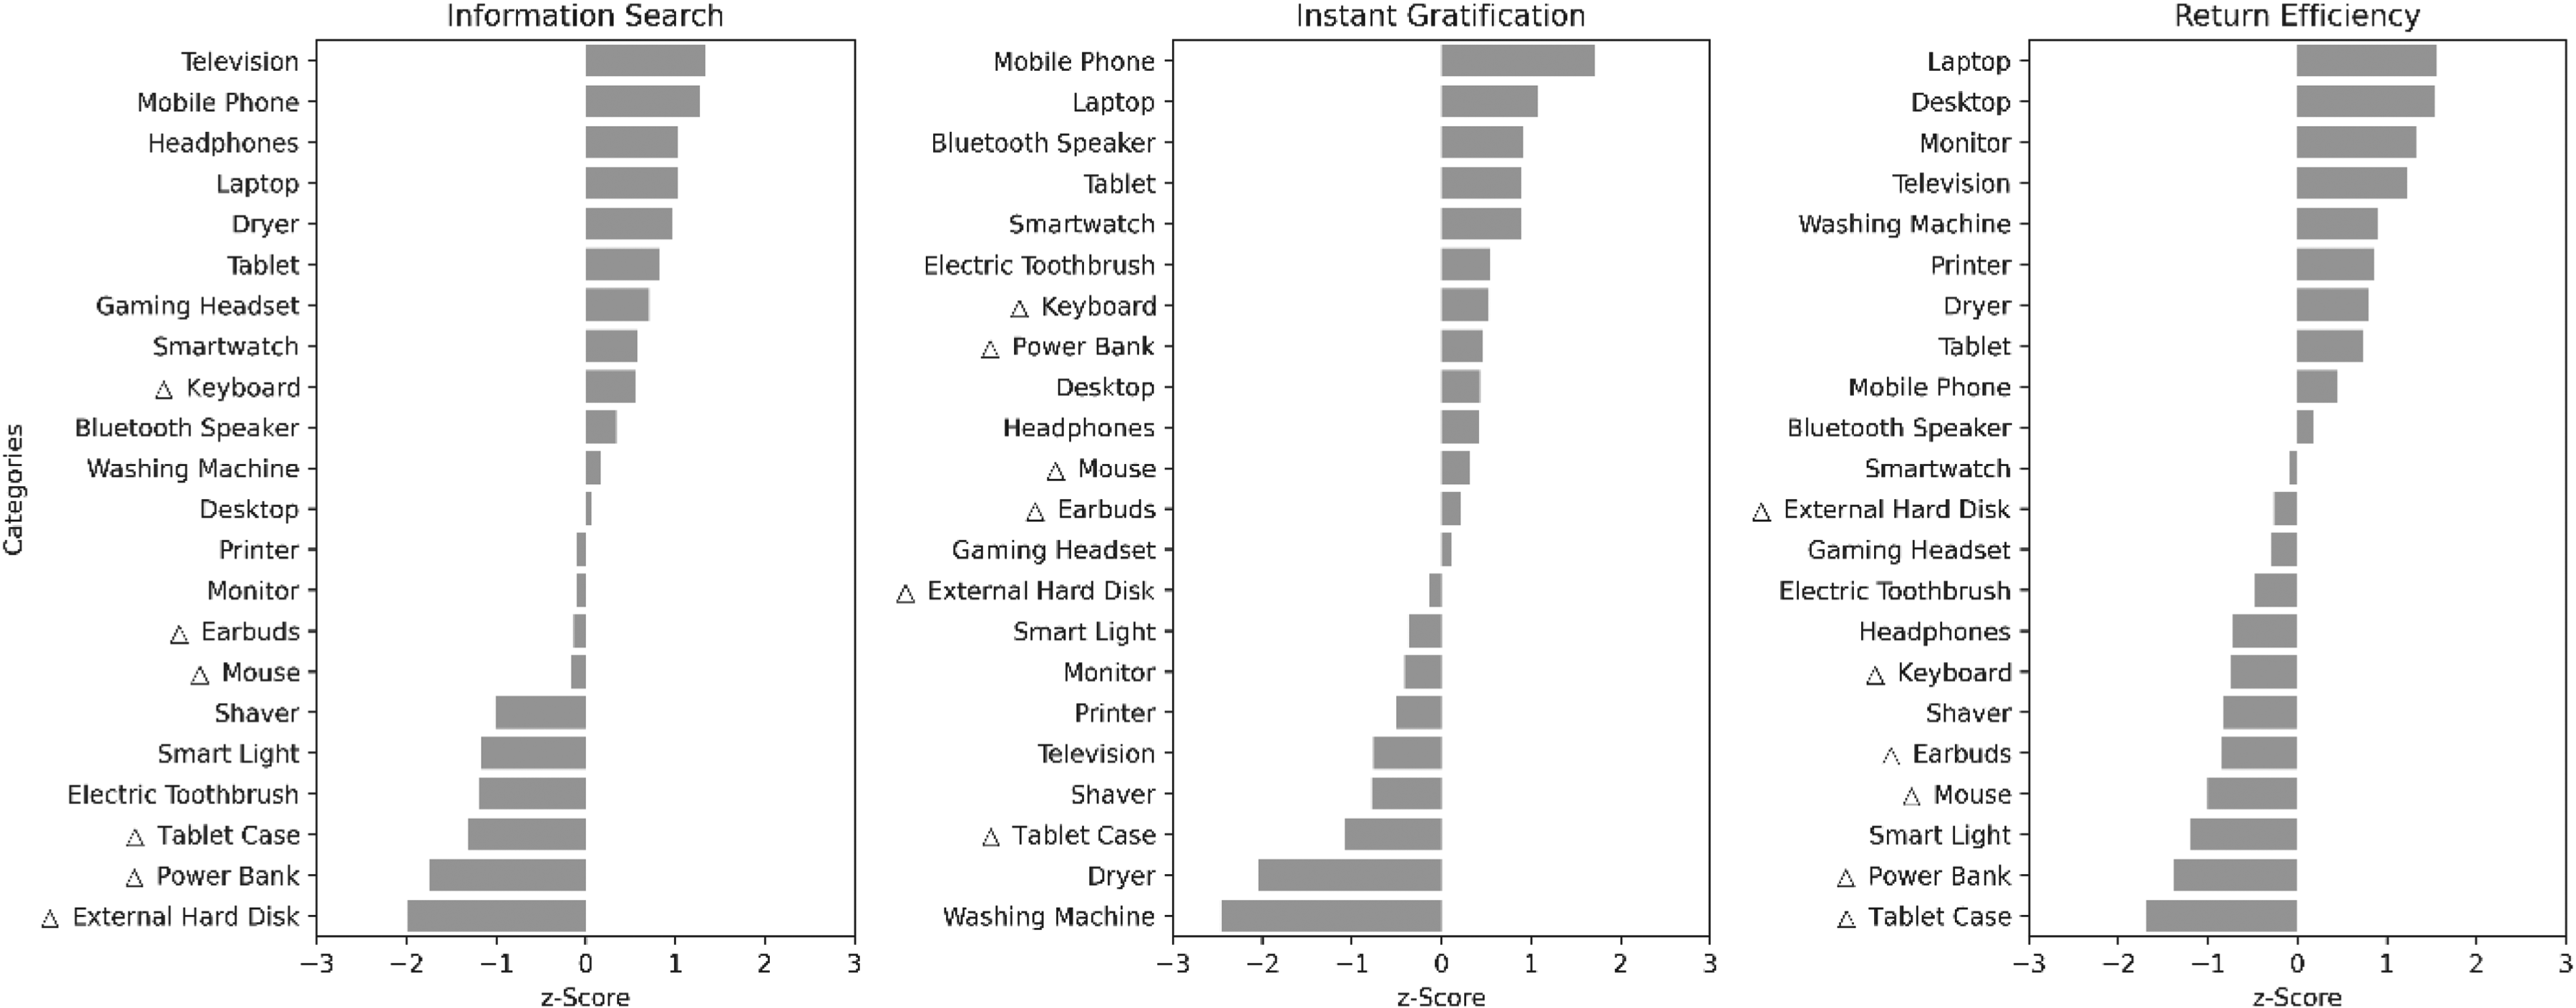
Perceived dimensional utilities by product category (
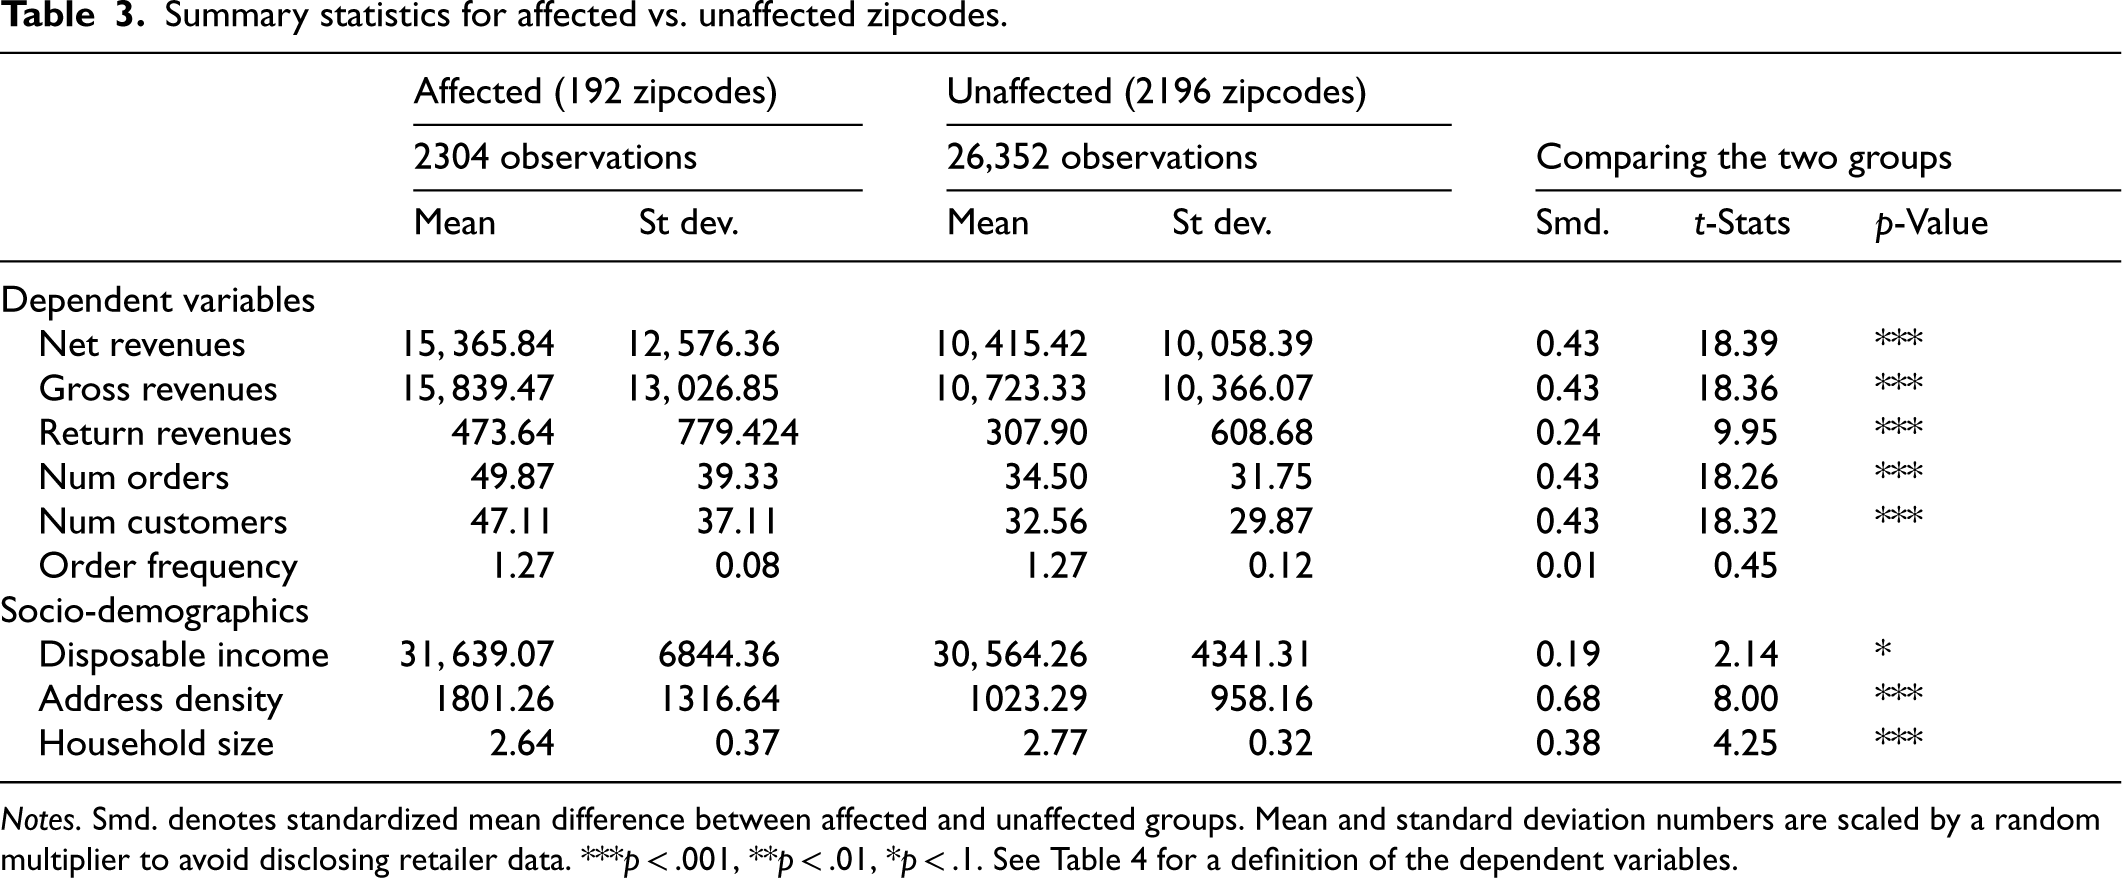
Summary statistics for affected vs. unaffected zipcodes.
Summary statistics for affected vs. unaffected zipcodes.
Notes. Smd. denotes standardized mean difference between affected and unaffected groups. Mean and standard deviation numbers are scaled by a random multiplier to avoid disclosing retailer data. ***p < .001, **p < .01, *p < .1. See Table 4 for a definition of the dependent variables.
Propensity scores were estimated using logistic regression models predicting the probability that a prior unaffected zipcode would fall within a store region when opening a new store. Predictors included socio-demographic factors, online purchasing behavior, and trends. We used nearest-neighbor matching with a 0.1 caliper on standardized logit distances to properly match 191 of 192 affected zipcodes while satisfying the common support condition. 20 To address cases with few available matches, we applied a greedy variant of the matching algorithm, prioritizing affected zipcodes with limited options. Section B of the Supporting Information details the predictor set, match accuracy by store region, the greedy nearest-neighbor algorithm and pre-post common support graphs.
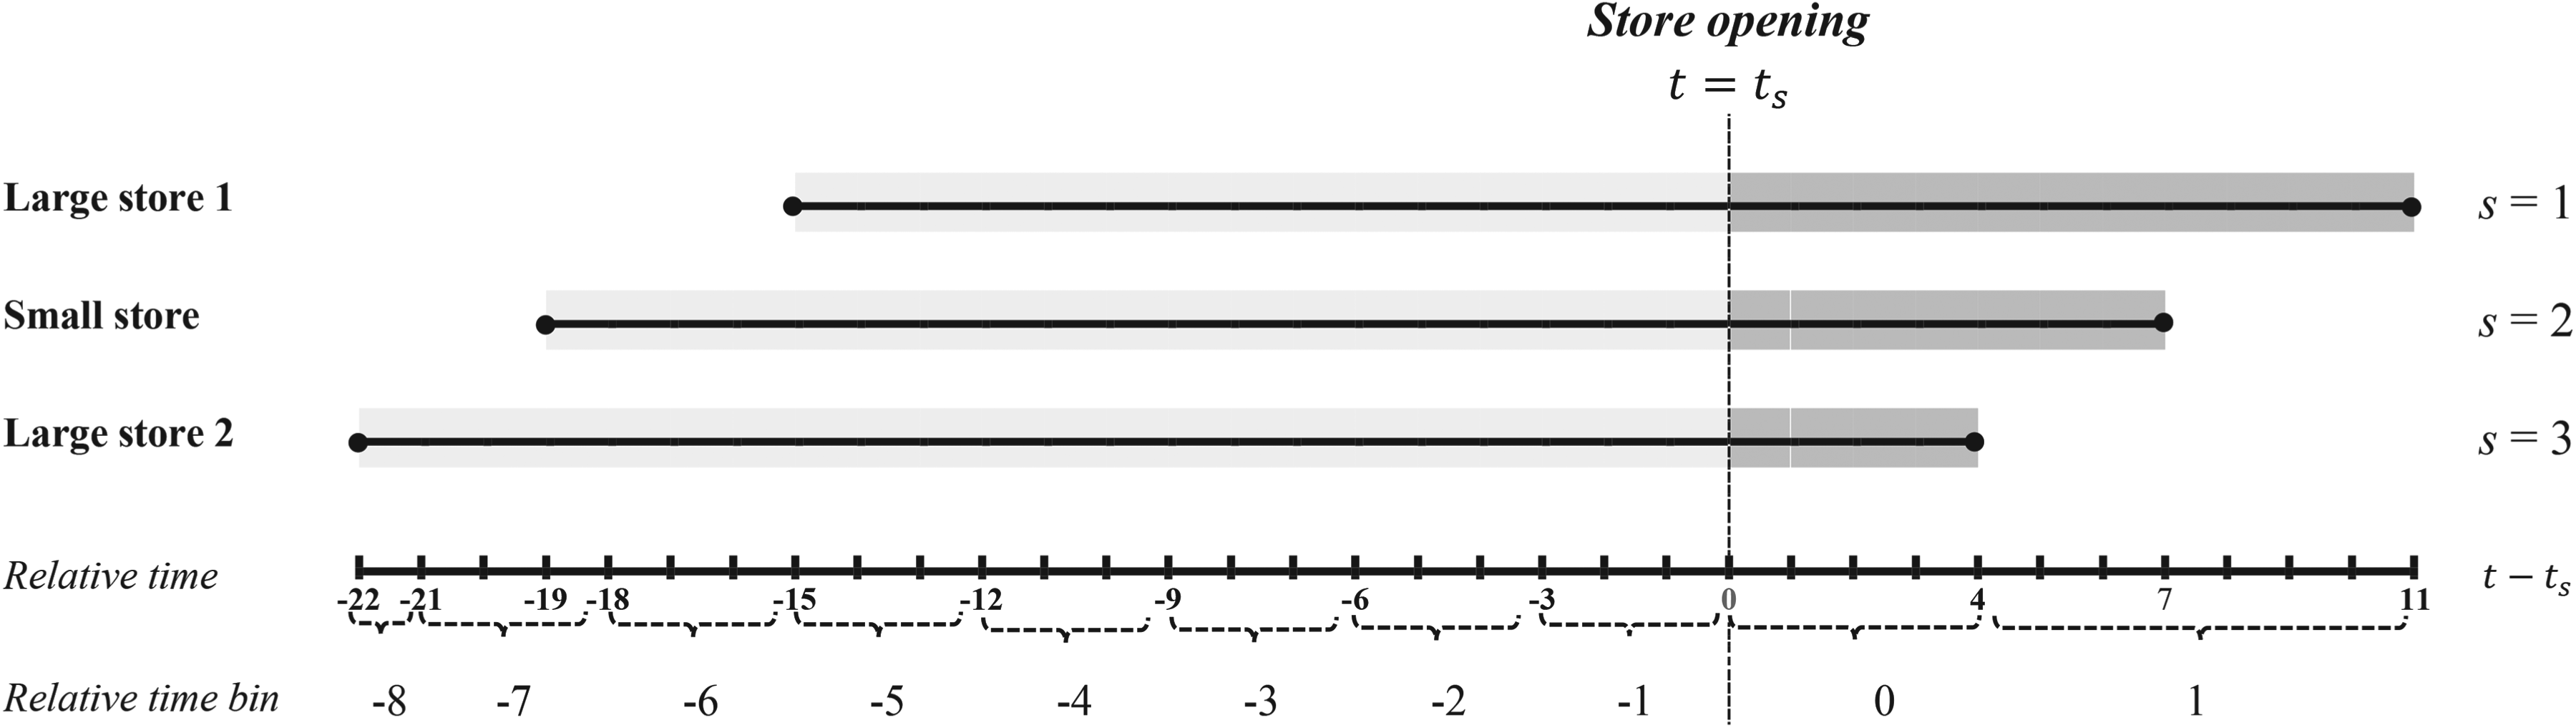
In our empirical setting, the three stores opened months apart, constituting a staggered introduction. Accordingly, we enlisted an event-study style DiD approach with heterogeneous dynamic treatment effects (Sun and Abraham, 2021). We selected this estimator because our research question requires estimating dynamic treatment effects—that is, separate effects for each post-treatment period. This temporal granularity is essential to analyzing how store impacts evolve over time and vary across product categories. Sun and Abraham's approach extends the Callaway and Sant’Anna estimator (2021) to dynamic settings and corrects for contamination of control units when treatment effects are heterogeneous, allowing us to isolate store-specific short- and long-run effects. We refer the reader to De Chaisemartin and D’Haultfœuille (2020) for a comprehensive survey on heterogeneity-robust DiD estimators. Recently, propensity score matching has also effectively integrated with staggered DiD designs for empirical retail-operations management studies aimed at evaluating phased interventions over time (Aral et al., 2023; Babar and Burtch, 2024).
To illustrate the structure of treatment timing in our analysis, Figure 3 presents the staggered rollout of the three stores. We introduce
Mapping
Because electronics purchases are infrequent at the month-zipcode level, treatment effects by relative time may have been noisy. To address this and boost interpretability, we followed Sun and Abraham's (2021) guidance and applied temporal binning. Using a 3-month bin width, we created a new variable−


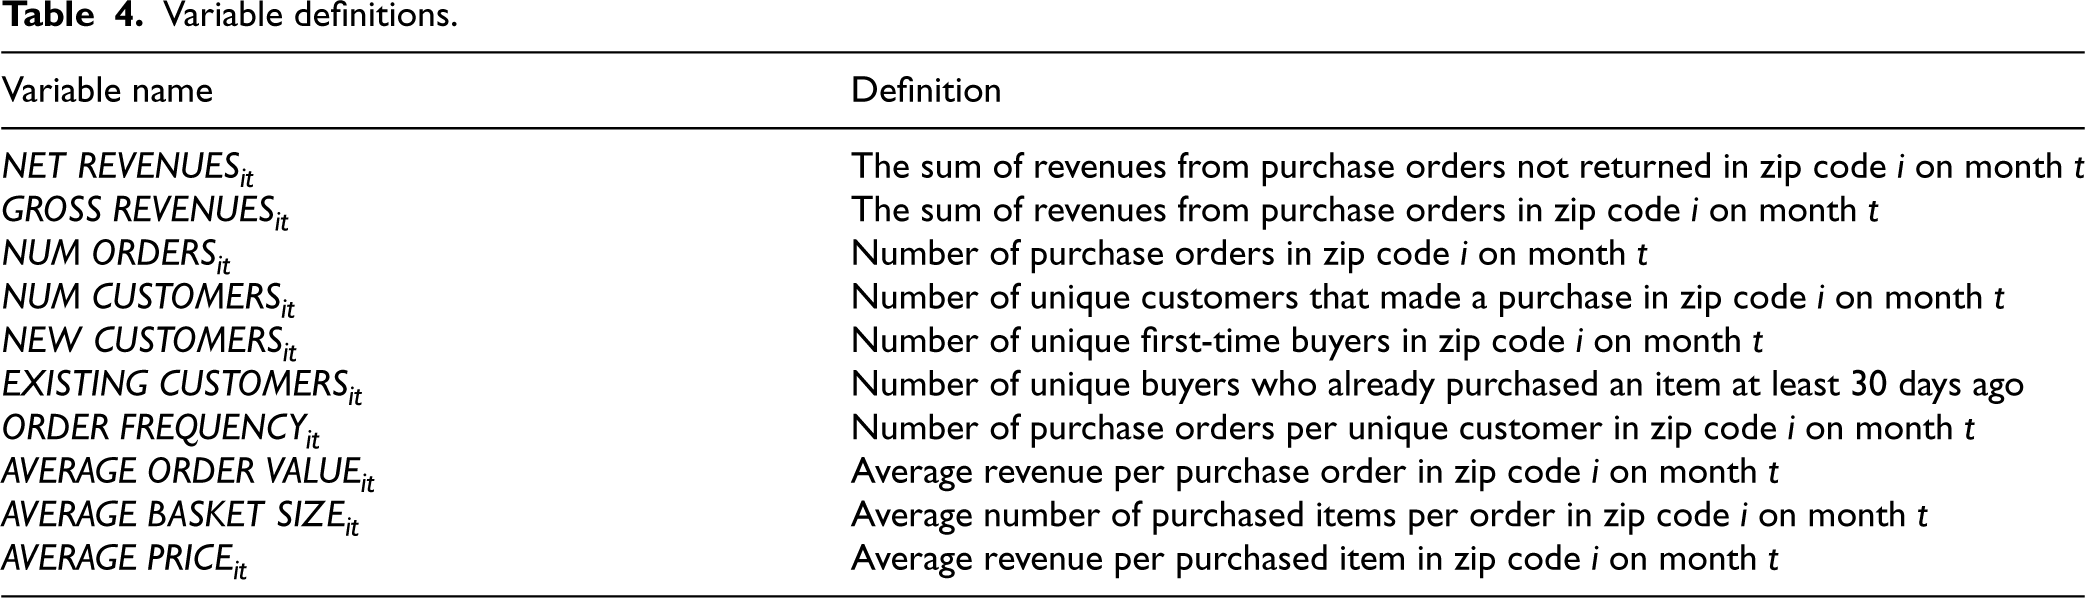
We ran the model in Equation (1) using the focal DV, net revenues, and its underlying components 23 defined in Table 4. Each variable was analyzed across channels (online plus store combined) and for just the online channel. We clustered standard errors by zipcode.
Variable definitions.


We first present the store-level revenue effects in Section 6.1 followed by the category-level uplifts for large experience-centric stores in Section 6.2. In Section 6.3, we examine how survey-based measures of perceived in-store benefits explain category-level variation in net revenue uplift for large experience-centric stores.
Overall and channel-specific impact of stores
Figure 4 shows short-term (months 0–3) net revenue uplifts derived from
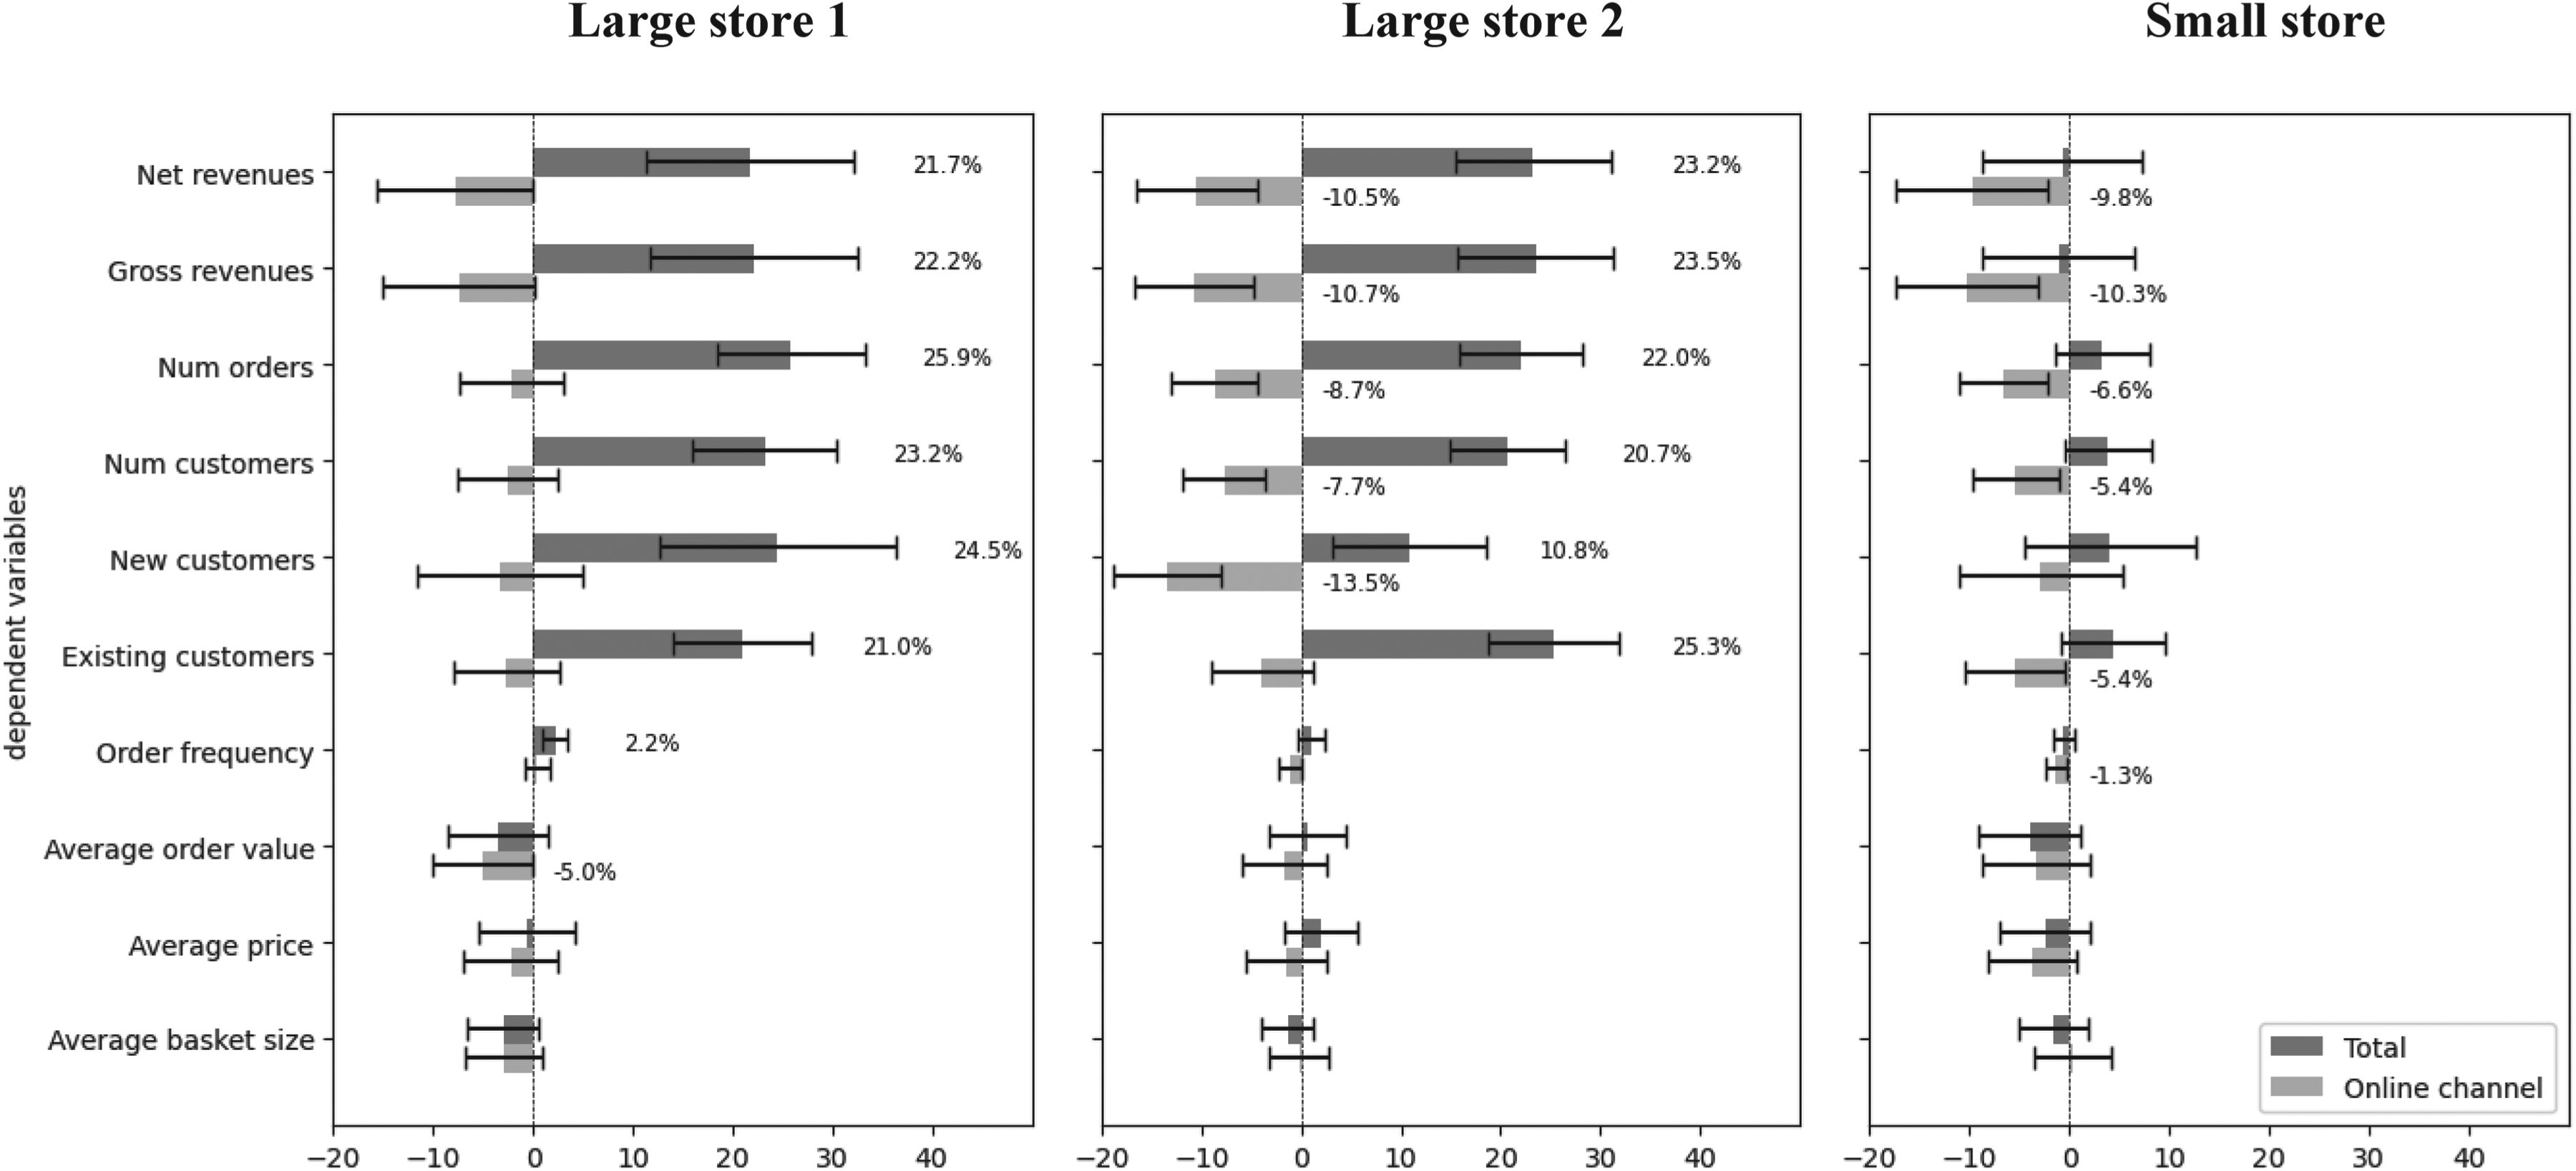
Uplift percentages of net revenue and its components per store in the short term (months 0-3). Store-level uplift estimates are provided along with their 95% confidence intervals.
Long-term results (Supplemental Figure D1) for Large store 1 show continued gains: net revenue rose to 27.5% (95% CI [16.5, 38.4]), gross revenue to 27.6% (95% CI [16.8, 38.4]). 24 Both the number of customers and order frequency rose significantly, by 26.5% (95% CI [19.8, 33.3]) and 2.7% (95% CI [1.2, 4.1]) respectively. The nearly identical growth among new (26.5%, 95% CI [15.8, 37.3]) and existing customers (26.0%, 95% CI [19.5, 32.5]) suggests that the experience-centric store remained effective in the long run at both attracting new customers and deepening engagement among its existing customer base.
To understand when store openings yield revenue gains, we examine variation in uplift across categories. The analysis is restricted to store openings that yielded measurable increases in total net revenue; the small-format store is therefore excluded. Figure 5 presents the short-term net revenue uplift percentages by category in the region of Large store 1. We focus on Large store 1 because its ample post-opening data allow both short- and long-term analysis. Section E of the Supporting Information reports similar short-term results for Large store 2, as well as the long-term results for Large store 1.
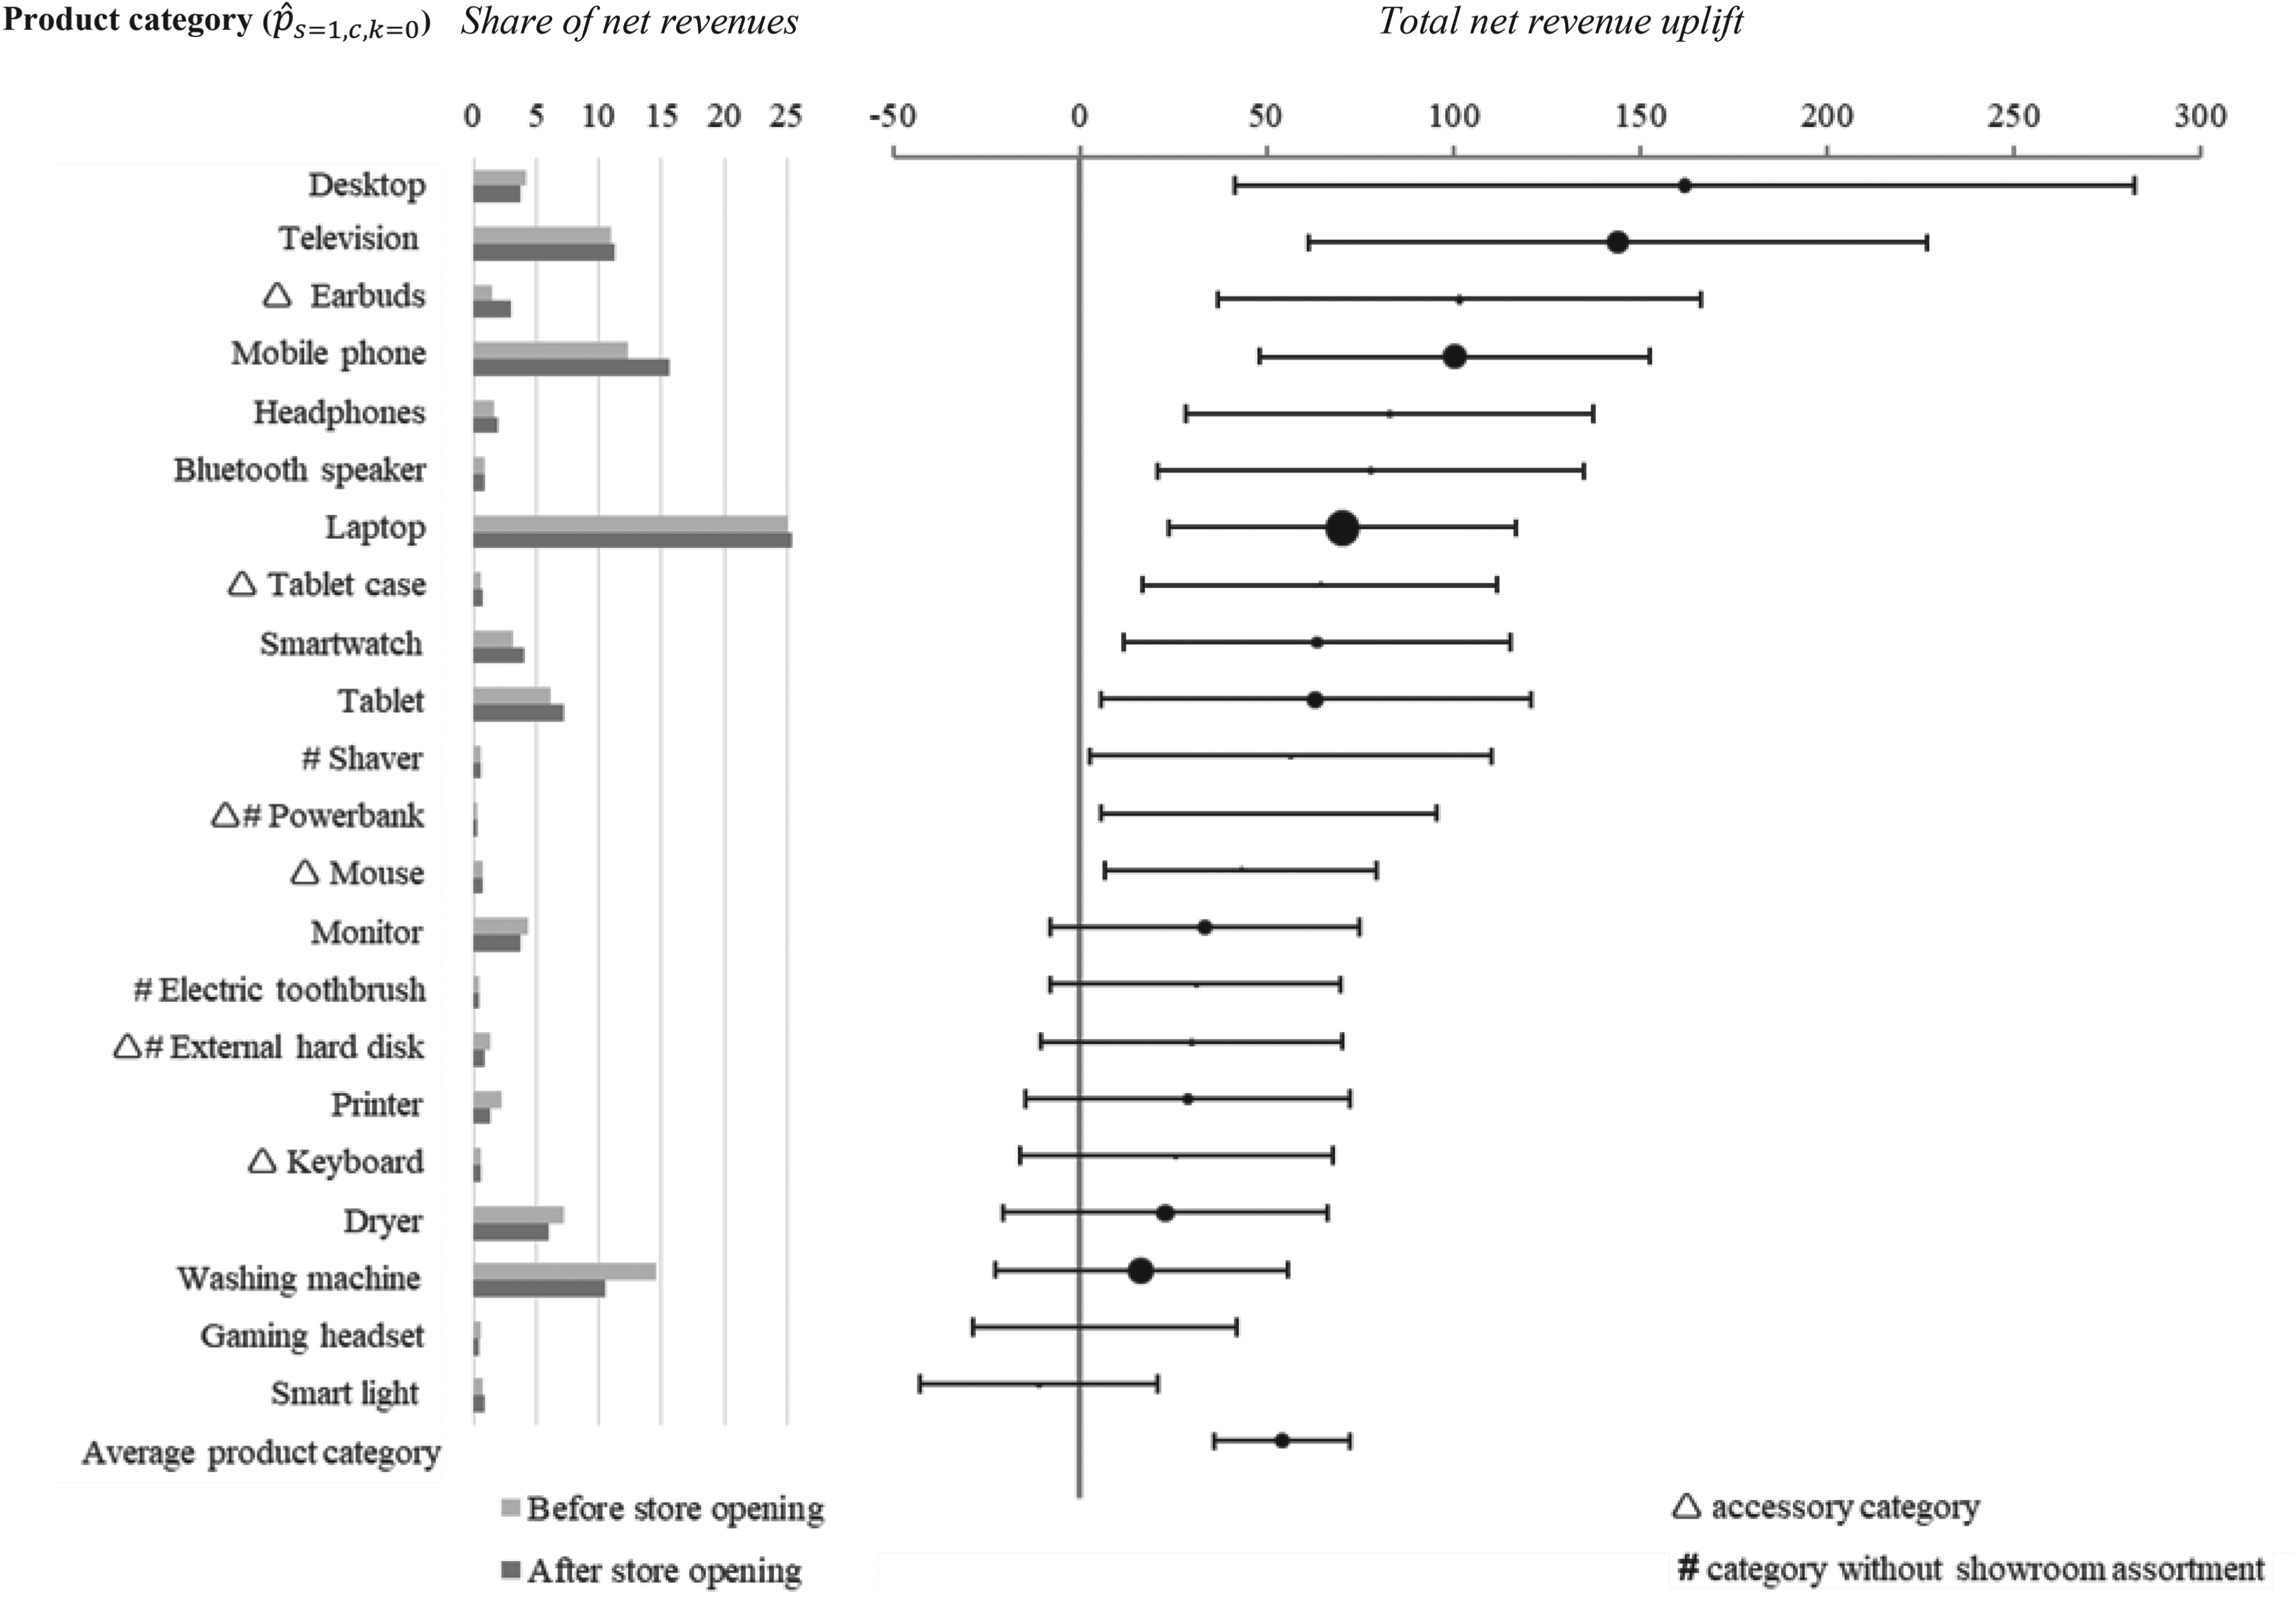
Uplift percentages of 22 categories present in large store 1 on total net revenues in short term. Category-level uplift estimates (sorted in descending order) are provided along with their 95% confidence intervals. Size of each dot marker represents the share of total (mostly online) net revenue before store opening. On the left side, light gray bars represent shares of total (mostly online) net revenue before store opening, and dark gray bars depict the shares of total net revenue afterward. The ê symbol indicates whether the product type is regarded as an accessory category by the retailer. The symbol
Uplift varied widely across categories. Desktop, TV, earbuds, and mobile phone saw the largest gains, all exceeding 100% with desktop even reaching 160%. Other strong performers included headphones, Bluetooth speaker, laptop, smartwatch, and tablet. In contrast, categories such as electric toothbrush, external hard disk, printer, keyboard, dryer, washing machine, gaming headset and smart light showed no significant uplift. Interestingly, despite the lack of showroom assortment (#), electronic shaver and powerbank still generated significant uplift.
The retailer, like many others, classifies product categories as destination versus accessory. Accessories in this study included the external hard disk, keyboard, mouse, powerbank, tablet case, and earbuds. Notably, four of the six accessory categories showed significant uplift, with earbuds ranking third overall.
Building on the observed category-level variation in net revenue uplifts, we examine why large experience-centric stores generate larger gains for some categories. Guided by our conceptual framework (Figure 1), we analyze how perceived in-store benefits—versus those online—explain these differences. First, we present model-free evidence of correlations between perceived dimensional utilities and net revenue uplift. Next, we extend the DiD model to include these utilities, followed by visualizing their explanatory power. Finally, we test whether utility effects differ for destination vs. accessory categories using a moderated model.
Correlation matrix of category-level net revenue uplifts and average perceived utilities.
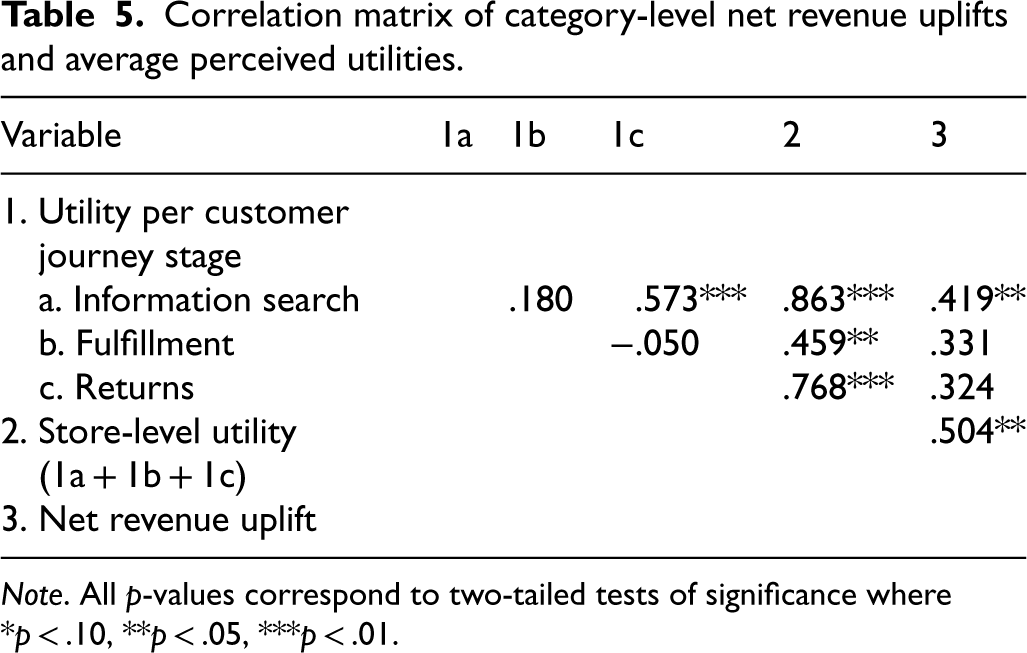
Correlation matrix of category-level net revenue uplifts and average perceived utilities.
Note. All p-values correspond to two-tailed tests of significance where *p < .10, **p < .05, ***p < .01.
Importantly, the overall unweighted store-level utility shows a stronger, statistically significant correlation with uplift (r = .504, p = .017), suggesting that utility aggregated across stages may explain performance better than any single dimension alone. While the use of equal weighting serves as a useful initial heuristic, our conceptual framework acknowledges that the relative importance of each stage may differ. We address this in the next section by empirically estimating stage-specific weights to assess their relative contributions to revenue uplift.


To focus on initial impacts, we restricted analysis to short-term effects (k = 0), which avoids confounding from the retailer's post-launch adjustments based on early performance metrics.
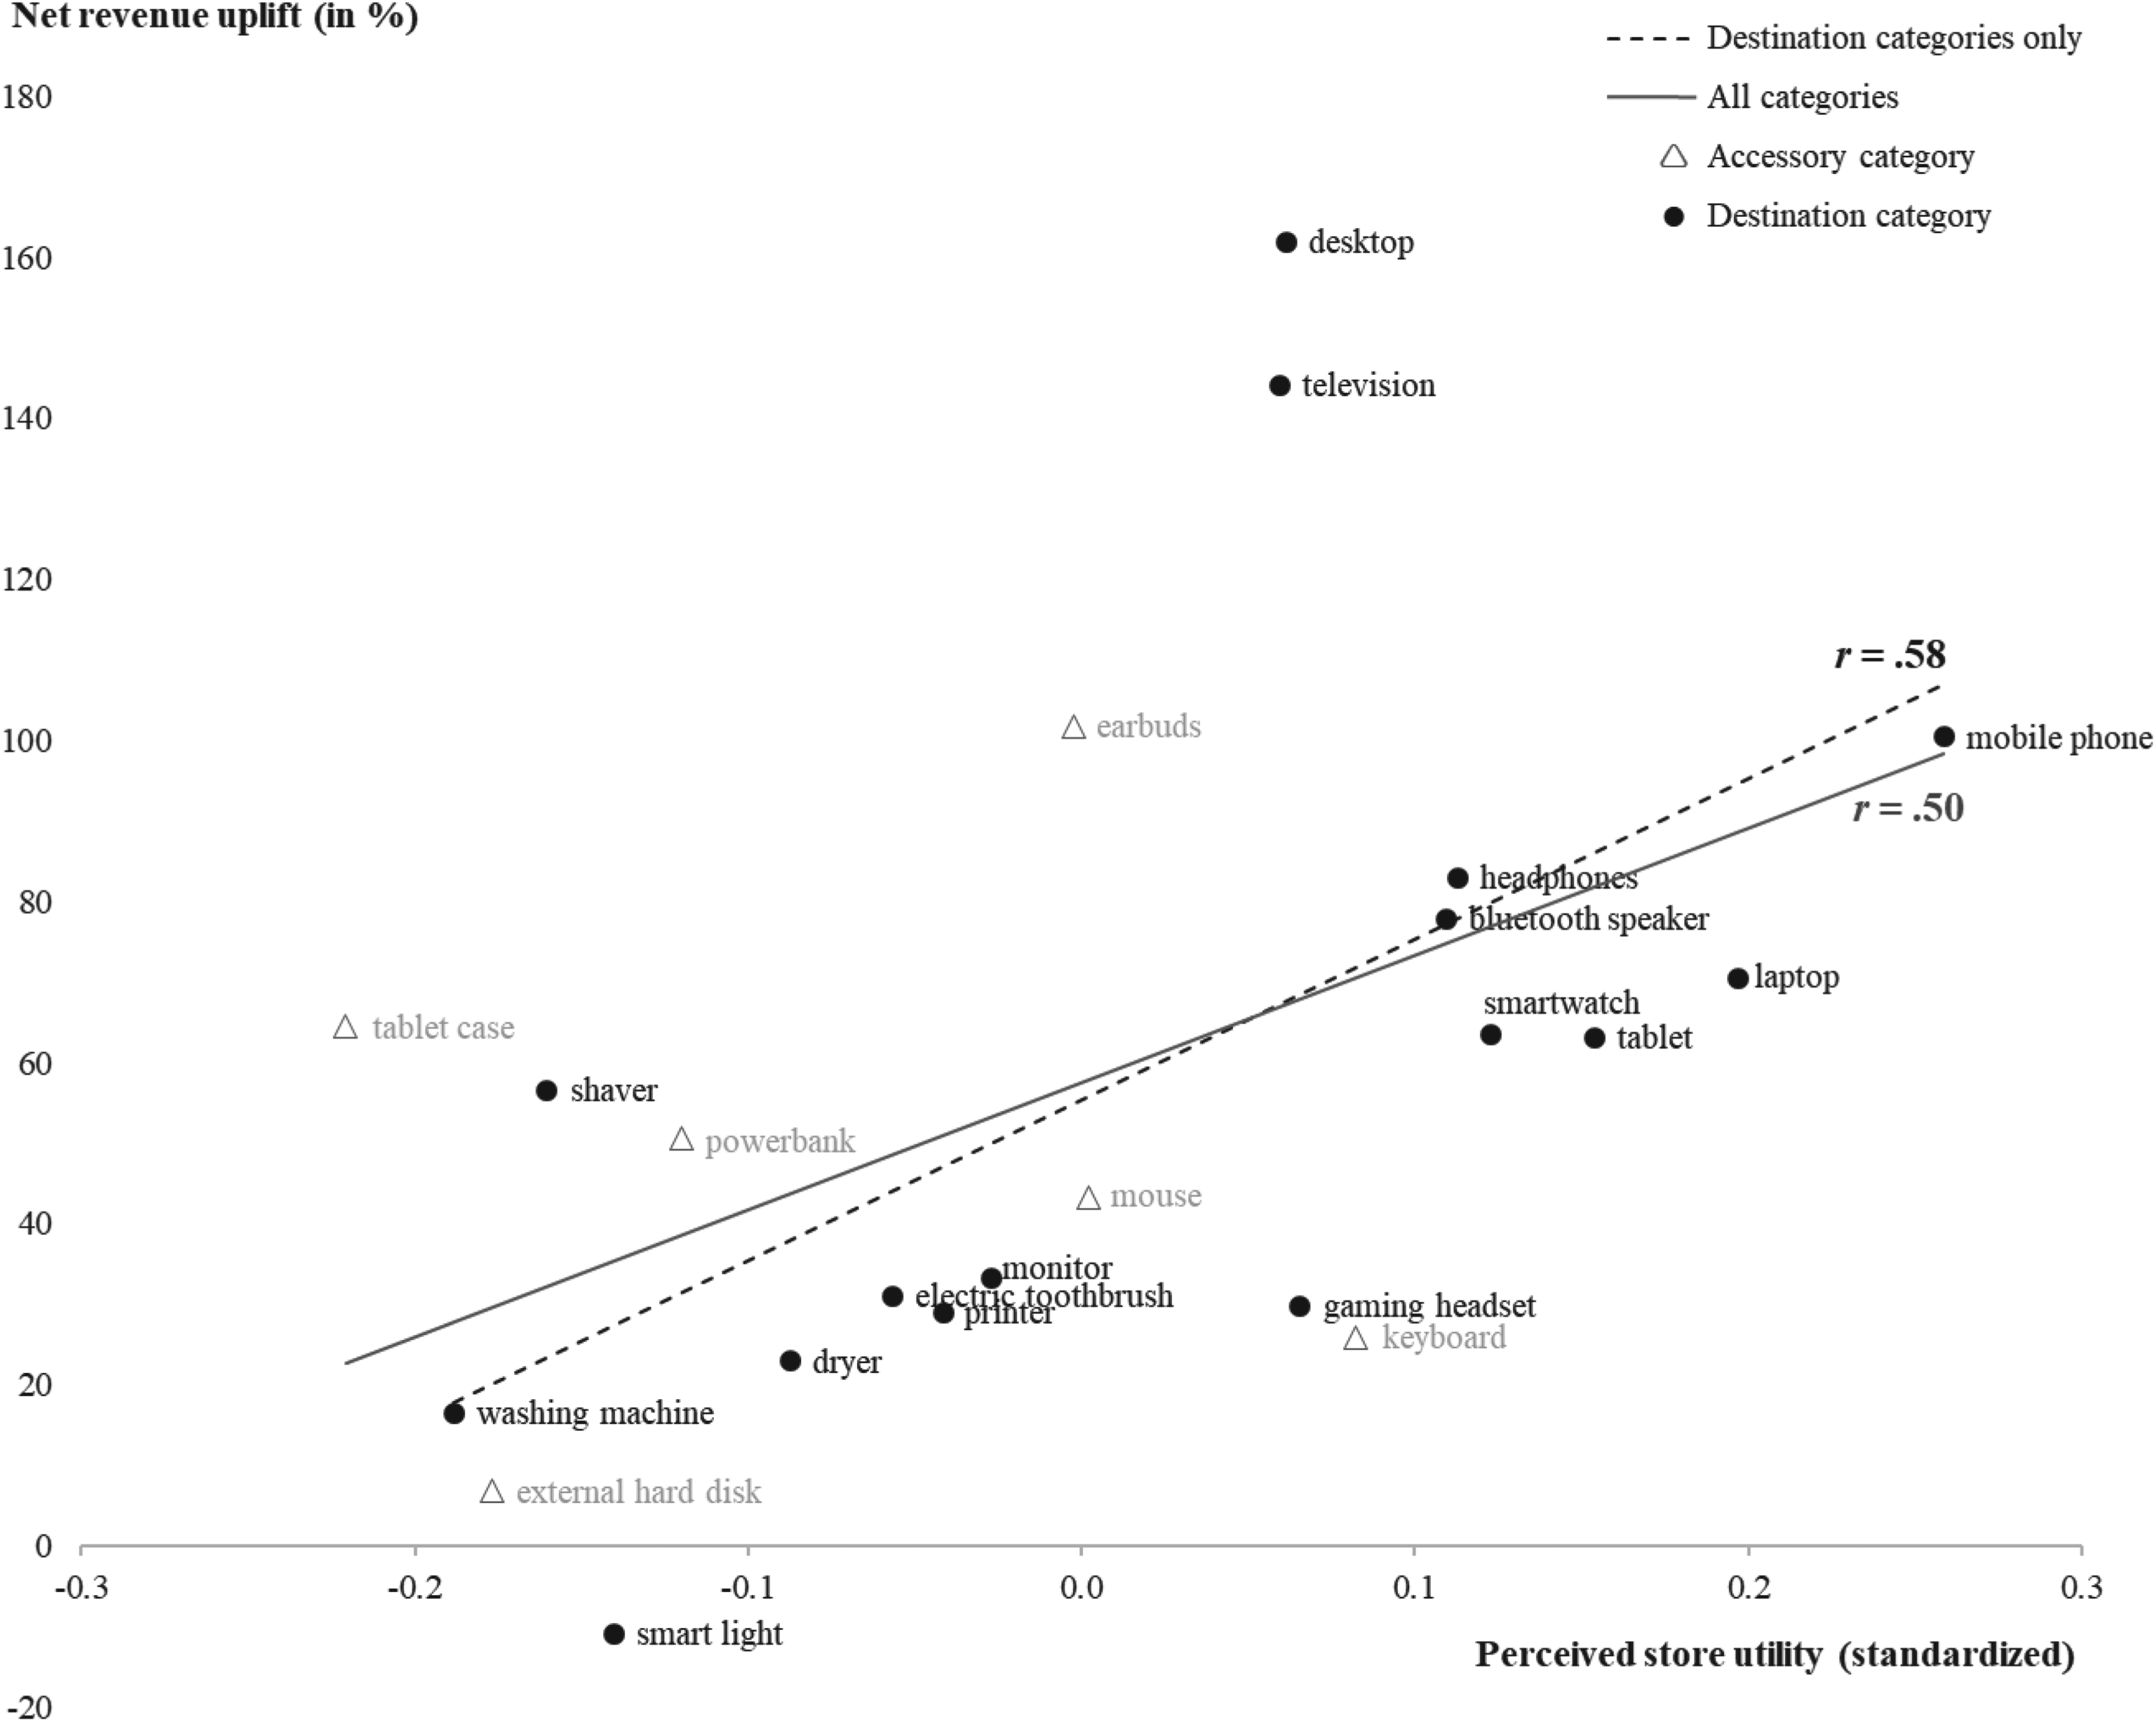
Weighted average perceived utilities vs net revenue uplifts across categories.
By comparing the actual positions of categories to their projected values on a regression line (straight line in the figure), we identify destination categories that either outperform (well above the line) or underperform (well below the line) relative to their perceived utility. For example, TV and desktop clearly outperformed predictions. Remarks from the store team highlighted the strategic salience of these categories (“here we really wanted to steal share from competitors”) that led to targeted in-store optimization work and extra sales initiatives: for TVs they brought in the best TV salespeople from other stores. Conversely, gaming headsets and monitors underperformed in contrast to the high perceived utilities. The retailer has since revealed plans to improve in-store experiences for these categories by offering more sensory-rich product demonstrations, enhanced information provision, and better sales guidance.
Interestingly, some accessories (earbuds, tablet case) showed similar uplifts with associated destination categories (mobile phone, tablet). These overlaps raise the possibility that uplifts among accessories may not be primarily utility-driven, but reflect spillover effects with destination product categories they are often bundled. In fact, with a focus on just destination categories, the utility-uplift relationship amplifies (r = .575, p = .020), further visualized by the steeper dashed line.
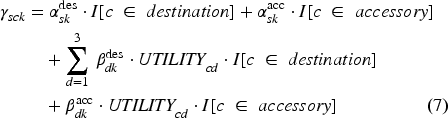
Figure 7 shows that category type (destination vs. accessories) moderates the relationship between perceived in-store utility and the revenue uplift following a store opening. For destination categories, higher perceived in-store utility is strongly associated with larger revenue gains. A one-standard-deviation rise in information search utility leads to a 16.2% boost in the multiplication factor (95% CI [5.4%, 27.1]), corresponding to a 23.6 percentage point increase in net revenue uplift. For fulfillment, the corresponding increase is 10.1% (95% CI [3.3%, 16.8]) in the multiplication factor, translating to a 14.6 percentage point rise in net revenue uplift. Return utility remains aptly non-significant (4.7%, 95% CI [−4.2%, 13.6]) for high-consideration purchases.
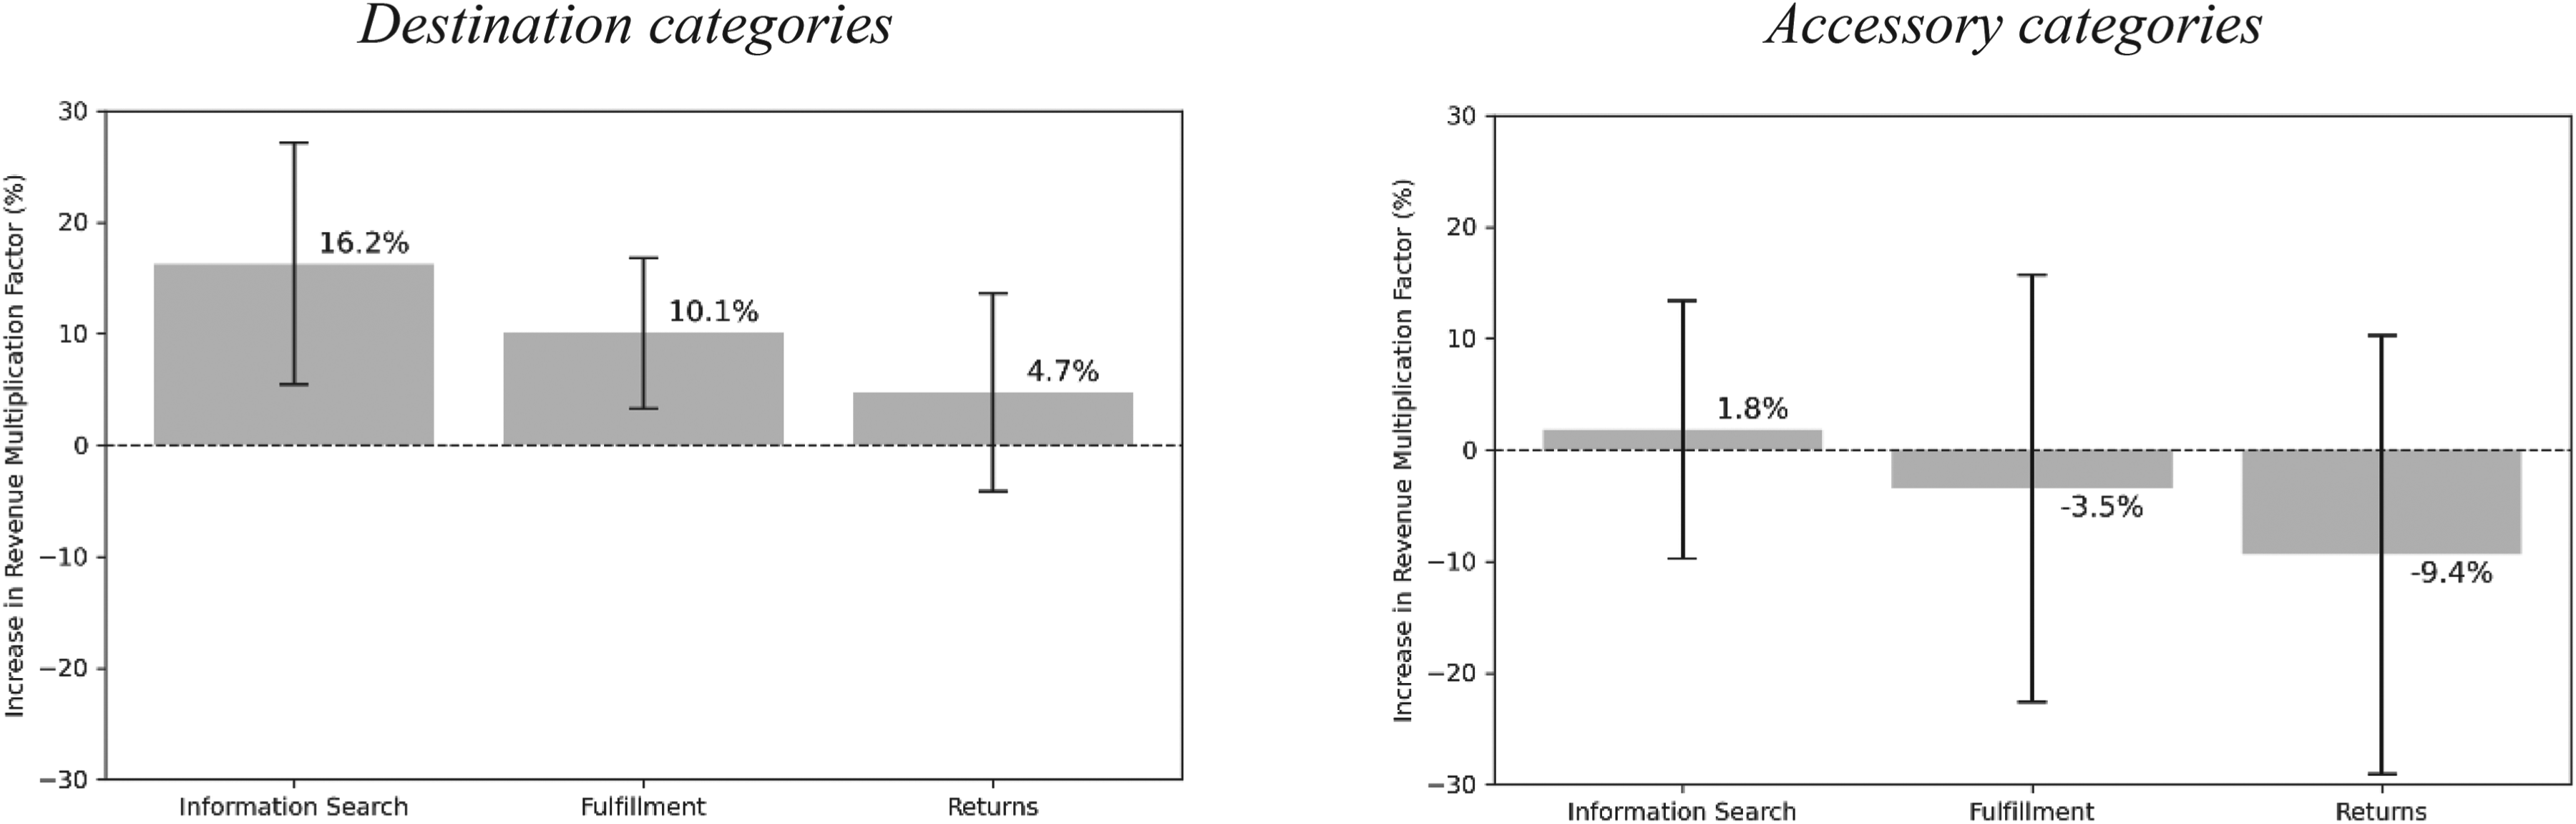
Increase in revenue multiplication factor resulting from a one-standard-deviation rise in utility. Uplift estimates are provided along with their 95% confidence intervals.
In contrast, for accessory categories variation in perceived in-store utility is not statistically associated with total net revenue uplift. The estimated effects are small and imprecise across all three utility dimensions: Information search utility yields just 1.8% (95% CI [−9.8%, 13.4]), while fulfillment and return utilities yield negative, non-significant estimates (−3.5% and −9.4%, respectively). This implies that in this empirical setting, perceived in-store utility does not explain a meaningful share of the observed variation in revenue uplift for accessories.
Taken together, these results support the interpretation of perceived in-store utility as a moderating mechanism that helps explain heterogeneity in store-opening effects across product categories. Shopper utility is therefore not a fixed or defining attribute of category type. Instead, its explanatory power depends on whether customers in a given category derive meaningful incremental value from the store during specific purchase-journey stages. In our setting, this moderating role is pronounced for destination categories, particularly at the information search and fulfillment stages, but not for accessories, whose revenue gains may instead be driven more by mechanisms such as joint purchase or cross-buying with destination products.
Summary. Omnichannel, multi-brand retailers face high-stakes decisions when expanding into physical retail: which store format to open and which product categories to feature given scarce space, staff, and service resources. These choices are costly, difficult to reverse, and ultimately determine whether a store generates incremental cross-channel value or merely redistributes sales between channels. We study these decisions in the context of a multi-brand consumer electronics retailer with a highly integrated omnichannel strategy and strong brand awareness.
Prior research has largely focused on single-brand, vertically integrated firms such as DNVBs in apparel and eyewear, which benefit from exclusivity and operate relatively narrow assortments. These studies often assume homogeneous in-store benefits across products. In contrast, multi-brand retailers compete with rival outlets selling identical products and must allocate limited in-store resources (e.g., space, staffing) across categories that differ in how much customers value physical experiences. We therefore examine under what conditions—specifically store format and product category—and why physical stores create value.
Key findings. Large experience-centric stores activate existing customers to buy more and, secondarily, attract new ones, generating substantial total net revenue growth despite online cannibalization. These gains grow over time and are most pronounced in areas near the store, where the risk of channel substitution is also strongest. By contrast, a small convenience-centric store cannibalizes online sales and fails to generate sufficient in-store sales to compensate for these losses. This contrasts with prior halo-effect findings and likely reflects the retailer's strong brand recognition and advanced omnichannel integration.
At the category level, effects are highly heterogeneous: over 40% of categories show no significant revenue uplift, while others more than double in sales. Destination categories such as TV, desktop, and mobile phone drive the strongest gains, explained by information search (sensory inspection and expert advice) and fulfillment (instant access) utilities. Return utility plays little role, consistent with reduced post-purchase uncertainty after in-store evaluation. Accessories show a different pattern. Despite low intrinsic in-store utility, several generate meaningful gains, often increasing over time. Notably, nearly all accessory categories show growing uplift, which—according to our retail partner—likely reflects a learning curve in effectively cross-selling these products. These effects appear driven less by evaluation needs and more by cross-buying and bundling (e.g., earbuds with phones). This suggests that accessories derive value from contextual placement rather than standalone experiences. The retailer's recent experimentation with “use-case” setups (e.g., home office configurations 26 ) reinforces this logic. Together, these patterns show that store value depends on category-specific utility, complementarities, and operational execution.
Relation to prior work. Our findings extend research on how tactile, complex products benefit from physical retail. For example, Zhang et al. (2021) distinguish “deep” versus “shallow” products and show that offline presence enhances customer learning about the retailer, which in turn drives future purchases for the former. However, their binary classification and focus on the information stage limit generalizability of their insights. We instead adopt a continuous, multi-dimensional utility-based framework spanning three stages of the customer journey: information, fulfillment, and returns. Using the Theory of Reasoned Action (Fishbein and Ajzen, 1975) as a structuring lens, we link perceived in-store benefits directly to revenue outcomes using an integrated DiD model. This allows us to explain heterogeneity within destination categories, reveal why accessories may still benefit despite low intrinsic utility, and connect category-level customer perceptions more directly to retailer outcomes than prior approaches.
Managerial implications. For decision makers in omnichannel, multi-brand retail, our findings offer three key lessons for managers in omnichannel, multi-brand retail. First, store format matters: large experience-centric stores generate sustained growth by activating existing customers and attracting new ones, whereas small convenience-centric formats may not offset online cannibalization. Second, assortment and in-store support should align with category utility. Categories with high information and fulfillment utilities—such as TV and mobile phone—belong in prominent, interactive zones where customers can test products and receive expert advice. By contrast, categories that score only on fulfillment utility may not need to appear on the showroom floor at all. Instead, they can be stocked in inventory and surfaced through efficient click-and-collect services, which our partner recently upgraded with automated lockers. Accessories are likely to drive incremental sales when co-located with destination categories or bundled into use-case solutions. Third, operations and staffing should reflect utility profiles. High-information categories require expert staff who can provide demos and consultations, whereas fulfillment-driven categories can rely more on self-service and efficient pick-up solutions. Together, these insights provide a practical playbook: invest in experience-centric formats, curate assortments based on utility profiles, and structure store environments, including layout, staffing, and service processes, to reflect the distinct category needs.
Limitations and generalizability. Our results are based on three store openings at a single consumer electronics retailer. This mirrors the real-world expansion strategy of many omnichannel, multi-brand retailers like Best Buy which typically pilot formats before scaling, but limits scope. The post-opening window is relatively short, though sufficient to detect meaningful variation across categories. Methodologically, our staggered DiD design combined with propensity score matching strengthens causal identification, yet unobserved time-varying confounders cannot be ruled out.
The mechanisms we identify are most relevant for experiential product categories in urban markets with strong brand recognition, where in-store information and fulfillment benefits are particularly salient. 27 Effect sizes likely vary with competitive density, market maturity, and brand equity. For instance, while we do not observe halo effects in this mature setting, anecdotal evidence from the retailer's expansion into new markets suggests that stores can increase online sales by building awareness and trust. Thus, while the mechanisms we identify (e.g., information, fulfillment, and bundling effects) are general, their strength is context dependent.
Future research. Several directions merit further study. First, future work could examine how assortment breadth versus depth affects store performance: should retailers concentrate space on high-utility categories, or maintain breadth to support cross-category complementarities?
A second promising direction is to examine dynamic feedback loops that unfold after store openings. Retailers often adjust layouts, staffing, and promotional strategies in response to early performance signals. Such adaptations can amplify or dampen initial effects, creating feedback cycles in which store outcomes shape managerial interventions, which in turn influence future outcomes. For example, underperforming categories may recover if managers respond with improved staff training, enhanced demonstrations, or new bundling strategies, whereas persistent underperformance may lead to their removal from the showroom, freeing space for stronger performers. These adaptive responses complicate causal identification, as treatment effects may become intertwined with managerial interventions, yet they are essential for understanding long-run performance. Future research could explicitly model such feedback mechanisms. Quantitative approaches might incorporate time-varying controls (e.g., staffing, assortment, promotions) or interact event time with pre-opening performance to capture systematic adjustments. Qualitative work, such as interviews with retail managers, could complement these models by revealing how decisions are made and which signals trigger interventions. Tracking these dynamics would provide a richer understanding of how short-term outcomes translate into longer-term strategies in omnichannel retailing.
Finally, extending our utility-based framework to other sectors such as fashion, home goods, or beauty could further reveal how retailers translate in-store information, fulfillment, and return benefits into revenue under different conditions, further advancing both theory and practice in omnichannel retailing.
Supplemental Material
sj-docx-1-pao-10.1177_10591478261454766 - Supplemental material for The value of experience-centric stores in omnichannel retail: A multi-method approach at the category level
Supplemental material, sj-docx-1-pao-10.1177_10591478261454766 for The value of experience-centric stores in omnichannel retail: A multi-method approach at the category level by Ayşe Çetinel, A Gürhan Kök and Robert P Rooderkerk in Production and Operations Management
Footnotes
Acknowledgments
We thank our retail partner for its significant efforts in sharing the data with us and providing countless insights. We are thankful to the Marketing Science Institute for funding our research and greatly appreciate the helpful comments from seminar participants at Nova School of Business and Economics, Bilkent University, Ozyegin University, ESCP Business School, HEC Paris, and INSEAD. We also gratefully acknowledge comments from participants at the 2022 MSOM Conference, the 2022 EURO Working Group on Retail Conference, and the 2023 Consortium of Operational Excellence in Retail (COER) Conference. Finally, we are grateful to Roger de Jong and the scientific programmers at Rotterdam School of Management for providing translation and programming help for the survey.
Funding
The authors disclosed receipt of the following financial support for the research, authorship, and/or publication of this article: This work was supported by the Marketing Science Institute (grant number 4001426).
Declaration of conflicting interests
The authors declared no potential conflicts of interest with respect to the research, authorship, and/or publication of this article.
Notes
How to cite this article
Çetinel A, Kök A G and Rooderkerk RP (2026) The value of experience-centric stores in omnichannel retail: A multi-method approach at the category level Production and Operations Management xx(xx):1–21.
References
Supplementary Material
Please find the following supplemental material available below.
For Open Access articles published under a Creative Commons License, all supplemental material carries the same license as the article it is associated with.
For non-Open Access articles published, all supplemental material carries a non-exclusive license, and permission requests for re-use of supplemental material or any part of supplemental material shall be sent directly to the copyright owner as specified in the copyright notice associated with the article.