
Abstract
This work addresses the operational conflicts between visibility-driven mobilization and cost efficiency in disaster management scenarios involving wildfires. Using official wildfire reporting on the social media platform Twitter (now X), we develop a temporal gravity model to extract a signal of public attention for California wildfires (2007–2021) without the “noise” of spurious content. Interpreting this signal through the lens of behavioral disaster management operations, our analysis finds a “Visibility-Efficiency Paradox.” This paradox shows that while social media visibility functions as a potent mobilization signal to the general public during wildfires and is associated with greater resource deployment, it simultaneously correlates with reduced cost efficiency under high resource use loads. We identify resource saturation as a boundary condition where heuristic signals appear to shift from valuable inputs to potential stressors. These findings challenge the assumption that high visibility of responders in a wildfire emergency is a direct proxy for operational urgency and effectiveness. We propose actionable strategies, including reverse audits and decoupling, in order to help counteract salience bias; thus, highlighting the potential for algorithmic governance to align public attention with sustainable resource management.
Keywords
Introduction
The escalating costs of planning for and combating wildfires, particularly with respect to suppression costs as a part of the overall response cost, have become a significant concern in modern wildfire management. From 1985 to 2022, wildfire suppression costs have notably increased, with an average annual growth rate of 7.55%, rising from $239,943,000 to $3,549,000,000 (National Interagency Fire Center, 2022). This growth significantly outpaces the average inflation rate of 2.78% per year over the same period, as based on the Federal Reserve Bank's released consumer price index (2023). In addition to financial costs, the human impact of wildfires has risen dramatically. Between January and April 2024 alone, 437 global fatalities were reported, marking the deadliest year since 1991 (Samborska et al., 2024). In the United States, wildfires have contributed to over 500 direct and countless indirect deaths since 1990, with degraded air quality from wildfire smoke causing an estimated 10 million premature deaths globally over the same period (Jones et al., 2024). Moreover, the wildland–urban interface (WUI) in the United States has expanded significantly, with ∼350,000 new homes added annually over the past two decades, reaching 44 million in high-risk areas by 2021 (Ma et al., 2024). Wildfire smoke now accounts for 25% of Americans’ exposure to harmful fine particulate matter (PM2.5) (Wibbenmeyer and McDarris, 2021). These financial and operational pressures place incident commanders in a resource allocation dilemma under extreme uncertainty. Decision-makers must balance the risk of under-reaction against the risk of over-commitment, where deploying expensive suppression assets to every ignition can rapidly deplete limited budgets.
The emergence of social media and the widespread use of mobile devices present transformative opportunities to incorporate real-time information into emergency response strategies. Indeed, a growing body of research demonstrates that social media can enhance situational awareness by providing crowd-sourced observations (Veinott et al., 2009; Wang et al., 2016). However, governments need to comprehensively evaluate the relationship between social media activity and wildfire response decisions before large-scale deployment. Simply observing raw social media metrics such as the aggregate tweet volume or hashtag frequency may not be sufficient. Issues such as misinformation can challenge the reliability of the data stream. The central operational challenge is to provide a reliable and quick assessment that offers decision-makers a quantitative tool. Such a tool can assist decision-makers in determining whether social media signals can be effectively incorporated to improve resource planning and allocation efficiency or whether these signals introduce costly biases into the decision loop for resource allocations in the context of wildfires. To this end, we develop the social media gravity score (detailed in Section 3) as a formalized metric to quantify social media visibility.
Behavioral operations theory suggests that in information-scarce environments, decision-makers often rely on salient heuristic signals, such as perceived public urgency, to guide prioritization (Altay and Green, 2006; Anand et al., 2023). Social media activity generates a uniquely powerful form of public visibility signal that can serve this function (Cui et al., 2018). However, the operational impact of social media signals remains a subject of theoretical debate. On the one hand, high visibility may serve as a valuable informational proxy, reducing asymmetry and enabling faster, more targeted resource deployment, thereby enhancing efficiency. On the other hand, it may introduce an attention bias, pressuring agencies to over-commit resources to spotlighted incidents regardless of actual operational needs, potentially inflating suppression costs (Tokar et al., 2016). Our study introduces the temporal gravity model, a composite metric that quantifies public attention by tracking social media volume over the initial phase of an incident while adjusting for population and location. Utilizing a unified dataset of California wildfires (2007–2021), we link this de-noised visibility signal to official suppression cost data to address two research questions: First, is higher social media visibility associated with a greater mobilization intensity of suppression resources? Second, is this visibility-driven response linked to improved cost efficiency (reducing per-acre costs), or is it associated with operational inefficiencies? This work leverages high-granularity archival data to validate latent behavioral mechanisms, an approach aligning with the empirical behavioral operations stream (Batt and Terwiesch, 2017; Kc and Terwiesch, 2009). The answers to these two questions allow us to identify the boundary conditions where social visibility shifts from a valuable operational signal to a potential source of costly distraction.
Contribution
This study makes three contributions to the operations management literature. First and foremost, we provide empirical evidence to assist in the resolution of the conflict between visibility-driven decision-making under uncertainty and operational efficiency. Our findings point to social media visibility for a given wildfire acting as a powerful mobilization signal for resource allocation, while at the same time driving high resource use that incurs a reduced cost efficiency. In more specific terms, the greater the amount of social media generated for a given wildfire, the more likely extra resources are allocated for that wildfire, which may not be the most efficient use of such resources. Our work attempts to identify the boundary condition where heuristic signals generated by social media traffic for a wildfire shift from beneficial to costly. Second, we offer a methodological contribution by developing a temporal gravity model, a metric that provides greater informational value than raw social media volume by transforming unstructured noise into a standardized operational variable. This gravity-based method extends the analytical toolkit for data-driven decision-making in disaster operations. Finally, we identify how standardized metrics can help incident commanders distinguish valuable warning signals from distortive external pressures, enabling a more disciplined approach to resource allocation that balances immediate responsiveness with long-term budget sustainability.
Organization
The rest of this work is structured as follows: Section 2 combines the review of related literature and the development of our hypotheses. Section 3 focuses on model development, detailing how we adapt the classic gravity model to develop the temporal gravity model. Section 4 focuses on data collection and preparation, detailing the process of gathering and organizing the data used in the analysis. Section 5 outlines research design and analytical techniques. Section 6 presents the results, offering empirical analysis substantiating the study's contributions. Section 7 is dedicated to a discussion of these findings, linking them to theoretical, managerial, and policy implications for wildfire management. Finally, Section 8 summarizes our insights and suggests directions for future research, highlighting both academic and policy implications.
Related literature and hypotheses development
The discussion surrounding effective wildfire response strategies has historically centered on suppression efficacy and tangible cost drivers like terrain and fuel loads (Ager et al., 2017; Hand et al., 2014). Moving beyond these traditional factors, our research examines the role of intangible behavioral signals by synthesizing three interconnected streams of literature. First, studies on behavioral operations suggest that in uncertain environments, decision-makers rely on salient cues, such as public visibility, as informal heuristics to prioritize incidents and allocate resources (Altay and Green, 2006; Tokar et al., 2016). Second, crisis informatics highlights the potential of social media as a source of real-time public attention signals, creating an opportunity to examine how different metrics of this attention might explain variation in operational costs (Gong et al., 2024; Papadimos et al., 2022; Yan and Pedraza-Martinez, 2019). Third, gravity models from the social sciences offer a promising framework for quantifying spatial interactions, a pattern also observed in disaster communications that can be adapted to construct composite social media visibility metrics for wildfire response (Guha et al., 2021; Wen et al., 2023). While a growing body of work has proposed sophisticated metrics to measure social media visibility, few studies have empirically tested the specific association between these visibility signals and operational outcomes of resource deployment and suppression costs. Our study fills this gap by constructing and evaluating the temporal gravity model, a composite visibility metric, and testing its statistical association with per-acre response costs. Our approach is intended to offer statistical support for responders when direct cost signals are limited, laying the foundation to formally develop our hypotheses.
Behavioral signals and resource mobilization
The first stream of literature, rooted in behavioral operations management, establishes the theoretical mechanism for how public attention signals translate into operational actions. In disaster settings where formal prioritization rules are often incomplete or delayed, decision-makers must rely on behavioral cues, such as perceived urgency or visibility, to triage incidents and allocate limited resources (Altay and Green, 2006; Anand et al., 2023). This reliance on visibility is not unique to disaster response. For example, studies in healthcare show that patient flow decisions frequently depend on proxy urgency signals when clinical data is unavailable (Ibanez et al., 2018; Patrick et al., 2008). Similarly, in service operations like call centers, visible signs of customer demand can become informal prioritization inputs when needs cannot be directly measured (Armony and Maglaras, 2004; Cui et al., 2018; Kim et al., 2018). The theoretical support for such visibility-driven prioritization is also well-grounded, demonstrating that under certain conditions, it is optimal to prioritize tasks with higher perceived urgency, even when actual costs are unknown (Bo et al., 2023; Tokar et al., 2016; van Mieghem, 1995). Collectively, behavioral operations management research establishes a strong conceptual foundation for interpreting public visibility as a proxy signal that can shape how wildfire incidents are prioritized and resourced. However, despite the well-established theoretical models of prioritization under uncertainty, few studies have empirically tested how a quantified measure of social media visibility is specifically associated with the variation in observed wildfire response operations.
The second stream of literature examines how social media functions as an operational signal and a proxy for collective public attention during disasters. Studies in crisis informatics show that social media can aid situational awareness by providing real-time updates and crowd-sourced observations that support emergency response efforts (Barker and Macleod, 2019; Imran et al., 2020). Within the operations management context, scholars have explicitly identified the operational value of such social conversations, particularly in facilitating the matching of supply and demand during disaster relief (Yan and Pedraza-Martinez, 2019). For example, Twitter activity has been shown to amplify wildfire-related discussions and reduce information asymmetry between agencies and the public (Cui et al., 2018; Wang et al., 2016). However, on the flip side, social media information is also found to be dominated by “noise,” which can trigger negative emotional responses and distort public understanding during emergencies (Bertot et al., 2012; Comes et al., 2020; Falco et al., 2018; Wei et al., 2021). In the context of wildfires, high levels of social media attention may amplify public concern and elevate perceived risk and urgency, influencing how the public and institutions interpret the severity of an event (Dai et al., 2022; Wang et al., 2016). Existing research thus confirms that social media can support disaster response. Yet, a critical gap remains. Little is known about how different metrics of this visibility compare in explaining variation in operational outcomes like resource deployment and costs (Berard et al., 2020; Lin, 2022). This research specifically examines resource deployment as the primary operational response and suppression costs as the resulting financial consequence. Understanding the relationship between this response and its consequence is informative for evaluating decision-making effectiveness. In response to this gap, our study develops a composite visibility metric, the social media gravity score, and then systematically examines its association with these key operational outcomes.
The theoretical rationale for our first hypothesis emerges from synthesizing behavioral operations management with crisis informatics. Behavioral operations literature establishes that in uncertain environments, decision-makers are likely to be influenced by salient, non-operational signals when prioritizing incidents and allocating resources (Altay and Green, 2006; Tokar et al., 2016). Crisis informatics literature, in turn, confirms that high social media activity serves as exactly such a potent signal, quantifying an incident's public salience and perceived urgency (Dai et al., 2022; Wei et al., 2021). Consequently, wildfires generating significant social media attention may be perceived by agencies as carrying higher social or reputational risk. This perceived pressure from heightened public visibility could prompt a more substantial deployment of suppression resources to demonstrate responsiveness. In this article, the social media gravity score (detailed in Section 3) serves as our quantitative measure of this visibility. Based on this behavioral foundation, the first hypothesis is outlined as follows:
Visibility signals and operational efficiency
The third stream of literature shows that factors such as demographics, geography, and social media volume often interact, collectively shaping response effectiveness in natural disasters (Adam et al., 2012; Donner and Rodríguez, 2008). Researchers have attempted to integrate these factors to improve the performance of decision models. For example, integrating geographic factors with community demographics has been shown to enable more targeted decisions, and combining geographic with social media data can enhance the assessment of disaster impact (Cheng et al., 2019; Rodrigues et al., 2022). Building on the logic of factor integration, studies have explored using gravity models for such purposes. The application of gravity models that integrate population interaction has been shown to improve wildfire risk prediction (Sadasivuni et al., 2013). Furthermore, other research confirms that social media connectivity itself follows gravity-like patterns, with engagement decreasing as geographic distance increases (Guha et al., 2021; Maheswaran et al., 2007). In the context of operations management, these gravity-based patterns offer a mechanism for signal extraction. Filtering out the baseline noise driven by population density and distance effectively isolates actionable visibility signals (Lin et al., 2022; Wang et al., 2022). However, a gap remains in operationalizing this de-noising approach to construct a composite metric that links population- and location-weighted social media activity to wildfire response costs. Our research addresses this gap by developing the temporal gravity model (detailed in Section 3), providing a tool to extract pure visibility signals and test their impact on operational efficiency.
Building on the logic of our first hypothesis, our second hypothesis examines the relationship between a more refined, context-aware measure of visibility and the resulting per-acre response costs. While H1 focuses on the quantity of resources, H2 explores their resulting efficiency, drawing its core logic from the gravity model (detailed in Section 3). As established in Section 2.2, integrating factors like geography and demographics with social media data can enhance the assessment of disaster impact (Cheng et al., 2019; Lin et al., 2022; Rodrigues et al., 2022). Our social media gravity score represents not just high attention, but attention that is geographically and demographically concentrated. The social media gravity score is intended to provide a more precise signal of high-stakes incidents by capturing connectivity patterns that are known to follow gravity-like behavior (Guha et al., 2021; Sadasivuni et al., 2013; Wang et al., 2022). The potential association between this composite signal and per-acre costs, however, remains theoretically ambiguous. On the one hand, an early and precise signal could be associated with a more targeted and effective initial response, potentially linking to faster containment and lower per-acre costs. On the other hand, a powerful visibility signal misaligned with the actual complexity of the fire could still be linked to inefficient over-allocation. Given these competing possibilities, we test the primary proposition, grounded in signal extraction logic in behavioral operations, that a signal with greater informational value associates with more efficient outcomes. Based on the logic that improved information quality allows for better-informed trade-offs, we formulate our second hypothesis as follows:
Model development
We develop a temporal gravity model based on the classic gravity model to address the need for a robust informational signal of public urgency. Existing studies have explored ways to incorporate geographic and demographic factors into operational response models (Choi et al., 2023; Ivanov et al., 2023). Sadasivuni et al. (2013) show that integrating population interaction with fuel data through a gravity model improves wildfire risk prediction and outperforms road density models across risk zones. Additionally, social media connectivity exhibits gravity-like behavior, with connectivity decreasing as geographic distance increases (Guha et al., 2021). Social media also influences wildfire response differently across locations and demographics, with variations in awareness and engagement shaped by factors such as population composition and levels of urbanization (Ma et al., 2024). Researchers have further identified limitations in static network models and have proposed gravity-based alternatives to better capture dynamic interaction patterns (Maheswaran et al., 2007; Pourebrahim et al., 2019). The above findings from prior studies motivate our adaptation of the gravity model in the wildfire response context, building on its long-standing use in modeling flows such as migration and trade (Capoani, 2021). Recent extensions have applied the gravity framework to social media settings. For example, Wen et al. (2023) apply it to community vulnerability assessments and find improved accuracy in capturing real-time shifts in network dynamics. Building on these advancements, we develop the temporal gravity model to generate responsive decision-making signals in disaster operations.
We recognize that social media visibility is closely linked to geographic and demographic factors, and that this interaction often follows gravity-like behavioral patterns. This linkage represents a potential confound that must be addressed to isolate the pure signal of public attention. Thus, we incorporate geographic and demographic factors to adjust social media volume within a gravity model framework. Specifically, for any given fire, Twitter volume associated with that fire serves as one of the mass components in the model. The second mass component is the population of the metropolitan area nearest to the wildfire. The distance between the wildfire and the nearest metropolitan area, measured using Euclidean distance, serves as the denominator in the calculation. The formula for the temporal gravity model is as follows:
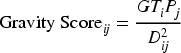
This gravity score accounts for social media activity's interaction with geographic and demographic factors under a gravity-based structure. It is important to note that while fires near population centers naturally threaten more assets, our dependent variable focuses strictly on suppression costs rather than property damage. Furthermore, our analysis explicitly controls for physical severity metrics like fire size to isolate the residual pressure effects of social visibility.
Data collection and preparation
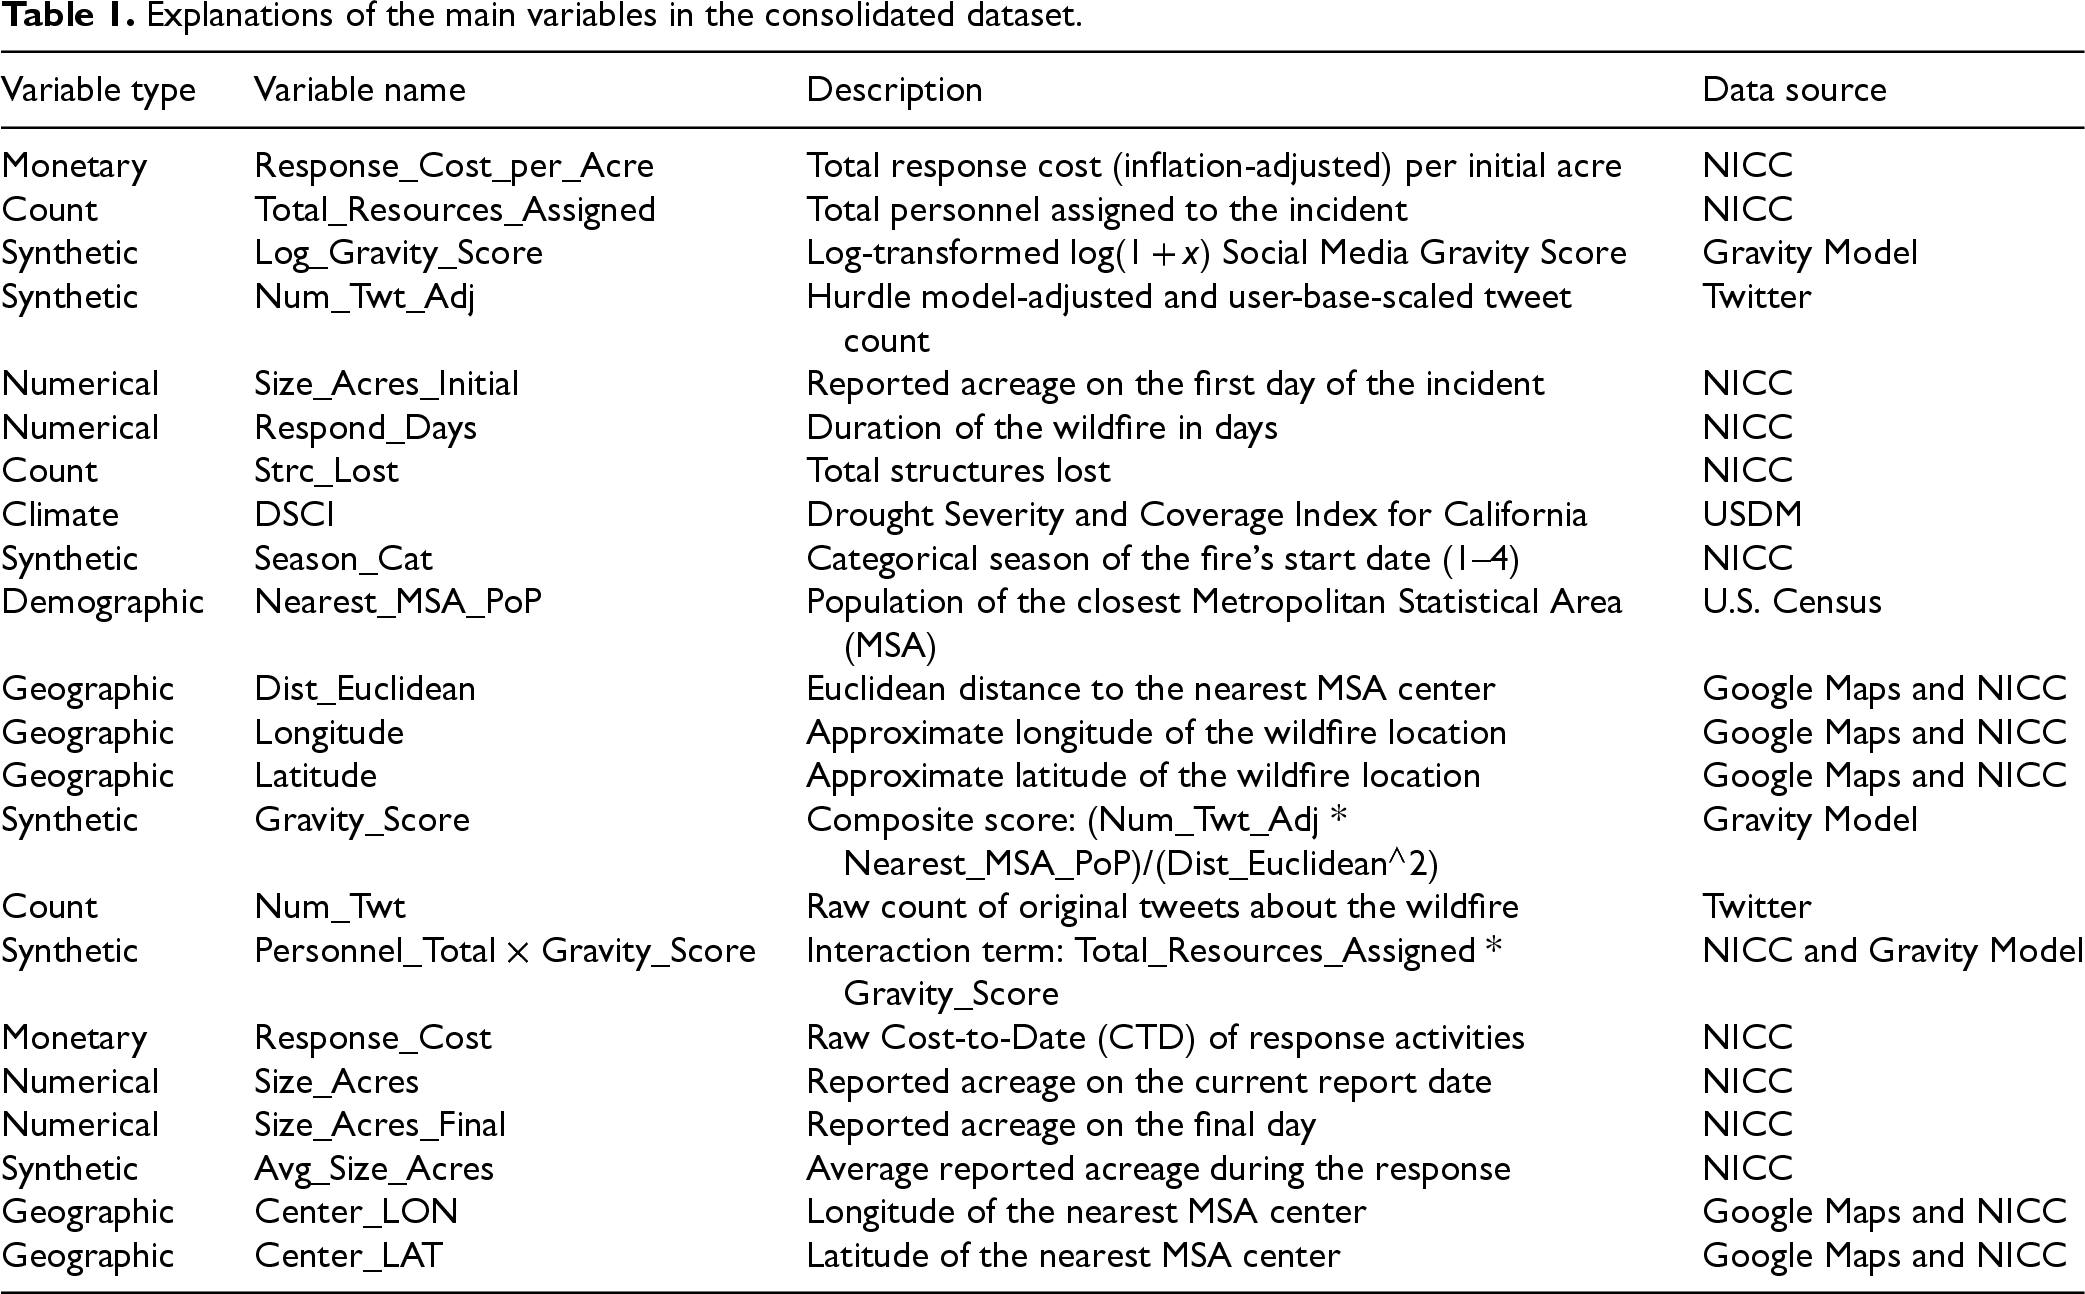
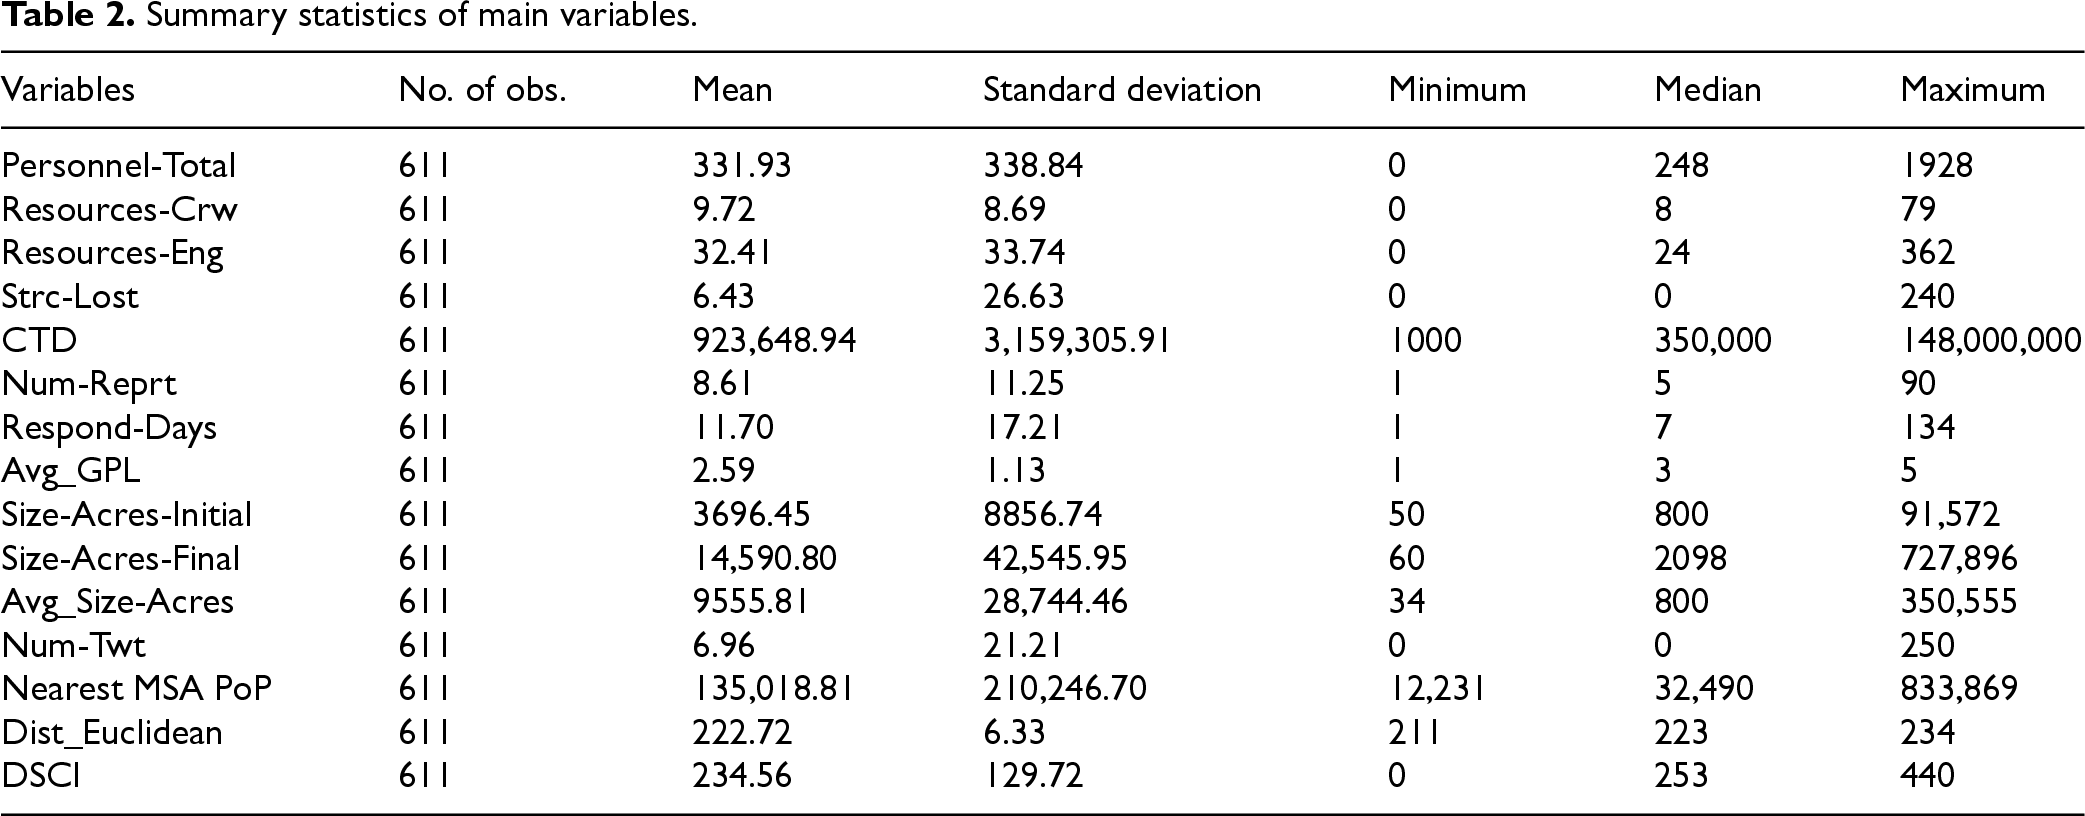
We analyzed NICC Incident Management Situation Reports (IMSR) for California wildfires from 2007 through August 2021. Our sample is composed of incidents reported in the NICC database, which typically include larger fires that require significant, extended resource commitments and are managed beyond local jurisdictions (National Interagency Fire Center, 2023). Our overall research workflow is summarized in Figure 1, which provides a visual overview of the entire process from data collection to the analytical models detailed in Section 5. Following this workflow, we first integrated four primary data sources. Data from structured tables within the NICC's daily PDF reports were extracted using a Python script based on the tabula-py library. Wildfire-related tweets were collected with the snscrape Python package, using queries derived from official incident names, with retweets excluded (Tran, 2022; Watson et al., 2024). A final manual review further refined the tweet dataset. The dataset was supplemented with demographic and geographic information from the U.S. Census Bureau and Drought Severity and Coverage Index (DSCI) data from the U.S. Drought Monitor (USDM). Table 1 provides a comprehensive list and detailed descriptions of all variables used in our analysis, and Table 2 presents their summary statistics. The specific methodological details for each data source are outlined below: Government Reported Data (NICC): We examined reports for all fires with a Management Situation Report from the National Interagency Coordination Center (NICC) from 2007 through the end of August 2021. We chose this time period because Twitter was launched on 21 March 2006, allowing for a comprehensive study of social media's role from its early adoption phase (Bilton, 2014). These reports, publicly available in PDF format at https://www.predictiveservices.nifc.gov/intelligence/archive.html, were processed with custom Python scripts to extract both structured and semi-structured data. Quantitative metrics typically presented in tables (e.g., burned acres, personnel assigned, cost to date) were extracted using the tabula-py library, a tool specifically designed for parsing tabular data from PDF files. Geographic and Demographic Information: The incident dataset was supplemented with demographic and geographic variables. County-level population data for California were drawn from the U.S. Census Bureau's American Community Survey (ACS) 2020–2024 5-Year Estimates, available at https://data.census.gov/profile?q=United%20States&g=010XX00US_040XX00US06. The initial reported location of each wildfire, often reported in descriptive text (e.g., “10 miles NE of Anytown”), was extracted using a dedicated script based on the Pdfminer.six library. This script scanned the raw page text, isolating blocks containing the keywords “mile” or “miles” to identify relevant proximity descriptions. These location strings were then programmatically submitted as queries to the Google Maps Geocoding API to retrieve approximate geographic coordinates. A reference dataset containing the geographic centroid coordinates for all U.S. Metropolitan Statistical Areas (MSAs) was also obtained from the Census Bureau. We then employed the Geopy Python package to calculate the Euclidean distance from each fire's location to every MSA centroid, thereby identifying the nearest MSA for each incident. The final analysis incorporates the population of the nearest MSA, its coordinates, the fire's approximate coordinates, and the computed Euclidean distance. The script for this location extraction process is provided in Appendix A of the E-Companion. Twitter Data: Twitter was rebranded as X in 2023, but our dataset spans 2007–2021, when the platform operated under its original name. For each wildfire, we constructed a search query using the official “Incident Name” listed in the NICC Incident Management Situation Reports (e.g., “Thomas Fire”) and its corresponding hashtag (e.g., “#ThomasFire”) as primary keywords. At the time of collection, these queries were executed with Snscrape, a Python package that is now largely inoperable for X/Twitter due to subsequent API changes. Each search was restricted to a fixed temporal window, beginning one day before the first official report and ending on the final report date, and retweets were programmatically excluded to isolate original content. The collected tweet text and publication dates were converted into CSV format, from which we computed the cumulative number of tweets over each incident's duration. No user-identifying information was gathered, which limits analysis of individual-level behavior. Although Snscrape is no longer viable, the methodological design remains transparent and replicable using the official X API, since it is fully documented through the keyword generation from NICC reports, the defined time windows, and the filtering criteria. Climate Data: Wildfire severity and frequency are strongly linked to drought (Littell et al., 2016; Parente et al., 2019; Westerling et al., 2003). We collected California's Drought Severity and Coverage Index (DSCI) from the U.S. Drought Monitor (USDM), which quantifies drought intensity on a scale from 0 (no drought) to 500 (exceptional drought). The DSCI is a weighted sum of the proportions of land area experiencing five drought levels, ranging from abnormally dry (D0) to exceptional drought (D4). Weekly USDM data classify geographic regions by drought level, allowing us to summarize California's drought conditions over time. The time series data tables are publicly available at https://droughtmonitor.unl.edu/DmData/DataTables.aspx.
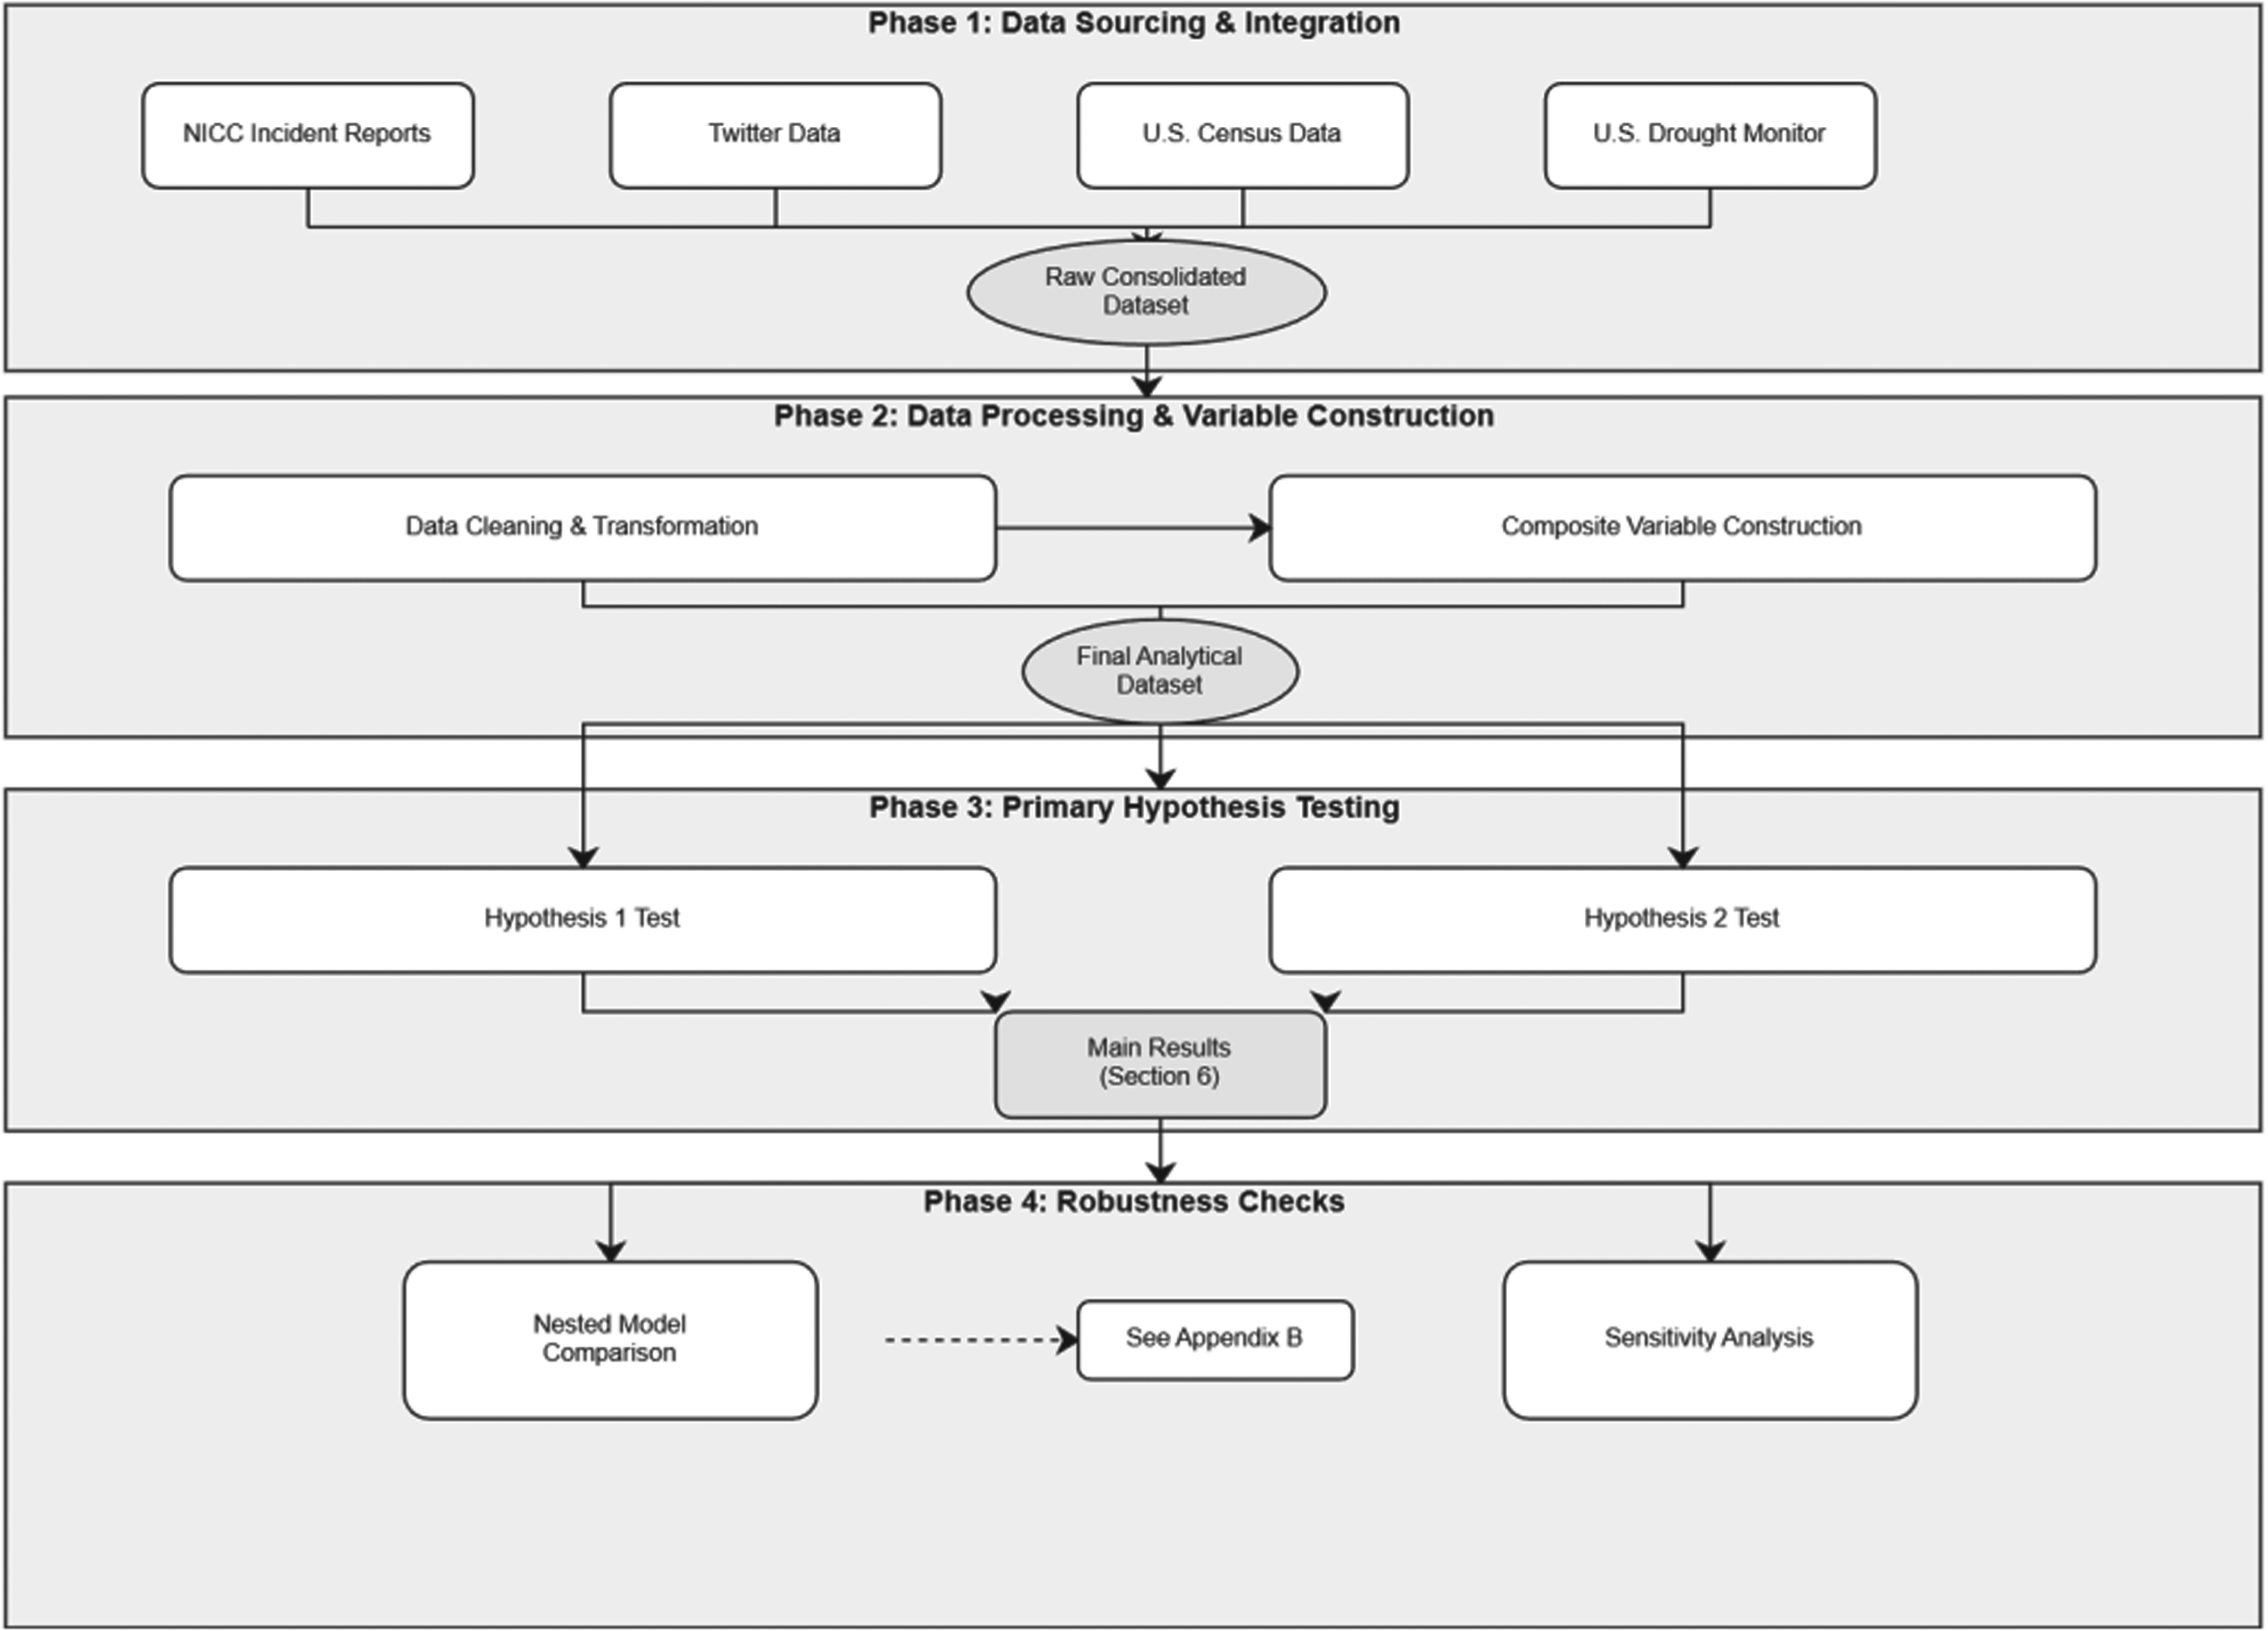
Research workflow: from data collection to hypothesis testing.
Explanations of the main variables in the consolidated dataset.
Summary statistics of main variables.
We applied robust normalization to all variables by scaling them based on the median and interquartile range, which mitigates the influence of outliers and promotes consistency across the dataset (Besseris, 2019; Chiang et al., 2003; Swallow and Kianifard, 1996). We excluded only those observations where response cost (CTD) or burn size equaled −1, as this value is used by the NICC to indicate missing or unavailable data on certain dates. Other negative values, while rare, were retained in the dataset, as their interpretation is not explicitly documented and may differ from the placeholder value of −1. IMSR reports are typically published Monday through Friday, with no reports on weekends, whereas DSCI data is issued on a weekly basis. To reconcile these temporal mismatches, we aligned the weekly DSCI records with the daily IMSR reports based on a temporal proximity principle, a concept rooted in record linkage theory (Fellegi and Sunter, 1969; Naumann and Herschel, 2010). In this case, we treated weekly DSCI values as constant throughout the corresponding IMSR reporting period, given that intra-week fluctuations in DSCI are generally minimal (Johnson et al., 2020). Applying a linear approximation method would risk overstating subtle within-week changes. Drought conditions tend to shift gradually, with significant changes in DSCI typically unfolding over multiple weeks rather than within a single week (Wanders et al., 2017). The DSCI is intended to capture broader temporal trends in drought severity (The U.S. Drought Monitor, 2017).
After completing standardization, we applied robust scaling to key variables, including the number of tweets, CTD, and the social media gravity score, using the median and interquartile range to reduce the influence of outliers and improve comparability across variables (Besseris, 2019; Swallow and Kianifard, 1996). The number of tweets was adjusted to account for changes in Twitter's user base over time. We benchmarked tweet volume to 2007 user levels and applied annual scaling factors based on estimates of Twitter user growth curves from Krutkam et al. (2010). The scaling adjustment normalizes tweet volume relative to platform usage growth by dividing the raw tweet count for each incident by an annual index of Twitter's active user numbers. Following this, we applied a robust scaling technique to standardize all continuous variables, including the gravity-related and response metrics. Each observation was scaled by subtracting the median of its variable and dividing by the interquartile range. A robust scaling approach was chosen over standard Z-score scaling due to the presence of significant outliers and high skewness in our data, characteristics for which it is particularly well-suited (Huber and Ronchetti, 2009). The robust transformation reduces the influence of extreme values by relying on robust statistics that are less sensitive to outliers (Park, 2023). Wildfire records with missing (blank or −1) or zero values for response cost or burn area were excluded. Additional observations were removed when any selected variable exceeded a robust Z-score threshold of two, a criterion applied using an outlier detection method based on the median and median absolute deviation (MAD), which is particularly stable for skewed distributions (Leys et al., 2013). CTD values were adjusted for inflation by converting them to constant 2020 dollars, a process guided by the methodology of the U.S. Census Bureau. The CPI data for this adjustment was sourced from the U.S. Census Bureau, as outlined on their website: https://www.census.gov/topics/income-poverty/income/guidance/current-vs-constant-dollars.html. The year 2020 was selected as the base year because it represents the most recent benchmark used by the Census Bureau for its latest inflation-adjusted data releases. Adopting this official, up-to-date benchmark ensures our financial figures are standardized in direct alignment with the uniform methodology applied by the U.S. Census Bureau to its own inflation-adjusted data, while also providing a stable basis that avoids distortions from the subsequent period of high inflation volatility. We also derived seasonal categories from fire start dates and encoded them numerically. The final dataset used for GEE estimation retained only complete observations across all selected variables. See Figure 2 for post-transformation distributions.
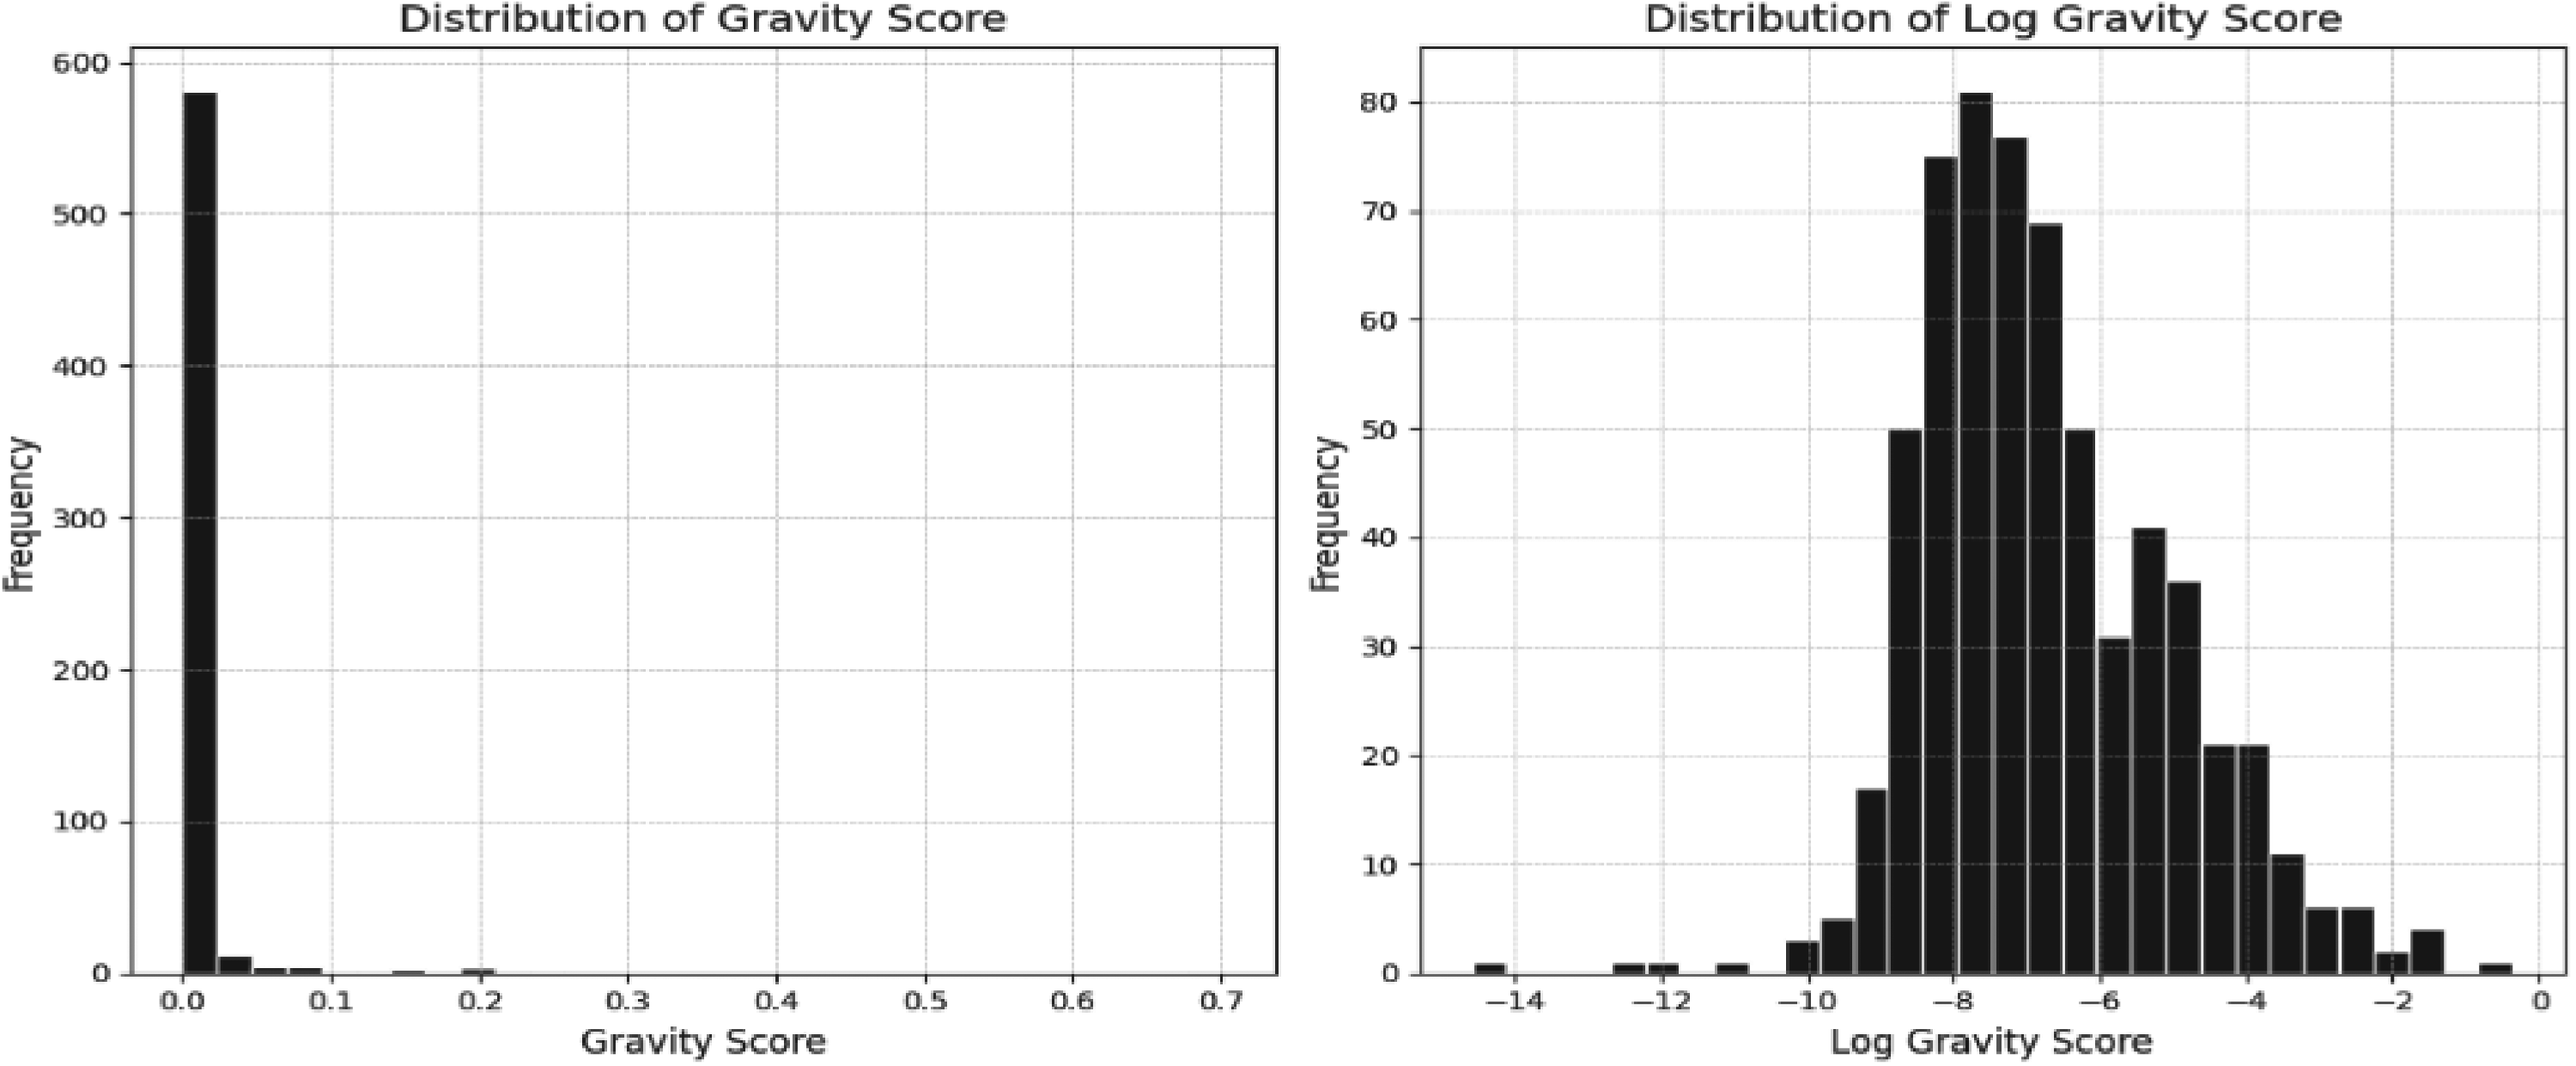
Distribution of social media gravity score.
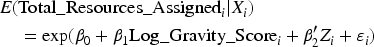
Our first hypothesis, which examines the association between social media visibility and resource allocation, is tested using the total number of personnel assigned (Total_Resources_Assigned) as the dependent variable. As this is count data, a preliminary analysis revealed significant overdispersion, a condition where the data's variance is substantially larger than its mean, which can lead to inaccurate estimates (Lokonon and Kakaï, 2018). We therefore apply a negative binomial generalized linear model (GLM). This model is specifically designed for overdispersed count data, as it introduces a dispersion parameter to account for the extra variability and provide more reliable coefficient estimates (Jeong, 2012). The model includes the log-transformed gravity score (Log_Gravity_Score) as the primary independent variable, alongside key controls such as drought severity (DSCI) and initial fire size. Prior to model fitting, variance inflation factors (VIFs) were examined to confirm the absence of significant multicollinearity. As a supplementary non-parametric analysis, a Kruskal-Wallis test was also conducted. For this test, wildfires were categorized into three groups based on the 30th and 85th percentiles of their Log_Gravity_Score. A Dunn's post-hoc test was then used for pairwise comparisons between these groups, with p-values adjusted for multiple testing.
In the second phase of our analysis, we test our second hypothesis, which posits an association between a higher social media gravity of a wildfire and a reduction in per-acre response costs, by applying generalized estimating equations (GEEs). We selected GEE for its flexibility in accounting for clustering in the data across time and location, its robustness in handling non-normal outcomes, and its ability to produce consistent estimates even when the true intra-cluster correlation departs from the working assumption (Fotuhi et al., 2023; Overall and Tonidandel, 2004). The outcome variable is the per-acre response cost. To address its positive skewness, our GEE model specifies a Gamma family with a log link function, so the dependent variable is not log-transformed before estimation (Altun et al., 2021; Manning et al., 2005). The raw tweet counts exhibited significant zero-inflation, a common issue in social media data; we therefore applied a two-stage hurdle model to generate an adjusted tweet count variable (Num_Twt_Adj) for all subsequent analyses (Kassahun et al., 2014). A summary of the hurdle model results is provided in Appendix C of the E-Companion. Following this adjustment, our preprocessing also included a multi-variable screening for outliers, where entire observations were excluded if key variables met a standard Z-score threshold of two (Huber and Ronchetti, 2009). All predictors then enter the model in standardized form using robust scaling, a technique where each observation is centered by the median and divided by the interquartile range (IQR), as this approach is less sensitive to outliers and skewness (Huber and Ronchetti, 2009). Dates are converted into a four-category seasonal indicator (Winter = 0, Spring = 1, Summer = 2, Fall = 3). Clustering is defined at the fire-incident level (wildfire_id), the working correlation is set to independence for numerical stability, a choice that still yields consistent coefficient estimates when paired with the robust sandwich standard errors used for inference (Zorn, 2001). Incident clusters with a single observation are removed prior to analysis to prevent mathematical degeneracy in the calculation of robust standard errors (Cameron and Miller, 2015). The mechanism through which social media visibility is associated with costs is specifically tested by comparing two versions of the GEE model: one with and one without the Personnel_Total × Gravity_Score interaction term. This comparison allows us to examine whether the gravity score's association with costs is direct or moderated by resource allocation. The mean absolute error (MAE) is used as an objective measure to assess and compare the performance of these model specifications. The full specification of our GEE model, including the mathematical formulation and all variables, is detailed in Appendix B of the E-Companion.
Robustness checks
The robustness of our findings is assessed through three additional analyses, with detailed results for all presented in Appendix D of the E-Companion. First, we conducted a rolling time-window sensitivity analysis to ensure our findings are not driven by a specific period within our 2007–2021 sample. This procedure involved re-estimating our main GEE model on a series of overlapping 4-year periods, advancing one year at a time, to track the temporal stability of our key Personnel_Total × Gravity_Score interaction term coefficient. Second, a nested GEE model comparison is performed to validate the superior information value of our composite Gravity_Score over simpler, disaggregated metrics. This involves specifying and comparing a set of four nested models (a baseline, a raw tweet volume model, our main composite model, and a full model) and evaluating their performance using the Quasi-likelihood under the Independence model Criterion (QIC). Third, we conduct an exploratory content analysis using large language models (LLMs) to examine the nature of our input data. For this check, a sample of tweets is classified into distinct categories (e.g., evacuation alerts vs. general observations) to better understand the composition of the social media signal and ensure it reflects broad public attention rather than narrow institutional alerts.
Model specification
Our test of H1 employs a negative binomial GLM, specified as follows:
Our test of H2 uses GEE with a Gamma family and log link. The model includes an interaction term:
Methodological limitations
Several limitations should be considered when interpreting our findings. First, this study identifies a statistical association but does not establish a definitive causal relationship. A key challenge is the potential for endogeneity, where fire characteristics, public attention, and response efforts are deeply intertwined. For instance, larger fires are more likely to approach population centers, simultaneously increasing both their social media visibility and the operational response. Our gravity score model attempts to structurally account for some of these dynamics by incorporating distance and population, and our analytical models further control for a wide range of observable fire and climatic factors. While we also explored instrumental variable (IV) approaches, data limitations prevented us from identifying sufficiently strong instruments to fully confirm causality. We therefore interpret our findings as strong associational evidence. Second, our reliance on Twitter data introduces potential biases related to the digital divide, as users are not a representative sample of the general population, and vulnerable communities may be underrepresented. Our analysis is limited to tweet-level content, as Twitter's data policies and API restrictions prevent the large-scale collection of user-level demographic information needed to systematically assess this bias. Finally, our study lacks direct operational data on agency decision-making processes, meaning the composite score does not reflect how responders directly use social media information. As such, the score is not intended to replace existing operational data but rather to complement it by providing a data-driven input for modeling and anticipating the operational pressures that accompany heightened public attention.
Results
This section presents the empirical associations related to our two core hypotheses and links them to the ongoing debate on heuristic decision-making in operations management. Our findings show a significant positive association for H1 but indicate a more nuanced, conditional relationship for H2. Specifically, the results from a negative binomial GLM (Table 3) indicate that wildfires with higher social media visibility are associated with a greater deployment of unit resources. This finding is further corroborated by supplementary non-parametric analyses (Table 4). In contrast, the results from our GEE model (Table 5) do not support the hypothesized reduction in per-acre response costs. Instead, our analysis identifies a significant interaction term, visualized in Figure 3, showing that a higher social media gravity score, when combined with high levels of resource allocation, is associated with higher per-acre costs. The robustness of these core findings is confirmed through a series of three additional analyses. These include a rolling time-window sensitivity analysis, a nested GEE model comparison, and an LLM-based content analysis, with the detailed procedures and results for all three checks provided in Appendix D of the E-Companion. The subsequent sections detail these model-specific findings and discuss their potential implications for operational efficiency and behavioral bias.
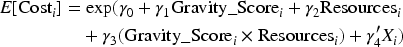
Kruskal-Wallis and Dunn’s test results.
Kruskal-Wallis and Dunn’s test results.
***, **, and * indicate statistical significance at the 1%, 5%, and 10% levels, respectively.
Negative binomial regression.
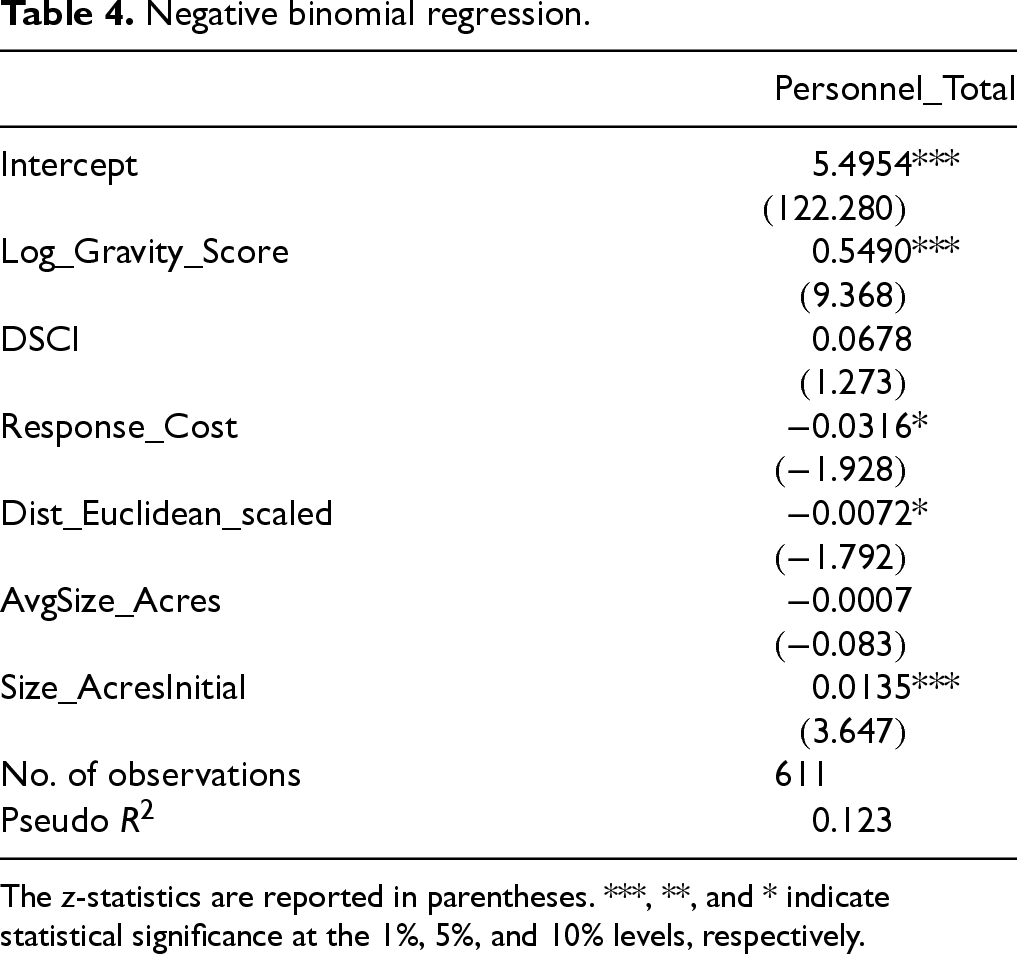
The z-statistics are reported in parentheses. ***, **, and * indicate statistical significance at the 1%, 5%, and 10% levels, respectively.
GEE model summary: Response_Cost_per_Acre.
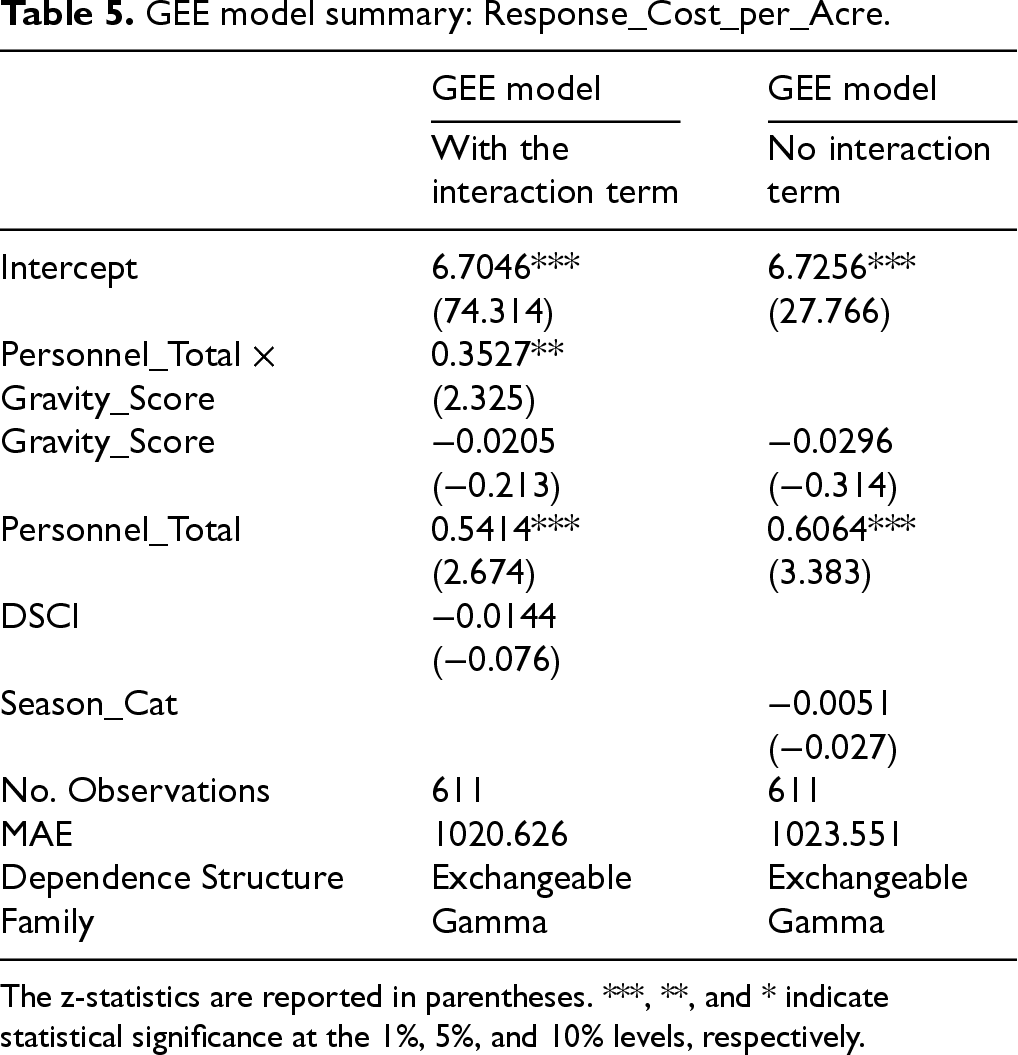
The z-statistics are reported in parentheses. ***, **, and * indicate statistical significance at the 1%, 5%, and 10% levels, respectively.
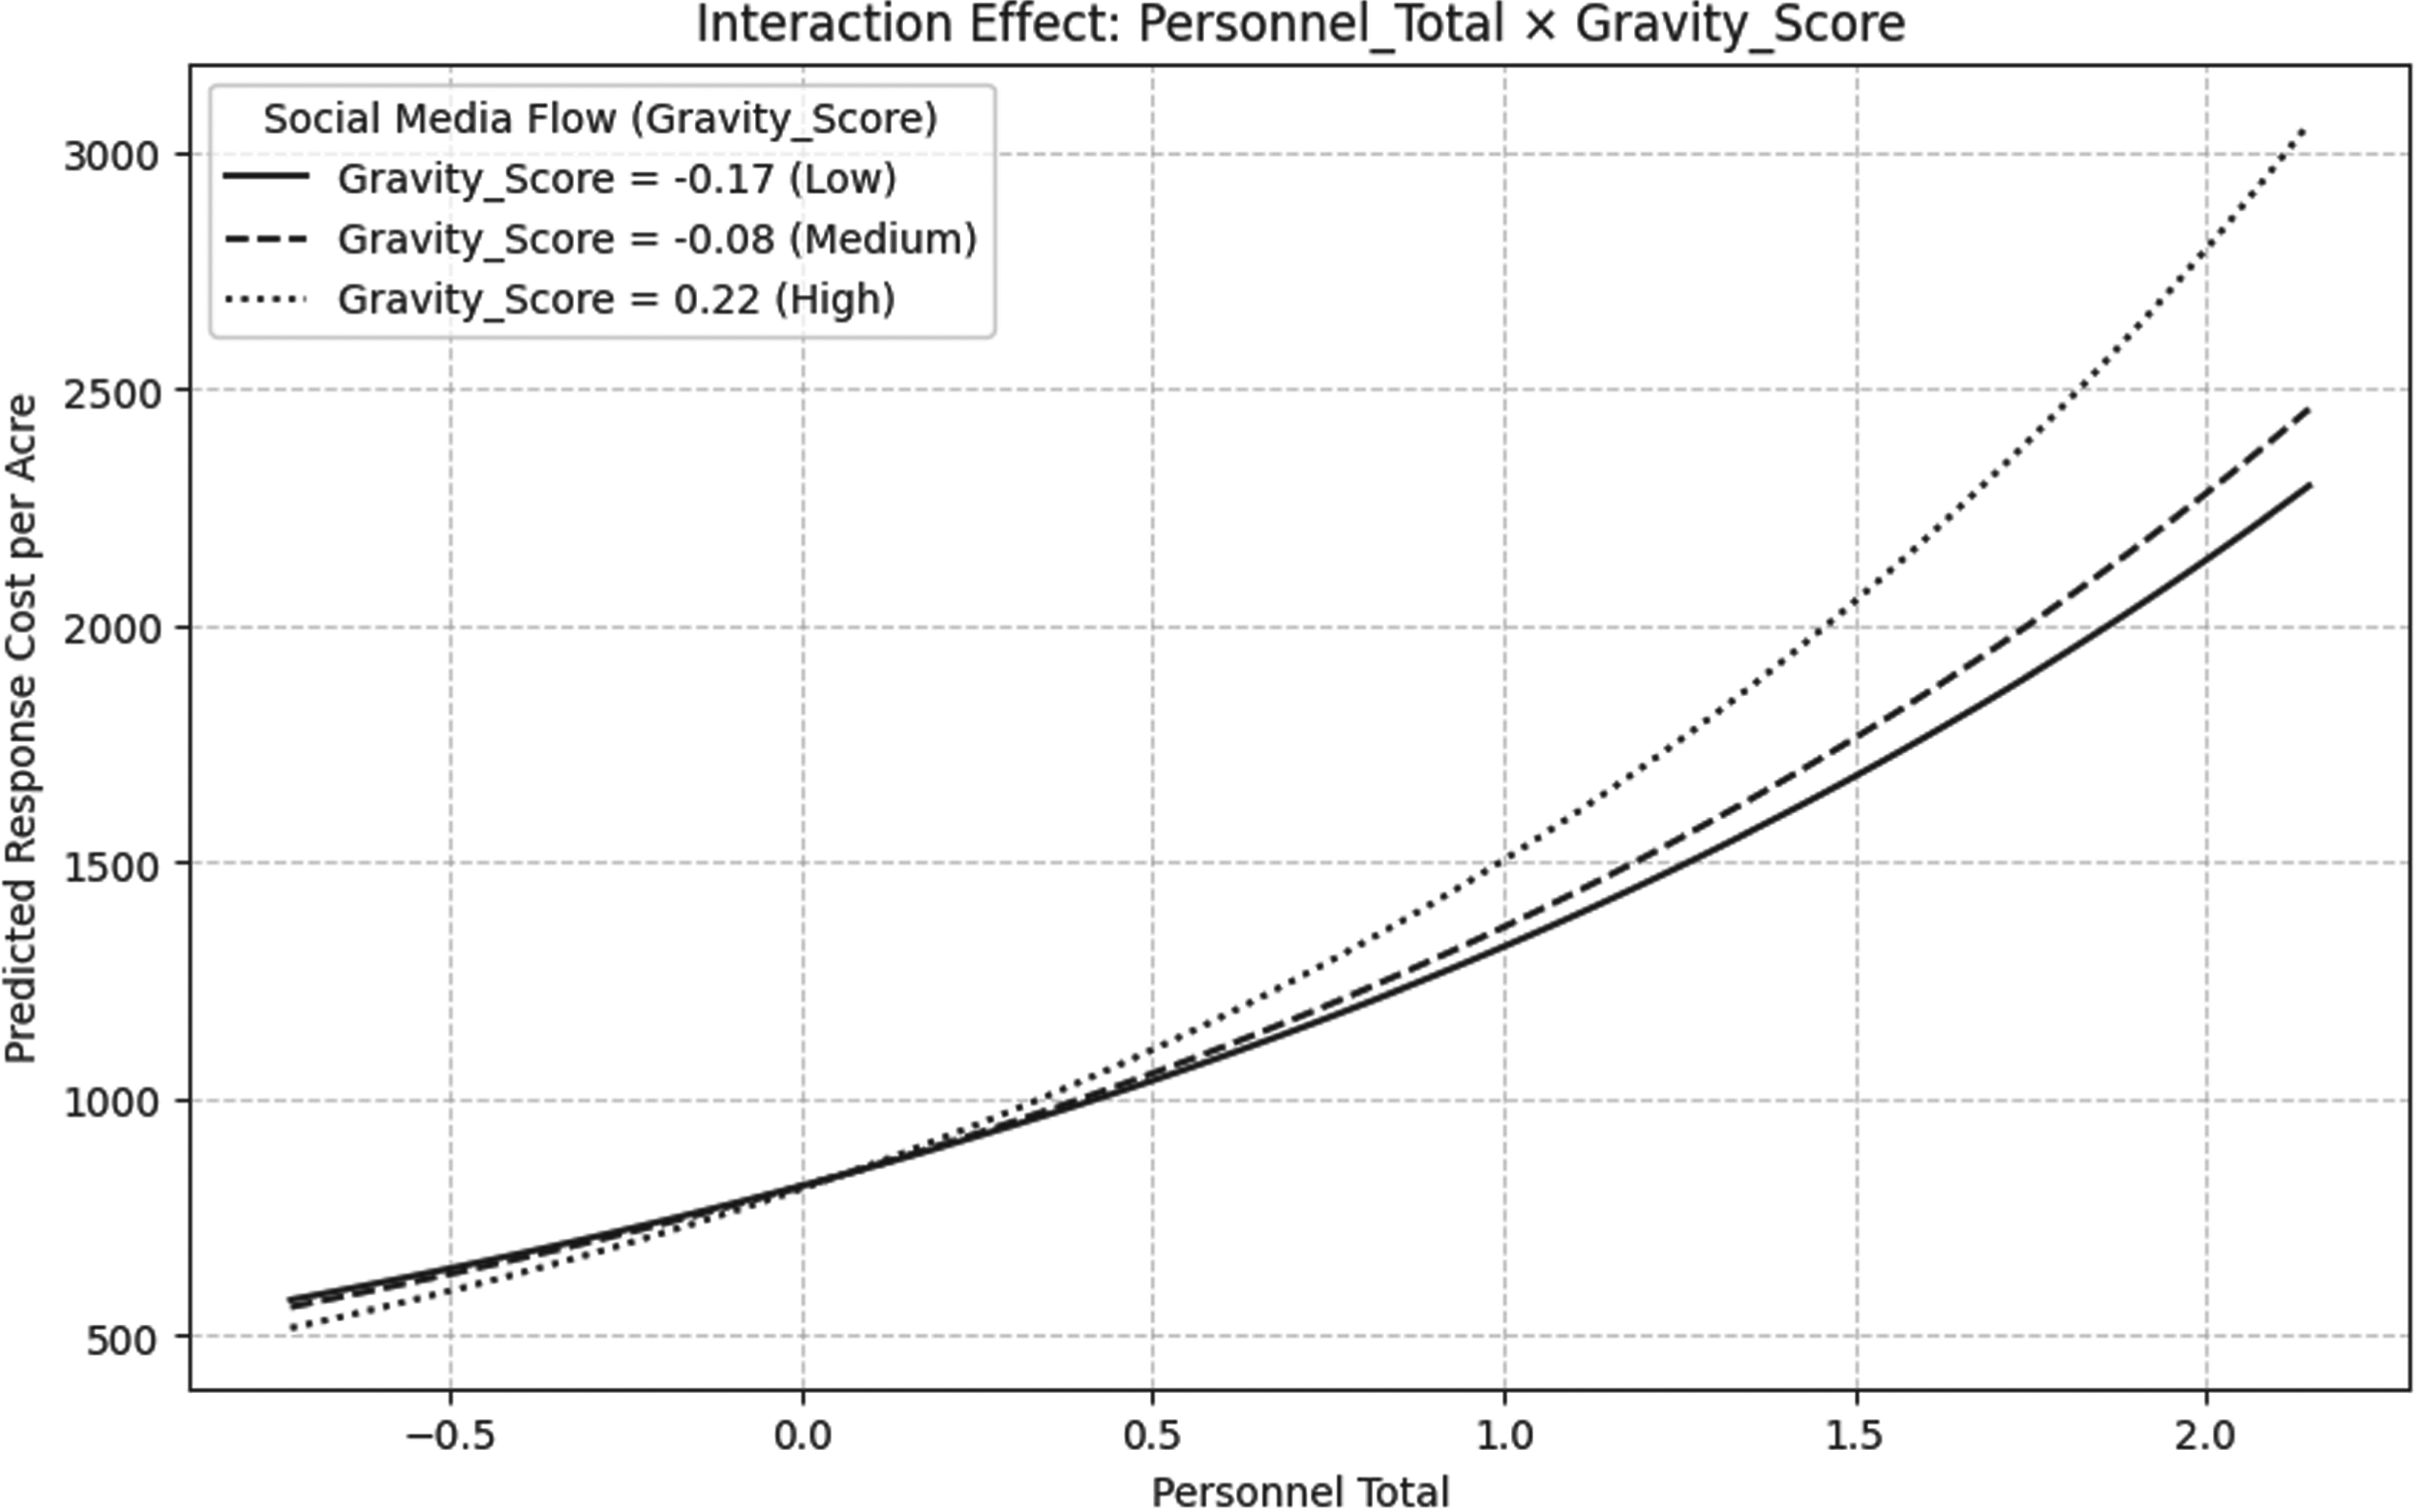
Visualization of the interaction effect.
H1 posits that higher social media visibility is associated with greater resource deployment. We test this using a negative binomial GLM with Total_Resources_Assigned as the dependent variable. Table 4 confirms strong support for H1: the coefficient for Log_Gravity_Score is positive and highly significant (β = 0.549, p < 0.001), indicating that even after controlling for physical fire characteristics, higher visibility correlates with larger resource allocations. This finding is further corroborated by supplementary non-parametric analyses (Table 3), which show a significant escalation in resource commitment across low, medium, and high visibility groups (H = 65.69, p < 0.001).
These results (Tables 3 and 4) empirically validate the behavioral premise that decision-makers leverage salient visibility cues as heuristics for prioritization (Altay and Green, 2006; Cui et al., 2018). Our analysis indicates that social media functions as a potent mobilization signal, associated with a heightened intensity of resource dispatch (Choi et al., 2023; Ivanov et al., 2023). This strong linkage is consistent with a mechanism of attention-driven responsiveness, where operational decisions align closely with perceived public urgency. From a managerial perspective, while social signals offer value for rapid awareness, agencies must remain vigilant against potential over-response bias, ensuring resource allocation patterns do not diverge from physical necessity due to external pressure (Tokar et al., 2016).
Efficiency contingency and mechanism test (H2)
H2 hypothesized that higher visibility would be associated with reduced per-acre costs (greater efficiency). We test this using a GEE model that incorporates a Personnel_Total × Gravity_Score interaction term to capture the joint effect of resource intensity and public attention. As detailed in Table 5, the interaction model demonstrates a lower MAE of 1020.6 compared to 1023.6 for the model without the term, indicating better predictive performance and justifying its use for inference.
The results presented in Table 5 do not support the simple efficiency gain predicted in H2, as the main effect of Gravity_Score is statistically insignificant. Instead, the analysis shows a significant positive coefficient for the interaction term (β = 0.353, p < 0.05), uncovering a more complex contingency mechanism. Figure 3 visualizes this effect, showing that at low resource levels, visibility has little association with cost efficiency. However, as resource commitment increases, high social visibility is associated with a progressively steeper increase in per-acre costs.
This interaction effect identifies a boundary condition in visibility-driven decision-making. The pattern suggests that while visibility signals are benign at low intensity, they are associated with higher costs when coupled with large-scale resource deployments. This finding is consistent with the “over-response” mechanism discussed in behavioral operations, where high-pressure feedback loops are linked to operational inefficiencies due to coordination complexity or decision bias (Choi et al., 2023; Tokar et al., 2016). Specifically, the spotlight effect of social media appears to coincide with resource patterns that diverge from cost-efficiency goals (Ibanez et al., 2018). For managers, this finding serves as a strategic warning: high-visibility incidents may warrant stricter cost-control protocols to mitigate the potential risk of efficiency loss associated with high public attention.
Robustness of findings
The robustness of our primary findings was assessed through three additional analyses, with detailed procedures and full results for all checks presented in Appendix D of the E-Companion. First, we conducted a true rolling time-window sensitivity analysis to ensure our findings are not artifacts of a specific era. For this test, we re-estimated our main GEE model on overlapping 4-year periods, confirming that the positive coefficient for the interaction term is a persistent directional feature of the data (Figure D1 in the E-Companion). Second, a nested GEE model comparison validates the informational value of our composite Gravity_Score. This analysis compared four model specifications (a baseline, a model with raw tweet volume, our main composite model, and a full model) and found that the model using only our composite score yielded the most favorable fit, as measured by the QIC. Third, an exploratory content analysis using LLMs confirms that our social media data reflects broad public attention. The classification of a tweet sample into distinct categories (e.g., evacuation alerts vs. general observations) revealed that a small share of messages were institutional alerts, supporting our interpretation of the gravity score as an indicator of public attention rather than formal warnings. Collectively, these checks increase our confidence in the stability and validity of our main findings.
Discussion
Our findings indicate an operational tension in disaster response. The empirical analysis shows two distinct patterns. First, social media visibility functions as a mobilization accelerator, meaning it is consistently associated with a higher intensity of resource deployment, as indicated by the statistically significant positive coefficients in Table 3. Second, however, social media visibility also coincides with efficiency losses under high-resource loads, as suggested by the significant interaction effect in Table 5 and Figure 3. This dual role points to a paradox where visibility signals are linked to both rapid mobilization and potential behavioral distortions. We interpret these robust associations through the lens of behavioral operations. The following sections will first discuss how these findings contribute to the theoretical debate regarding heuristic decision-making. We then detail managerial frameworks, including reverse audits and strategic decoupling, which are designed to mitigate the risks associated with salience bias.
Theoretical contributions
Our primary theoretical contribution is to provide empirical evidence for the debate regarding heuristic decision-making in disaster operations. Prior research has identified that in high-uncertainty environments, decision-makers tend to base their prioritization decisions on salient signals (Altay and Green, 2006; Cui et al., 2018; Ivanov et al., 2023). Some argue that heuristics serve as efficient information gap-fillers, enabling rapid response when formal data is missing (Anand et al., 2023; Bo et al., 2023). Others warn that such signals trigger cognitive shortcuts, leading managers to overweight visibility at the expense of objective need, resulting in systematic bias (Tokar et al., 2016). Specifically, our finding that high visibility correlates with escalating costs only under heavy resource loads (Table 5 and Figure 3) supports the latter view, identifying resource saturation as the boundary condition where heuristics transition from enablers to stressors.
Furthermore, we contribute to the literature on the operational value of information by identifying a potential paradox in the information-efficiency relationship. Existing operations management studies typically assume that richer information facilitates better supply–demand matching and coordination (Cui et al., 2018; Yan and Pedraza-Martinez, 2019). Our results add complexity to this assumption by distinguishing between actionable signals and attention pressure. The interaction effect is consistent with a mechanism of attention mismatch, where the operational response aligns more closely with external visibility than with marginal efficiency gains. This interpretation renders alternative explanations, specifically purely demand-driven allocation, less plausible in high-resource contexts. Consequently, we extend the theory of information value by demonstrating that in high-visibility environments, the volume of social signals can become decoupled from its operational utility. This decoupling creates a scenario where the cost of responsiveness may outweigh its benefits.
Managerial insights
Our validated temporal gravity score provides managers with a dual-purpose decision-support tool to calibrate resource allocation during sustained operations. First, the score enables managers to counteract salience bias through a process we term a rolling reverse audit. Given the strong association between visibility and resource mobilization (H1), managers face a quantifiable operational risk where high-profile incidents may systematically retain resources away from less visible but equally dangerous threats. A wildfire near a major Metropolitan Statistical Area (MSA) like Los Angeles, for instance, signals intense public scrutiny that can distort prioritization (Tokar et al., 2016). Managers can leverage the updated gravity score to explicitly identify incidents with high physical risk but low social visibility. They effectively scan for neglected threats and execute a reverse audit to rebalance resources in subsequent operational periods. This strategic application converts the gravity score from a passive monitoring metric into an active de-biasing tool, safeguarding the integrity of portfolio-level resource allocation.
Second, the score functions as a trigger for managing the efficiency trap that our interaction analysis identifies. Our finding links high gravity combined with large-scale deployments to higher per-acre reported response costs (Table 5). This result identifies a specific high-risk operational zone. The IMSR reports explicitly define response cost as direct operational spending on personnel and equipment rather than property damage or asset valuations (i.e., our findings are a simple restatement of fires closer to metropolitan areas cost more because they cause more damage). When an incident enters this zone where social pressure and resource commitment are both high, the gravity score signals the need for a decoupling strategy. Specifically, we recommend that agencies should structurally separate tactical command from external communication functions in these high-pressure scenarios. This organizational safeguard helps insulate operational decision-makers from the direct intensity of public attention, allowing them to refocus on cost-effectiveness and marginal returns rather than reactive deployment (Anand et al., 2023; Bo et al., 2023). Shifting focus from resource accumulation to deployment efficiency in this manner offers a practical pathway to mitigate the cost escalation associated with the attention premium.
Policy insights
Our research informs a more structured, evidence-based policy framework for integrating social visibility into disaster governance. First, policymakers should acknowledge the attention premium inherent in high-visibility operations. Specifically, our finding that high visibility coincides with escalating costs under heavy resource loads (Table 5) identifies this efficiency loss as a quantifiable structural feature of spotlighted responses, rather than mere mismanagement. Current budget logic, which often penalizes cost overruns indiscriminately, may inadvertently discourage necessary responsiveness in socially sensitive scenarios (Thompson et al., 2018). We therefore recommend establishing a differentiated performance evaluation system. Policy guidelines could incorporate the gravity score as a context-adjustment factor during post-season audits. Under this framework, higher cost variance would be permissible for incidents with high gravity scores, recognizing the strategic necessity of maintaining social legitimacy. This approach aligns budget accountability with the reality of modern information environments, preventing the penalization of incident commanders who must navigate intense public scrutiny.
Second, the study supports a shift from ad-hoc reaction to data-informed algorithmic governance in resource allocation. Existing federal and state allocation models typically rely on lagging physical indicators, such as acreage burned or structures lost (Calkin et al., 2011; Wibbenmeyer and McDarris, 2021). Our findings indicate that social visibility is a distinct, measurable dimension of disaster complexity that drives resource mobilization. Consequently, we propose incorporating the standardized gravity score as a predictive weighting parameter in future resource allocation formulas. Integrating this social dimension into long-term planning models would allow agencies to better anticipate the resource load required for high-visibility events across different regions. Moving beyond simple physical risk assessments to a multi-dimensional allocation model promotes a more resilient and sustainable approach to managing the growing portfolio of climate-related disasters.
Conclusion
This study identifies the “Visibility-Efficiency Paradox”: a condition where high social media visibility for wildfire management is linked to resource mobilization, but the amount of resources allocated primarily due to this effect simultaneously correlates with reduced cost efficiency. In other words, our results confirm that social media visibility functions as a potent motivation for unnecessary extra resource deployment. Thus, it correlates with a quantifiable efficiency penalty as resource commitment reaches saturation levels for wildfires. This finding challenges the operational assumption that treats high visibility as a direct proxy for urgency, necessitating the expenditure of additional resources. Instead, we establish a resource saturation as the boundary condition where social signals transition from valuable inputs to potential stressors. Theoretically, our work advances the field beyond static risk assessment models and contributes a dynamic framework for understanding how heuristic signals may inform decision-making under uncertainty.
For practitioners and policymakers, our results highlight the strategic imperative of shifting from reactive dispatch to governance. We advocate for the adoption of reverse audits to identify neglected threats and decoupling strategies that help insulate tactical command from external pressure during high-visibility events. Furthermore, at the policy level, acknowledging the attention premium supports more realistic budgeting. Integrating standardized metrics like our gravity score into allocation models facilitates a transition toward algorithmic governance. These strategies collectively offer a pathway to maintain operational integrity in an increasingly transparent information environment.
Our study has limitations that define the boundaries of our claims. The reliance on Twitter data and the lack of direct practitioner validation mean our findings represent robust associations rather than proven causal mechanisms. Future research should aim to test the proposed over-response mechanism through experimental designs or granular field data. Expanding the scope to include diverse social platforms and regional contexts would further validate the generalizability of our temporal gravity model. As social technologies continue to reshape the landscape of emergency response, our work provides a foundational step toward designing resilient operations that can harness public attention without succumbing to potential distortions.
Supplemental Material
sj-docx-1-pao-10.1177_10591478261445692 - Supplemental material for Sustainable wildfire management meets social media: How virtual interaction affects wildfire response costs
Supplemental material, sj-docx-1-pao-10.1177_10591478261445692 for Sustainable wildfire management meets social media: How virtual interaction affects wildfire response costs by Garros Gong, Stanko Dimitrov and Michael R Bartolacci in Production and Operations Management
Footnotes
Acknowledgments
The authors thank the editor and anonymous reviewers for their constructive comments and suggestions. No external funding was received for this research.
Funding
The authors received no financial support for the research, authorship, and/or publication of this article.
Declaration of conflicting interests
The authors declared no potential conflicts of interest with respect to the research, authorship, and/or publication of this article.
How to cite this article
Gong G, Dimitrov S and Bartolacci MR (2026) Sustainable wildfire management meets social media: How virtual interaction affects wildfire response costs. Production and Operations Management xx(x): 1–16.
References
Supplementary Material
Please find the following supplemental material available below.
For Open Access articles published under a Creative Commons License, all supplemental material carries the same license as the article it is associated with.
For non-Open Access articles published, all supplemental material carries a non-exclusive license, and permission requests for re-use of supplemental material or any part of supplemental material shall be sent directly to the copyright owner as specified in the copyright notice associated with the article.