
Abstract
Firms are exposed to varying levels of supply chain risk and engage in efforts to resolve such risk. This paper examines how disclosures of supply chain risk and resolution during earnings calls affect firms’ stock returns. Using natural language processing, we develop measures of supply chain risk and resolution from quarterly earnings call transcripts for a total of 129,981 firm-quarter observations between 2008 and 2019. We find that higher levels of supply chain risk are associated with lower stock returns around earnings calls, while disclosures of supply chain risk resolution attenuate these negative effects. In particular, stock returns of firms in the highest supply chain risk quintile are 1.07% lower compared to the stock returns of firms in the lowest quintile, and regression analyses indicate that a one-standard-deviation increase in supply chain risk is associated with a 0.56% decline in stock returns. The stock returns of firms in the highest supply chain risk resolution quintile are 0.12% higher compared to the stock returns of firms in the lowest quintile. A one-standard-deviation increase in resolution increases stock returns by 0.08%, and to 0.29% for the subsample of observations where the resolution measure is positive. Exploratory analyses indicate that the effect of supply chain risk on stock returns is significantly greater for smaller firms than for larger firms. In addition, when there is evidence that larger firms’ resolution-related statements are mere rhetoric, the effect of resolution on stock returns is diminished.
Introduction
Supply chain risk and efforts to resolve such risks are topics of great interest to managers, investors, and a broad array of stakeholders (Kleindorfer and Saad, 2005; Lücker et al., 2024; Swink et al., 2025). Supply chain risk—broadly defined as the collection of vulnerabilities along a firm's supply chain (Sodhi et al., 2012)—potentially impacts material, information, and financial flows both between and within firms and can adversely affect firm performance (Hendricks and Singhal, 2003, 2014). Supply chain risk resolution, in turn, describes the efforts of firms and external stakeholders to reduce the exposure to supply chain risk or attenuate its adverse effects. Various strategies and tactics like dual sourcing, holding safety stocks, and information-sharing with supply chain partners can be used to mitigate supply chain risk (Christopher and Lee, 2004; Tomlin and Wang, 2011). Policymakers and regulators can contribute to resolving supply chain risks by enacting laws and promoting policies that facilitate resource access, international trade, and domestic capacity building (Jacobs et al., 2022).
Recent earnings calls and media coverage underscore the salience of supply chain risk and resolution disclosures. Firms often explicitly discuss shortages, logistics bottlenecks, and supplier failures during earnings calls, and such discussions are often accompanied by analyst questions regarding mitigation strategies (Boyle, 2021). Investors and analysts scrutinize these disclosures to assess firms’ exposure to supply chain risk and the credibility of managerial responses (Andersson et al., 2024). In turn, there is anecdotal evidence that supply chain risk and resolution-related information discussed in earnings calls generates market reactions (e.g., Mishra, 2025). These observations suggest that disclosures of supply chain risk and resolution in earnings calls represent economically relevant information that can shape investor expectations and affect market outcomes.
We examine how supply chain risk and supply chain risk resolution affect firms’ stock price performance. Prior studies of supply chain risk have mostly focused on the financial consequences of discrete disruption events (Hendricks and Singhal, 2003, 2014). Our paper differs from Hendricks and Singhal (2003, 2014) in several ways. First, Hendricks and Singhal (2003, 2014) focus on supply chain disruptions reported in the media and how such events impact firms’ stock prices. In contrast, we measure supply chain risk exposure based on the analysis of content discussed in earnings calls. Earnings calls are a suitable source of information as firms regularly hold such calls to communicate and discuss relevant information on the firm's current and future performance (Loughran and McDonald, 2011; Matsumoto et al., 2011; Suslava, 2021). In these calls, firms often disclose and discuss actual or prospective supply chain-related concerns that may impact their operations, thus offering a basis for a broader assessment of varying degrees of supply chain risk. Hence, our research is rooted in the recognition that supply chain risk is not limited to publicly documented disruption events and can manifest itself in different forms and intensities not captured in previous research. Second, in contrast to Hendricks and Singhal (2003, 2014), we create a measure of resolution based on earnings calls and link it to stock market reactions. Previous work has examined firms’ efforts to mitigate the effects of supply chain disruptions (Ho et al., 2015) and documented how organizational slack and regulatory control system requirements, for example, alleviate the negative effects of supply chain disruptions (Hendricks et al., 2009; Schmidt and Raman, 2022). However, research has not yet assessed firms’ broader supply chain risk resolution and its effects on relevant outcomes. Third, we estimate and update the supply chain risk and resolution measures for a firm on a quarterly basis over a multi-year period, which is different from Hendricks and Singhal (2003, 2014), who focus on a few days around the announcement of a particular supply chain risk event. In sum, this study examines the effects of measures of supply chain risk and its resolution on firms’ stock price performance.
Our research adds to the fast-growing stream of literature that relies on the analysis of textual sources to measure constructs that are otherwise difficult to quantify. Similar to previous studies of political risk (Hassan et al., 2019), geopolitical risk (Caldara and Iacoviello, 2022), climate risk (Sautner et al., 2023), and supply chain risk (Wu, 2024), we analyze firms’ earnings call transcripts to assess content related to supply chain risk and supply chain risk resolution via natural language processing. In particular, this study builds on Wu's (2024) work on supply chain risk but is also different from it in several ways. First, the keywords used to create our risk measure are broader than the supplier-side (or upstream) keywords used by Wu (2024) and include customer-side (or downstream) terms. Second, Wu (2024) documents the link between his supply chain risk metric and stock return volatility. In contrast, we focus on how supply chain risk affects stock returns. Third, we not only examine supply chain risk but also create a measure of supply chain risk resolution and evaluate the differential effects of risk and resolution on stock returns.
Our empirical analyses, based on a dataset of 129,981 firm-quarter observations drawn from quarterly earnings calls and various archival data sources for the 2008–2019 period, show that higher levels of supply chain risk disclosed during earnings calls are associated with significantly lower stock returns, whereas disclosures of supply chain risk resolution mitigate these negative effects. We find that the stock returns of firms in the highest supply chain risk quintile are 1.07% lower compared to the stock returns of firms in the lowest quintile. Regression analyses indicate that a one-standard-deviation increase in supply chain risk is associated with a 0.56% decline in stock returns. Furthermore, we find that the stock returns of firms in the highest supply chain risk resolution quintile are 0.12% higher compared to the stock returns of firms in the lowest quintile. Regression analyses suggest that a one-standard-deviation increase in resolution increases stock returns by 0.08%, and by 0.29% for the subsample of observations where the resolution measure is positive. However, when there is evidence that larger firms’ resolution-related statements are mere rhetoric, the effect of resolution is diminished. We further explore how these relationships vary with relevant firm characteristics like firm size, institutional ownership, analyst coverage, a firm's position in the supply chain (upstreamness), foreign sales, and time. We find that the negative stock returns to supply chain risk disclosures are significantly greater for smaller firms than for larger firms. We do not, however, find evidence of significant moderating effects for the other contingencies.
This study contributes to extant literature in several important ways. First, we advance the supply chain risk management literature by developing replicable measures of firm-level supply chain risk and supply chain risk resolution, which can be used to facilitate empirical research that goes beyond the study of discrete, materialized supply chain risk events. Second, we add to prior text-analytic risk research (e.g., Hassan et al., 2019; Sautner et al., 2023; Wu, 2024) as we explicitly differentiate between supply chain risk and supply chain risk resolution. The latter construct represents a conceptual advancement in supply chain and operations management literature. Third, we differentiate between resolution that tends to result in lower subsequent supply chain risk and resolution that seems to have no such effect. In the latter case, resolution claims may be rhetorical rather than substantive. We explore how and when the use of rhetoric undermines the expected effect of resolution on stock returns. Fourth, we depart from previous text-based risk studies (Baker et al., 2016; Hassan et al., 2019; Wu, 2024) by investigating the effects of risk and resolution on stock returns. Finally, we explore how these effects vary as a function of firm size, institutional ownership, analyst coverage, upstreamness, foreign sales, and time.
The remainder of this paper is organized as follows. Section 2 presents a review of relevant literature. Section 3 describes the development of our measures and provides details about the data set. Section 4 presents our results, and Section 5 summarizes our findings and discusses their implications.
Background
Supply Chain Risk and Performance
Several studies have examined the topic of supply chain risk and outlined frameworks that facilitate the identification of various forms of supply chain risk (Chopra and Sodhi, 2004). Researchers have relied on in-depth case studies (Charpin et al., 2020) or surveys (Tazelaar and Snijders, 2013) to explore the consequences of risk. Other empirical work has focused on examining materialized supply chain risk in the form of discrete events on operational performance and stock returns (Hendricks and Singhal, 2003; Jacobs and Singhal, 2020; Schmidt et al., 2020). Yet, supply chain risk is an ongoing concern for firms and comes in several forms and degrees of severity (Chopra and Sodhi, 2004). Hence, there is a gap in the literature as it relates to the relationship between varying degrees of supply chain risk and firm performance.
To address this gap, we build on prior research that has relied on earnings calls as a relevant source of firm-specific information to derive firm-level measures of risk via text-analytic methods. For instance, Hassan et al. (2019) employ a pattern-based analysis of earnings call transcripts to identify political risk at the firm level. Sautner et al. (2023) similarly generate a measure of climate risk exposure. Wu (2024), using a set of supplier-centric keywords to identify and measure supply chain risk, finds evidence of a positive association with stock return volatility and inventory levels. We build on this body of work to more broadly identify and measure supply chain risk and resolution and examine their impact on stock returns.
Supply chain risk can negatively influence stock returns by decreasing a firm's present value. The present value of a firm is the sum of expected future net cash flows discounted by the cost of capital. Specifically, supply chain risk can affect both the magnitude of expected future net cash flows and the rate at which these are discounted. Greater supply chain risk can lower the expected future net cash flows by increasing the probability that higher operational costs and/or reduced revenues may materialize. Operational costs can rise due to operational inefficiencies and discontinuities, and revenues may decline due to delayed or missed sales (Wagner and Bode, 2006). An increase in supply chain risk generates uncertainty regarding future net cash flows, which increases a firm's overall risk. This is associated with higher expected returns as investors demand a premium for bearing higher risk. Holding everything else equal, higher expected returns increase the firm's cost of capital and decrease its present value. This ultimately leads to lower stock prices and, thus, negative stock returns.
Resolution of Supply Chain Risk
While supply chain risk is expected to affect firms’ stock returns negatively, efforts to resolve and mitigate such risk are expected to have a positive effect on stock returns. Several studies have described or categorized strategies and tactics to mitigate supply chain risk (Ho et al., 2015). These involve sourcing, inventory management, information-sharing, and agility (Christopher and Lee, 2004; Tomlin and Wang, 2011). Such strategies can help companies in two ways. First, they increase the robustness of operational activities to avoid the materialization of supply chain risk or mitigate its consequences. Second, they increase the resilience of companies by enabling them to return to their previous performance more quickly after the materialization of supply chain risk (Liu et al., 2016).
Empirical evidence on the relationship between supply chain risk resolution and stock returns is sparse. While not directly assessing firms’ supply chain resolution, two studies are particularly noteworthy: Schmidt and Raman (2022) study disruptions based on a sample of 1613 press releases across a 17-year period and, based on a comparison of firms that were or were not subject to regulatory control system requirements, conclude that such requirements helped reduce the negative effect of supply chain disruptions on equity risk. Hendricks et al. (2009) examine the stock market reaction of firms that experience supply chain disruptions and find support for their hypothesis that greater operational slack attenuates such adverse effects. Although prior research has discussed firms’ efforts to reduce any adverse effects in the aftermath of supply chain disruptions, there remains an opportunity to systematically quantify and empirically study supply chain resolution. To this end, we conceptualize supply chain risk resolution as a measure of the extent to which firms work to prevent, address, and resolve actual or potential supply chain risk. Such efforts can aid in preserving revenues and containing costs induced by supply chain risk. Our research assesses whether and to what extent supply chain risk resolution affects stock returns.
Data and Measurement
We use a panel data set of information extracted from firms’ quarterly earnings calls as well as corporate financial data from Compustat to analyze the effects of supply chain risk and supply chain risk resolution on firms’ stock returns. We first collected all 151,280 US earnings call transcripts from January 2008 to December 2019 that were available in the Capital IQ Transcripts database. After eliminating observations with missing data on key variables, 129,981 firm-quarter observations remain.
Measuring Supply Chain Risk
The measurement of supply chain risk is based on a content analysis of earnings call transcripts. Partly following the approach of Hassan et al. (2019) and Wu (2024), we develop the text-based measures of supply chain risk and supply chain risk resolution in a three-phase process, as shown in Figure 1.
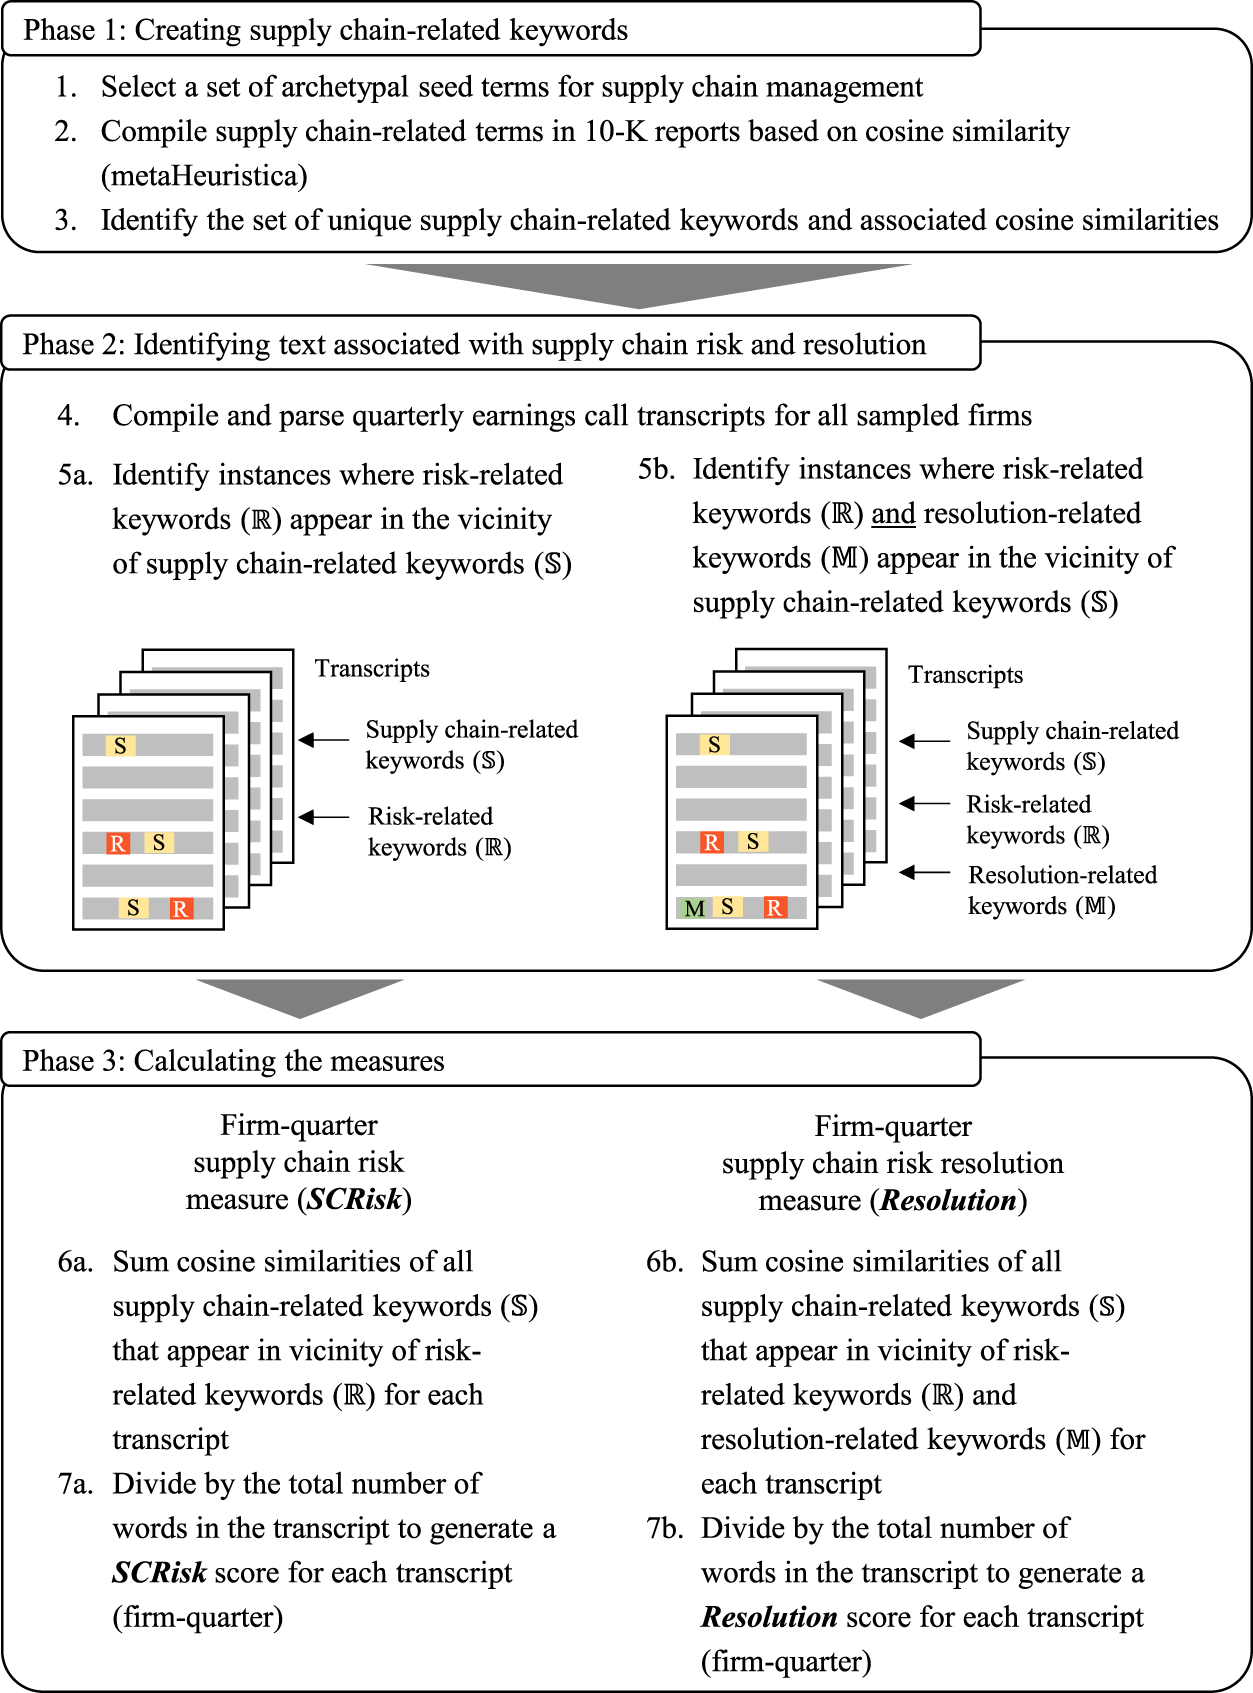
Process for generating supply chain risk and supply chain risk resolution measures.
In the first phase, we create a set of keywords that are characteristic of speech related to supply chain management. In the second phase, we identify occurrences of supply chain-related keywords near a risk-related keyword in earnings call transcripts. To measure supply chain risk resolution, we search for occurrences of supply chain-related keywords near a risk-related keyword and a resolution-related keyword. In the third phase, we calculate the supply chain risk and supply chain risk resolution scores for each firm-quarter observation by determining the respective relative intensities in each earnings call transcript. We detail the steps involved in constructing our supply chain risk and supply chain risk resolution measures in the following subsections and evaluate the sensitivity of the estimation results with respect to variations in the operationalization of these measures in Section 4.2.
In Phase 1, we generate a comprehensive set of supply chain-related keywords (
Seed terms used to develop the set of supply chain-related keywords.
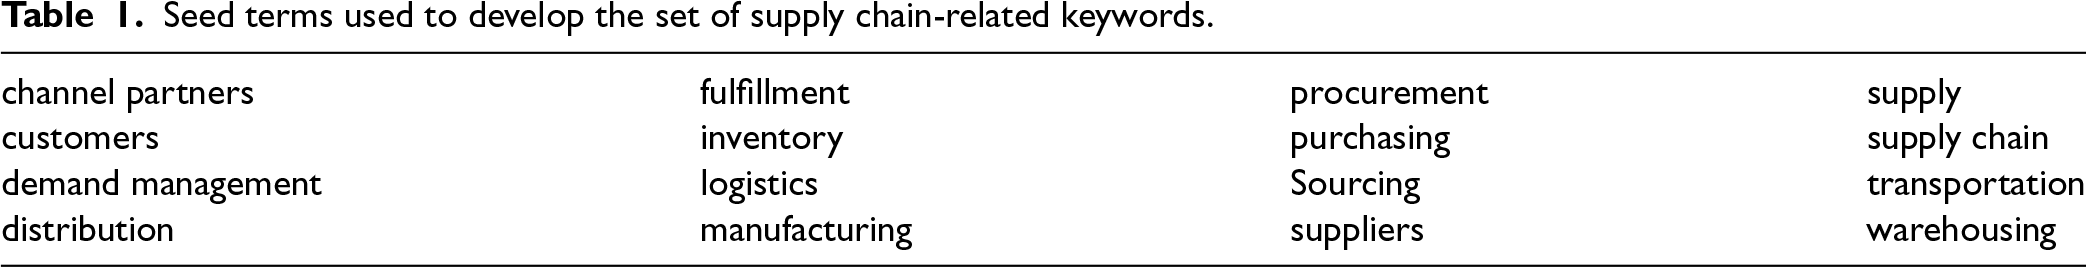
Seed terms used to develop the set of supply chain-related keywords.
Next, we scan corporate 10-K reports to identify a comprehensive list of keywords that appear in similar contexts as our seed terms and, thus, are commonly used by firms when discussing supply chain-related content. We use the services of the data science company metaHeuristica to search all 10-K reports published between 1997 and 2021. The metaHeuristica software uses natural language processing techniques to cluster terms by semantic topics based on their relative co-occurrence. For each of our seed terms, the software generates lists of 100 similar terms and associated cosine similarity scores that approximate the probability that these keywords refer to supply chain-related content (Wu, 2024). After consolidating these lists and removing duplicates as well as multi-word n-grams, this search process yields 208 unique keywords, of which 193 appeared in the transcripts of earnings calls. Table 2 reports the cosine similarity scores and frequencies of the top 30 supply chain-related keywords used to calculate our supply chain risk measure. The terms “customers,” “supply,” and “inventory” are the most frequently observed keywords with high cosine similarity, and all of the top 30 supply chain keywords clearly relate to SCM.
Frequencies of the top 30 supply chain-related keywords in the 129,981 earnings call transcripts used to calculate the supply chain risk measure, ordered by cosine similarity and frequency in the transcript.
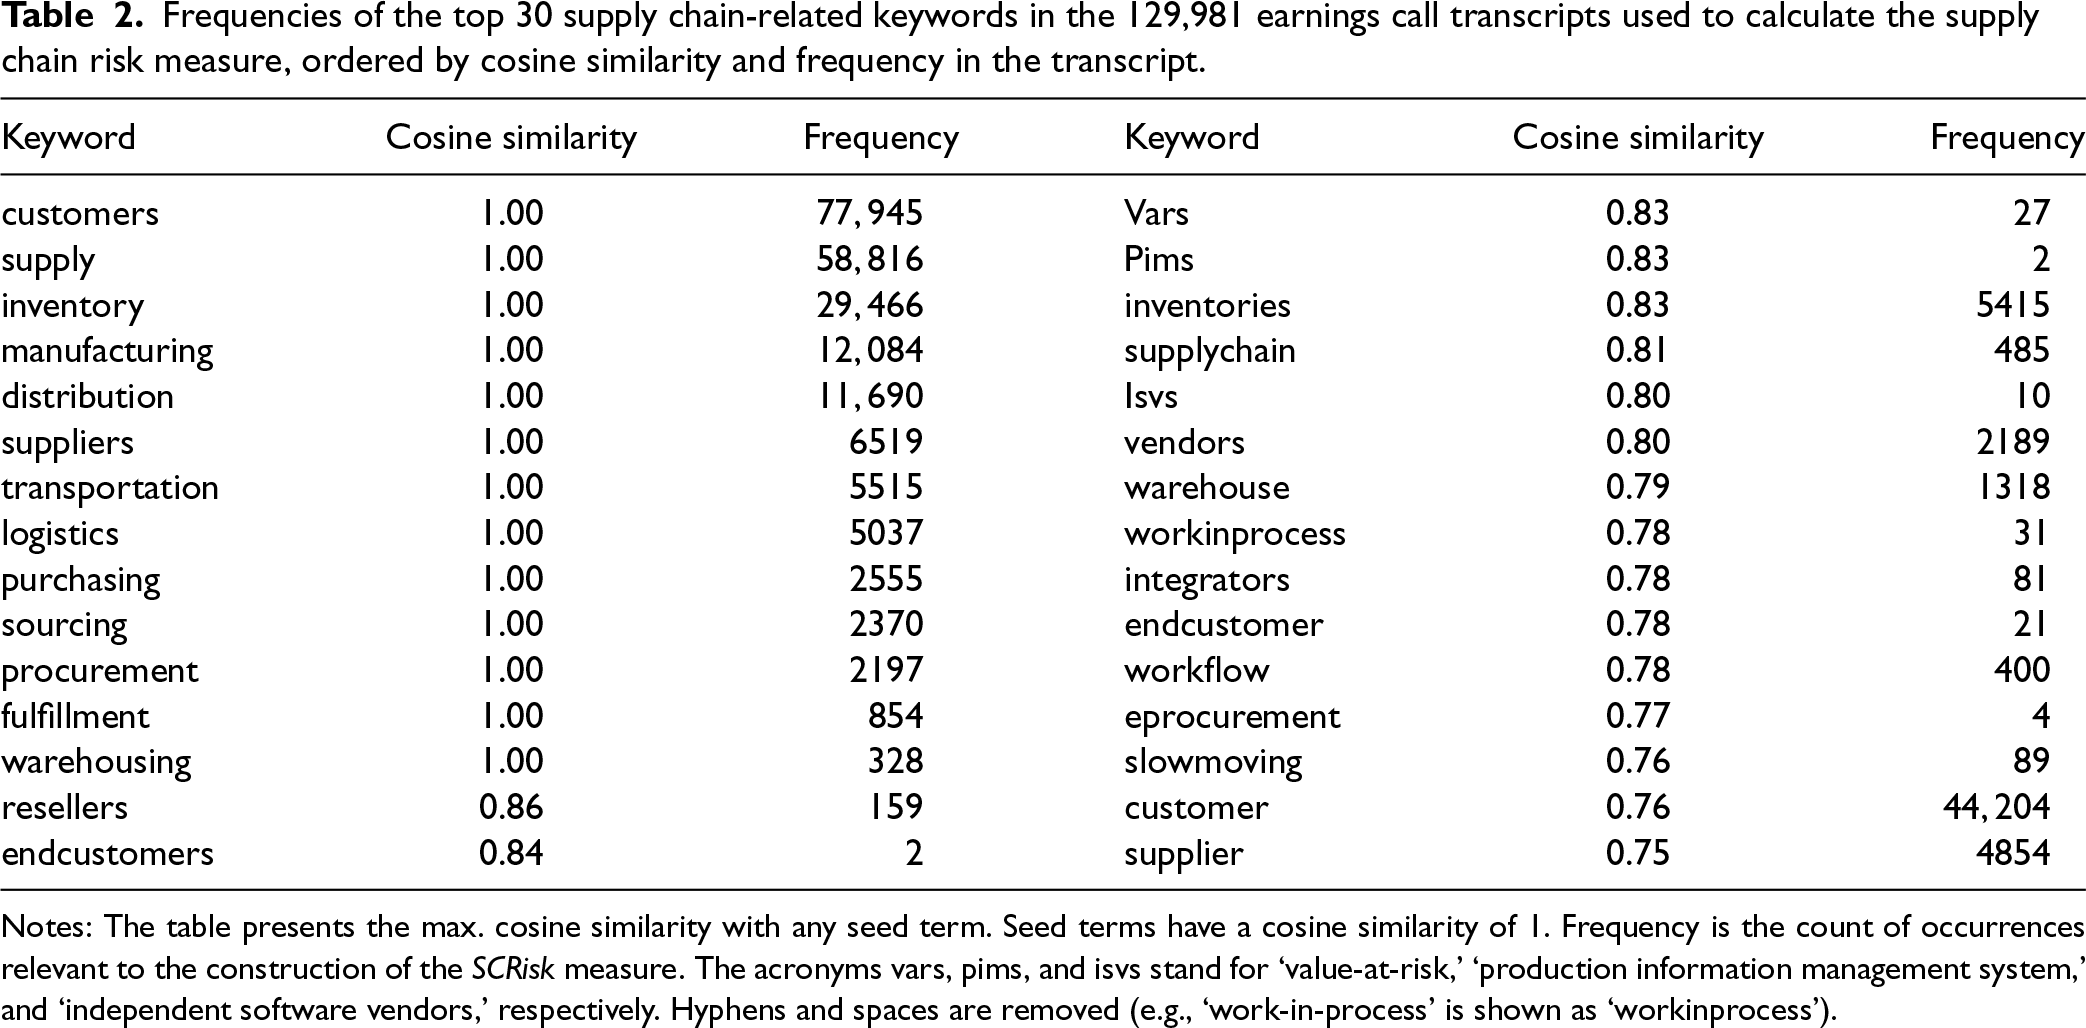
Notes: The table presents the max. cosine similarity with any seed term. Seed terms have a cosine similarity of 1. Frequency is the count of occurrences relevant to the construction of the SCRisk measure. The acronyms vars, pims, and isvs stand for ‘value-at-risk,’ ‘production information management system,’ and ‘independent software vendors,’ respectively. Hyphens and spaces are removed (e.g., ‘work-in-process’ is shown as ‘workinprocess’).
In Phase 2, we capture supply chain risk content in earnings call transcripts by identifying occurrences of supply chain-related keywords (
In Step 5a of the process shown in Figure 1, we scan transcripts for risk-related keywords within a ten-word range around
Frequency of risk keywords used in a supply chain context in the 129,981 earnings calls.
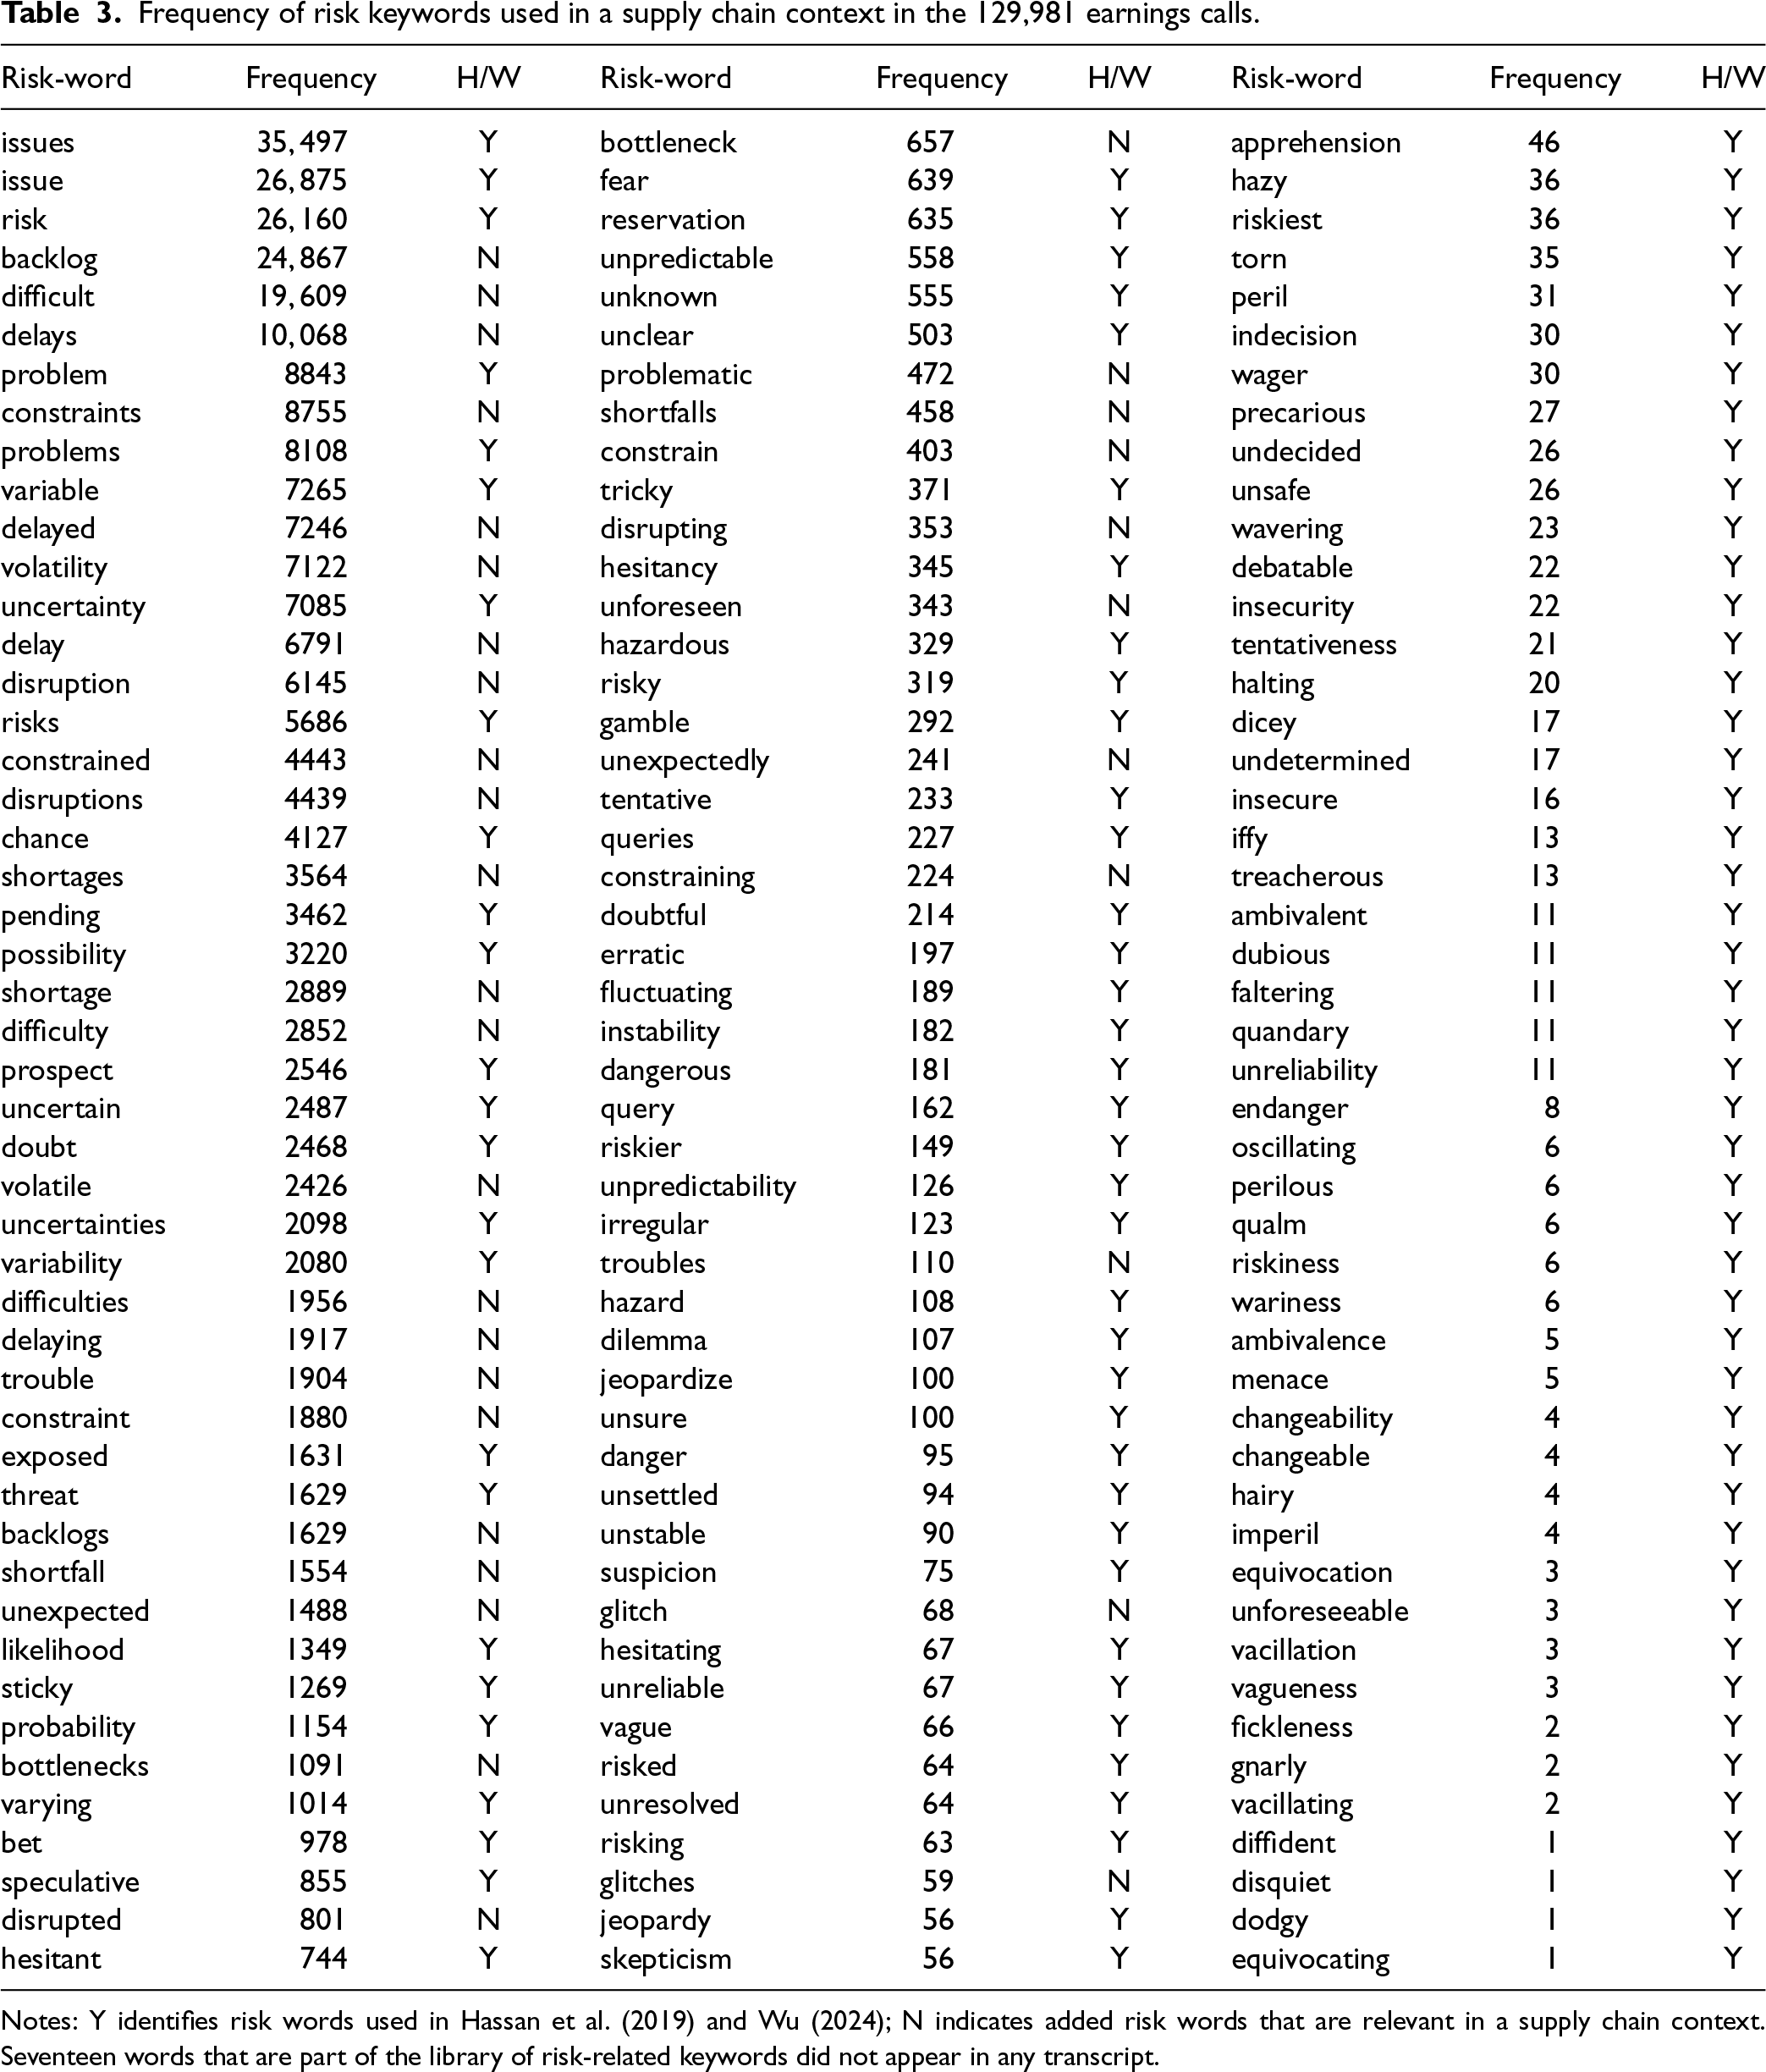
Frequency of risk keywords used in a supply chain context in the 129,981 earnings calls.
Notes: Y identifies risk words used in Hassan et al. (2019) and Wu (2024); N indicates added risk words that are relevant in a supply chain context. Seventeen words that are part of the library of risk-related keywords did not appear in any transcript.
In Phase 3, outlined in Figure 1, we calculate SCRisk′ as follows (Hassan et al., 2019):
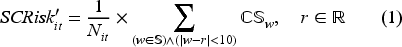
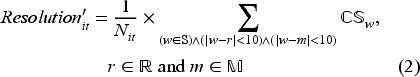
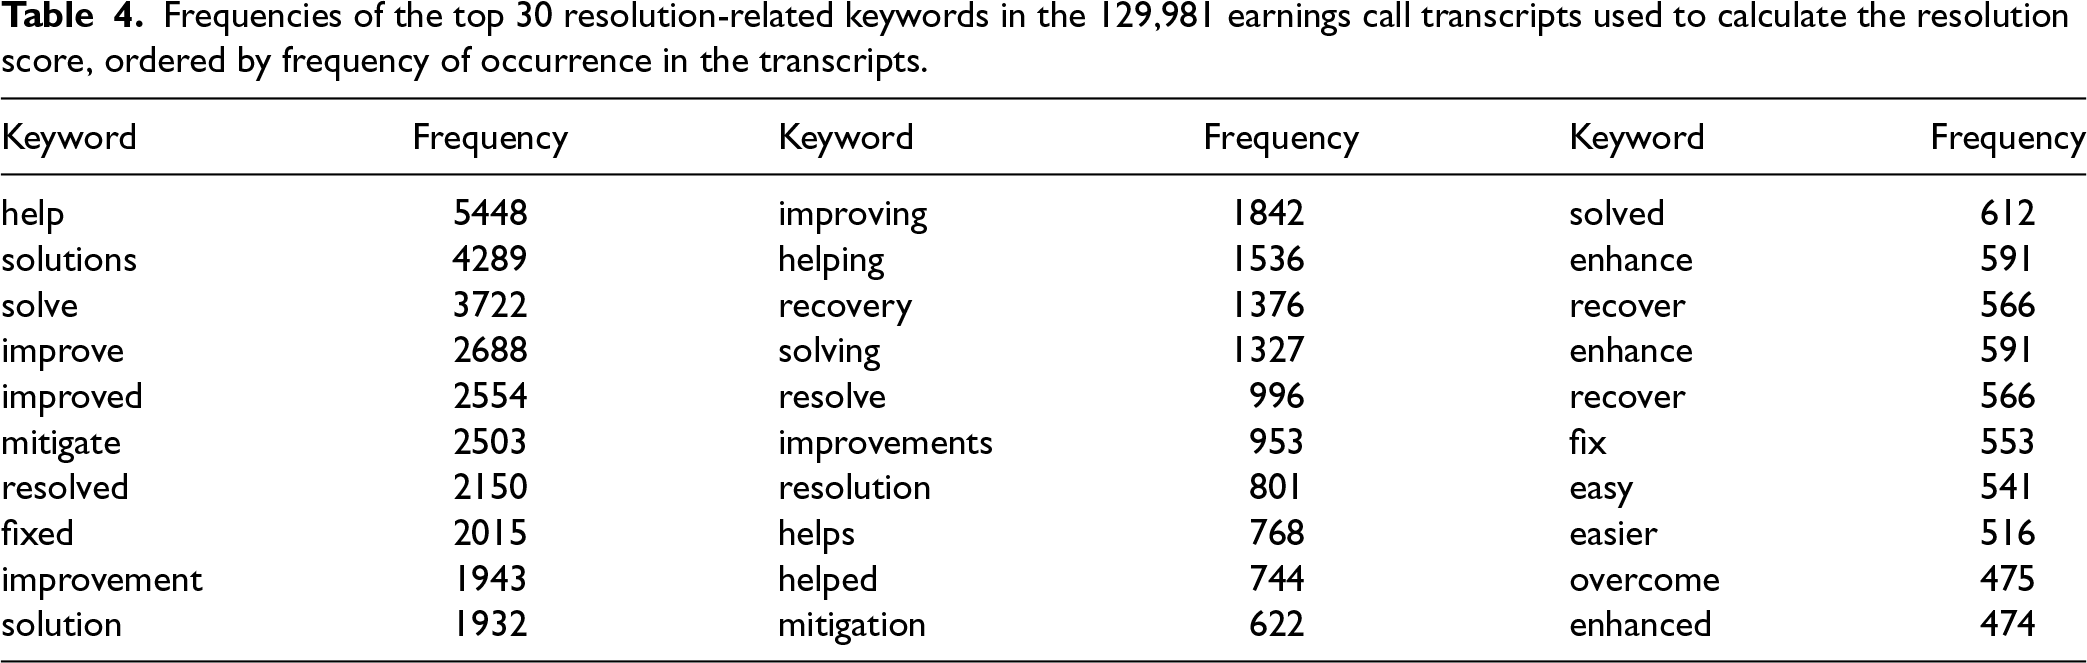
The measure of SCRiskit captures the prevalence of supply chain risk-related content in earnings calls but does not differentiate between discussions of a firm's exposure to SCRisk and efforts to mitigate or resolve such risk. For instance, firms might merely disclose how certain risk factors undermine the efficiency or effectiveness of their supply chain operations. Alternatively, firms might highlight their efforts to preempt or mitigate supply chain risk. While the term risk and its synonyms generally have a negative connotation, conversations about firms’ mitigation or resolution efforts tend to rely on positive language. We measure the extent of supply chain risk resolution using speech containing the terms mitigate and resolve, as well as their synonyms from the Oxford dictionary in the vicinity of supply chain risk-related language. The measure of supply chain risk resolution is defined as:
Frequencies of the top 30 resolution-related keywords in the 129,981 earnings call transcripts used to calculate the resolution score, ordered by frequency of occurrence in the transcripts.
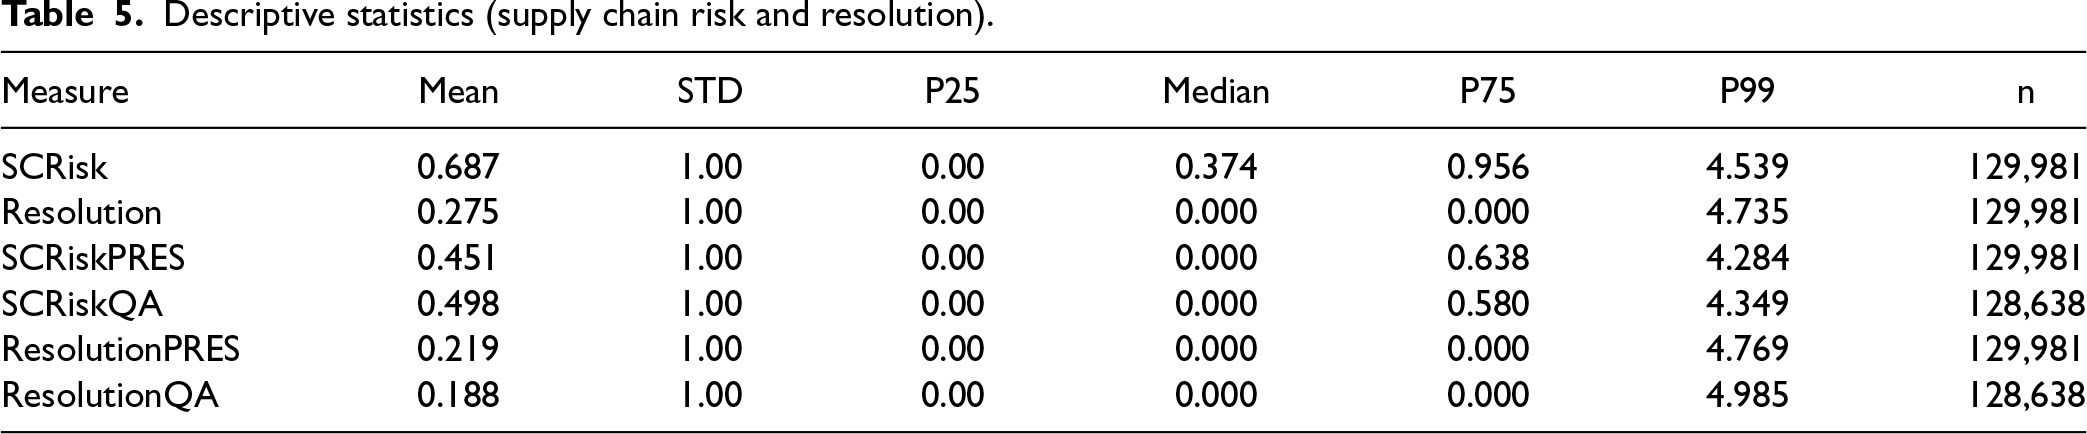
Executives may address the topics of supply chain risk and resolution in a scripted manner in the presentation portion of an earnings call (Suslava, 2021). In contrast, the question-and-answer portion allows analysts to raise or probe such topics in unscripted exchanges with the firm's officers. To account for this, we also calculate separate SCRisk and Resolution scores for the presentation (SCRiskPRES and ResolutionPRES) and question-and-answer segments (SCRiskQA and ResolutionQA) of earnings calls. The respective measures are calculated in a similar manner as discussed previously, but refer to content in the respective parts of the earnings call transcripts only.
Table 5 presents the descriptive statistics for our measures of supply chain risk and supply chain risk resolution. For all these measures, the minimum value is zero, indicating that some calls did not cover any supply chain risk or supply chain risk resolution content. The SCRisk measure has a mean of 0.687 and a median of 0.374, suggesting significant variance in the extent of supply chain risk-related content in earnings calls. The mean of the Resolution measure is 0.275, with more than 75% of the sampled transcripts including no mention of supply chain risk resolution.
Descriptive statistics (supply chain risk and resolution).
Descriptive statistics (supply chain risk and resolution).
We perform several validation tests for our SCRisk and Resolution measures.
Excerpts of Supply Chain Risk and Supply Chain Risk Resolution Content in Earnings Calls
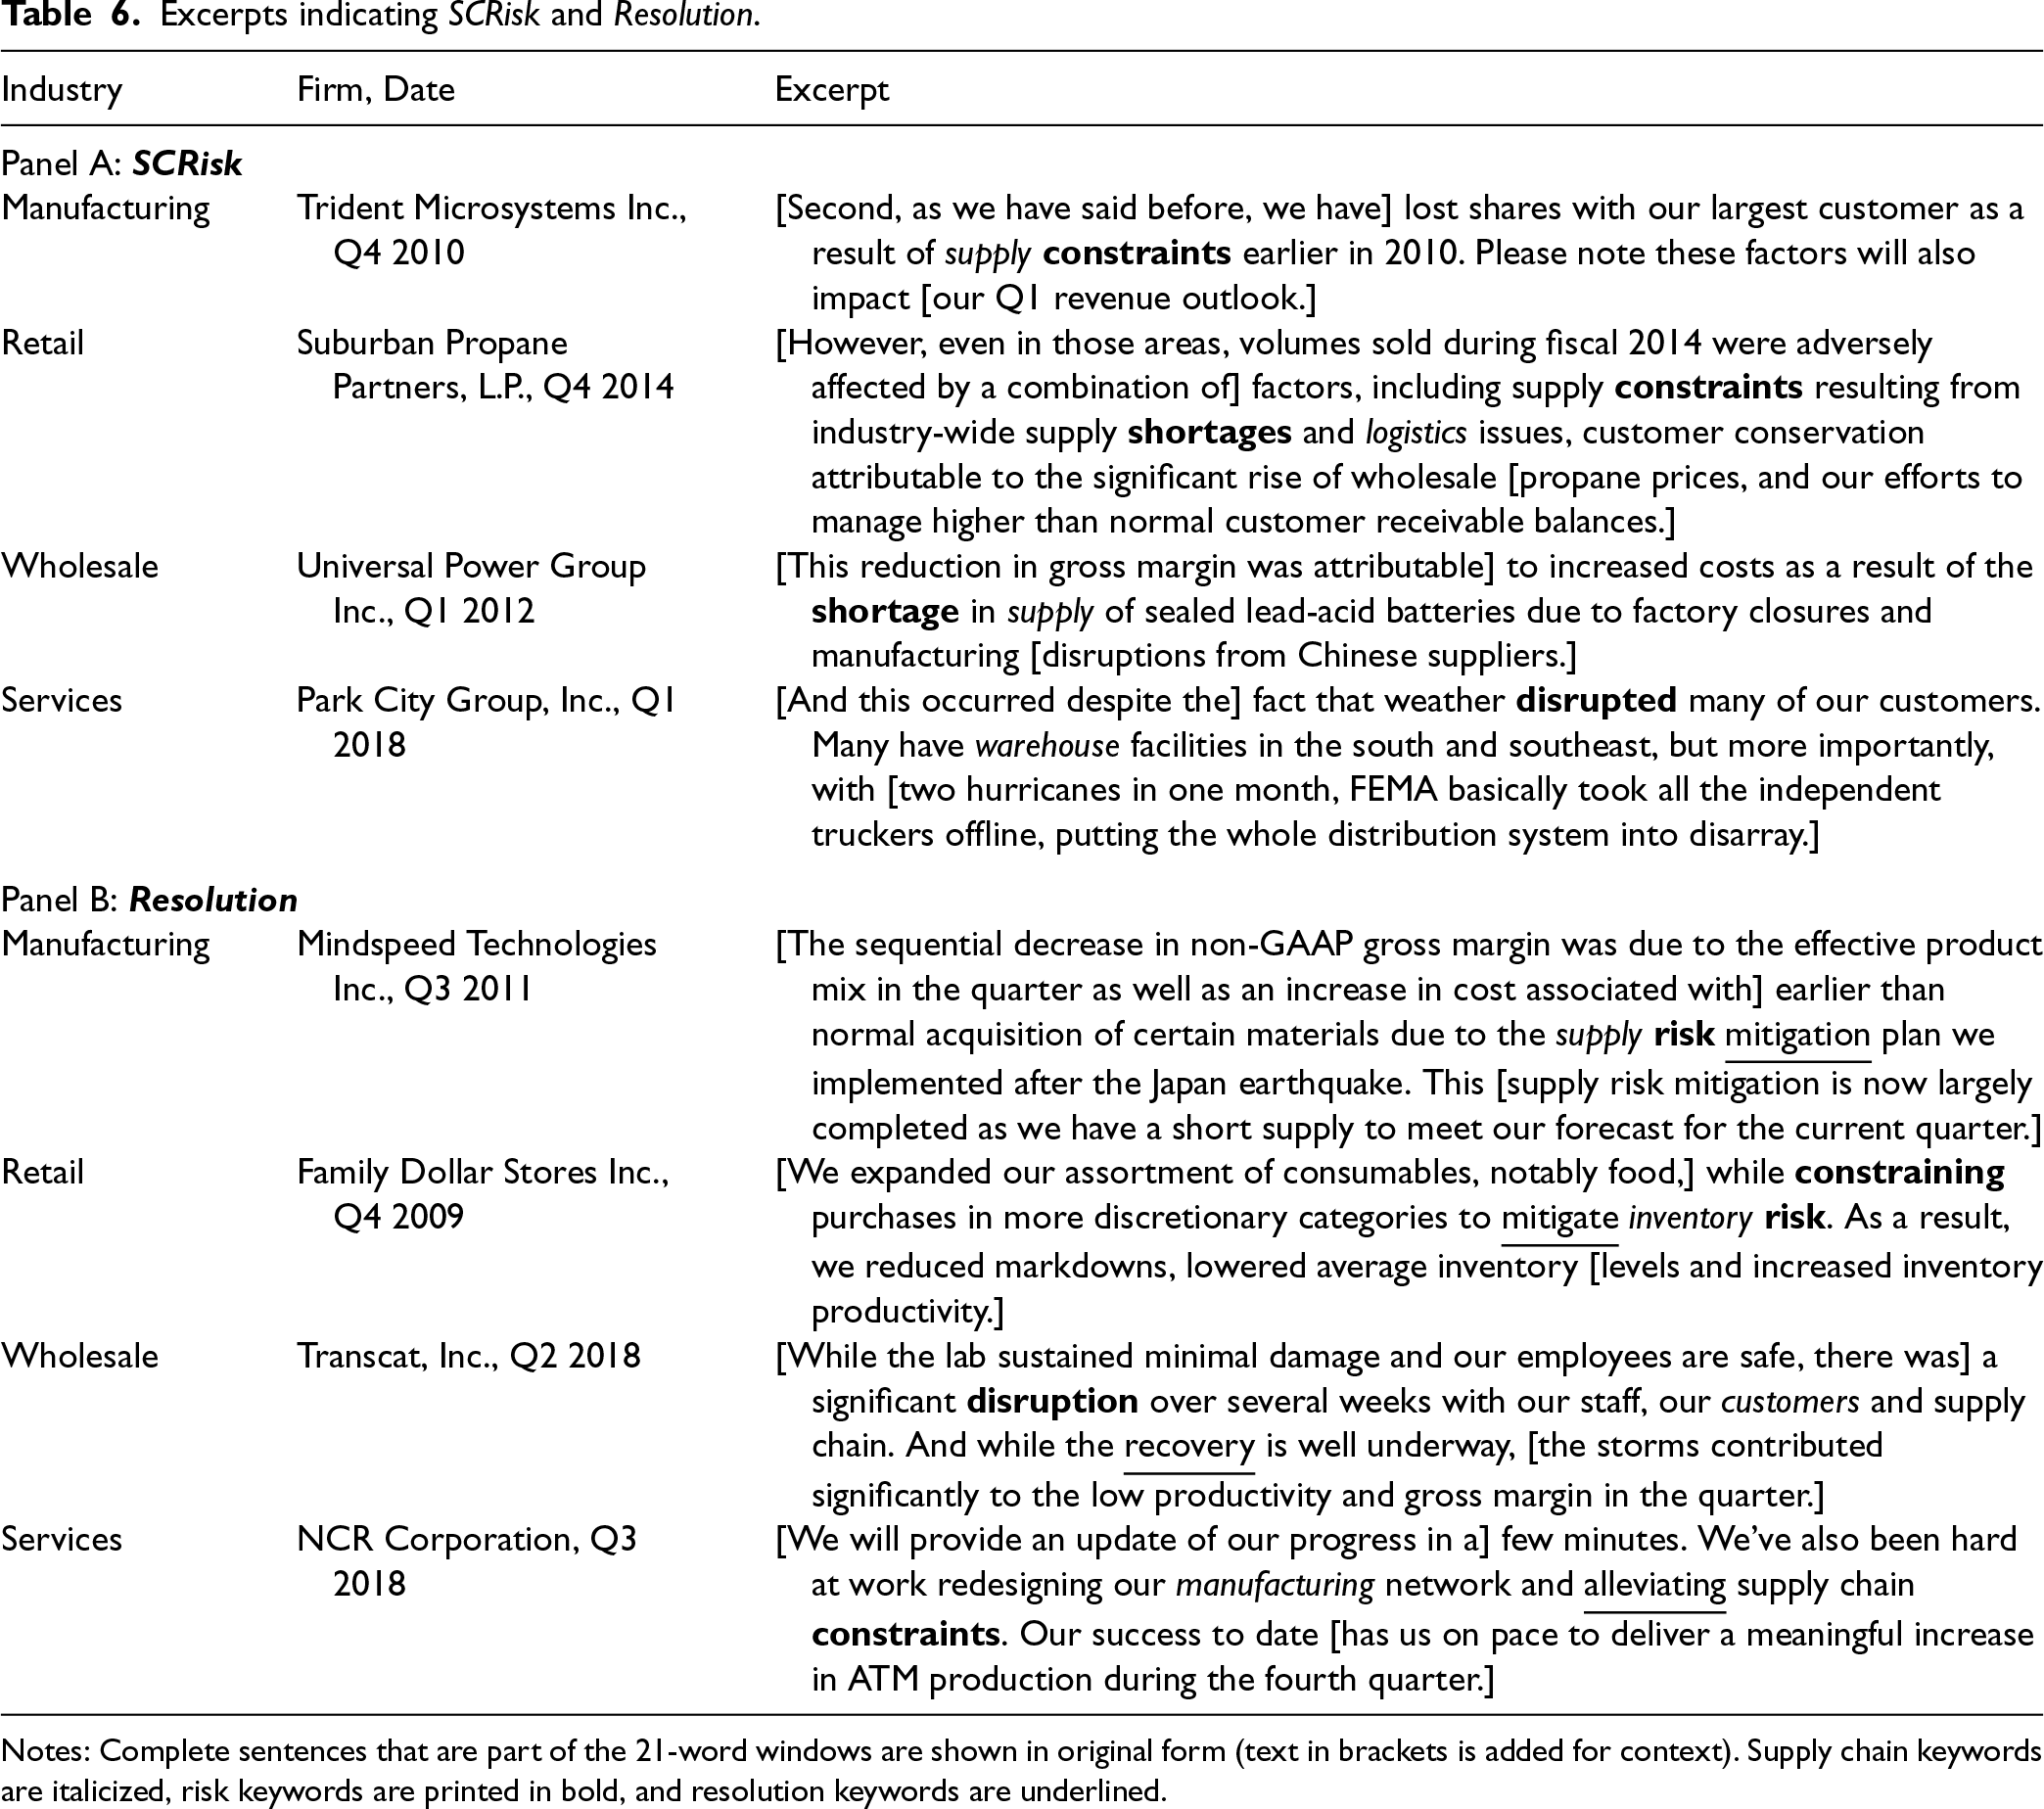
In the first validation step, we qualitatively examine a sample of earnings calls with high SCRisk and Resolution scores. Panel A of Table 6 shows sample excerpts from transcripts among the highest SCRisk scores in different industry sectors. These examples also illustrate the use by practitioners of some of the risk keywords we added to the libraries used by Hassan et al. (2019) and Wu (2024). For instance, Universal Power Group Inc., in Q1 2012, highlights “increased costs as a result of the shortage [risk keyword] in supply [keyword indicating supply chain context] of sealed lead-acid batteries” as an operational challenge. Collectively, these excerpts refer to different forms of supply chain risk that arise due to supply-side, demand-side, and internal operational issues or concerns rooted in environmental conditions.
Excerpts indicating SCRisk and Resolution.
Excerpts indicating SCRisk and Resolution.
Notes: Complete sentences that are part of the 21-word windows are shown in original form (text in brackets is added for context). Supply chain keywords are italicized, risk keywords are printed in bold, and resolution keywords are underlined.
Panel B of Table 6 presents excerpts for observations with high Resolution scores. The Mindspeed Technologies (Q3 2011) and Family Dollar Stores (Q4 2009) examples reference proactive and constrained materials purchases in response to supply and inventory risk, respectively. The excerpt from NCR Corporation's (Q3 2018) highlights a redesigned manufacturing network as a means to resolve supply chain risk. Transcat (Q2 2018), in turn, merely references the firm's recovery efforts without going into further detail. In part, this may be a function of the interactive format of earnings calls, where spoken words are not always scripted or precise. As speech comes in different forms and varying levels of specificity, text analysis involves a certain degree of interpretive uncertainty. Still, the excerpts provided in Panel B of Table 6 describe varying resolution-related scenarios in different contexts and collectively suggest that our approach effectively captures resolution content in earnings calls.
As an additional validation exercise, we examine the SCRisk scores for samples of firms drawn from two prior studies of supply chain disruptions. Jacobs et al. (2022) provide a sample of supply chain disruptions between 2004 and 2014. Of these, 73 fall within our study period. Hendricks et al. (2020) identify 154 US firms that experienced disruptions related to the 2011 Great East Japan Earthquake. For each of these two samples of firms subject to disruptions, we identify a set of control firms. Specifically, we match disrupted firms with control firms operating in the same two-digit SIC industries in the quarter of the disruption and select the nearest neighbor in terms of firm size (total assets) to pair each disrupted firm with a control firm. We define the first quarterly earnings call after the disruption announcement as quarter 0, the quarter before as −1, and the quarter after as 1. Figure 2 plots SCRisk for both the sample of supply chain disruptions (Jacobs et al., 2022) and the sample of disruptions from the 2011 Great East Japan Earthquake (Hendricks et al., 2020) for −/+ two quarters around quarter 0.
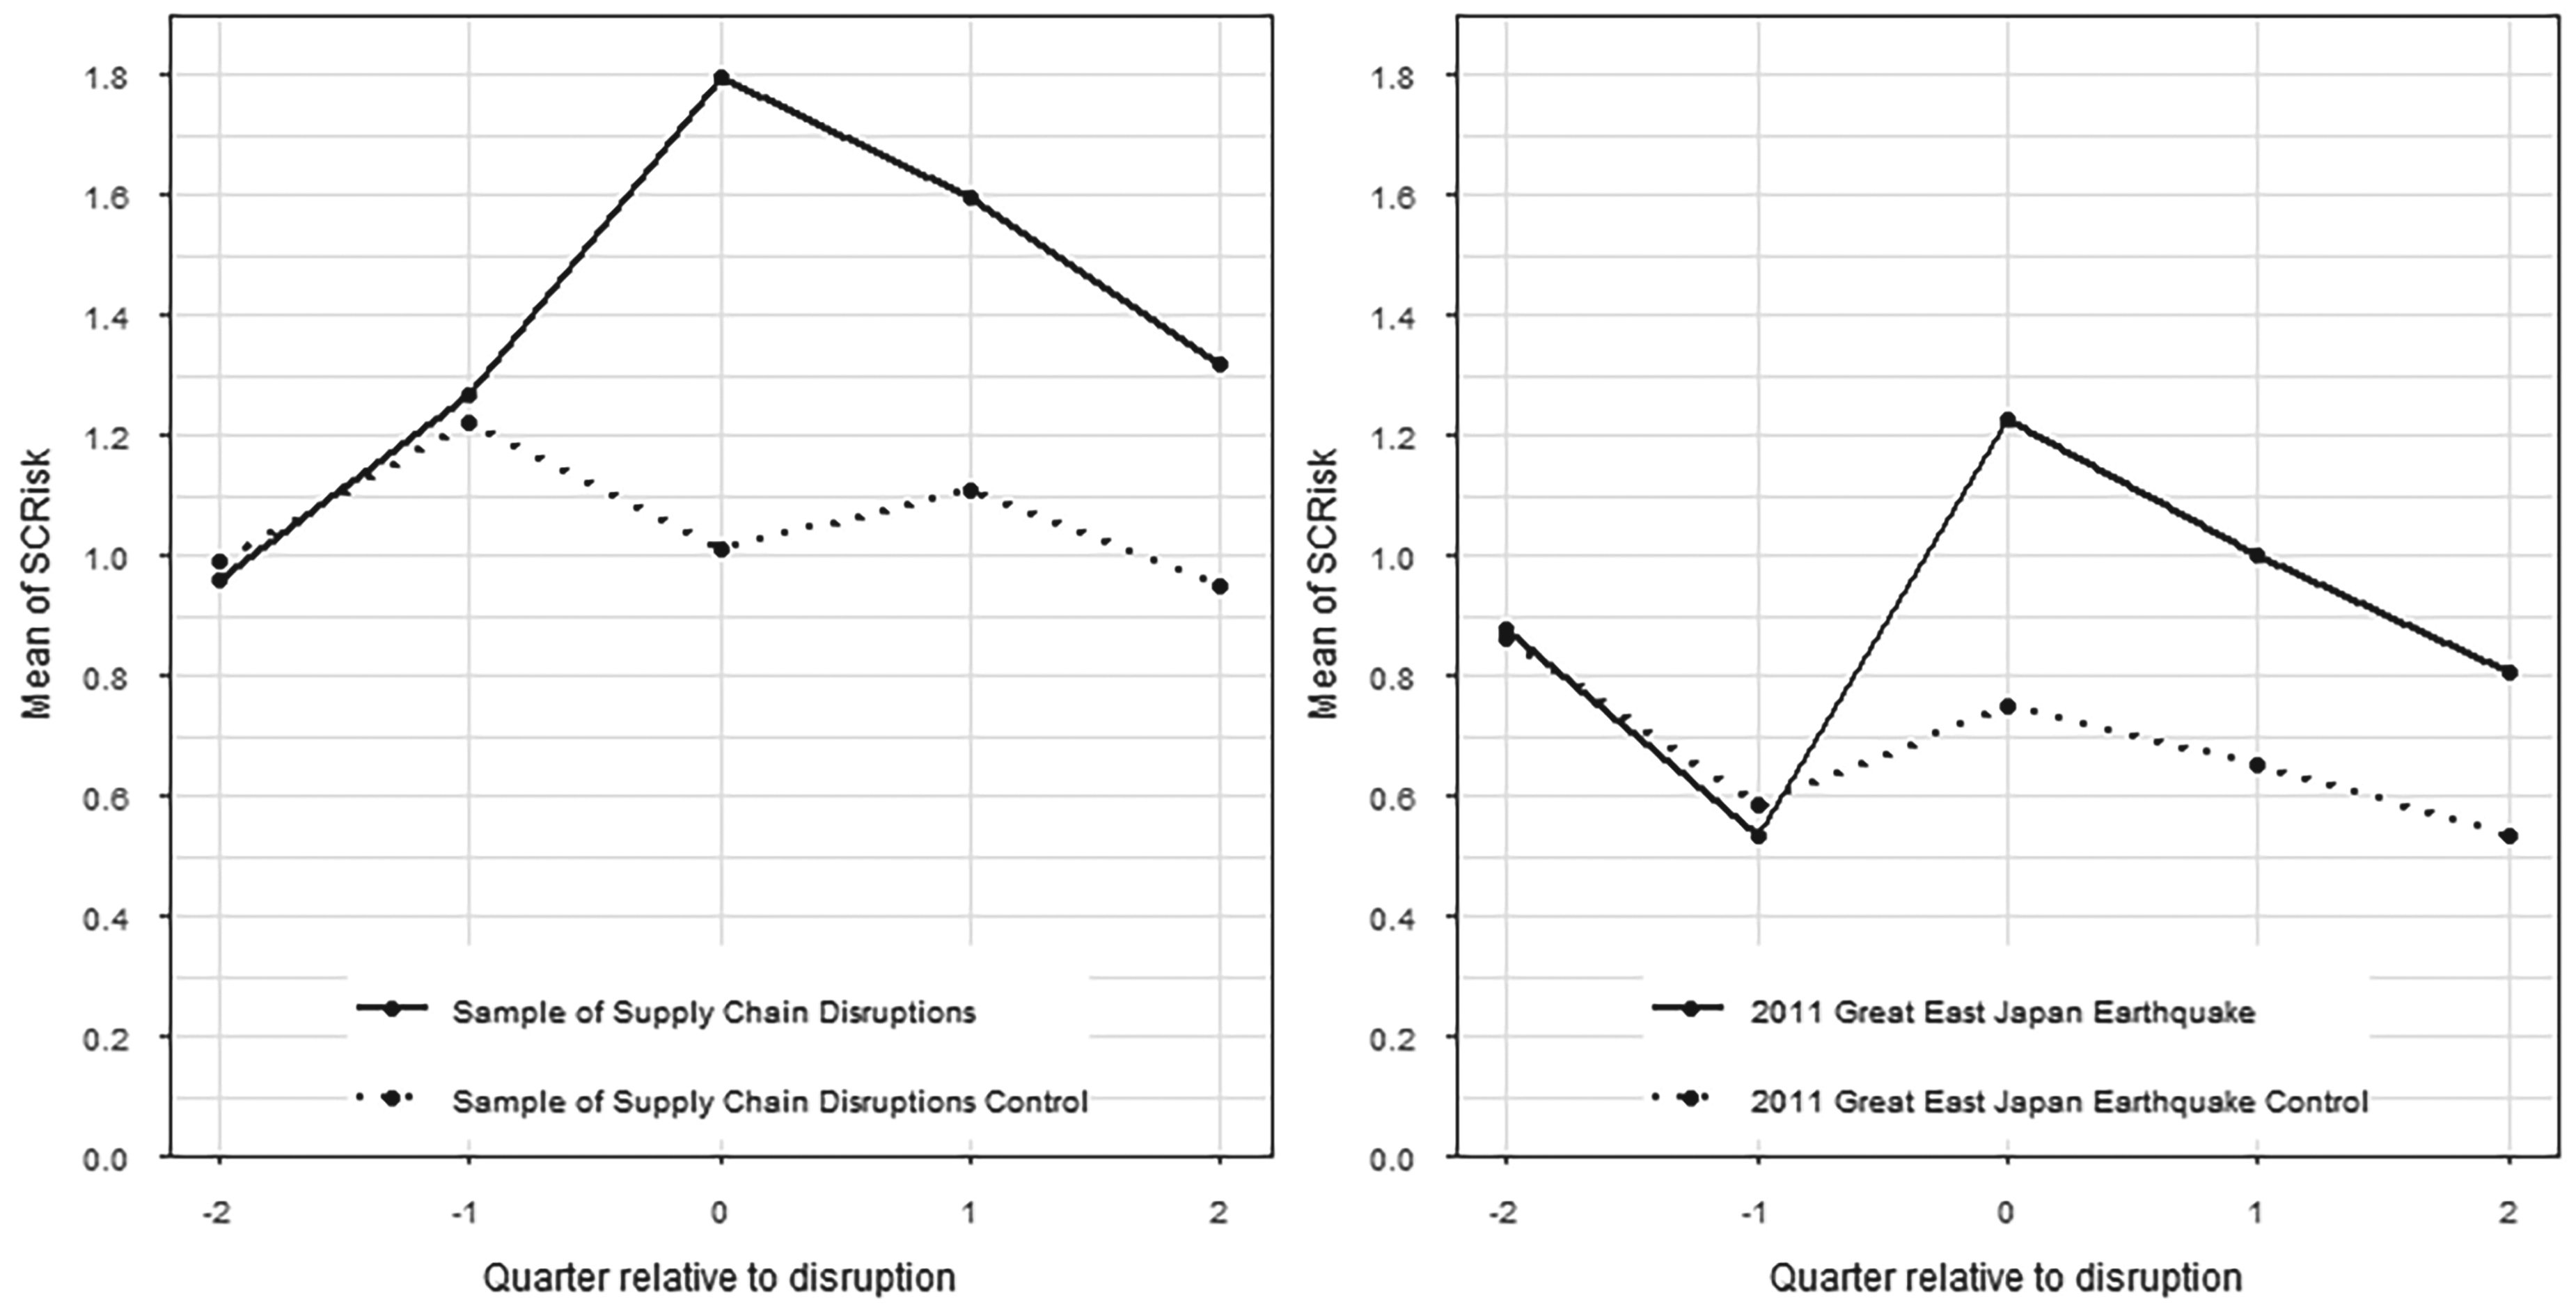
Trend analysis of SCRisk scores around supply chain disruption announcements.
In both instances, SCRisk scores were similar, on average, for the disrupted and control firms in the quarters prior to the disruption. SCRisk scores for the disruption samples spike in quarter 0, whereas there is no such spike for the control samples. This difference persists for the two quarters following the disruption. These findings suggest that our SCRisk measure captures the expected increase in supply chain risk in the immediate aftermath of supply chain disruptions.
We use cumulative abnormal returns (CAR) to measure the economic consequences of supply chain risk and supply chain risk resolution. CAR measures the impact of new information on the market's expectations of a firm's current and future performance. Abnormal returns are the difference between realized and expected returns. CAR is the sum of the abnormal returns over a period of two days, where we refer to the day of the earnings call as Day 0 and the day after the earnings call as Day 1. The cumulative abnormal return CARit of stock i in quarter t covering Day 0 and Day 1 is given by:

To compute the abnormal return on a given day t, we first calculate the expected return using the four-factor model (Carhart, 1997; Fama and French, 1993) that controls for factors related to market returns, size, book-to-market ratio, and momentum. Specifically, the four-factor model is defined as follows:
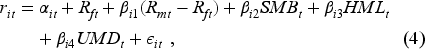
We calculate abnormal returns using the Wharton Research Data Services’ Event Study tool. Specifically, we estimate the four-factor model parameters 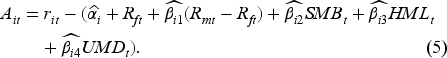
We use a set of control variables in our multivariate analyses. First, we control for lagged SCRisk (SCRisklag) and Resolution (Resolutionlag). In so doing, we account for investors’ a priori expectations with respect to supply chain risk and supply chain risk resolution and are able to estimate the effect of new or updated SCRisk and Resolution information that is shared in an earnings call.
Second, whereas our primary focus is on supply chain risk, earnings calls may include coverage of non-risk supply chain content in terms of firms’ efforts to leverage them for competitive advantage. We control for supply chain sentiment (SCSent), defined as the sentiment of any supply chain content in earnings calls that is not risk-related. This is similar to Hassan et al.'s (2019) study on political risk, which controls for the sentiment of political content discussed in earnings calls. We create a sentiment library (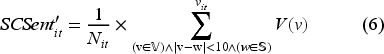
We then divide
Third, we control for the overall sentiment in an earnings call using AllSent. Based on the
Additional control variables, based on the latest quarterly data available for the respective earnings calls, are retrieved from Compustat, Institutional Brokers’ Estimate System (I/B/E/S) database, and other publicly available sources. We use logAssets, the natural logarithm of total assets ($ millions) to account for the fact that larger firms may receive greater analyst coverage and, thus, elicit greater market reactions (Huang et al., 2018). In line with Suslava (2021), we also include the market-to-book ratio (MTB), return on assets (ROA), and debt-to-equity ratio (DTE) as control variables. We calculate MTB as the market value of firms’ equity divided by the book value of equity. ROA is the ratio of net income and total assets. DTE is the sum of a firm's long-term debt and current liabilities divided by the book value of equity. The control variable SRVB represents the stock return volatility and is included to gauge investors’ general risk perception (Bao and Datta, 2014). It is measured as the standard deviation of daily stock returns over 60 trading days before the earnings call. We further control for cumulative abnormal returns from the previous quarter earnings call (CARlag) to account for persistence in market reactions and investors’ prior expectations. Finally, we use Baker et al.'s (2016) index of Economic Policy Uncertainty (EPU) and the Chicago Board Options Exchange's (CBOE Exchange, 2022) measure of equity market volatility (VIX; e.g., Fernandes et al., 2014) to control for other, non-supply chain forms of risk.
We consider several additional firm-quarter measures to control for political risk, earnings surprise, and observable operational changes. These variables include the political risk (PRisk) measure developed by Hassan et al. (2019), current quarter earnings surprise (SUE; Livnat and Mendenhall, 2006) measured as the difference between forecasted and actual earnings per share as reported in the I/B/E/S database, and the quarter-over-quarter change in inventory turnover (ChgInvT). Information about PRisk, SUE, and ChgInvT is not available for all firms since we use PRisk reported by Hassan et al. (2019), not all firms are covered by the I/B/E/S database, and some firms do not carry inventory. The inclusion of these variables at the same time reduces the sample size by about 50%. We, therefore, limit the analyses that include PRisk, SUE, and ChgInvT to a sensitivity analysis and do not include these variables in our baseline model. Table 7 presents the descriptive statistics for the dependent and control variables. All variables are winsorized at the 1% and 99% levels to mitigate the impact of outliers.
Descriptive statistics for dependent and control variables.
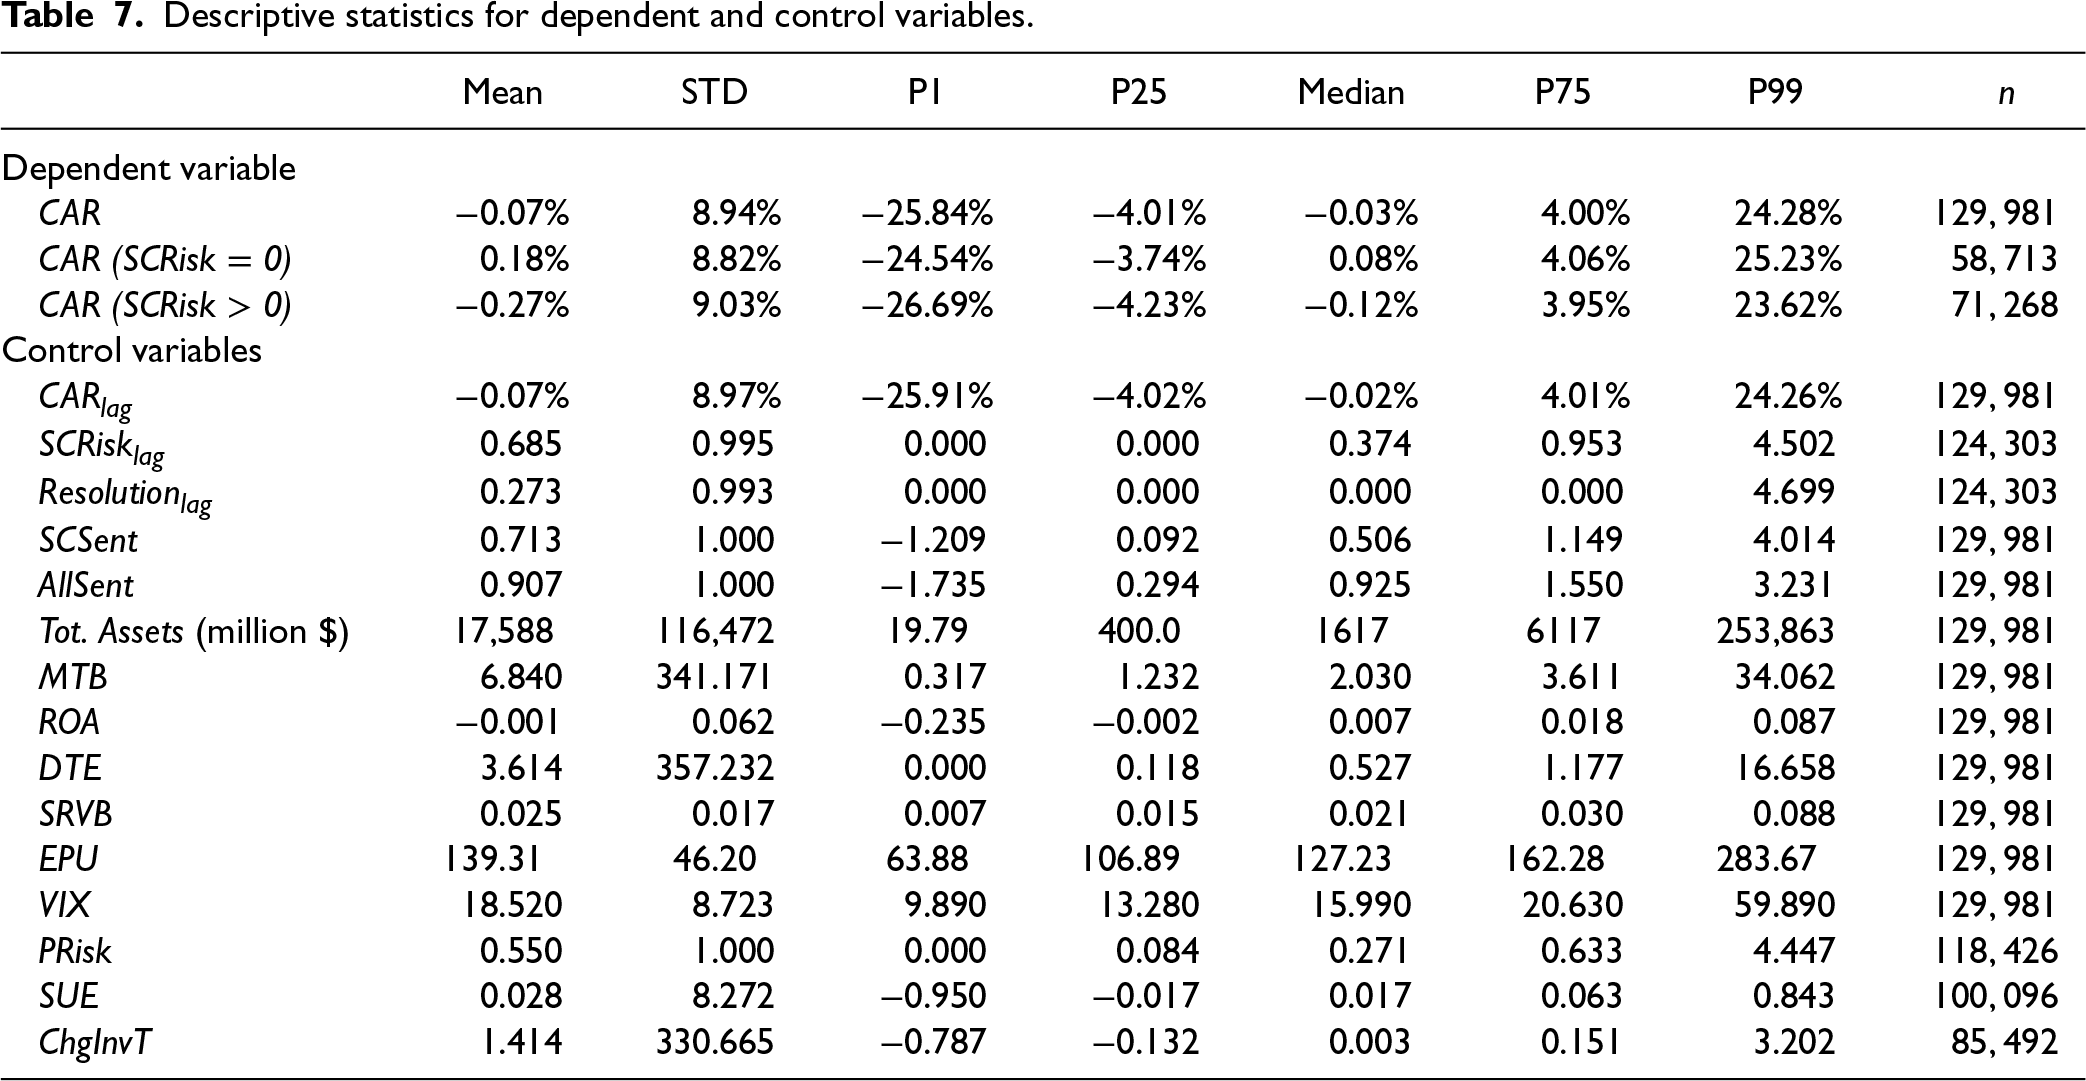
The dependent variable, CAR on days 0 and 1 around an earnings call, has a mean (median) value of −0.07% (−0.03%). We also present the average CAR for subsamples where SCRisk = 0 and >0, respectively. Observations with a positive SCRisk score average a CAR of −0.27%, whereas the mean CAR for observations with zero SCRisk is 0.18%. This finding suggests that supply chain risk may indeed be associated with lower returns and is the starting point for a series of analyses as detailed below.
We use three different sets of analyses to examine how supply chain risk and supply chain risk resolution affect firms’ cumulative abnormal returns. First, we conduct a portfolio analysis to present univariate evidence of variances in CAR across levels of SCRisk and Resolution. Second, we estimate fixed-effect panel regression analyses. Finally, we perform a Fama and MacBeth (1973) regression analysis.
Portfolio Analysis
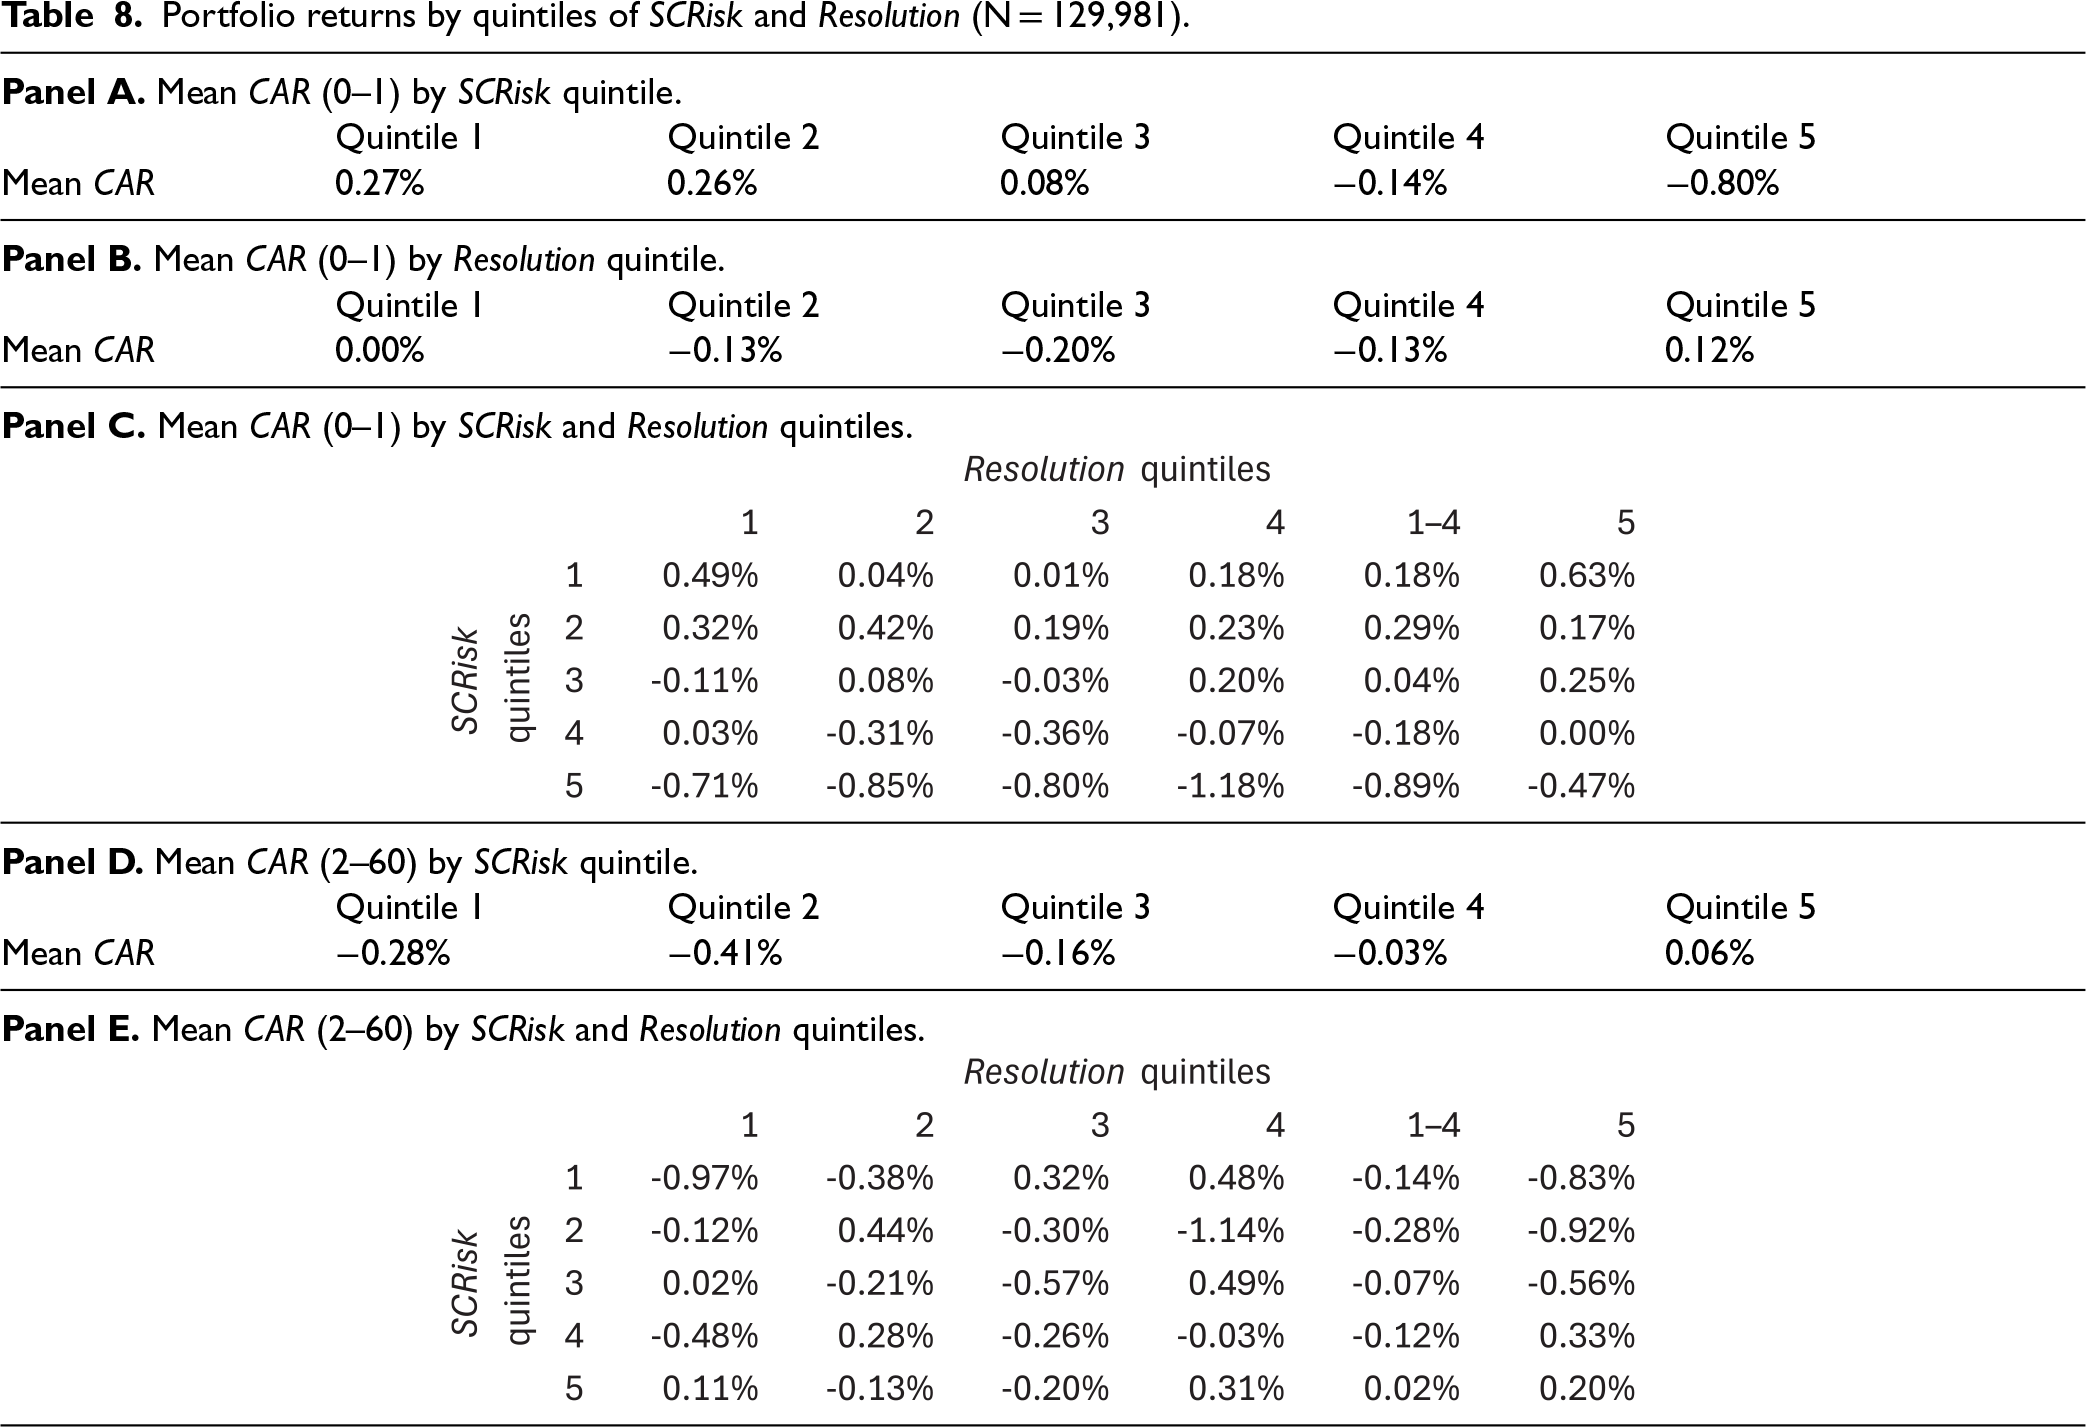
In line with prior research (Alan et al., 2014; Singhal and Wu, 2024), we implement a portfolio analysis to examine the relationship between SCRisk and CAR. Specifically, we form portfolios of observations that present varying levels of SCRisk. To this end, we first rank all observations according to their SCRisk score within each of the ten industry groups defined by two-digit SIC codes. We then divide each industry sample into quintiles based on SCRisk ranks and merge observations by quintiles across industries. The resulting portfolios vary in terms of SCRisk but are similar in sample size and industry composition. The results reported in Panel A of Table 8 provide evidence that greater SCRisk is associated with lower CAR. We observe decreasing CAR as the level of SCRisk increases from quintiles 1 to 5. The mean CAR of quintile 1 (lowest level of SCRisk) is 0.27%, while it is −0.80% for quintile 5 (highest level of SCRisk).
Portfolio returns by quintiles of SCRisk and Resolution (N = 129,981).
Portfolio returns by quintiles of SCRisk and Resolution (N = 129,981).
We similarly perform a portfolio analysis to examine the effect of Resolution on CAR. We rank all observations by Resolution within each industry and quintile of SCRisk and then group them based on their Resolution rank. Panel B of Table 8 displays mean CARs across quintiles of Resolution. The results indicate that CARs for observations with the highest supply chain risk resolution scores (quintile 5 of Resolution) are, on average, higher (mean CAR of 0.12%) than for observations with lower supply chain risk resolution (quintiles 1 to 4 of Resolution), with mean CAR ranging from 0.00% to −0.20%.
We also perform an analysis across SCRisk and Resolution quintiles (5 × 5 matrix of SCRisk and Resolution) as summarized in Panel C of Table 8. The results indicate that for any given resolution quintile, CAR decreases as SCRisk increases, but not in a monotonic fashion. The results also indicate that for the high supply chain risk quintiles (quintiles 3 to 5), CAR is generally greater when Resolution is higher (quintile 5). Since more than 75% of the sample transcripts do not include resolution-related content, the Resolution scores in the first four quintiles of Resolution are likely close to (but not equal to) zero. This effectively splits the 5 × 5 matrix of SCRisk and Resolution into two groups: Resolution quintiles 1–4 include zero or limited resolution content, and Resolution quintile 5 contains mostly non-zero Resolution scores. Panel C of Table 8 presents the results of Resolution quintiles 1–4 combined into one group. The results indicate that, except for SCRisk quintile 2, the CARs for Resolution quintile 5 are higher than for the combined Resolution quintiles 1–4.
Next, to test whether SCRisk generates arbitrage opportunities after the earnings calls, we do the following: Since earnings calls are held quarterly, we assume that each quarter has 60 trading days. We have designated Day 0 (the day of the earnings call) and Day 1 (the day after the earnings call) as the period during which the stock market reacts to new information about SCRisk in the earnings call. If SCRisk generates arbitrage opportunities after the earnings calls, it will be in the period after Day 1, that is, during Days 2 to 60. Thus, for each earnings call, we estimate the cumulative abnormal returns from Days 2 to 60. The mean cumulative abnormal return from Days 2 to 60 across all earnings calls is −0.16%. Panel D of Table 8 reports the mean cumulative abnormal returns from Days 2 to 60 for each SCRisk quintile, with absolute values ranging from 0.03% to 0.41%. In the highest SCRisk quintiles (quintiles 4 and 5), where any arbitrage opportunities are more likely to be observed, the mean cumulative abnormal returns are −0.03% and 0.06%. The small magnitudes of mean cumulative abnormal returns from Days 2 to 60 suggest that arbitrage opportunities after the earnings calls are unlikely.
Finally, we analyze the cumulative abnormal returns from Days 2 to 60 across SCRisk and Resolution quintiles (5 × 5 matrix of SCRisk and Resolution). The results presented in Panel E of Table 8 indicate that for most combinations of SCRisk and Resolution, the absolute values of the mean cumulative abnormal returns from Days 2 to 60 are less than 0.50%, and few are closer to 1%. Furthermore, no pattern emerges when we go from a given SCRisk quintile across Resolution quintiles, or from a given Resolution quintile across SCRisk quintiles. The results again suggest that arbitrage opportunities after the earnings calls are unlikely.
We estimate the following regression model to examine the effects of SCRisk and Resolution on CAR:
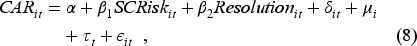
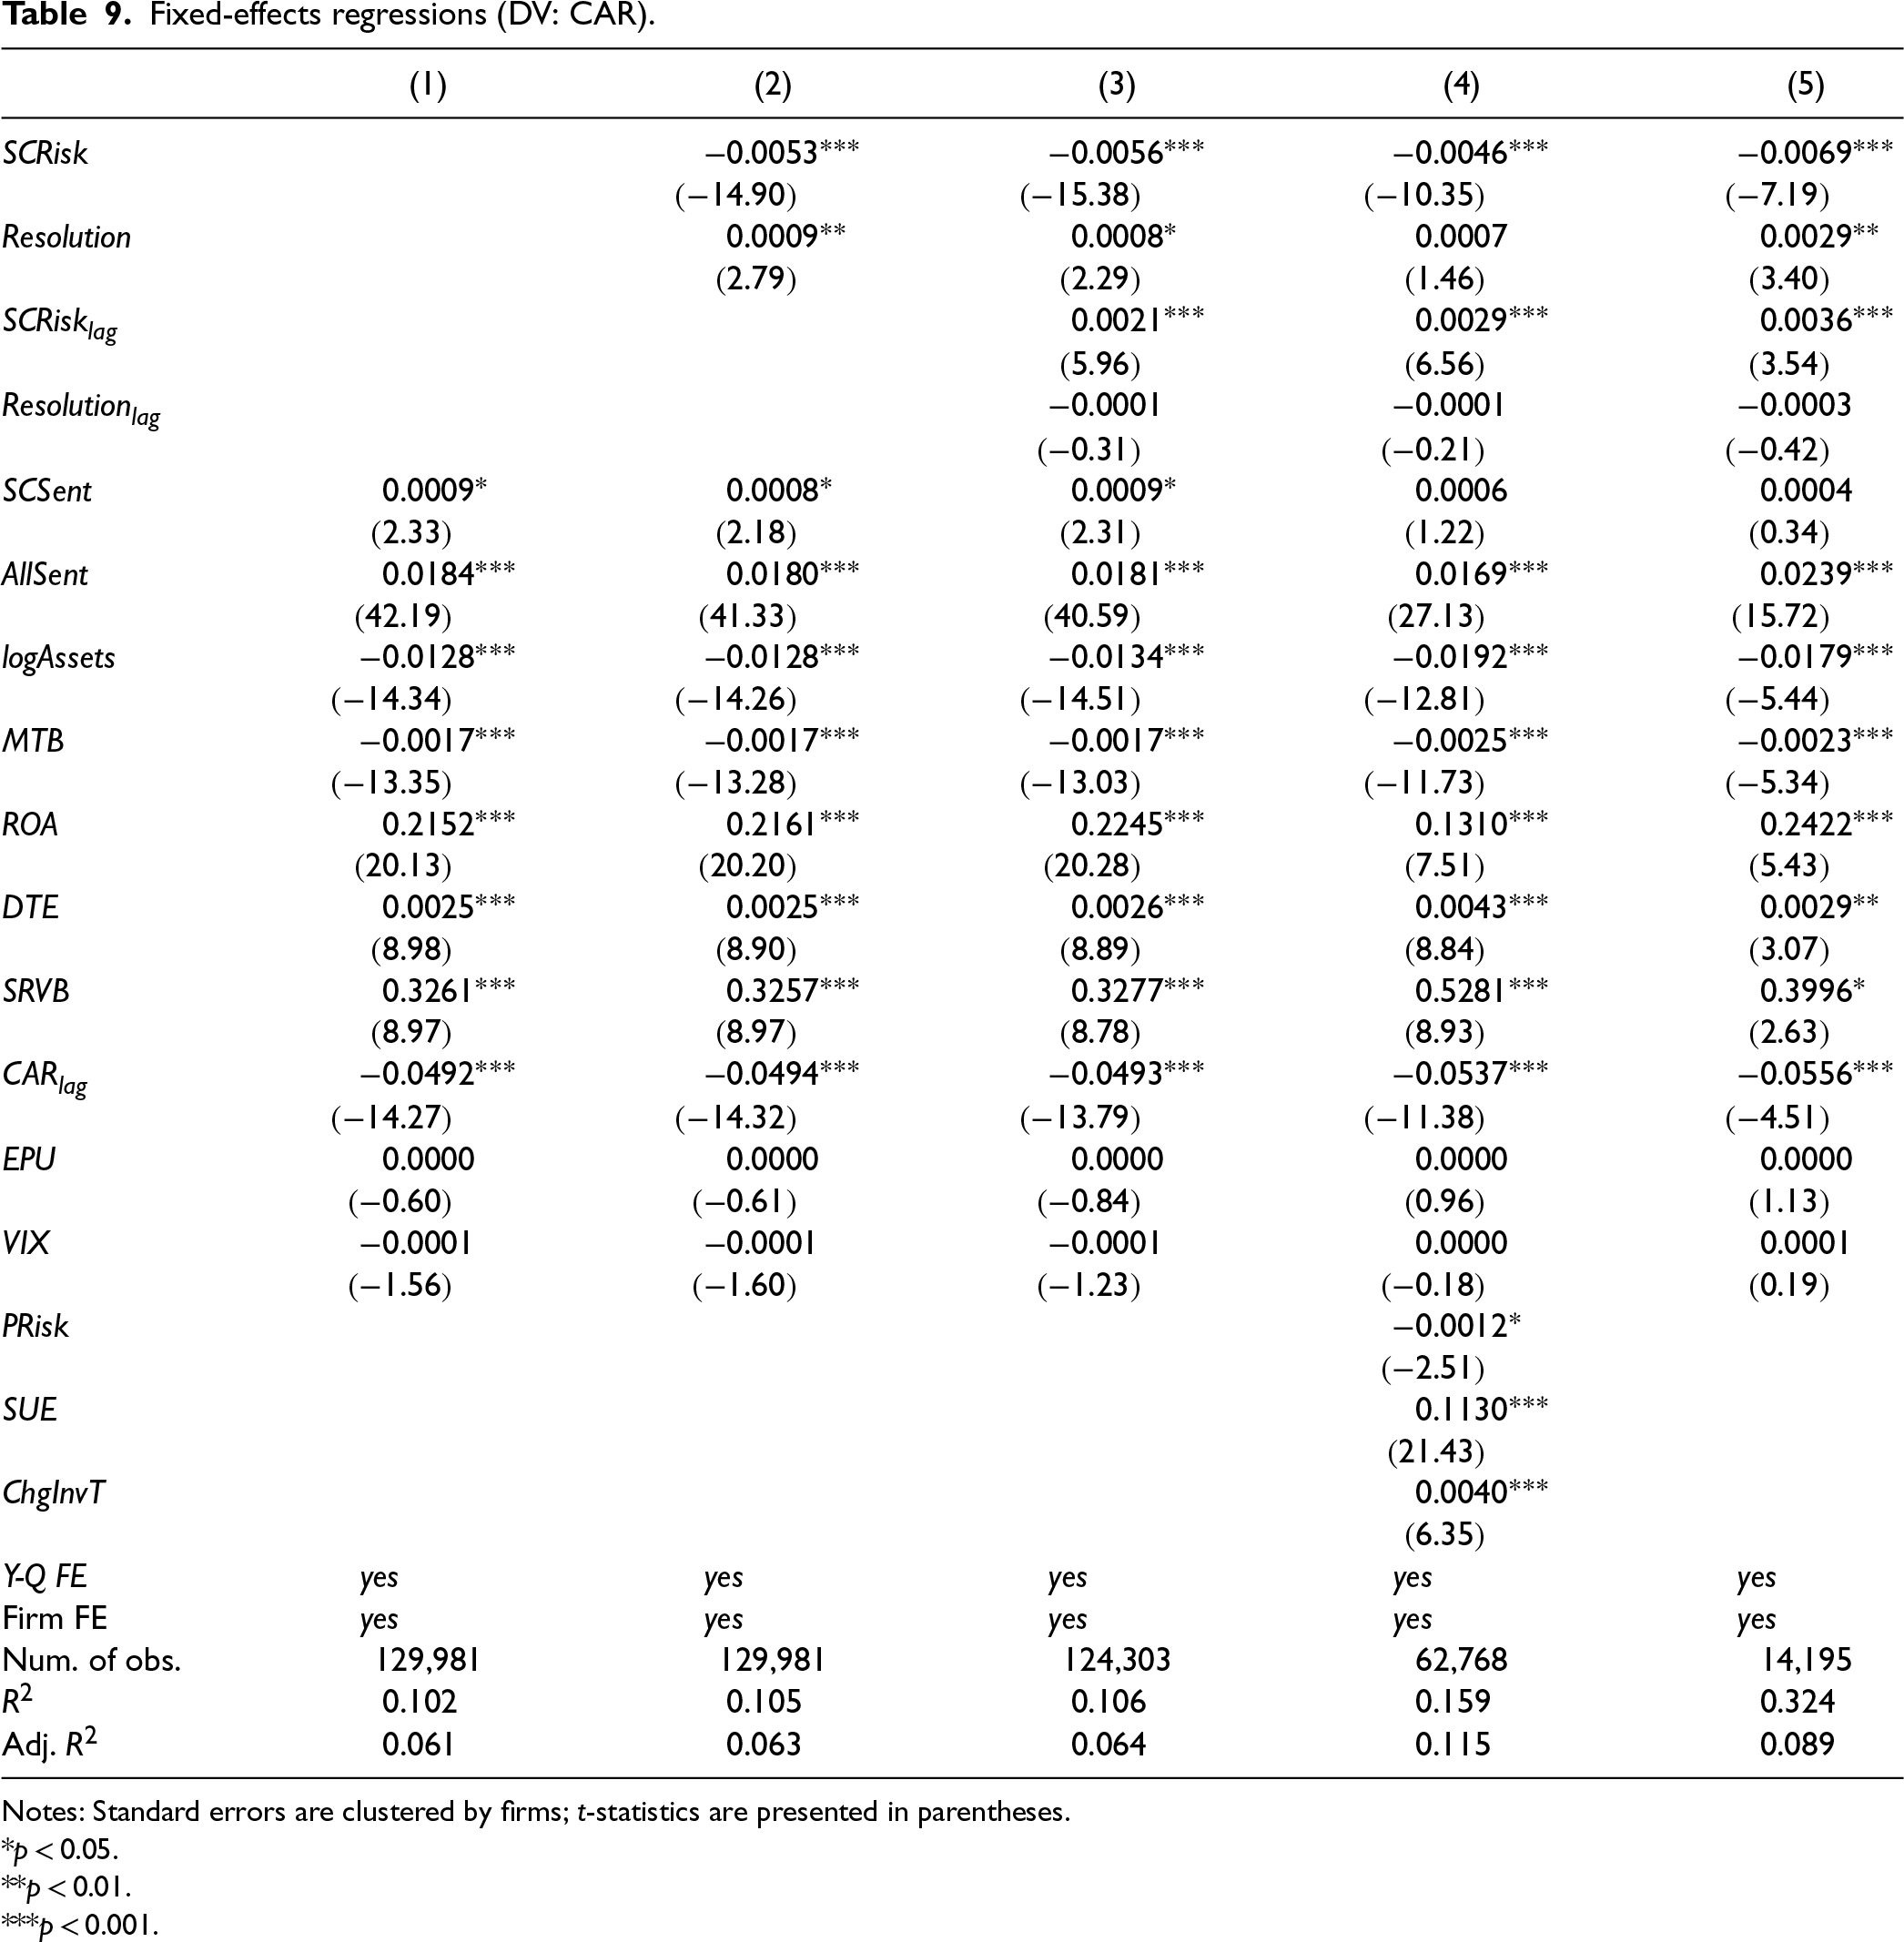
Table 9 presents the regression results. The estimation results for the control model are reported in Column (1). Several of the control variables carry significant coefficient estimates that remain consistent as the independent variables of interest and additional control variables are added in Columns (2) to (5). For instance, both sentiment measures—SCSent and AllSent—are positively associated with CAR, as are ROA, DTE, and SRVB. logAssets, MTB, and lagged CAR, in turn, carry negative coefficient estimates. Neither of the non-supply chain risk measures (EPU and VIX) is significantly associated with CAR.
Fixed-effects regressions (DV: CAR).
Notes: Standard errors are clustered by firms; t-statistics are presented in parentheses.
p < 0.05.
p < 0.01.
p < 0.001.
The primary independent variables are added in Column (2), and in addition, their lagged values are included in Column (3). Focusing on Column (3) as our baseline model of interest, the coefficient estimate of SCRisk is −0.0056 and significant at p < 0.001, indicating that a one-standard-deviation increase in SCRisk is associated with a 0.56% decrease in CAR. In turn, the lagged supply chain risk measure (SCRisklag) carries a positive and statistically significant coefficient estimate (β = 0.0021, p < 0.001) that is smaller in magnitude than that of current SCRisk. Collectively, these results indicate that the market forms expectations with respect to supply chain risk based on lagged SCRisk observations, and these expectations are updated as current SCRisk levels are observed: If current SCRisk is similar to or greater than lagged SCRisk, there will be an incremental penalty in the form of lower CAR. The coefficient estimate of Resolution is 0.0008 (p < 0.05), indicating that a one-standard-deviation increase in Resolution leads to a 0.08% increase in CAR. The coefficient of lagged Resolution is not statistically significant. Hence, any new Resolution information generates positive abnormal returns regardless of a firm's lagged Resolution efforts. In sum, there is evidence that supply chain risk resolution can at least partially offset the adverse effects of supply chain risk. These results remain consistent as PRisk, SUE, and ChgInvT are added as control variables in Column (4).
In Column (5), we estimate the baseline model (Column [3]) while limiting the analysis to observations where Resolution is greater than zero (n = 14,195), such that the statistical estimates are not diluted by the majority of observations where no Resolution is observed. As before, we find statistically significant evidence of a negative effect of SCRisk and a positive effect of Resolution on CAR. The latter coefficient estimate is 0.0029 (p < 0.01), indicating that among observations that include Resolution-related content in earnings calls, a one-standard-deviation increase in Resolution results in a 0.29% greater CAR.
The inclusion of the lagged value of the dependent variable (CARlag) potentially introduces dynamic panel (Nickell) bias. To ascertain that the coefficients of interest are unbiased, we first estimate a version of the model that does not include CARlag as a control variable. We find that the statistical results are nearly identical, confirming that Nickell bias may be less of a concern in this study, where we use fixed effects estimators with long panels of up to 47 repeated observations (Judson and Owen, 1999). We further implement a generalized method of moments (GMMs) technique (Arellano-Bond) and provide the detailed results in the E-Companion. The GMM estimates are qualitatively consistent (albeit statistically weaker in some instances) with the fixed effects estimates reported in Table 9.
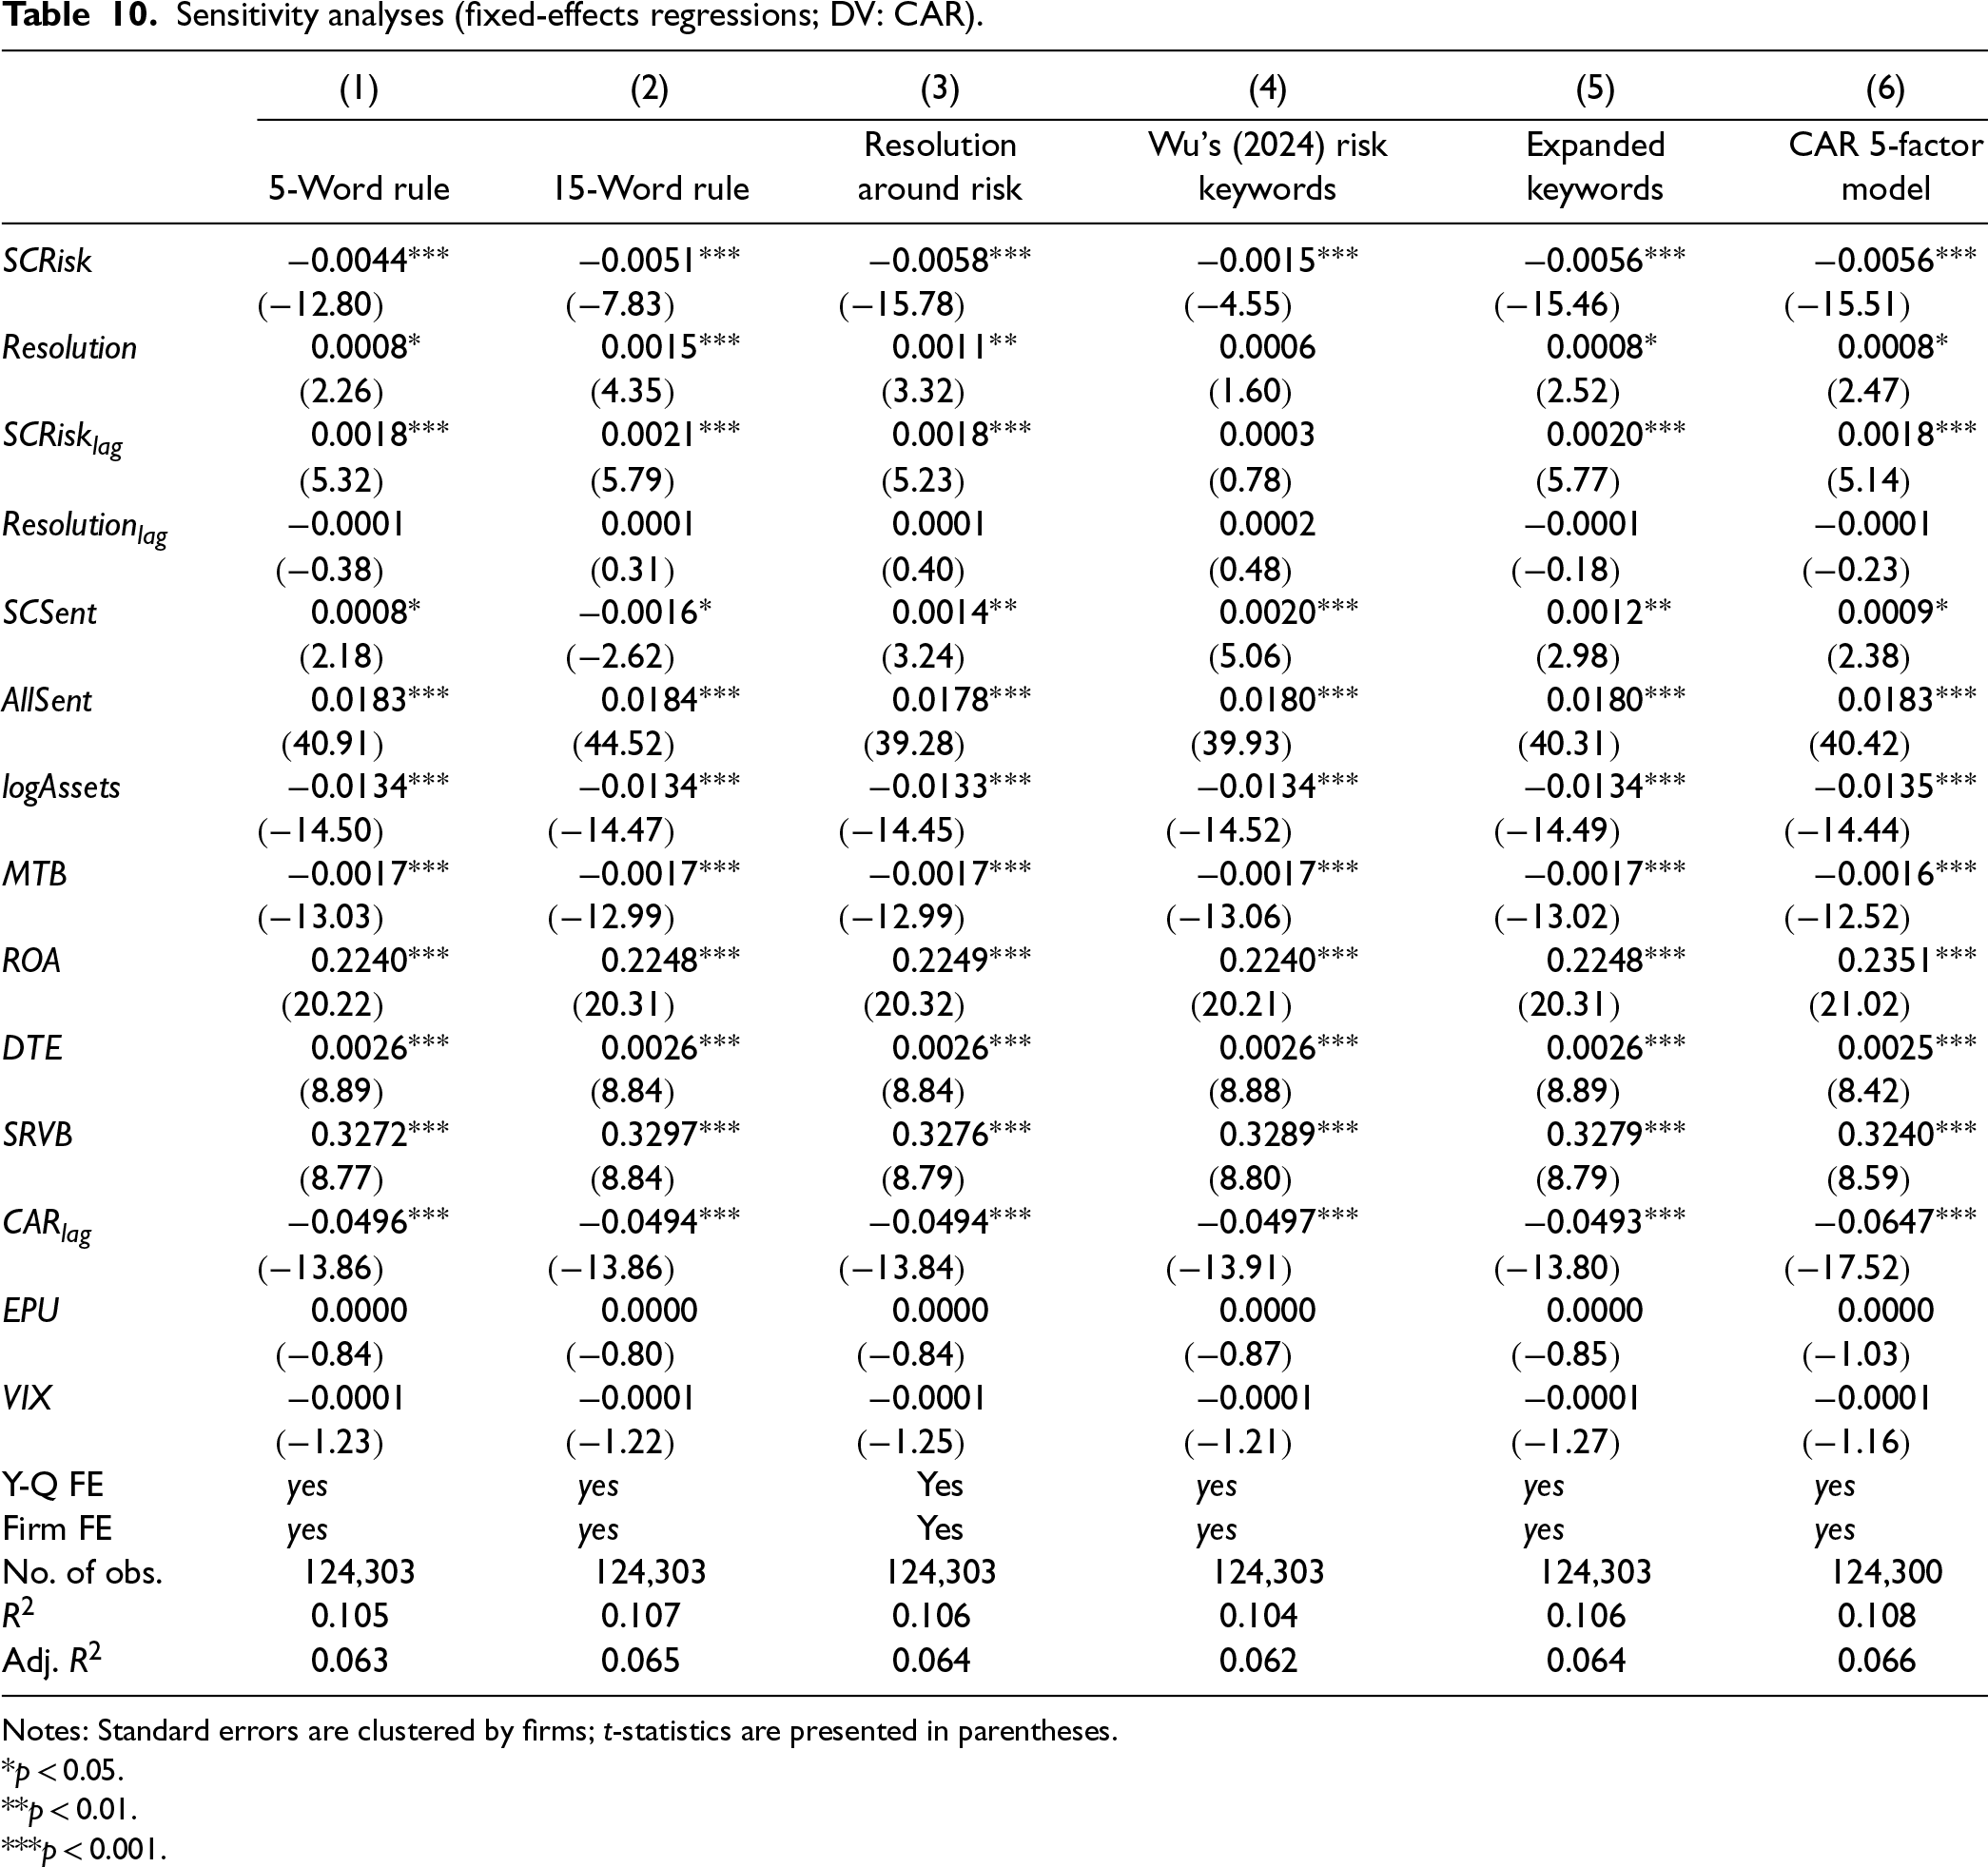
We present additional regression analyses in Table 10 to evaluate the sensitivity of our results with respect to variations in the operationalization of our key independent and dependent variables. We compare these results against our baseline regression (see Column [3] of Table 9). First, we measure SCRisk and Resolution based on 5-word and 15-word ranges as it relates to the distance between supply chain keywords and risk/resolution keywords instead of the 10-word range applied in the analyses presented above. The results, shown in Columns (1) and (2), respectively, indicate that while the coefficient of SCRisk using the 5-word range (β = −0.0044) is significantly smaller in magnitude than the coefficient when the default 10-word range is applied (β = −0.0056), the latter is not significantly different from the coefficient for SCRisk with a 15-word range (β = −0.0051). The coefficient of Resolution using the 10-word range is not significantly different from the coefficient of Resolution using the 5-word or 15-word ranges.
Sensitivity analyses (fixed-effects regressions; DV: CAR).
Notes: Standard errors are clustered by firms; t-statistics are presented in parentheses.
p < 0.05.
p < 0.01.
p < 0.001.
Second, we measure Resolution based on proximity of risk and resolution keywords within 10 words (|r-m|<10) rather than the proximity of supply chain and resolution keywords within 10 words (|w-m|<10). The coefficients of SCRisk and Resolution using |r-m|<10 (see Column [3] of Table 10) are not significantly different from the coefficients of SCRisk and Resolution using |w-m|<10.
Third, we deploy SCRisk and Resolution measures using reduced or expanded sets of keywords. In Column (4) of Table 10, we present the results that apply the reduced set of risk keywords as used by Wu (2024). The coefficient of SCRisk from our baseline model (β = −0.0056; Column [3] of Table 9) is significantly greater in magnitude than the coefficient using Wu's (2024) risk keywords (β = −0.0015). The coefficients of Resolution from our baseline model and from using Wu's (2024) risk keywords are not significantly different from each other. Column (5) of Table 10, in turn, presents the estimates where we add selected risk keywords (duty, tariff, trade, conflict, quota, war, strike) and resolution keywords (counter, absorb, dissolve, dilute) in generating the SCRisk and Resolution measures. Doing so has no significant effect on the coefficient estimates as compared to the baseline results shown in Table 9, Column (3).
The results reported in Columns (1) to (5) of Table 10 and their comparison with our baseline results reported in Column (3) of Table 9 suggest that the estimates are, to some degree, sensitive with respect to text-analytic choices in terms of word ranges (5-, 10-, 15-word ranges), the proximity rules applied (resolution around supply chain keywords vs. resolution around risk keywords), and the keywords used (our risk keywords vs. Wu [2024]). While there is no single “right” set of choices in text analytic research, in instances where we deviate from prior research, for example, as it relates to our choice of risk keywords, we do so with appropriate literature support and justification. Regardless of the specific choices made, the results are qualitatively consistent throughout.
Finally, we estimate CAR, the dependent variable, using the Fama-French 5-factor model (Fama and French, 2015). The coefficients of SCRisk and Resolution using the Fama French 5-factor model (see Column (6) of Table 10) are not significantly different from the coefficients of SCRisk and Resolution using the Fama French 4-factor model (Column [3] of Table 9).
Distinction Between Presentation and Questions-and-Answers Parts
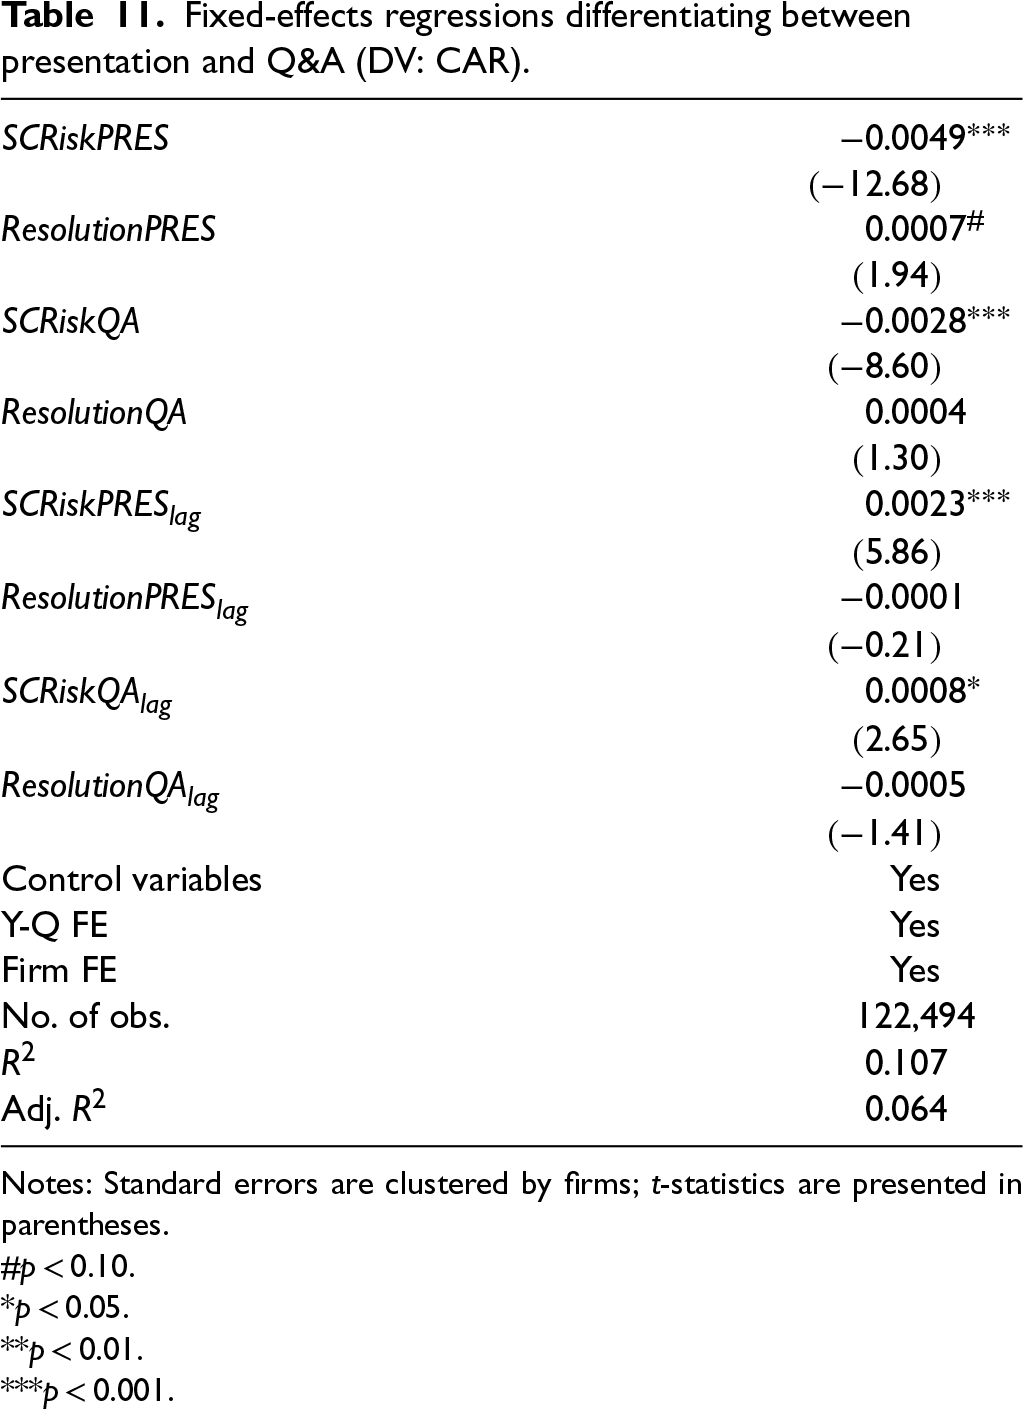
Prior research has investigated the effect of differences between discussions in the presentation and questions-and-answers parts of earnings calls (Suslava, 2021). We similarly examine if the proactive disclosure of supply chain risk and resolution in the presentation part (SCRiskPRES and ResolutionPRES) has a different effect on CAR as compared to supply chain risk and resolution content in the questions-and-answers portion of a call (SCRiskQA and ResolutionQA). Focusing on the presentation portion of earnings calls, the results in Table 11 are consistent with the main regression results, showing a significant negative estimate for SCRiskPRES (β = −0.0049, p < 0.001) and a coefficient for ResolutionPRES that is positive, but only marginally significant (β = 0.0007, p < 0.10). When it comes to the questions-and-answers part, the coefficient of SCRiskQA is −0.0028 (p < 0.001), and the coefficient of ResolutionQA is positive but statistically insignificant (β = 0.0004, p > 0.10). Hence, the coefficient estimates are qualitatively consistent in direction and magnitude across the presentation and question-and-answer segments. The weak statistical results with respect to the effects of Resolution likely reflect the relatively infrequent occurrence of explicit resolution-related content in earnings calls, which reduces statistical power when the measure is further partitioned. Moreover, investors may respond to the overall resolution narrative rather than to such content in specific segments of the call. We, therefore, interpret these results with caution and view the aggregate resolution measure as the more reliable indicator of stock market reactions.
Fixed-effects regressions differentiating between presentation and Q&A (DV: CAR).
Fixed-effects regressions differentiating between presentation and Q&A (DV: CAR).
Notes: Standard errors are clustered by firms; t-statistics are presented in parentheses.
p < 0.10.
p < 0.05.
p < 0.01.
p < 0.001.
We conduct further analyses to explore how our findings with respect to SCRisk and Resolution vary as a function of firm size, institutional ownership, analyst coverage, upstreamness, foreign sales, and time. Firm size may shape investor reactions to SCRisk and Resolution since larger firms are typically more diversified, possess greater operational slack and, thus, may be buffered from adverse stakeholder perceptions of greater supply chain risk. Likewise, institutional ownership and analyst coverage capture differences in firms’ information environments, which may affect how quickly and accurately market participants process supply chain risk–related disclosures. A firm's position in the supply chain (upstreamness) or the degree foreign sales may similarly moderate the stock market reaction to disclosures of supply chain risk and resolution. Finally, the market may be more attuned to supply chain risk and resolution in more recent years. For each of these factors, we split the sample into two subsamples and then analyze them separately. We then test for statistically significant differences in the coefficients of SCRisk and Resolution.
We next describe the data used to construct the subsamples for the six variables. Firm size is measured by total assets, and we divide the sample into small and large firm subsamples based on the median value. Institutional ownership is measured by the percentage of outstanding shares owned by institutions as reported in the Thomson Reuters Institutional Holdings database, and the sample is divided into low and high institutional ownership subsamples based on the median value of this variable. Analyst coverage is measured as the number of analysts covering the firm as reported in the I/B/E/S database, with the sample being split at the median. Upstreamness measures a firm's informational distance from final consumer demand, defined as the length of supply-chain paths linking the firm to downstream firms that sell directly to end customers, with higher values indicating more upstream positions (Agrawal and Osadchiy, 2023; Osadchiy et al., 2021a; Osadchiy et al., 2021b). We split the sample at the median of Osadchiy et al.'s (2021a) measure. Foreign sales data is obtained from Charoenwong et al. (2023), who classified firms as domestic (foreign) if foreign sales are less (more) than 50% of total sales. Finally, we split the sample into two 6-year periods—2008–2013 and 2014–2019—to examine variations in the results over time.
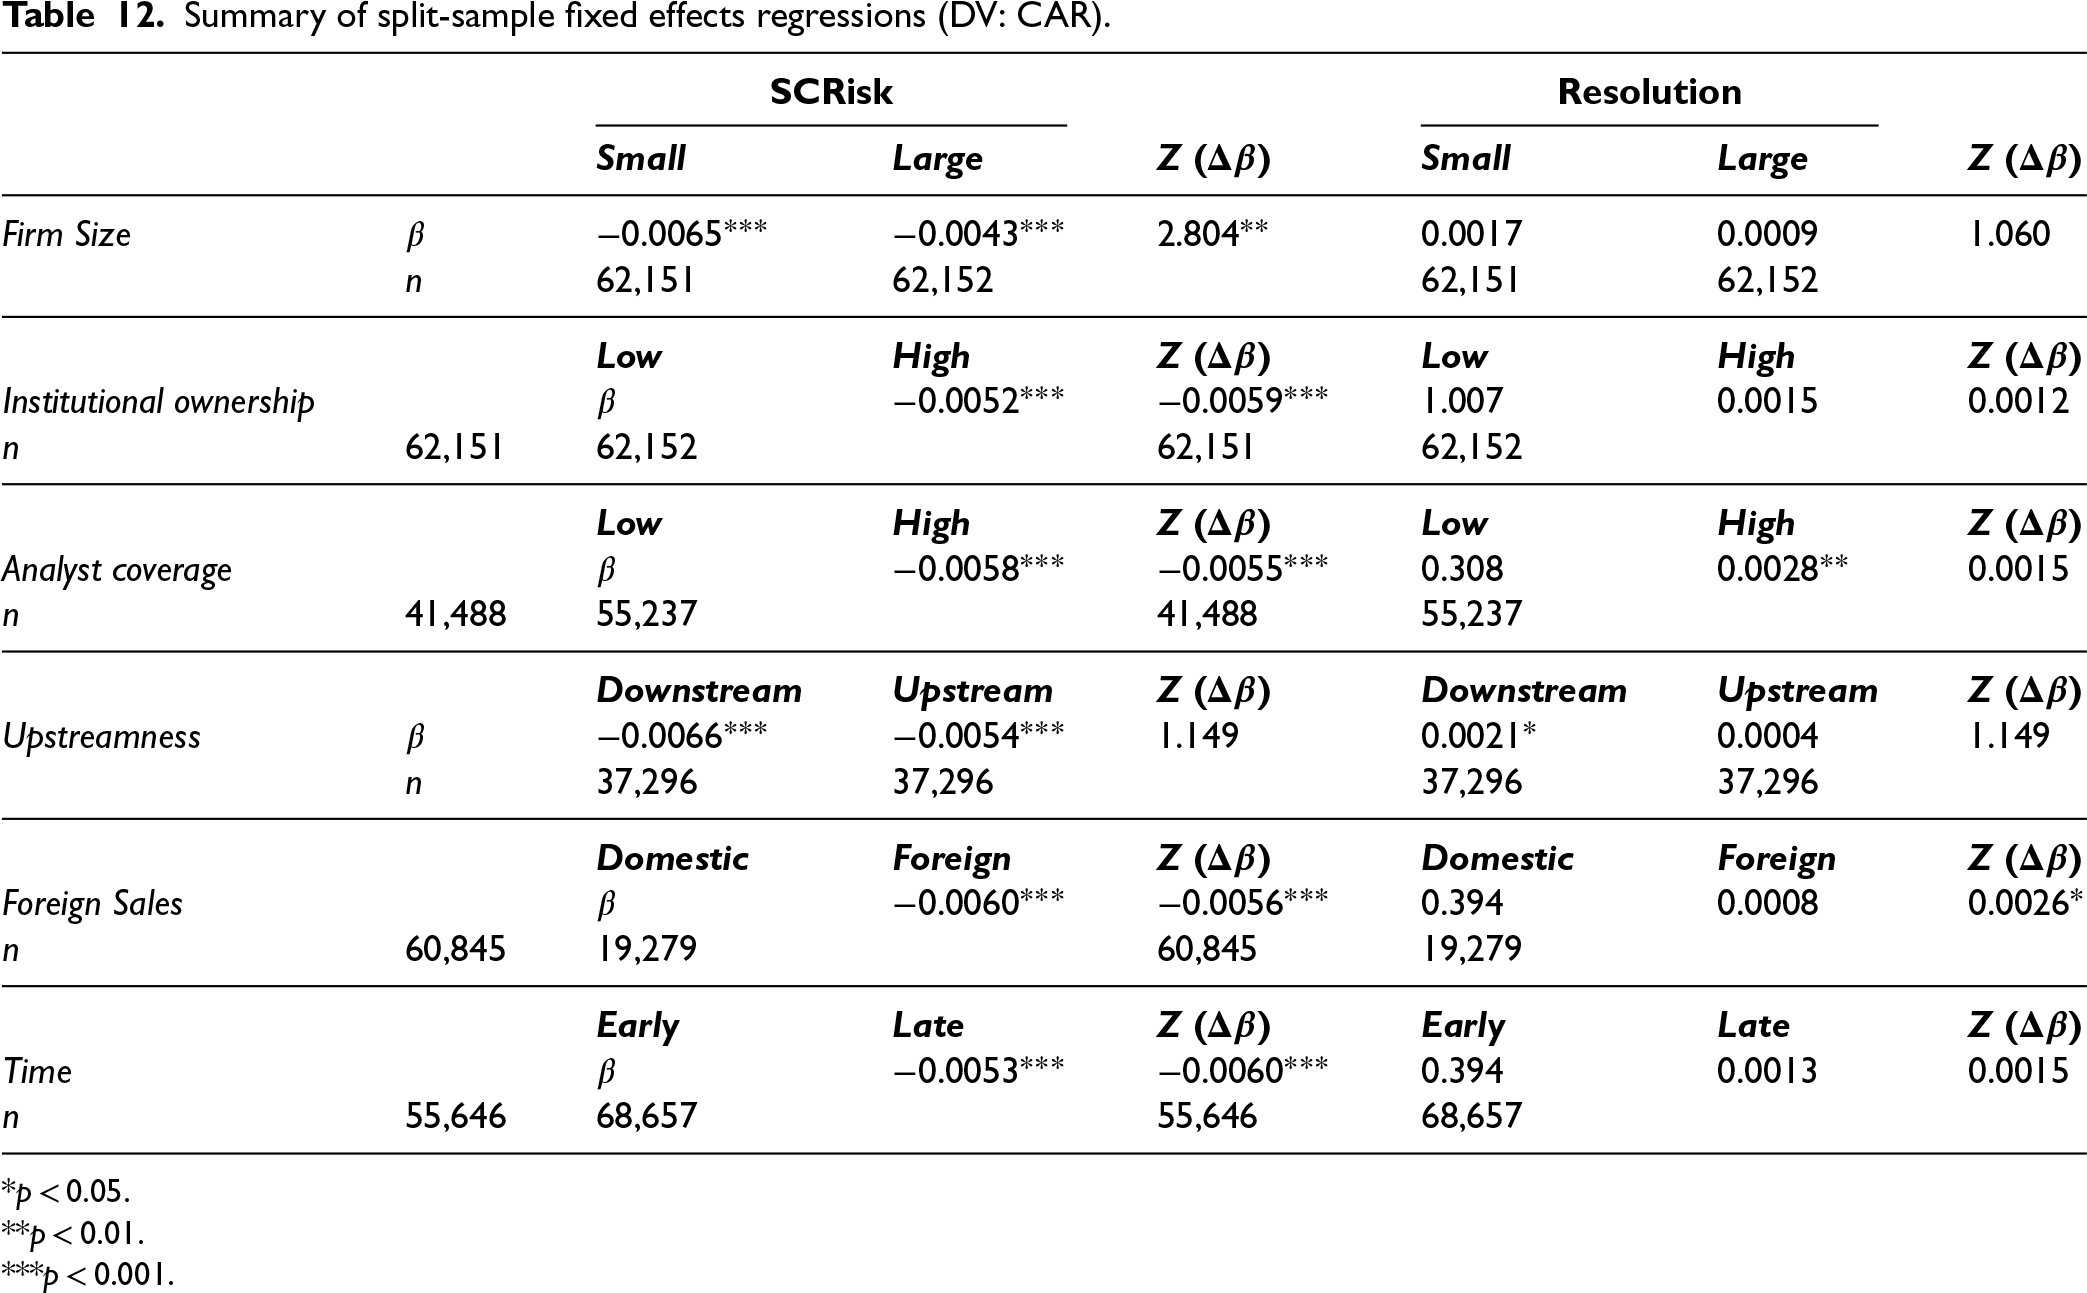
We summarize the split-sample regression results in Table 12 and provide the full estimates in Table E1 of the E-Companion. The results suggest that the adverse effect of SCRisk is significantly greater in magnitude for smaller firms than for larger firms (Z = 2.804, p = 0.005). This may reflect the market's expectation that smaller firms are less equipped to overcome supply chain risk (e.g., Chapelle, 2023). On the other hand, the effects of SCRisk and Resolution do not vary significantly with institutional ownership, analyst coverage, upstreamness, foreign sales, or time. This is surprising given that firms with higher institutional ownership and higher analyst coverage, for example, may tend to have investors with better information processing capabilities, and one might expect more discerning reactions from more sophisticated market participants. The lack of statistical evidence to this effect suggests that investors’ responses to such supply chain risk and resolution disclosures are largely uniform across firms. One explanation may be that supply chain risk is universally viewed as salient, such that even relatively more sophisticated investors do not respond differently to such information. Another potential explanation lies in the efficiency of the information environment, where the near-instant dissemination of earnings call content can homogenize reactions across a diverse array of market participants.
Summary of split-sample fixed effects regressions (DV: CAR).
Summary of split-sample fixed effects regressions (DV: CAR).
p < 0.05.
p < 0.01.
p < 0.001.
We rely on information disclosed in earnings calls to assess firms’ supply chain risk and resolution. This raises a potential concern, particularly as it relates to supply chain risk resolution, since firms might overstate their resolution efforts. While the literature suggests that such behaviors are likely uncommon given regulatory requirements (Bushee et al., 2004), analysts’ scrutiny, and the expectation of negative market reactions to incomplete or incorrect information (Matsumoto et al., 2011), we cannot rule out such a concern. This raises two important questions that we address here. (a) Is there evidence that resolution-related language in earnings calls is not mere rhetoric and, therefore, a credible signal that market participants interpret and value? (b) In instances where firms’ resolution claims may be perceived to be largely rhetorical, is the effect of Resolution on CAR diminished?
Assessing the veracity of firms’ supply chain risk resolution claims is challenging since there is limited publicly available information to validate such claims. Our approach, therefore, is grounded in the notion that true resolution efforts should typically result in lower subsequent supply chain risk, all else equal. To capture this, we regress a firm's SCRisk on its Resolution lagged by one quarter using moving windows of eight firm-quarter observations. This ensures that we obtain relatively recent assessments of the effectiveness of a firm's resolution efforts while also ascertaining a sufficient minimum sample size. In particular, we limit this regression analysis to firms and quarters for which SCRisk and lagged Resolution data are available for at least five out of eight trailing quarters, with at least one of these quarterly observations including a non-zero Resolution score. In this manner, we fit 46,295 firm-specific moving window regressions that yield an average R-squared of 15.17%, indicating that Resolution explains about 15% of the variance in subsequent SCRisk. Resolution carries a negative coefficient estimate in 57.1% of all cases, indicating that greater Resolution tends to be associated with lower SCRisk in the subsequent period for the majority of firm-quarters. We set the binary Rhetoric1 variable to 0 when βResolution < 0, and Rhetoric1 = 1 otherwise. Rhetoric1 represents whether investors are likely to discount the firm's resolution claims made in earnings calls. As a robustness check, we also define an alternative rhetoric measure, Rhetoric2, that shifts the eight-quarter window of observations to include the current quarter Resolution and regress leading SCRisk on current Resolution rather than current SCRisk on lagged Resolution.
We then examine if the effect of Resolution on CAR differs by rhetoric (Rhetoric1, Rhetoric2). The results are summarized in Table 13 below. As before, we find that Resolution is positively associated with CAR (β = 0.0014, p < 0.05). The coefficients of the rhetoric measures and their interaction with Resolution are not statistically significant. Hence, we observe neither an adverse effect of rhetoric nor a diminished effect of Resolution when a firm's resolution-related statements are likely to be perceived as rhetorical.
Fixed-effects regressions controlling for Rhetoric (DV: CAR).
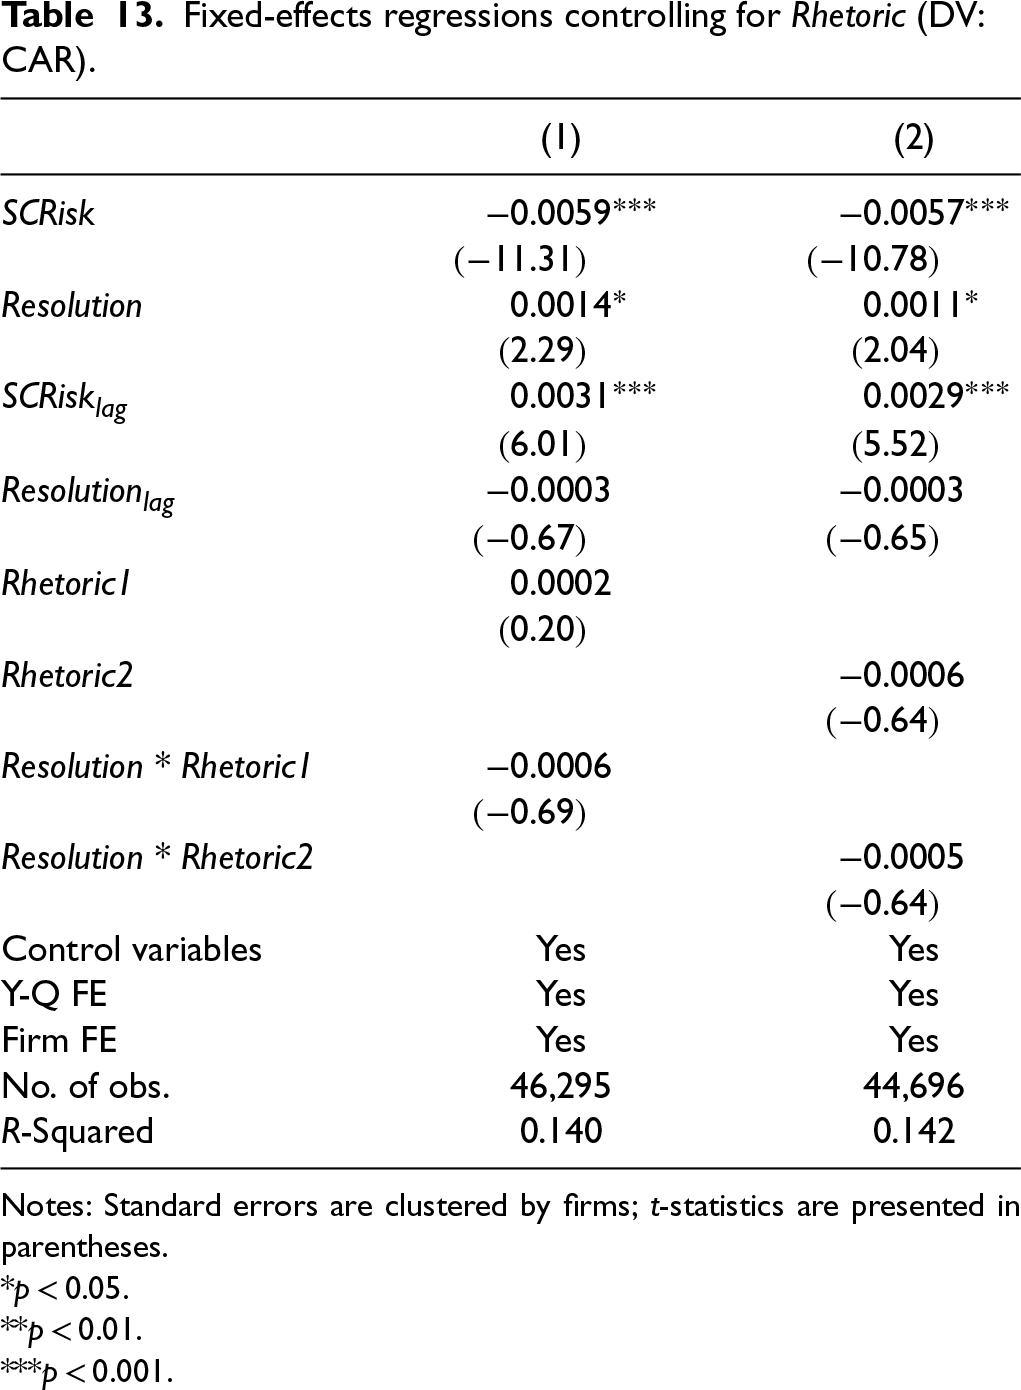
Fixed-effects regressions controlling for Rhetoric (DV: CAR).
Notes: Standard errors are clustered by firms; t-statistics are presented in parentheses.
p < 0.05.
p < 0.01.
p < 0.001.
To explore whether rhetoric matters more for some firms than others, we examine whether the same contingencies explored in Section 4.3.2 and prior SCRisk alter how Rhetoric1 moderates the effect of Resolution on CAR. The full estimation results are reported in Table E2 in the E-Companion. The only significant three-way interaction is observed for Resolution × Rhetoric1 x logAssets (β = −0.0009, p < 0.05). Hence, Rhetoric1 diminishes the (positive) effect of Resolution on CAR as firm size increases. This finding may be attributable to the greater scrutiny and attention larger firms receive, such that rhetorical statements are more likely to be identified as such and, thus, have a greater adverse effect on the market's assessment of a firm's Resolution efforts.
Consistent with prior related literature, we also implement a Fama-MacBeth regression analysis (Alan et al., 2014; Singhal and Wu, 2024). Specifically, we estimate the following cross-sectional regression model for each quarter t individually:

This model is estimated for all 48 quarters separately. Table E3 in the E-Companion reports the means of the estimated coefficients across all quarters. Consistent with the panel regression results, the coefficient of SCRisk is negative and significant (β = −0.0059, p < 0.001). The coefficient of Resolution, while positive, is not statistically significant at conventional levels.
This study examines how supply chain risk and supply chain risk resolution affect firms’ stock returns. In so doing, our work builds on prior research that assessed market reactions to discrete and comparatively rare supply chain disruption events (Hendricks and Singhal, 2003; Jacobs et al., 2022). As firms can be exposed to varying degrees and forms of supply chain risk that may not always culminate in publicized and well-documented disruption events, we develop firm-level measures of both supply chain risk and resolution using textual data from firms’ earnings calls. The regression analysis indicates that a one-standard-deviation increase in SCRisk is associated with stock returns that are 0.56% lower. When such high SCRisk levels persist in all four quarters, this can add up to 2.24% lower stock returns annually. Thus, our results illustrate the potentially significant economic impact of SCRisk, especially given that stock returns have averaged about 10% annually in the last two decades. As expected, our estimates are smaller in magnitude compared to prior studies’ findings of average stock market reactions to discrete materialized supply chain disruption events in the −7% to −8% range (Hendricks et al., 2020; Jacobs et al., 2022). Still, our results underline the importance of considering supply chain risk beyond specific materialized disruptions and assessing its impact on the broader universe of firms beyond those involved in or exposed to high-profile risk events.
Further analyses indicate that the negative effect of supply chain risk is significantly greater for smaller firms than for larger firms. The stronger effect observed among smaller firms may reflect the stock market's expectation of lower future performance given smaller firms’ operational vulnerability and limited capacity to mitigate supply chain risk with constrained resources (Hendricks and Singhal, 2003). At the same time, we find that the negative effect of supply chain risk on stock returns does not vary with firms’ institutional ownership, analyst coverage, upstreamness, foreign sales, or over time. This underscores the consistency of the stock market reaction to supply chain risk across different types of firms and settings.
A key contribution of our work is the measurement of supply chain risk resolution and the assessment of its effect on stock returns. We find that the returns of firms in the highest supply chain risk resolution quintile are, on average, 0.12% higher compared to the stock returns of firms in the lowest quintile. Regression analyses indicate that a one-standard-deviation increase in resolution increases stock returns by 0.08%. Less than 25% of the firm-quarter observations studied here include evidence of supply chain risk resolution-related content in earnings calls. When such content is discussed, a one-standard-deviation increase in resolution increases stock returns by 0.29%, indicating that investors value efforts to mitigate supply chain risks, and the negative effect of SCRisk can be mitigated to some extent with resolution efforts.
Our research has several implications. First, market participants are attuned to and react to supply chain risk content in earnings calls. This should not be misconstrued as an incentive for firms to minimize the disclosure of supply chain risks in earnings calls. Our empirical estimates show that SCRisk content in both the presentation and Q&A portions of calls is associated with lower stock returns. It is conceivable that firms’ failure to proactively disclose supply chain risks will cause analysts and investors to raise the issue later and thus generate more extensive supply chain risk-related discussions. In turn, this can potentially generate even greater adverse stock market reactions. In addition, the erosion of stakeholder confidence resulting from firms’ failure to disclose supply chain risks could further amplify associated content in future earnings calls and thereby generate adverse stock market reactions in the future. Second, our results suggest that firms exposed to supply chain risks should disclose actions taken to resolve supply chain risks, as such disclosures can mitigate the negative effect of supply chain risks. While efforts to resolve supply chain risk are costly and may not always be effective, our study shows that the market values these efforts. The stock market's reaction to supply chain risk disclosures can be attenuated by engaging in and highlighting efforts to mitigate and resolve supply chain risks. Third, analysts and investors can derive value from assessing supply chain risk as they evaluate firms’ current and future performance, and firms can similarly benefit from such knowledge in the context of evaluating and selecting upstream or downstream supply chain partners. Moreover, tracking supply chain risk over time can assist with devising and evaluating the effectiveness of resolution strategies.
Future research can build on our work by conducting further empirical studies on supply chain risk and supply chain risk resolution. First, it may be interesting to decompose and measure supply-side and demand-side supply chain risk effects. This is particularly relevant since recent research shows that upstream and downstream uncertainty can have asymmetric effects on firm behavior and valuation (Grigoris and Segal, 2025). The challenge here is that the language used in earnings calls to discuss upstream versus downstream supply chain risk may often be very similar, and supplier and customer networks often overlap. Second, there is an opportunity to refine the assessment of supply chain risk in terms of quantity (or frequency) and quality (or intensity). This could be accomplished, for example, by correlating supply chain risk content discussed in earnings calls with post-call media content and using the sentiment of such post-call content to evaluate the quality of supply chain risk. Relatedly, researchers might take a more granular approach and distinguish between various forms of supply chain risk and supply chain risk resolution. Such an effort, which will require the use of predefined topical categories, will enable researchers to discern any differential effects on performance. Researchers might also map specific resolution efforts to specific types of supply chain risk and, thus, study the temporal links between the emergence of supply chain risks and the resolution of such risks as well as distinguish between proactive and reactive resolution efforts. Third, further research might explore the firm-level or supply chain partner-level drivers of supply chain risk or examine the factors contributing to greater supply chain risk resolution. Fourth, future research could also consider whether text-based measures of supply chain risk can be used for pricing options. Collectively, such work will advance the supply chain and operations management literature by shedding light on the antecedents and outcomes of supply chain risk and supply chain risk resolution.
Supplemental Material
sj-pdf-1-pao-10.1177_10591478261420550 - Supplemental material for Supply Chain Risk and Resolution: An Empirical Study of Stock Market Reactions
Supplemental material, sj-pdf-1-pao-10.1177_10591478261420550 for Supply Chain Risk and Resolution: An Empirical Study of Stock Market Reactions by Keno Theile, Christian Hofer, Vinod R Singhal and Kai Hoberg in Production and Operations Management
Footnotes
Acknowledgments
The authors thank Sridhar Seshadri (the department editor), the associate editor, and three referees, whose constructive comments have significantly improved the paper. They also gratefully acknowledge the financial support provided by the Sam M. Walton College of Business.
Declaration of Conflicting Interests
The authors declared no potential conflicts of interest with respect to the research, authorship, and/or publication of this article.
Funding
The authors received financial support from the Sam M. Walton College of Business for the research, authorship, and/or publication of this article.
Notes
How to cite this article
Theile K, Hofer C, Singhal VR and Hoberg K (2026) Supply Chain Risk and Resolution: An Empirical Study of Stock Market Reactions. Production and Operations Management xx(x): 1–21.