In software markets, the sheer number of available applications makes it rather challenging for any given new one to stand out and be noticed by consumers. Moreover, a push towards privacy by regulators and consumers is making it harder to target consumers. As such, firms have to rely on more non-targeted go-to-market strategies. We explore two popular strategies through which developers can catalyze adoption by helping consumers directly or indirectly learn the value of their products—seeding (free full-feature product giveaways to a subset of the consumer base) and time-limited freemium (TLF). Seeding, as a business strategy, existed for a long time. On the other hand, the feasibility to offer market-wide TLF became mainstream more recently, with the advent of the Internet and a plethora of digital tools. Thus, a natural question emerges—if TLF represents nowadays a feasible and easily implementable strategy for software applications, has seeding approach been rendered irrelevant in these markets? In this study, we provide managerial recommendations on when each of these strategies with a free full-feature-consumption component is optimal, based on social and self-learning dynamics, consumer priors, adoption costs, and individual product value depreciation. To that end, under a multi-period parsimonious unifying framework, we show that becomes dominated as free trials enter the picture. We identify two specific market factors that, when present, can induce seeding to be optimal when consumers initially underestimate true product value—(i) user adoption costs and/or (ii) individual depreciation of value by usage. Moreover, we show that these two factors have a moderating effect on the impact of word-of-mouth (WOM) effects on the optimality of seeding. In the absence of these factors, stronger WOM effects alone cannot give seeding an edge against the other business strategies. However, once either depreciation or adoption costs are accounted for, strong WOM effects increase the relevance of seeding (enlarging its optimality region in the parameter space). Our results remain qualitatively consistent under a battery of robustness checks.
The software app markets have experienced tremendous growth during the last decade thanks to the advances in Internet technologies, the widespread use of desktop and mobile devices, and a lower entry barrier for developers. Microsoft, for Windows 10 alone, has facilitated compatibility with “over 35 million application titles with greater than 175 million application versions, and 16 million unique hardware/driver combinations” (Fortin, 2018). In the mobile space, as of April 2025, the top two app stores, Google Play and Apple App Store, boasted a combined app count above 3.4 million (Roth, 2025).
However, in today’s saturated app market, significant profits (and thus market success) can be elusive for developers. Recent analyses report that fewer than 20% of mobile apps earn $1K per month within their first two years, while the top 1% of publishers capture over 90% of global mobile app revenue (Cruz, 2022; RevenueCat, 2025). A major challenge for both desktop and mobile app startups is gaining traction early, in the critical stages of the adoption process (Gokgoz et al., 2021). It is well established that consumers adopt software based on their own initial perceptions of the product’s value—often referred to as “priors”—which may align with or deviate substantially from the actual real product value (Chen et al., 2021; Shulman et al., 2015; Weathers et al., 2007; Zhang et al., 2022). Consumers can update their valuation of the product via several learning mechanisms. On the one hand, consumers can engage in social learning via word-of-mouth (WOM), allowing their perceptions to be shaped to a certain degree by the opinions of other consumers or experts. On the other hand, if consumers interact with the product directly, they can engage in self-learning, whereby they update their priors on the value of the product upon using it for a period of time. The emergence of widely available generative artificial intelligence (GenAI) assistants and agents is showing great potential to alter this valuation learning process even further.
Understanding the potential pre-adoption misalignment between consumer valuation perceptions and real valuations, as well as the dynamics of the consumer valuation discovery process, software producers have increasingly embraced various forms of free-consumption to steer consumer learning and induce revenue-generating adoption. Such strategies are particularly salient in the context of experience goods—a broad category which encompasses many digital goods whose value and fit are better understood by consumers once they are directly exposed to the product/service. Two popular strategies employing the free-consumption approach are seeding (S) and time-limited freemium (TLF, otherwise referred to as time-locked free trials).
Through , developers provide the full-functionality product for free to a subset of the market, counting on these seeded consumers to not only use the product but also help spread awareness and knowledge about it within their respective communities and beyond. Seeding as a business strategy has existed for a long time, since before the emergence of digital goods. What software seeding adds to the traditional seeding model is the potential for scale (and, hence, more fine-tuning) given negligible marginal costs and the ability to reach via the Internet the entire addressable market. There are many instances of software products being offered for free for non-commercial use and for a fee for commercial use. For example, many providers such as IBM, Microsoft, and SAS offer a bundle of their developer-grade products for free to students and educators. Via its Technology Impact Program, Autodesk donates free licenses for many of its products to nonprofits, startups, and entrepreneurs that use design for environmental or social good. Seeding is also a popular strategy within mobile app markets via free app giveaways (pushed through portals such as AppAdvice, AppsFree, and Giveaway of the Day). Moreover, seeding and price discounts for a variety of products have been used as popular, albeit frowned-upon incentives by market entrants without established brands to harvest online reviews to jumpstart WOM effects (Hautala, 2022).
Under TLF, all consumers are able to try the full-functionality product at no charge during a limited trial period, after which they are required to pay for continued use. is a relatively recent business strategy—while draws its roots from traditional product sampling, the feasibility to implement a consistent, market-wide TLF strategy has truly been ushered in by the advent of digital goods and services for it relies on encapsulating a limited free-for-all consumption component with digitally encoded automatic expiration at the end of the trial period. Free trial windows typically span from a few days to a few months. TLF strategies have been employed for many categories of apps and services in domains including engineering and design (e.g., AutoCAD, VeSys, and Adobe Creative Cloud), productivity (e.g., Salesforce CRM products and Microsoft Office 365), IT security (e.g., Crowdstrike, Norton, and Bitdefender), content provision (e.g., Hulu, Apple TV+, Tidal, and Audible), health and wellness (e.g., Peloton, Calm, and Nutrium), professional and personal education (LinkedIn Learning, Rosetta Stone, and Pluralsight), just to name a few. In the mobile app market, Google Play Store and Apple App Store both allow for native implementation of for subscription-based apps (since 2012 and 2017, respectively). With the largest mobile app marketplaces nowadays aligned in supporting , accounting for free trials within the go-to-market strategy choice set for mobile app developers is of practical and timely managerial relevance. For a broader discussion of how our analysis is relevant to the mobile sector, please see E-companion I.
Recent privacy regulations across major jurisdictions (e.g., the EU’s General Data Protection Regulation; the California Consumer Privacy Act and Colorado Privacy Act in the US), combined with platform-level initiatives (e.g., Apple’s App Tracking Transparency) and rising consumer awareness and proactivity toward privacy (Cisco, 2024), have sharply curtailed data-driven marketing (Aridor et al., 2025), prompting firms to revisit less targeted, more naïve approaches. If firms employ seeding, a commonly held opinion is that they would prefer to target specific customers if they could—but what if they cannot do that? In this study, we zero in on non-targeted seeding, and ask the following overarching research question: Does non-targeted seeding still merit inclusion in a software firm’s go-to-market strategy portfolio, given that firms can resort to free trials and paid (perpetual or subscription-based) licenses? Recent studies suggest that random seeding, with slightly larger seed sets, can rival targeted seeding (Akbarpour et al., 2023). While extant literature explored how seeding and free trials could be individually optimized and how they fared against other strategies, surprisingly little research exists on how these two go-to-market approaches fare against each other as mechanisms to jumpstart paid adoption. This work addresses this gap. Building on the unifying modeling framework from Niculescu and Wu (2014), we first show that in a parsimonious model incorporating social and self-learning but abstracting away from other adoption and usage factors, always comes short relative to other considered strategies. While, absent , has been previously shown to be optimal in regions where consumers initially significantly underestimate the value of the app (Niculescu and Wu, 2014), this is no longer the case when free trials enter the picture. This is due to how and differ in their leveraging of demand cannibalization as well as social versus self-learning, as detailed in Section 3.3. The inability, under , to monetize seeded customers later on is part of what gives a decisive edge in the baseline setup.
But should we take as a foregone conclusion that non-targeted is always a dominated strategy and just ignore it? As a second research objective of our work, we seek to identify specific factors that, when accounted for, support market scenarios under which is the optimal strategy, even in the presence of . By identifying such factors, we aim to add further nuanced richness to the theories around go-to-market strategies when consumers learn their own product valuations. Offering some form of free access to the full product involves a delicate balance act, due among others to (i) intrinsic adoption costs and (ii) the potential for value depreciation with use. Hence, we found it a natural starting point to focus on the impact that these two factors have on the optimality of various developer strategies. Adoption costs1 can undermine the effectiveness of both and (and of other strategies as well) as some consumers may shy away from exploring the product in the first place even when there is some free access to it. That being said, when customers initially significantly undervalue the product, has the edge over due to seeded customers receiving a perpetual license which extends beyond the duration of a free trial, yielding higher willingness to take advantage of the free offer. Value depreciation through use, otherwise referred to as individual depreciation (Dou et al., 2017),2 can also dilute the benefit of free trials () should consumers be able to utilize the software for a significant portion of their needs before the trial ends. Under , when customers significantly underestimate the value of the product, the developer gets better opportunities (relative to the other models) to monetize future periods by delaying most paid adoption beyond initial period, allowing seeds to spread WOM and the rest of customers to update their priors upwards, ensuring that a substantial portion of the unseeded consumer population has not yet depleted value through usage before reaching higher willingness to pay (WTP) through social learning. Individual depreciation is present when the user’s need is limited in scope and scale in general.3 Furthermore, in the mobile space, users tend to lose interest in many installed apps relatively quickly and the retention rates drop to single-digit percentages for the majority of app categories after only one month (Statista, 2025). Individual depreciation is also present when consumption is more hedonic (e.g., video games, music, and movies), switching costs are negligible, and consumers constantly search for the “next” great experience.4 On the other hand, tactical enterprise applications that are used for daily operations (e.g., enterprise resource planning; EMR = Electronic Medical Records systems, electronic medical records systems, payment systems, cloud storage, and IT security solutions) are likely to exhibit low individual depreciation as their value to consumers is not expected to decline through use.
We do confirm that these two factors (considered separately and together) lead to outcomes in which non-targeted seeding can dominate TLF (and other non-free models) when customers significantly underestimate the value of the product. While our study does not completely dispute the continued viability of more naïve seeding as a strategy in today’s markets for digital goods, we find that more stars need to align to warrant its use. Our results remain consistent under multiple robustness checks (including the presence of both depreciation and adoption costs, endogenous depreciation, heterogeneous priors, generalized WOM effects, imperfect learning, and compounded learning over multiple periods). Interestingly, we show that the two aforementioned additional market factors are also moderators for the effect of WOM on the optimality of the seeding strategy. In their absence, WOM effects alone do not help the seeding strategy dominate the other strategies. Nevertheless, if adoption costs or individual depreciation are present, stronger WOM effects do lead to a larger region of the parameter space where dominates. In addition to advancing the theory around market seeding strategies (and, more generally, around strategies with a free component), our insights carry significant managerial relevance: they inform when non-targeted seeding should still be considered, and more generally when several go-to-market strategies are optimal, contingent on parameter space regions. Lastly, we show that the advent of GenAI can shift the market into narrower regions of the parameter space in which free-consumption strategies including seeding can particularly shine, further underscoring the timely relevance of our study.
Literature
Our novel theoretical contributions lie predominantly within the space of the economics of free, advancing the research agenda on the impact and optimality of seeding strategies. For brevity, the discussion in this section centers on this core literature. For completeness, we present in E-companion H the related literature on free trials—a directly connected but secondary stream relative to our main research focus. At the same time, we do acknowledge that our modeling framework integrates modeling elements from several complementary literatures (including multi-period adoption of digital goods, impact of WOM effects on adoption, consumer valuation discovery, and individual use-based value depreciation). Relevant works in these ancillary research streams are referenced throughout the main body of the article, as we introduce various go-to-market models.
The literature on the seeding business model is rich, exploring various related research questions including optimality of such strategies. At a market level, abstracting from the network structure, several studies employed adaptations of the Bass (1969) model to explain how firms can employ seeding to jumpstart and accelerate the product diffusion process (Jain et al., 1995; Jiang and Sarkar, 2010; Lehmann and Esteban-Bravo, 2006). Another segment of this literature focuses on how to optimize (or nearly optimize) targeted or stochastic seeding strategies contingent on the topology of the network and the optimization objective (Chen et al., 2017; Cui et al., 2018; Galeotti and Goyal, 2009; Haenlein and Libai, 2013; Kim et al., 2015; Libai et al., 2013; Schlereth et al., 2013; Wilder et al., 2018). Aral et al. (2013), Nejad et al. (2015), and Nejad and Amini (2024) explore the role of consumer homophily on the effectiveness of seeding campaigns. Dou et al. (2013) look at how seeding and social media features can be used in tandem to engineer optimal network effects in markets for digital goods and services. Niculescu and Wu (2014) find that uniform seeding dominates feature-limited freemium and no-promotion strategies when consumers significantly underestimate a priori the value of the product. Lin et al. (2019) show that free sampling promotions (including seeding5 ) can have positive effects on product ratings—in other words, seeding can be an effective tool to harvest positive reviews early on in the diffusion process. Han et al. (2021) explore scenarios in which seeding is a desirable strategy for either manufacturer or retailer in a supply chain. Interestingly, recent studies by Chin et al. (2022) and Akbarpour et al. (2023) suggest that targeted seeding might not be more effective, and even possibly less effective, than random seeding. Cui et al. (2024) show that the performance of targeted seeding versus random seeding depends on the consumers’ propensity to spread negative WOM.
Surprisingly, despite the widespread use of free trials in software markets, the direct comparison of optimal seeding against , as go-to-market strategies capitalizing on free consumption, remains largely unexplored. Schlereth et al. (2013) conduct a numerical optimization of the market coverage of seeding and under exogenous pricing that is kept constant across the sampling methods. They do not draw conclusions as to which strategy dominates in any given parameter range and they do not benchmark these two business models with free consumption against other no-promotion models in terms of profits. To the best of our knowledge, our study is the first to compare and contrast S, TLF, and business models with no promotion (under both perpetual and subscription-based licensing) within a unified framework accounting for WOM effects, endogenous pricing, adoption costs, and individual use-based value depreciation. Building on the learning framework from Niculescu and Wu (2014), we show that the optimality of seeding previously identified in that study (in the scenarios in which consumers initially underestimate the value of the product) vanishes once free trials enter the strategy set, regardless of the strength of network effects or imperfect learning. Nevertheless, not all is lost for seeding, as we uncover two factors—adoption costs and individual depreciation—that, when accounted for in the model, can restore uniform seeding as the dominant strategy within certain regions of low consumer priors, even when free trials are an option. Collectively, our study contributes both modeling and theoretical advances to the understanding of non-targeted seeding optimality in software markets. Other secondary theoretical contributions (some relegated to the E-companion) include explorations of how the optimality regions fluctuate for various strategies contingent on model parameters.
Baseline Model
Supply Structure and Candidate Business Models
We consider a scenario in which a firm has already developed a software product and is exploring the most profitable way to commercialize it. At this pre-release stage, all the development costs are sunk. In the main setup, we consider a product that has a life span of two periods, after which it becomes obsolete. We show in Section 6.3 that our findings remain robust in the context of a longer horizon as well. The marginal production cost and the time discount factor of future earnings are considered negligible. The firm aims to maximize the undiscounted profit over two periods. Consistent with established literature (Chen and Jiang, 2021; Choudhary, 2007; Li and Jain, 2016; Niculescu and Wu, 2014; Zhang and Seidmann, 2010), we focus on scenarios where the firm can offer a credible price commitment. In our setup, the firm considers among the following four models:
Charge for everything - perpetual licensing (CE-PL): Consumers pay a one-time fee at the time of adoption, which in turn grants them the right to use the product throughout its remaining life (i.e., until its obsolescence horizon) without any additional charges.
Charge for everything - subscription (CE-SUB): Consumers purchase a single-period license at the beginning of period 1 and/or 2, which expires at the end of that period. Consumers who subscribed in period 1 have the option to renew the subscription at the beginning of period 2 (but are not required to).
Time-limited freemium (TLF): All consumers have access to the product at no charge in period 1 (i.e., the free trial period). When the free trial expires, consumers are required to purchase a license in period 2 to continue using the product. In the context of two periods, only one period is left at the end of the free trial—thus, it does not matter if the paid license for period 2 is in a perpetual or subscription-based format. Nevertheless, in Section 6.3, in the context of a longer product lifespan, we do distinguish between the two types of paid licenses at the end of the free trial period.
A key distinction between TLF and lies in how each strategy cannibalizes demand to stimulate paid consumption. TLF cannibalizes demand from every potential customer for a limited period of time, leaving open the possibility to later charge each of these customers (whose priors have been updated after the free trial) for the residual value of the product after the expiration of the trial. , by contrast, cannibalizes demand from a subset of the market, albeit for the entire product life, relying on those seeded customers to influence the purchase decisions of other customers. Accordingly, TLF primarily drives paid consumption through self-learning, whereas leverages self-learning to spark WOM (which in turn, drives social learning).
Demand Structure and Valuation Learning Process
Consider a unit mass of consumers with their types uniformly distributed on . A type- consumer derives per-period benefits from using the product. Coefficient , which we hereafter refer to as quality factor, quantifies in an aggregate form core quality dimensions of the product such as reliability, versatility, efficiency, ease of use, and so on. Type captures heterogeneity in the consumers’ WTP for quality per period as a reflection of diverse needs for the product and individual fit. Consumers do not observe the true product quality before the product is released. At the beginning of period 1, prior to any paid or free adoption in the market, consumers enter the market with prior on product quality. In the baseline model, we assume a homogeneous value across consumers.6 We relax this assumption in E-companion G and explore how heterogeneity of consumer priors on quality (whereby some customers initially overestimate the quality of the product while others underestimate it) impacts the main results.
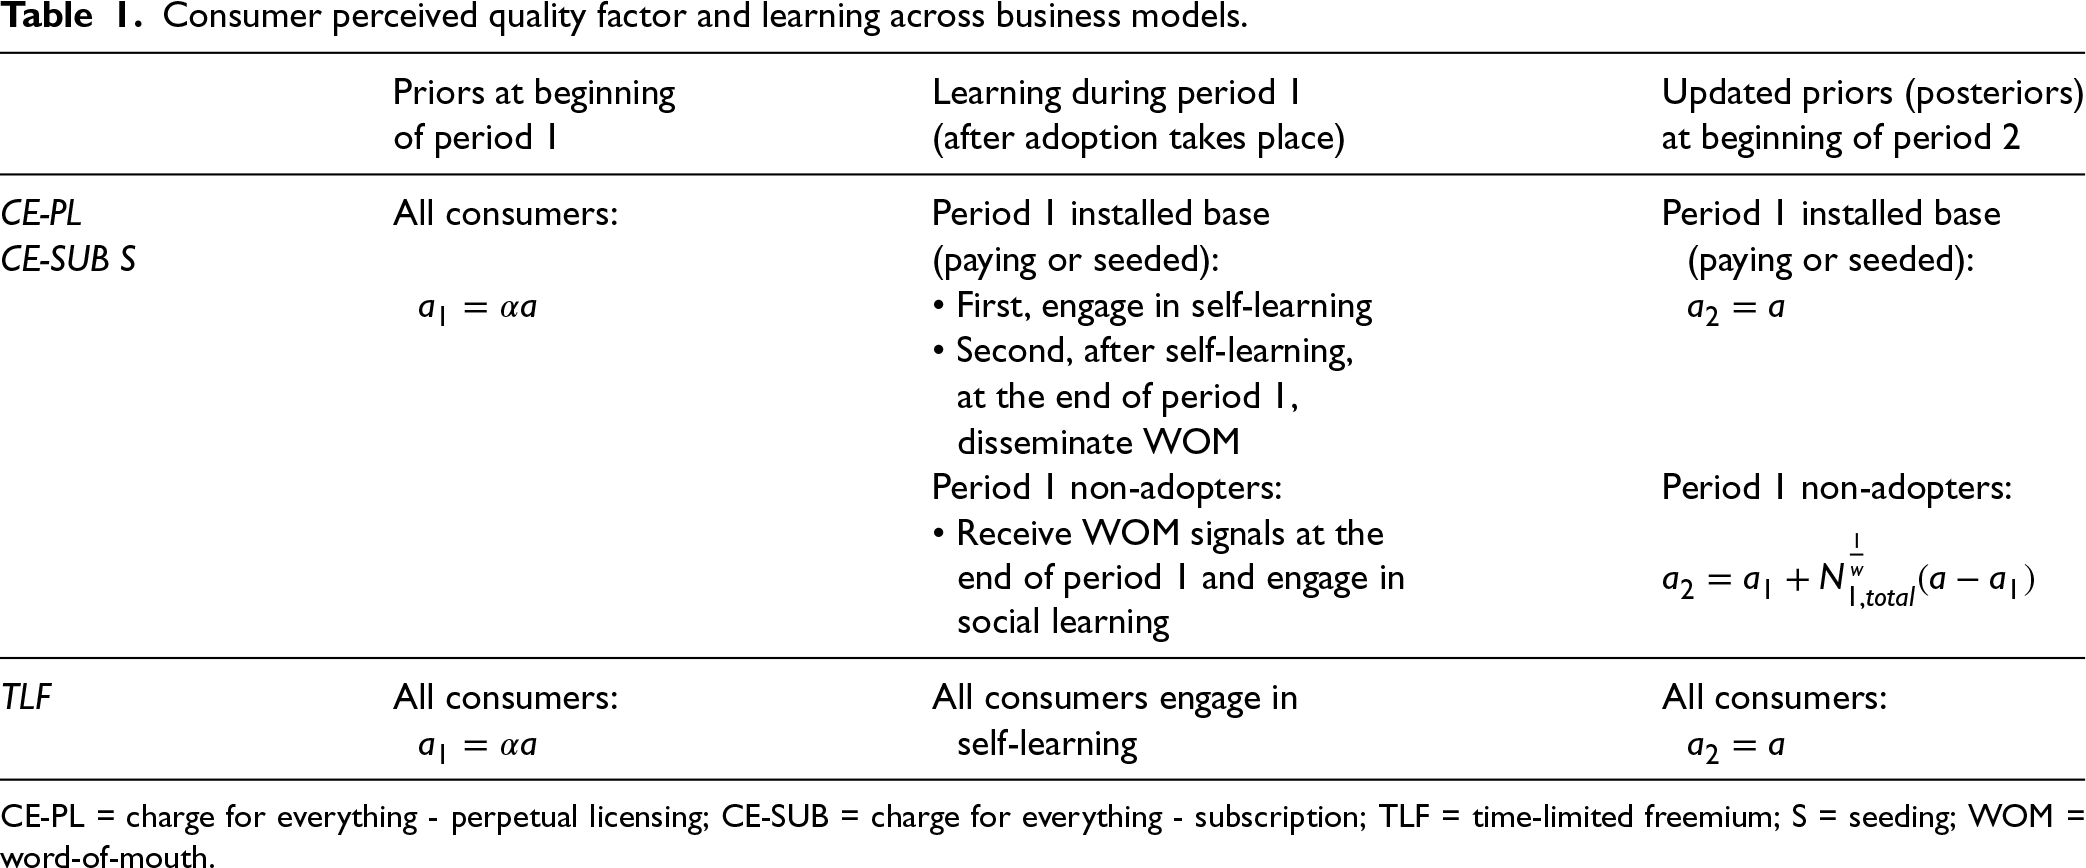
Consumers adjust their priors over time based on learning. Let denote the consumer’s perceived valuation factor at the beginning of period 2. For each period, we assume that any adoption outcome (paid, seeded, or free trial) happens at the beginning of the period whereas learning happens afterwards, throughout the period. Hence, any customer considering whether or not to purchase a license during a given period will act on their valuation priors at the beginning of that respective period. We employ the valuation learning process from Niculescu and Wu (2014), capturing in a unified framework how the value of is shaped up by self-learning via use and social learning through WOM, as follows:
Self-learning. We assume that adopting consumers (whether paying, seeded, or trying the product) can perfectly learn the product quality through one period of use. We relax this assumption in Section 6.3 in the context of imperfect learning and show that main insights continue to hold. As most software products are experience goods, adopting consumers can directly update their priors through their own hands-on experience, which is not necessarily affected by the opinions of others.
Social learning via WOM. Non-adopters in period 1 (for all models except TLF), while deprived of direct, own experience with the product, indirectly adjust their priors on quality by learning from the “buzz” (WOM) spread by the period 1 adopters. This takes place at the end of the first period, after adopters self-learned the valuation of the product and started sharing their signals with non-adopters. We employ the exact same parameterization of social learning as by Niculescu and Wu (2014), whereby non-adopters in period 1, after social learning, enter period 2 with the following updated priors:
where is the total number of period 1 adopters (including both paying and non-paying adopters, if any)7 and is the strength (i.e., the degree of persuasiveness) of the WOM effects.
We refer readers to Niculescu and Wu (2014) for an elaborate discussion of how this WOM-based social learning model is anchored into and motivated by the rich research streams on (i) factors that affect the magnitude of the impact of outside signals and (ii) the stickiness/inertia of own beliefs and strategies in the presence of additional information suggesting a potential need for course correction. In a nutshell, for period 1 non-adopters, the updated prior at the beginning of period 2 is a weighted average between the older prior at the beginning of period 1 and the signal sent by period 1 adopters after they had experienced the product. The weight of the new signal () captures the overall impact of WOM effects in convincing non-adopters to deviate from their prior beliefs. This impact is shaped by two forces: (i) the volume of outside opinions (), and (ii) the degree of persuasiveness, , of these signals. In a more general context of combining priors with outside signals, Bates and Granger (1969) show that the minimum variance unbiased estimator for the updated forecast is a weighted average of the prior and the outside signals. Building on that, Zhang et al. (2021) further explain how the resulting weight of the prior in the updated forecast is decreasing in the number of available outside signals. The social learning in this article, albeit in a reduced heuristic form, remains true to the essence of these theories.
If there are any non-adopters in period 1, then . As such, is increasing in , spanning the interval as spans . A very low means that outside signals, even in large numbers, have limited power in convincing non-adopters to deviate from their priors. A high , on the other hand, means that it takes only a handful of outside signals for the non-adopters to adjust from to a value very close to the real quality factor . In scenarios in which all consumers either paid for or got free access to the product in period 1 (which is the case under TLF model), social learning becomes redundant but remains mathematically consistent with self-learning.8
We summarize the two learning mechanisms in Table 1, and our overall key notation in Table A1 in E-companion A. Consistent with Niculescu and Wu (2014), we make several additional assumptions. On one hand, while each customer knows her own type, the distribution of is not publicly known among consumers, such that they cannot infer the true quality based on the firm’s optimal pricing . On the other hand, the firm knows the consumer type distribution but does not have information on the precise type of each individual customer and can neither price discriminate nor engage in targeted seeding. Moreover, we assume a form of bounded rationality in that consumers in period 1 do not anticipate a change in their priors at a later time (they operate under the belief that their prior is the correct value of quality, especially since they do not know the distribution of and they cannot anticipate various scenarios of how demand will be realized).
Consumer perceived quality factor and learning across business models.
Priors at beginning
Learning during period 1
Updated priors (posteriors)
of period 1
(after adoption takes place)
at beginning of period 2
CE-PL
All consumers:
Period 1 installed base
Period 1 installed base
CE-SUB S
(paying or seeded):
(paying or seeded):
• First, engage in self-learning
• Second, after self-learning,
at the end of period 1,
disseminate WOM
Period 1 non-adopters:
Period 1 non-adopters:
• Receive WOM signals at the
end of period 1 and engage in
social learning
TLF
All consumers:
All consumers engage in
All consumers:
self-learning
CE-PL = charge for everything - perpetual licensing; CE-SUB = charge for everything - subscription; TLF = time-limited freemium; S = seeding; WOM = word-of-mouth.
Without any loss of generality, we normalize the true quality factor to . Moreover, the main results are derived under moderate strength of WOM effects (). We relax this assumption and explore numerically in Section 6.2 how the results hold under varying strengths of WOM effects.
Dominant Strategy
The individual equilibrium solutions for each of the four strategies under the baseline setup are presented in E-companion B, in Propositions B.1 to B.4. We point out that the optimal pricing solutions under CE-PL and S (in Propositions B.1 and B.4) are reproduced directly from Niculescu and Wu (2014). Note that CE-PL is essentially a special case of model S with the seeding ratio set to zero. For clarity of exposition, for a given parameter set, we consider CE-PL to dominate S if the profit optimization under model S yields . Below, we present the dominant strategy, when comparing among the considered four models, for each region of the parameter space.
[Dominant strategy in baseline model] Under the baseline setup, there exists 9 such that the firm’s dominant strategy is:
TLF, if ;
CE-SUB, if ;
CE-PL, if .
In addition, TLF yields the highest social welfare among the four models.
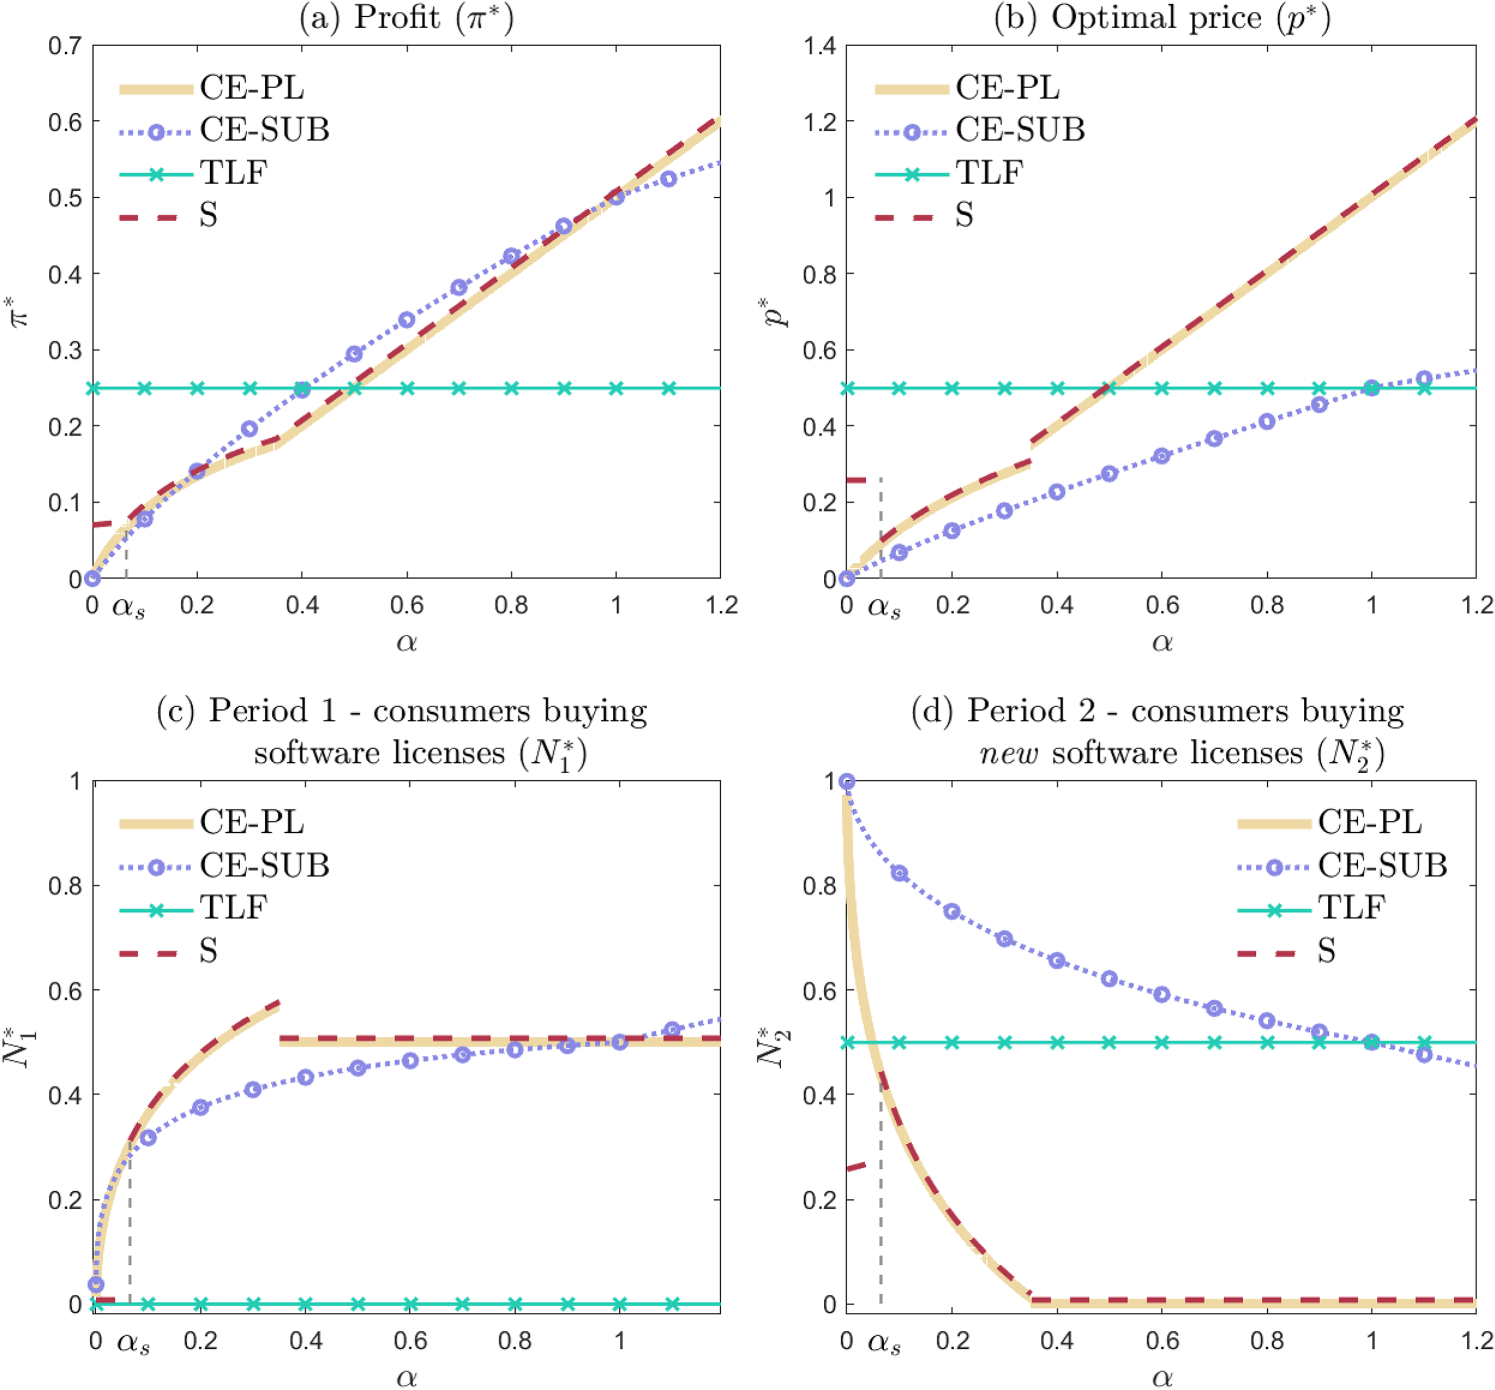
All proofs are included in the E-companion. Figure 1 illustrates the firm’s optimal price and ensuing adoption pattern and profit under each of the four strategies. Note that, in panel (b), under CE-SUB the price is per period, whereas for the other go-to-market strategies the price is for the perpetual license. Panels (c) and (d) capture the adopters paying for new licenses in periods 1 and 2, and . We point out that is different from (from equation (1)) as the latter includes all adopters (paying/seeded/free trial). In period 2, there is a nuanced distinction between “new consumers buying licenses” and “consumers buying new licenses.” In the context of CE-PL and , effectively captures new market entrants (since period 1 adopters are grandfathered into period 2 by the perpetual license). However, for CE-SUB, includes, in addition to new first-time subscribers (if any), also period 1 adopters that decide to renew the subscription, as they essentially purchase a new single-period subscription for period 2. For , represents the subset of free trial consumers that decide to continue with paid use at the end of the promotion.
Baseline setup - comparison of go-to-market strategies.
An immediate implication from Proposition 1 is that seeding a non-negligible mass of consumers upfront is never optimal, as can be seen in panel (a) of the figure. When optimizing firm strategy under in isolation, is optimal only when consumers initially severely underestimate the quality of the product ( with threshold defined in Proposition B.4). For , defaults to CE-PL - this can be seen in Figure 1 as the plots for the two strategies overlap in this -range.10 It can be shown (from Propositions B.1, B.2, and B.4 in E-companion B) that . Niculescu and Wu (2014) discuss in detail the mechanics of how dominates CE-PL under low priors and a similar argument applies to the dominance of over CE-SUB in the same region. In essence, when consumer priors on quality are low, in the absence of a free offering that would facilitate self and social learning, the firm would have to rely on a very low price in order to jumpstart adoption, thus taking in only a small profit. In contrast, in that same region, under , WOM effects do not need to be triggered by paid adoption. Instead, the firm can forfeit period 1 paid adoption altogether, and use seeded customers to ignite social learning that can induce a considerable update of the priors of unseeded customers (such that a significant number of the latter are willing to pay a substantial price in period 2 for a single remaining period of use even though they balked at paying the very same price for two periods of use at the beginning of period 1). Thus, without among available options, would emerge as the dominant strategy in this region of the parameter space.
However, in contrast to Niculescu and Wu (2014), what we find is that when TLF enters the picture, that aforementioned region of optimality for evaporates. Under optimal implementation of and, by definition, under TLF, for low enough priors, the firm does not get any paid adoption in period 1. What ultimately decides the winner between these two strategies is the revenue in period 2. Under , the seeded customers steer other customers in the direction of the right value of the quality factor. Nevertheless, as seeded customers get perpetual licenses and seeding is uniform, the firm cannot avoid seeding a fraction of the higher valuation population—however, the firm cannot afford seeding too many of the high type customers that could be payers in period 2 (under updated priors). Also, unseeded customers do not update their prior all the way to the correct value of the quality (one would need complete market seeding, that is, , for that, which would essentially erase all profits). However, under TLF, during period 1 trial, all customers update their priors all the way to the correct value of the quality factor. Moreover, the trial version is not offered under perpetual license—all customers remain in the pool of potential paying adopters in period 2. As such, the firm can collect revenue in period 2 from more high type customers, also with higher updated WTP, under TLF compared to . Hence, TLF dominates in that region.
The dominance of TLF extends well beyond all the way to . While both CE-PL and CE-SUB strategies become progressively more profitable with higher , under each of these strategies the firm is still considerably constrained by the priors and cannot price too high upfront. While both of these strategies rely gradually less and less on new period 2 adopters (which have not adopted in period 1) as consumer priors increase, the firm gives up on this component of revenue, and essentially on engendering social learning, considerably faster under CE-PL than under CE-SUB, as can be seen in panel (d) of Figure 1. Under CE-PL, social learning would have to yield more than a doubling of the priors for a period 1 non-adopter to even consider period 2 adoption (since they are now looking at only one remaining period of use before obsolescence and they balked at the same price for a 2-period perpetual license before). As increases, under CE-PL, for the firm to ensure such strong WOM thrust for period 2 new adoption to occur, it would have to induce enough period 1 adoption, which would put downward pressure on the price it charges and be suboptimal beyond a certain point. However, under CE-SUB, as increases, the firm continues to make use of both self and social learning as long as (all period 1 adopters renew subscription in period 2 and also new adopters enter the market in period 2, that is, for all ). The difference is because period 1 non-adopters under CE-SUB, relative to CE-PL, initially balked at a 1-period subscription instead of a 2-period perpetual license—thus, WOM effects do not have to be that strong to induce new adopters to enter in period 2. This added flexibility allows CE-SUB to overtake CE-PL when gets above .
It is this same flexibility that eventually enables CE-SUB to flip the tables and dominate TLF once customers only moderately or slightly underestimate the initial value of the product (). Under TLF it is optimal to have precisely half of the population paying for adoption for the second period. As increases in this region, under CE-SUB, we see from panels (c) and (d) of Figure 1 that the firm will optimally induce a little less than half of the population to pay for adoption in period 1 and a little more than half of the population to pay for adoption in period 2 (with for all ). With higher priors, the firm is able to charge a high enough per-period subscription price (for most of this region we have ), which ensures that from two periods it will collect more revenue than under TLF.
If consumers initially overestimate the product (), then CE-PL strategy has the upper hand as it relies only on period 1 adoption, charging consumers for two periods before they get a chance to update their priors (downwards) through learning. On the other hand, both TLF and CE-SUB are impacted by consumer valuation learning, which (under either self-learning or social learning) leads to a downward calibration of priors and, implicitly, of the consumers’ WTP.11
In terms of social welfare, TLF dominates. Since price represents an internal transfer, with development costs sunk and negligible marginal costs, residual social welfare amounts to consumer surplus. Under TLF, all customers get to use the product in period 1, and the top half of them (in terms of valuation) pay for it also in period 2. None of the other models achieve an aggregate product use similar to TLF. What this translates to is that the firm will choose a socially optimal strategy only when consumer priors are low (i.e., ).
Model With Individual Depreciation
In the baseline scenario, we assumed that consumers can extract value from the product at the same rate for as long as they use it. However, as discussed in the Introduction, certain products exhibit individual depreciation, whereby consumer satiation, diverted interest, or a limited need can lead to reduced product valuation past first (initial) period of use (Dou et al., 2017; Tan, 2024). Han et al. (2016) showed that individual depreciation occurred widely in the intertemporal use of information goods and services. They found that, among mobile apps, the satiation level was the highest for portal search apps (which users tend to use briefly, for quick searches), and the lowest for communication apps (which consumers use at a sustained level to interact with others). According to Statista (2025), consumer interest is shortlived for many installed apps, with retention rates plunging to single digits after only a month. Zooming in on the video game industry, studies by Shiller (2013) and Ishihara and Ching (2019) further corroborate the presence of individual depreciation.
To capture this effect, we propose an adjustment to our baseline model. More specifically, for period 1 adopters, the value they can extract from period 2 scales by a factor .12 On the other hand, period 1 non-adopters are not affected by individual depreciation (their perceived period 2 valuation can only be impacted by WOM effects). In other words, period 1 usage cannibalizes period 2 benefits. We assume that is common knowledge.13 In this section, we consider to be exogenously determined. Thus, we look exclusively at the post-development go-to-market strategy, considering already sunk the costs for any (additional) features and content that can impact depreciation. We relax this assumption in Section 6.1, endogenizing in the context of a more general model, and show that the main insights continue to hold qualitatively. The separate equilibrium solutions for each of the four strategies under the individual depreciation scenario are presented in E-companion C, in Propositions C.1 to C.4. Below, we characterize the dominant strategy, when comparing among the four considered strategies, for each region of the parameter space. We point out that the individual equilibria and the comparison of strategies are highly non-trivial, with the depth of the analysis included in the proofs.
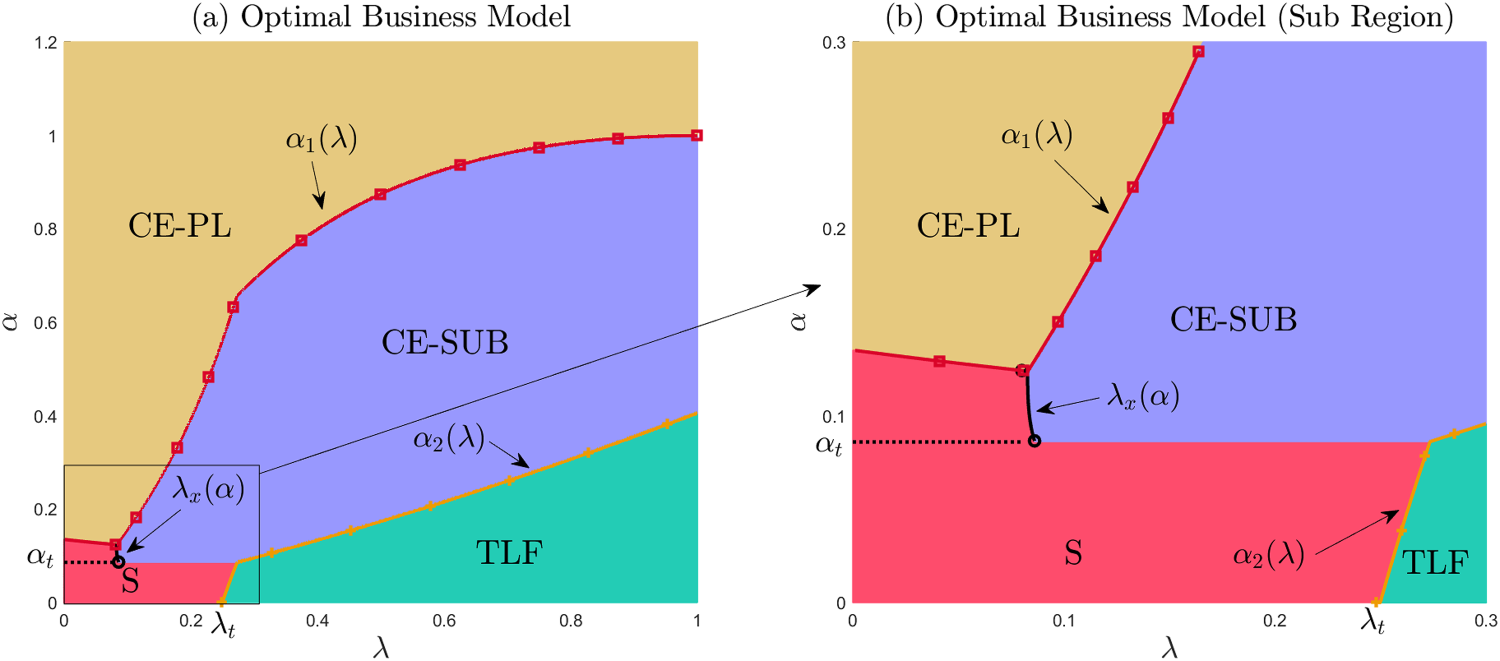
In the presence of individual depreciation, the firm’s dominant strategy, as illustrated in Figure 2, is:
CE-PL, if (yellow region);
TLF, and (green region);
Otherwise,
CE-SUB, if and (purple region);
S, otherwise (red region).
Functions , , , and exogenous thresholds and are defined in E-companion C and marked in Figure 2. In addition, yields the highest social welfare among the four models.
Setup with individual depreciation - optimal strategies. Panel (b) represents a zoomed-in snapshot of the left-bottom corner region from panel (a).
Comparing Propositions 1 and 2, we see that individual depreciation plays a non-trivial role in determining which strategy is dominant in various regions of the parameter space. We recognize Proposition 1 results as the vertical slice at in panel (a) of Figure 2. In contrast to the baseline setting, in the presence of individual depreciation, a major difference is that S can emerge as the optimal strategy—that happens in scenarios involving concomitantly severe individual depreciation through use and significant prior underestimation of the product value (both and small enough). In this region, offering the product for free to a fraction of the population leads to a significant update in the product valuation for the rest of the consumers. This allows the firm to charge a substantial price under , with paid adoption taking place in second period only, following the realization of WOM effects, thus leaving unseeded population largely unaffected by individual depreciation. Under strategies without a free offering (CE-PL and CE-SUB), the firm would have no option but to price low from the beginning, trapped by the inability to generate WOM from other sources rather than the paying installed base. At the same time, with strong individual depreciation (small ), TLF is no longer optimal regardless of consumer priors because all consumers extract the bulk of the product value during the free trial and there is little residual value to be extracted in period 2, leading to very low WTP. Also, in the same strong individual depreciation region, if the initial valuation priors are not too low (), CE-PL still outperforms S because the WOM effects generated from the seeded consumers cannot shift the dial on valuation by too much to justify forfeiting revenue from the high-type seeds if the initial estimation is not too low (CE-PL can be offered with a high price from the get-go).
But there is more nuance to the contrast between and in the presence of depreciation. It is not only that can emerge as optimal but also that, in fact, each of the four considered strategies has an optimality region. Similar to reasoning under the baseline case, low priors support strategies with some free consumption component that ignites WOM effects (S or TLF) while high priors support strategies with no free consumption, that rely less on WOM effects (CE-SUB and CE-PL). As discussed above, when is low, is the one strategy with free offerings that strongly competes with CE-PL or CE-SUB, whereas when is high, it is TLF that dukes it out with the non-free strategies. In the low region, the boundary between and the non-free strategies is weakly decreasing in lambda– is gradually losing ground when there is less depreciation. At the same time, for higher , the boundary between and the non-free strategies, , is increasing in – is gaining ground when there is less depreciation. Consumer prior is irrelevant to TLF with or without depreciation. All consumers learn the true value of the product via the free trial. In contrast, for S to dominate, it is important that it induces paid adoption solely in period 2 (with higher price, no period 1 paid adoption, and WOM effects carried through only by the seeded customers in period 1); hence, when S dominates, is irrelevant to it (given that paying customers are not exposed to the product in period 1).
When is very low, as it increases, under CE-PL and CE-SUB the firm can effectively increase the prices. As such, in this range, the boundary between CE-PL/CE-SUB and will decrease because S needs gradually lower priors (that keep the profitability of the other strategies in check in spite of less depreciation) to still dominate. As depreciation becomes less severe (), but still relatively low, under CE-SUB all period 1 consumers return in period 2 (in addition to new consumers joining in period 2). In this region, the update in valuation due to WOM dominates depreciation such that is independent from altogether (as can be seen in region (a) of Proposition C.2 in E-companion C). Hence, does not affect either CE-SUB or S in this case and the boundary between the two optimality regions is flat at . However, as we get into intermediate to large values of (even less depreciation), TLF dominates S. In such ranges, as individual depreciation lessens, TLF becomes more profitable due to an increased consumer WTP. Nevertheless, the profit under CE-SUB does not change w.r.t. as the boundary between CE-SUB and () remains inside the region . Thus, as increases, TLF gradually gains more advantage over CE-SUB for low to moderate .
Model With Adoption Costs
In this section, we extend our baseline model by accounting for a one-time adoption cost incurred during the period of the initial adoption (whether paid or for free).14 Under and CE-SUB, adopters from period 1 do not incur the adoption cost again, even though they make another adoption decision at the beginning of period 2. For simplicity, in this setup, we assume no depreciation (but will later numerically explore a generalized model with both depreciation and adoption costs in Section 6.1). In the software industry, installation and configuration processes have become increasingly complex and resource-demanding for highly specialized apps. For instance, a complete Windows installation of Matlab R2025a requires 24 GB of storage, roughly 6 times the amount required for Matlab 2014a.15 Additionally, modern enterprise software often involves initial migration costs, legacy integration, extensive customization, and potentially organizational change. On the other hand, adoption costs trend lower when using an app with minimal on-premise resource requirements, intuitive interface, and confined scope (e.g., cloud-based collaboration and productivity apps such as Google Workspace, Zoom, and Slack). While individual depreciation impacts only consumers that use the product for two periods, adoption costs affect every user.
A major difference from prior scenarios is that, when accounting for adoption costs, under and , some of the customers presented with the free offering choose to decline it. In addition, WOM effects start playing a role for TLF because only the customers that choose to use the product during the free trial perfectly learn their valuation. As such, these customers will generate WOM effects for all the other customers that did not enroll in the free trial. The separate nontrivial equilibrium solutions for each of the four strategies under the adoption costs scenario are presented in E-companion D, in Propositions D.1 to D.4. The following proposition fully characterizes the firm’s dominant strategies across the entire parameter space.
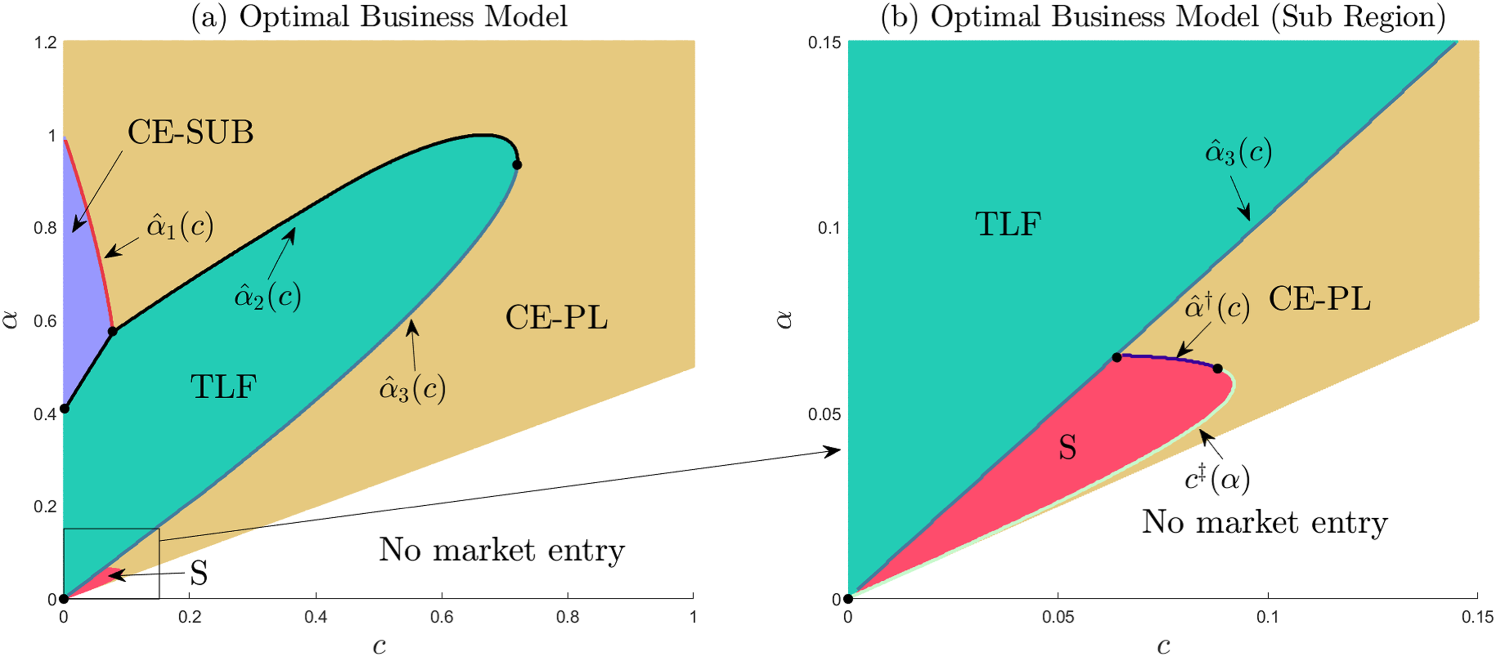
In the presence of adoption costs, the firm’s dominant strategy, as illustrated in Figure 3, is:
If , don’t enter the market, (white region);
If , enter the market with:
CE-SUB, if (purple region);
TLF, (green region);
Otherwise,
S, if and (red region);
CE-PL, otherwise (yellow region).
Functions , , , , and are defined in E-companion D and marked in Figure 3. Notably, yields the highest social welfare among all models.
Optimal strategies - model with adoption costs. Panel (b) represents a zoomed-in snapshot of the left-bottom corner region from panel (a).
When adoption cost is too high (), no user will adopt the product regardless of the business strategy employed (including those with a free offering). Hence, the firm cannot profitably enter the market in this region. Conversely, when adoption costs are manageable (), each business strategy can emerge as optimal. When , we recognize the market outcome from the baseline model (vertical slice in panel (a) of Figure 3 at ). It is important to mention that when and is very small, strictly dominates .
However, as increases, S emerges as optimal as long as and are sufficiently small (as illustrated in part ii.c.1 of the above result). In particular, the region where dominates intersects (and extends upwards in slightly beyond) the range , which is a range not contested at all by , as the latter can only be profitably implemented under stricter constraint .16 Interestingly, when is very close to (right above the no-market-entry threshold), CE-PL will dominate S—only the very top-valuation seeded consumers are willing to consider the free offer and, as such, the generated WOM effects would be too weak to significantly boost the valuation of the other consumers (to reap the benefits only through period 2 adoption). Thus, it is more profitable to just price a 2-period perpetual license at a low level and sell it to those top-valuation consumers directly. But if we move further above the market entry threshold (i.e., a slightly larger value of ), under the firm can generate a slightly stronger WOM effect through a larger number seeds, enough to give an edge to over CE-PL (as the latter strategy can only employ a small price). Note also that CE-SUB can only dominate for small adoption costs (following dynamics similar to those discussed in Section 3.3, which we skip discussing here for brevity) but higher priors, as it necessitates a jumpstart of adoption in period 1 with a high enough price for only a single period subscription when consumers face both adoption costs and the subscription price for that initial period. As costs increase, it loses to either (due to the free trial customers facing adoption costs but no price in period 1) or CE-PL (due to period 1 customers amortizing adoption cost over two periods of the perpetual license).
For intermediate adoption cost , two forces work against . First, higher adoption costs shrink the customer pool for seeding (in spite of the free giveaway), which in turn reduces the ability to generate WOM effects. Second, as costs increase, the feasible market-entry region also requires higher priors, so that the firm can monetize the customers more efficiently to make entry worthwhile. Similar to the baseline model dynamics, under higher , there is less benefit from strong WOM effects and it becomes suboptimal to forfeit revenue from some of the top-valuation customers for both periods. On the other hand, for higher priors , TLF is somewhat less affected by the intermediate adoption costs because the firm has the ability to monetize all free trial customers (including all top-valuation ones) in the second period since, for those, the adoption cost will be already sunk and their valuation will be updated to the true value. In this region, CE-PL dominates TLF at relatively low and high values, whereas for intermediate , the reverse occurs. Again, for , cannot be profitable at all, whereas for large priors it is not optimal to offer anything for free. In the intermediate range of , TLF gets an edge over CE-PL because the jump in valuation via self-learning is still significant and enough customers try the product during trial, allowing the firm to charge a high price in period 2 alone. Under CE-PL, the firm has to start at a somewhat lower price and remains committed to it. Once we get into very large ranges though, TLF loses the advantage across all regions, and CE-PL remains the sole dominant strategy.
Robustness Checks
We conduct several robustness checks by relaxing various model dimensions. First, in Section 6.1, we account for individual depreciation and adoption costs simultaneously. Next, in Section 6.2, we explore how the strength of WOM effects shapes our results. Lastly, in Section 6.3, we extend our model to three periods (hence shortening the length of the free trial relative to the product lifetime) and consider imperfect self-learning (whereby product use does not fully reveal the true valuation within one period), social learning based on multiple outside signal values, and an additional go-to-market strategy (subscription with free trials, alongside perpetual license with free trials). Furthermore, in E-companion G, we consider heterogeneity of consumer priors whereby, initially, some consumers overestimate while others underestimate the true product value. Collectively, these extensions confirm that S can emerge as the optimal strategy in the presence (but not in the absence) of individual depreciation and/or adoption costs in a more general context. Given the complexity of these extended models, closed-form solutions are intractable; hence, we run numerical explorations to identify optimal strategies for each extension.
Extension 1—Model With Both Individual Depreciation and Adoption Costs
In this section, we consider a model that includes both individual depreciation and adoption costs (combining the frameworks from Sections 4 and 5). Here, consistent with the main setup, we consider an exogenous individual depreciation rate. In E-companion F, we show that our results continue to hold when the firm endogenizes the individual depreciation rate (in which case the firm controls the degree of depreciation through new content/features).
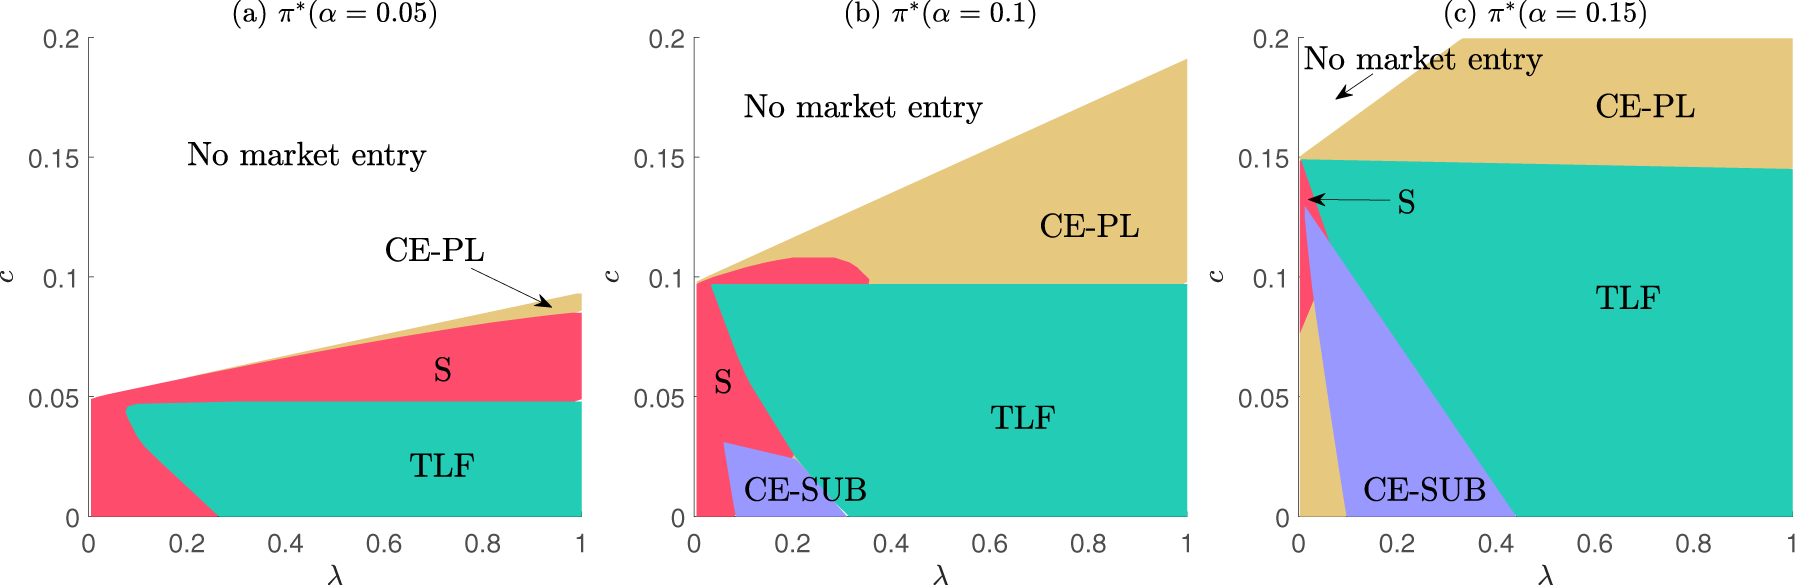
We explore the three-dimensional parameter space and present in Figure 4 several slices of the outcomes under this parameter space, at three distinct and relatively small values (0.05, 0.1, and 0.15). Prior insights continue to hold qualitatively. We confirm that all four go-to-market candidate strategies can be optimal, with dominating in regions of high depreciation (low ) and low adoption costs. At very low priors, strategies with free offerings are superior, but non-free strategies gradually take the stage as priors start increasing. Note that when and , we default to the baseline scenario in which is never optimal.
Optimal strategies - model with adoption costs and exogenous individual depreciation.
Extension 2—Model With Generalized Social Learning
The main results consider moderate strength of WOM effects (), mainly for tractability purposes. In this section, we relax this assumption in order to explore the robustness of our results in contexts of a wide range of intensities of WOM effects from weak (low ) to strong (high ).
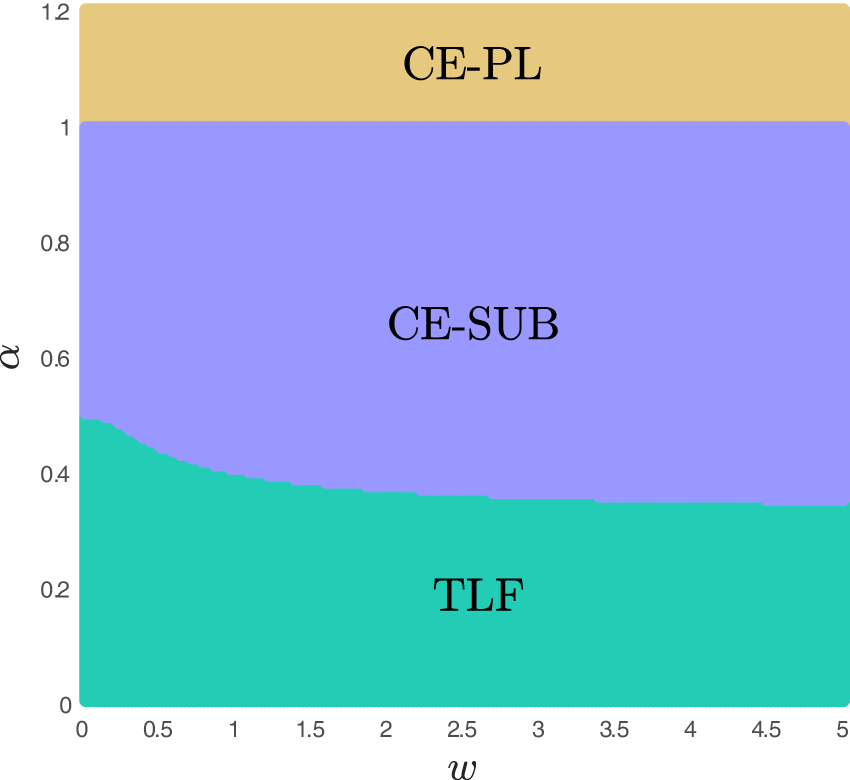
Figure 5 captures how the baseline model behaves under general WOM. We confirm that regardless of the strength of network effects, in the baseline model, in the absence of adoption cost or individual depreciation, S is always dominated. When , CE-PL is always the optimal model. When , CE-PL and CE-SUB perform identically. When , TLF is not affected by WOM and it always dominates seeding as the latter cannot induce perfect valuation learning via WOM, regardless of strength. However, asymptotically, as , we have (convergence from below) as it takes a gradually smaller volume of seeding to achieve increasingly better learning. At the same time, we notice that stronger WOM effects also lead to an expansion of the CE-SUB optimality region at the expense of the TLF as the firm gains more flexibility to price the subscription higher per period, balancing out less period 1 adoption at higher margins with strong WOM effects that lead to more new consumers in period 2 even when the period 1 adoption shrinks.
Optimal strategies - baseline model with generalized word-of-mouth (WOM).
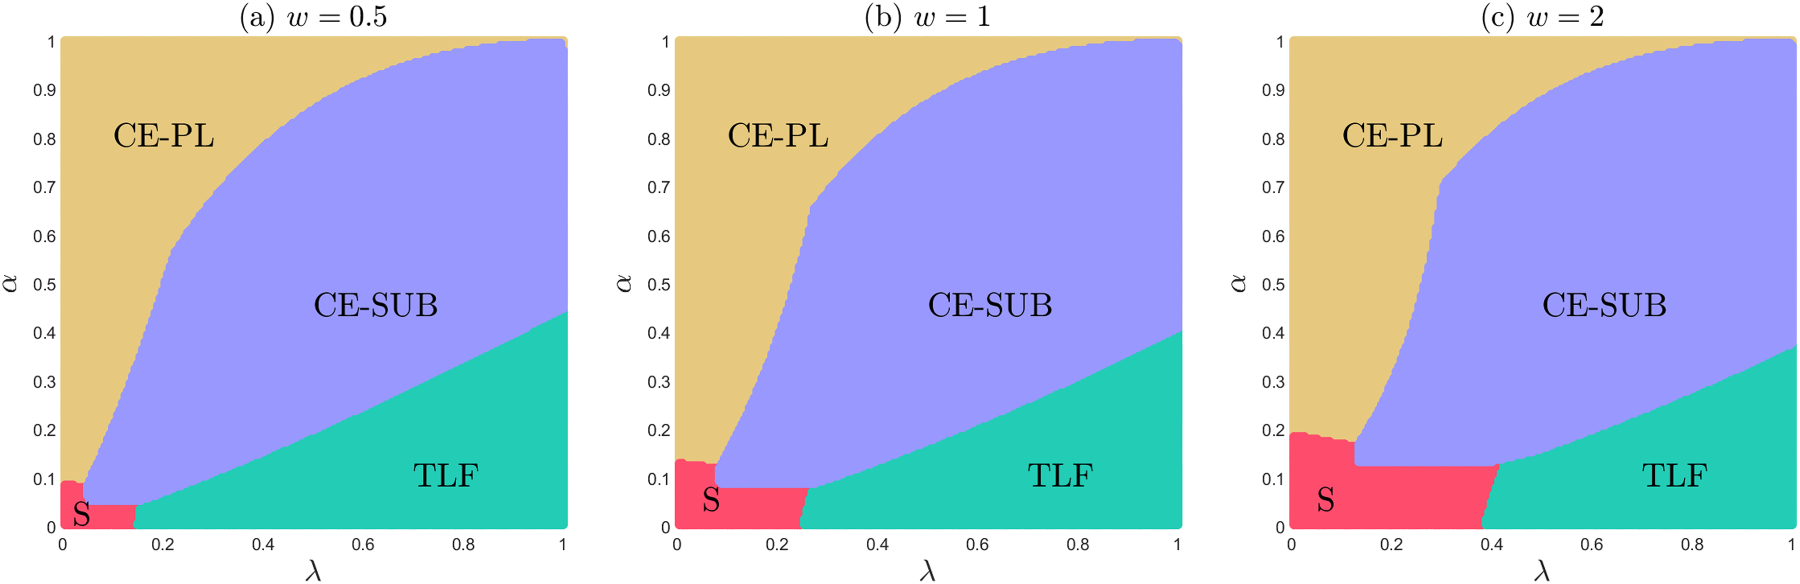
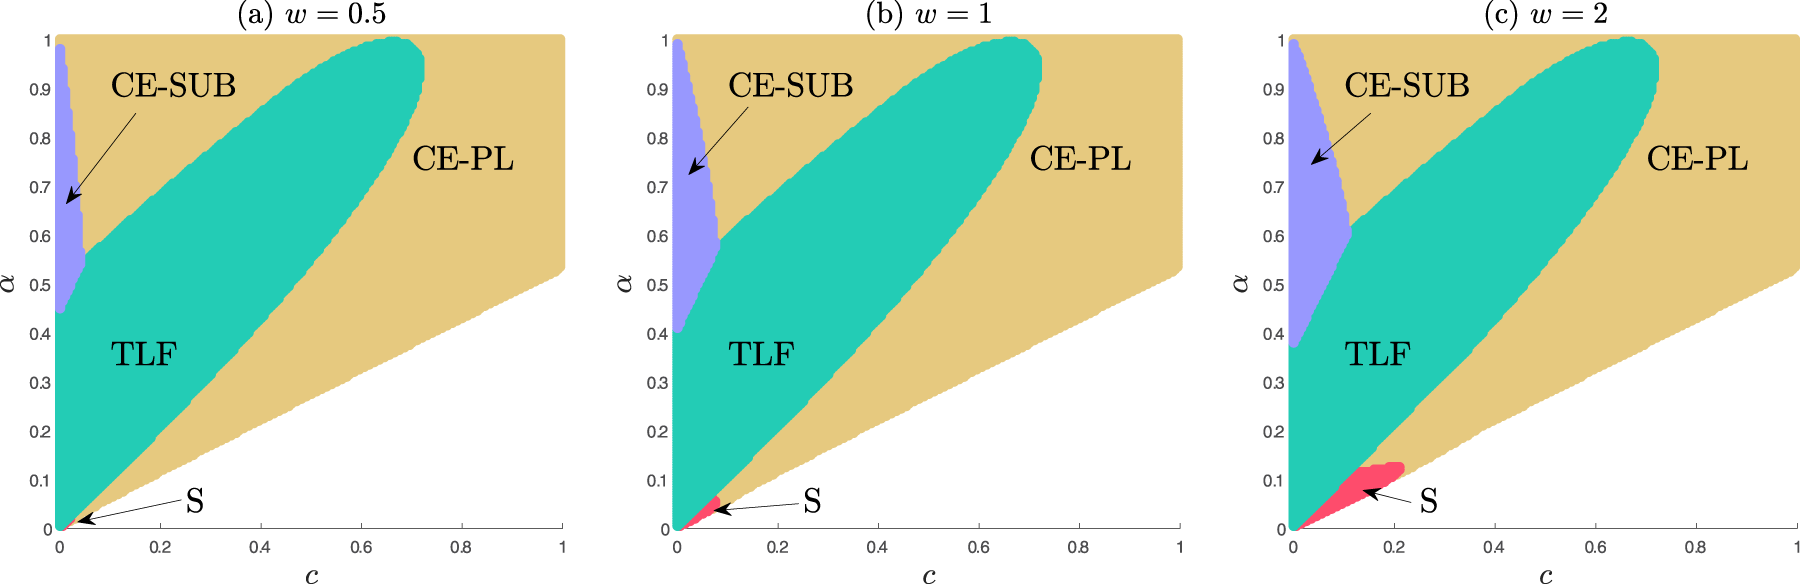
Our further analysis suggests that, when the individual depreciation and adoption costs are accounted for, the results under general WOM also remain consistent with our prior findings from Sections 4 and 5. This can be seen in Figures 6 and 7. We consider for both explorations a triplet of WOM strength effect values . Serving as benchmark, panel (b) in both of these figures is identical to the corresponding figures in previous sections (Figures 2 and 3). First, we confirm that S will always show up as optimal when consumers underestimate the value of the product (and several other conditions are met). Similar dynamics as the ones discussed before are at play here as well, and, for that reason, we omit such discussions here for brevity.
Optimal strategies - model with individual depreciation and generalized word-of-mouth (WOM).
Optimal strategies - model with adoption costs and generalized word-of-mouth (WOM).
Even though social learning impacts multiple strategies, an interesting pattern emerges:
When consumers incur either adoption costs or individual depreciation, stronger WOM effects lead to an expansion of the optimality area for S.17
This insight is in contrast to the findings under the baseline model, in which WOM effects never give an edge to in the four-strategy race. Hence, it is very important for firms to understand how to incorporate the magnitude of WOM effects in their decision making process and choice of go-to-market strategies. More so, stronger WOM effects allow for a more efficient seeding approach with far fewer seeds needed to raise awareness about the true value of the product. At the same time, comes under increasing pressure from CE-SUB as the latter is able to capitalize on WOM effects as well.
Extension 3—Imperfect Self-Learning With Three Periods
In this final robustness check, we jointly relax two assumptions in our main model—the 2-period horizon and the perfect 1-period self-learning. First, we extend the analysis to a 3-period setting (but qualitatively similar insights hold for a larger number of periods as well), making free trials last a smaller share of the product life cycle and thereby improving ’s monetization potential. A multi-period framework also captures potentially compounding learning cycles, as users continue updating their priors about the product’s true value over successive periods, enabling a more granular representation of the learning process. Second, in tandem with the extended horizon, we introduce imperfect self-learning—we accommodate not only for the fact that it may take longer for adopters to uncover the true value of the product through self-learning, but also for their learning potentially overshooting in either direction. Thus, adopters update their priors after each period of use but may not converge to the true valuation within a single period.
We confirm that the insights from the main model remain robust under this extension as well. In particular, is always dominated in the absence of adoption cost or individual depreciation. However, when either adoption costs are present but low or there is high depreciation, does emerge as the dominant strategy when initially consumers significantly underestimate the value of the product. For brevity, all details are relegated to E-companion E.
Impact of Gen/Agentic AI on Strategies With Free Consumption
While this study examines an unconstrained parameter space, the rapid emergence of powerful GenAI tools warrants consideration of how our findings will remain applicable in the evolving technological landscape. The year 2022 marked a pivotal moment in human–computer interaction with the public release of ChatGPT by OpenAI, soon followed by a proliferation of similar GenAI and, more recently, Agentic AI tools from various market participants. This ongoing AI revolution is transforming the software industry and underscores the need for rigorous theoretical reassessment of its implications for a broad spectrum of established business strategies (Hermann and Puntoni, 2024; Huang and Rust, 2025; Korzynski et al., 2023), particularly those involving consumer learning.
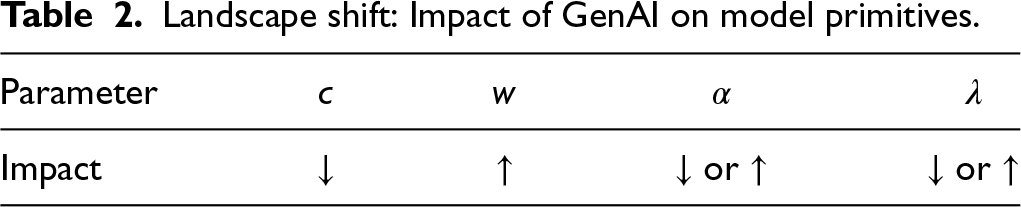
Below, in Subsections 7.1 to 7.4, we describe qualitatively in detail several potential mechanisms through which Gen/Agentic AI reshapes key model primitives, thereby driving markets to specific feasible ranges of the parameter space and influencing the relative dominance of strategies such as and . As a preamble, we summarize in Table 2 these directional impacts. This discussion remains grounded in the quantitative analysis established in the main text.
Landscape shift: Impact of GenAI on model primitives.
Parameter
Impact
or
or
In real markets, Gen/Agentic AI will likely impact multiple parameters simultaneously. Given its effects on and (discussed in Subsections 7.1 and 7.2), if the net impact pushes further away from the real valuation (which, as discussed in Section 7.3, we expect to happen in the short run), then, when customers initially underestimate the value of the product, both S and TLF will be brought into sharper focus as increasingly relevant (with the winning strategy determined based on where falls). To our knowledge, this represents one of the first theoretical treatments on how Gen/Agentic AI influences the optimality of free-consumption strategies.
Impact of Gen/Agentic AI on the Adoption Cost ()
First, the widespread adoption of GenAI is expected to substantially reduce software users’ adoption costs. This stems from GenAI’s ability to provide highly personalized configuration and training processes accessible to users on demand. Through chatbots and prompt-based tools, users can accelerate software deployment in complex business environments and markedly enhance productivity (Bick et al., 2025; Brynjolfsson et al., 2025). Furthermore, many software firms now integrate GenAI modules directly into their products, while others enable GenAI connectivity via APIs (Russo, 2024) or offer services to customize/train GenAI to intrinsic client needs. For instance, Salesforce’s Einstein GPT, linked with OpenAI’s models, provides intelligent support during CRM implementation, and Agentforce tools allow users to build and deploy autonomous AI agents operating across business functions. Similarly, Microsoft Azure AI Studio and Google AI Studio empower users to develop AI assistants by combining general-purpose large language models (LLMs) with proprietary data. GenAI has also transformed software development through programming assistants such as Amazon Q Developer, Anthropic Claude Code, GitHub Copilot, and Google’s Gemini Code Assist and Jules, which significantly reduce the coding expertise and effort traditionally associated with complex coding tasks. Moreover, the continued evolution of GenAI is expected to further lower barriers to low-code and no-code platforms, indirectly reducing adoption costs for syntax-based programming and profoundly reshaping software development (Ghoshal, 2023).
Adoption costs are unlikely to vanish entirely, as software integration and configuration still require effort, resource-intensive applications may necessitate hardware upgrades, and use of advanced GenAI API or specialized AI assistants currently incur small fees. Thus, we expect GenAI to move to a lower (yet positive) range, which, as shown in Sections 5 and 6, limits the market to a parameter range where all strategies, including those with free consumption, can be optimal.
Impact of Gen/Agentic AI on Social Learning ()
Secondly, GenAI is likely to improve social learning efficiency, which in our framework corresponds to a higher . This is because GenAI can train itself on feedback and data from users (and prompt engineers/testers) of a software app early in the adoption cycle, with improved models benefiting the training and education of potential users of that app in the later periods. Once the early adopters start using the app and further train GenAI with respect to it, a prospective user can now query that same AI assistant about how (or whether it is possible) to accomplish a task with that specific app, learning this knowledge even before installing the app. For example, Microsoft introduced Copilot AI assistant in Office applications. By engaging with Copilot more frequently, existing users help Microsoft’s GenAI learn how productivity apps can be effectively applied to a wider array of business problems. Then, with the help of the same Copilot AI (accessible via Internet), prospective users can better assess whether Office can meet their needs. Thus, knowledge transfer through social learning is increasingly facilitated by GenAI. Moreover, GenAI models learn not only from user interactions but also from other data sources, and recent evidence suggests that LLMs can self-train from a limited number of examples (Hopkin, 2023). Mapping into our modeling framework, as GenAI assistants become ubiquitous, continuously available, and increasingly relied upon, fewer first-period adopters will suffice to generate equivalent levels of knowledge transfer through WOM effects as compared to scenarios without GenAI. This is equivalent to the advent of GenAI being associated with a higher (stronger, more persuasive WOM effects).
As shown in Section 6.2, when depreciation or adoption costs are present, GenAI’s upward effect on can broaden the conditions under which seeding is optimal. However, in the absence of these two effects, GenAI may not support optimality of seeding.
Impact of Gen/Agentic AI on the Estimation Prior ()
Compared to the impact on and , the impact of GenAI on software users’ prior () and individual depreciation () is considerably more nuanced. We first discuss the potential influence of GenAI on . GenAI may expand an application’s usefulness by enabling deployment across a broader range of business use cases. Moreover, when the app is used in tandem with other digital assets, the limited, costly, or poor-quality repository of the latter (complementary resources) can constrain the benefit of the former. GenAI can help mitigate this issue. For instance, Adobe has integrated GenAI into Photoshop and Stock, providing users with access to a rich stream of AI-generated images and the ability to produce their own variations using AI-capabilities that enhance the creative process and complement existing resources. More broadly, GenAI can improve user productivity, enabling individuals to extract greater value from the app (Brynjolfsson et al., 2025). However, in the near term, given the novelty of GenAI, prospective users, prior to market release and without signals from other adopters, may not fully comprehend GenAI’s potential to expand the product valuation (prior to taking the product for a spin for themselves). When users initially underestimate the product value (), the real value they can extract may deviate even further from their prior in the presence of GenAI. Since in our model we normalize the real value (per period) to 1, a wider gap between real and perceived valuation translates into a lower.
In the long term, firms and users alike will become increasingly familiar with GenAI’s potential. Internally, prior to release, software developers could adopt practices to pre-train AI chatbots (integrated or widely available) with examples (many scientific software tools such as Matlab or Mathematica are released with documentation that already includes examples—the next step is to feed such examples to GenAI prior to release). Furthermore, prior to product release, developers may also conduct closed beta tests with select customers, during which testers can interact with widely available GenAI assistants while using the product, thereby further refining the AI’s understanding of it. As a result, GenAI could become proficient at addressing product-related inquiries even before market launch. Prospective customers could then use publicly available chatbots to update their priors from the outset, improving their ability to assess the software’s true value before adoption. Consequently, the introduction of GenAI can align user priors more closely with real valuations, which, depending on initial over- or underestimation, can mean a lower or a higher. However, this assumes minimal hallucination, as firms risk reputational damage if pre-trained AI assistants fabricate use cases or claim non-existent features. Moreover, given the risk of data leaks, some firms may be reluctant to expose GenAI to detailed information about unreleased products, fearing premature competitive spillovers (after all, competition can accelerate development of like capabilities—ironically, also using GenAI for coding).
In sum, GenAI can bring consumer prior either further away from or closer to the real valuation of the product.
Impact of Gen/Agentic AI on Individual Depreciation ()
Finally, GenAI can also influence individual depreciation. As noted earlier, GenAI can enhance productivity. On one hand users can do more with the app (hence the value of the app increases). At the same time, GenAI can also help them complete tasks faster. In instances in which users have a limited need for the app (e.g., a single project), completing the task faster results in less need for the app in the future. This translates to higher depreciation (lower).
On the other hand, as its name suggests, “generative” AI can repeatedly generate new content, update older content for current contexts, and even allow more users to participate in the content generation process. Consider professional simulator applications (e.g., for aviation, military combat, law enforcement, surveillance, driving, or deep-sea diving). Prior iterations of these systems operated on either pre-programmed or user-input scenarios. Once a user went through most of the pre-programmed scenarios, the value of the simulator would decline. With GenAI, simulators can generate an ongoing stream of novel scenarios, including those dynamically tailored to a trainee’s progress, allowing continuous practice with minimal repetition. A parallel can be drawn to video games, where developers have long sought to enhance replayability by adding an element of randomization to the procedural map generation. One of the most prominent examples in this category is Blizzard’s widely acclaimed Diablo game series. Every time a user restarts a campaign (potentially with a different character class), some portion of the maps/levels/non-player characters/loot would be randomly generated to create a new experience (while following some established rules for gameplay progression). Yet, such automated content rejuvenation has historically been detached from individual player preferences, and user-created map editors often proved cumbersome and underused. GenAI advances this paradigm by enabling seamless, automated content creation responsive to user prompts, performance, and progress, thereby sustaining engagement and potentially reducing depreciation (i.e., yielding a higher ). Nevertheless, this effect might be dampened by potentially reduced variance and quality of GenAI output, a phenomenon already documented in LLMs trained on synthetic data (Bhatia, 2024; Shumailov et al., 2024).
Conclusion
Given the rapid proliferation of software applications and the widespread adoption of the Internet, software firms now operate in increasingly congested markets where it is difficult for products to stand out. At the same time, heightened privacy concerns among consumers and regulators have curtailed firms’ ability to engage in targeted marketing, and, furthermore, for many app developers, acquiring consumer data remains prohibitively expensive since most apps generate minimal revenue flow. In this environment, software producers must reconsider how to optimize consumer product discovery by evaluating how non-targeted go-to-market strategies shape multi-dimensional valuation learning on the consumer side. To this end, firms nowadays increasingly employ strategies involving some form of free consumption to stimulate valuation learning by exposing consumers to the product. In this paper, we pit two such strategies with free consumption against each other—the more traditional strategy of non-targeted seeding (which predates the emergence of digital goods) and market-wide time limited freemium (free trials available to everyone for a limited time, possible at scale only in the context of digital goods). Our central question is whether non-targeted seeding remains relevant when large-scale free trials are possible. To our knowledge, this is the first study to compare and contrast seeding with free trials (and with other non-free strategies), while jointly considering self- and social learning processes on the consumer side. Prior research shows that when is absent from the strategy choice set, may be optimal when consumers initially severely undervalue the product. However, our exploration reveals that this may no longer be the case when free trials are considered as well. Building on a unifying multi-period framework with learning mechanisms borrowed from established literature, we find that in a parsimonious baseline setting, in the absence of any user adoption costs or individual value depreciation, seeding is in fact never optimal once free trials are in the picture.
Intrigued by this initial finding, we set out on an additional research goal—to identify some factors that, when added to the model, would allow non-targeted seeding to re-emerge as optimal in some regions of the parameter. We find that when either of two demand characteristics—adoption costs or individual depreciation (which can be present in various combinations in industry)—are introduced, can become the optimal strategy in scenarios in which consumers initially underestimate product value. In fact, these two factors enable each of the four business strategies to dominate in specific regions of the parameter space.
Our findings remain qualitatively consistent across a comprehensive set of robustness checks, including endogenous individual depreciation, joint modeling of depreciation and adoption costs to ensure their effects do not offset each other, more general WOM effects, imperfect self-learning, and extended time horizons capturing compounded learning effects. Additionally, we show that depreciation and adoption costs moderate the influence of WOM on the optimality of seeding. In the absence of these factors, stronger WOM effects alone cannot make seeding superior to other strategies; however, once either factor is introduced, strong WOM effects expand seeding’s optimality region within the parameter space, increasing its relevance. Identifying ranges of adoption costs and individual depreciation that render seeding optimal in some regions provides actionable managerial insights. Relatedly, we map the parameter regions where each of the considered go-to-market strategies emerges as optimal, information that is also highly relevant to practitioners. Furthermore, under the main scenarios in Sections 3 to 5, yields the highest social welfare, even though firms may prefer alternative strategies depending on parameter regions, revealing a notable misalignment between societal and firm objectives. Our study informs policy makers and regulators on when it could be socially beneficial to intervene in app markets and when not to. Solving separately the non-trivial equilibrium strategies for each of the strategies in the presence of depreciation and adoption costs adds secondary contributions—these complete characterizations can be used as building blocks to further advance the exploration of each of these strategies.
Furthermore, in Section 7, we delved into how the emergence of Gen/Agentic AI can reshape the optimal go-to-market strategy by influencing key market primitives and consumer learning dynamics. In our unconstrained analysis, seeding proved optimal only within a relatively narrow range of the parameter space. We show, however, that Gen/Agentic AI can shift the market toward, or even broaden that favorable set, in particular enhancing the viability of . Thus, this AI revolution makes the insights of this work even more timely and consequential.
This study opens several avenues for future research. We identified two market factors that sustain seeding as a viable strategy, yet further studies may uncover additional factors and refine this theory. In the context of a longer horizon, future studies could also explore hybrid strategies that mix aspects from multiple approaches (including combining features from and ), or more adaptive strategies. Moreover, the discussion in Section 7 motivates an empirical future research agenda to quantify all mentioned GenAI-induced effects on go-to-market strategies. Lastly, our analysis incorporates the role of network externalities in the social learning process. Future research can also investigate how non-targeted seeding and the other strategies fare against each other in the presence of direct network effects at the consumer utility level (whereby larger installed bases directly drive up the utility of adopters through value exchange and collaboration). Intuitively, seeding should benefit from direct network effects because the perpetual license of the seeds would ensure a minimum added boost at utility level (due to a non-zero initial installed base) for every prospective consumer at every future stage. We therefore expect our results to continue to be robust to some extent even in the presence of direct network effects. Interesting additional dynamics are likely to emerge in models that integrate both direct network and WOM effects, as non-adopters would be drawn to the market not only through WOM-based prior updating but also through expectations about the magnitude of the installed base, with the sequencing of these mechanisms potentially influencing how they perceive the benefits of such direct network effects.
Supplemental Material
sj-pdf-1-pao-10.1177_10591478261420000 - Supplemental material for Don’t Count Non-Targeted Seeding Out Just Yet
Supplemental material, sj-pdf-1-pao-10.1177_10591478261420000 for Don’t Count Non-Targeted Seeding Out Just Yet by Yifan Dou, Hao Hu, Marius Florin Niculescu and DJ Wu in Production and Operations Management
Footnotes
Acknowledgments
The authors thank the department editor, Dr. Nitindra Joglekar, as well as the senior editor and the three reviewers for their constructive feedback on the manuscript. The authors also extend their gratitude to the participants at 2010 and 2019 INFORMS Annual Meetings, 2010 Workshop on Information Systems and Economics, 2019 Conference on Information Systems and Technology, 2023 Theory in Economics of Information Systems Workshop, and 2025 Production and Operations Management Society Annual Meeting, as well as the participants at research seminars at Georgia Institute of Technology and University of California San Diego for their insightful comments.
Declaration of Conflicting Interests
The authors declared no potential conflicts of interest with respect to the research, authorship, and/or publication of this article.
Funding
The authors received financial support for the research, authorship, and/or publication of this article: Prof. Dou's research is supported by National Natural Science Foundation of China (Grants Nos. 72525010 and 72342012).
ORCID iDs
Yifan Dou
Hao Hu
Marius Florin Niculescu
DJ Wu
Supplemental Material
Supplemental material for this article is available online (doi: ).
Notes
How to cite this article
Dou Y, Hu H, Niculescu MF and Wu DJ (2026) Don’t Count Non-Targeted Seeding Out Just Yet. Production and Operations Management XX(XX): 1–20.
AralSMuchnikLSundararajanA (2013) Engineering social contagions: Optimal network seeding in the presence of homophily. Network Science1(2): 125–153.
3.
AridorGCheYKHollenbeckB, et al. (2025) Evaluating the impact of privacy regulation on e-commerce firms: Evidence from Apple’s App Tracking Transparency. Management Science. forthcoming. https://doi.org/10.1287/mnsc.2024.06600
4.
BassMF (1969) A new product growth model for consumer durables. Management Science15(5): 215–227.
5.
BatesJMGrangerCW (1969) The combination of forecasts. Journal of the Operational Research Society20(4): 451–468.
BickABlandinADemingDJ (2025) The rapid adoption of generative AI. Federal Reserve Bank of St. Louis Working Paper 2024-027, Rev. Oct. 2025, https://doi.org/10.20955/wp.2024.027 (accessed on 23 December 2025).
8.
BrynjolfssonELiDRaymondL (2025) Generative AI at work. Quarterly Journal of Economics140(2): 889–942.
9.
ChenPHittLMHongY, et al. (2021) Measuring product type and purchase uncertainty with online product ratings: A theoretical model and empirical application. Information Systems Research32(4): 1470–1489.
10.
ChenXVan Der LansRPhanTQ (2017) Uncovering the importance of relationship characteristics in social networks: Implications for seeding strategies. Journal of Marketing Research54(2): 187–201.
11.
ChenYHJiangB (2021) Dynamic pricing and price commitment of new experience goods. Production and Operations Management30(8): 2752–2764.
ChoudharyV (2007) Comparison of software quality under perpetual licensing and software as a service. Journal of Management Information Systems24(2): 141–165.
CuiFCuiWtXieY, et al. (2018) Seeding strategies for new product launch: The role of negative word-of-mouth. PloS one13(11): e0206736.
17.
CuiFWangLLuoXR, et al. (2024) Influentials, early adopters, or random targets? Optimal seeding strategies under vertical differentiations. Decision Support Systems183: 114263.
18.
DouYHuYJWuDJ (2017) Selling or leasing? Pricing information goods with depreciation of consumer valuation. Information Systems Research28(3): 585–602.
19.
DouYNiculescuMFWuDJ (2013) Engineering optimal network effects via social media features and seeding in markets for digital goods and services. Information Systems Research24(1): 164–185.
GokgozZAAtamanMBvan BruggenGH (2021) There’s an app for that! Understanding the drivers of mobile application downloads. Journal of Business Research123: 423–437.
24.
HaenleinMLibaiB (2013) Targeting revenue leaders for a new product. Journal of Marketing77(3): 65–80.
25.
HanPHuoYQiE (2021) Effect of seeding on the benefits of the manufacturer and retailer. Computers & Industrial Engineering153: 107074.
26.
HanSPParkSOhW (2016) Mobile app analytics: A multiple discrete-continuous choice framework. Management Information Systems Quarterly40(4): 983–1008.
HuangMHRustRT (2025) The GenAI future of consumer research. Journal of Consumer Research52(1): 4–17.
31.
IshiharaMChingAT (2019) Dynamic demand for new and used durable goods without physical depreciation: The case of Japanese video games. Marketing Science38(3): 392–416.
32.
JainDMahajanVMullerE (1995) An approach for determining optimal product sampling for the diffusion of a new product. Journal of Product Innovation Management12: 124–1356.
33.
JiangZSarkarS (2010) Speed matters: The role of free software offer in software diffusion. Journal of Management Information Systems26(3): 207–239.
34.
KimDAHwongARStaffordD, et al. (2015) Social network targeting to maximise population behaviour change: A cluster randomised controlled trial. The Lancet386(9989): 145–153.
35.
KorzynskiPMazurekGAltmannA, et al. (2023) Generative artificial intelligence as a new context for management theories: Analysis of ChatGPT. Central European Management Journal31(1): 3–13.
36.
LehmannDREsteban-BravoM (2006) When giving some away makes sense to jump-start the diffusion process. Marketing Letters17(4): 243–254.
37.
LiHJainSKannanP (2019) Optimal design of free samples for digital products and services. Journal of Marketing Research56(3): 419–438.
38.
LiKJJainS (2016) Behavior-based pricing: An analysis of the impact of peer-induced fairness. Management Science62(9): 2705–2721.
39.
LibaiBMullerEPeresR (2005) The role of seeding in multi-market entry. International Journal of Research in Marketing22(4): 375–393.
40.
LibaiBMullerEPeresR (2013) Decomposing the value of word-of-mouth seeding programs: Acceleration versus expansion. Journal of Marketing Research50(2): 161–176.
41.
LinZZhangYTanY (2019) An empirical study of free product sampling and rating bias. Information Systems Research30(1): 260–275.
42.
NejadMGAminiM (2024) Designing profitable seeding programs: The effects of social network properties and consumer homophily. Journal of Business Research173: 114496.
43.
NejadMGAminiMBabakusE (2015) Success factors in product seeding: The role of homophily. Journal of Retailing91(1): 68–88.
44.
NiculescuMFWuDJ (2014) Economics of free under perpetual licensing: Implications for the software industry. Information Systems Research25(1): 173–199.
RussoD (2024) Navigating the complexity of generative AI adoption in software engineering. ACM Transactions on Software Engineering and Methodology33(5): 1–50.
48.
SchlerethCBarrotCSkieraB, et al. (2013) Optimal product-sampling strategies in social networks: How many and whom to target? International Journal of Electronic Commerce18(1): 45–72.
49.
ShillerBR (2013) Digital distribution and the prohibition of resale markets for information goods. Quantitative Marketing and Economics11(4): 403–435.
50.
ShulmanJDCunhaM JrSaint ClairJK (2015) Consumer uncertainty and purchase decision reversals: Theory and evidence. Marketing Science34(4): 590–605.
51.
ShumailovIShumaylovZZhaoY, et al. (2024) AI models collapse when trained on recursively generated data. Nature631(8022): 755–759.
TanY (2024) Implications of blockchain-powered marketplace of preowned virtual goods. Production and Operations Management33(6): 1393–1409.
54.
WeathersDSharmaSWoodSL (2007) Effects of online communication practices on consumer perceptions of performance uncertainty for search and experience goods. Journal of Retailing83(4): 393–401.
55.
WilderBImmorlicaNRiceE, et al. (2018) Maximizing influence in an unknown social network. In: Proceedings of the AAAI conference on artificial intelligence, Vol. 32, No. 1.
56.
ZhangHZhangZRaghunathanS (2021) Is more better? The divide between retailer’s and manufacturers’ preferences for reviews and review monetization. Management Information Systems Quarterly45(3): 1349–1410.
57.
ZhangJSeidmannA (2010) Perpetual versus subscription licensing under quality uncertainty and network externality effects. Journal of Management Information Systems27(1): 39–68.
58.
ZhangZNanGLiM, et al. (2022) Competitive entry of information goods under quality uncertainty. Management Science68(4): 2869–2888.
Supplementary Material
Please find the following supplemental material available below.
For Open Access articles published under a Creative Commons License, all supplemental material carries the same license as the article it is associated with.
For non-Open Access articles published, all supplemental material carries a non-exclusive license, and permission requests for re-use of supplemental material or any part of supplemental material shall be sent directly to the copyright owner as specified in the copyright notice associated with the article.