Leveraging government tax incentives to prompt corporate charitable giving has gained considerable popularity over the past decade. This paper sheds light on the broader consequences of the U.S. government’s tax-subsidy policy for charitable food donations, which is determined based on the fair market value (FMV) of the donated products. We incorporate the tax-subsidy into a monopolist food retailer’s after-tax profit function. Market demand is both price- and quality-dependent, and the shelf-life of the goods is determined by their initial quality and deterioration rate. The retailer makes joint quantity and pricing decisions over two periods, procuring goods at the start of the selling season and (possibly) donating at the end of period 1. We characterize the retailer’s optimal policy and specify conditions under which she donates some, all, or none of her leftover inventory. We explore the impact of government tax-subsidies on the retailer’s actions, consumer surplus, quantity of donations, and total welfare. We show that tax-subsidies may motivate retailers to intentionally create supply scarcity (by donating more) to increase FMV (determined by the second-period price), thereby enhancing tax deductions. While tax-subsidies encourage donations, they can also unintentionally harm consumers by reducing supply and raising prices. Interestingly, we show that a higher subsidy does not necessarily lead to more donations; the retailer may choose to donate fewer units to achieve the same tax deduction while increasing sales revenue. We investigate conditions under which tax-subsidies can simultaneously increase donations, consumer surplus, and retail profit. We show that this outcome is possible only when retailers donate low-quality goods in modest quantities. Our findings reveal how FMV-dependent tax-subsidies can backfire, reducing both consumer surplus and total welfare while benefiting the retailer. Governments must carefully weigh the benefits of donations against potential harm caused to consumers.
According to the Food and Agriculture Organization (FAO) of the United Nations, the number of food-insecure people around the globe has risen from 135 million in 2019 (FAO, 2021) to 309 million in 2024 (World Food Programme, 2024). In the United States, 34 million households, spread across all counties, were food-insecure in 2021 (Coleman-Jensen et al., 2022). Amid soaring hunger, food waste is also on the rise. The United Nations Environment Programme (2021) estimates the global food waste to be 931 million tons per year (17% of the total amount produced for human consumption). Food waste is particularly pronounced in lower-middle income to high income countries. For instance, in the United States, 30% to 40% of the total food supply is thrown away each year (U.S. Department of Agriculture, 2025).
In addressing the issues of food insecurity and waste, many governments have implemented tax relief policies with the intent of incentivizing charitable food donations (Chu et al., 2018; Giuseppe et al., 2014). Indeed, increasingly more grocery retailers, as part of their environmental, social, and governance (ESG) activities, donate food with the objectives of receiving enhanced tax deductions, increasing quality of the remaining goods on display, avoiding disposal costs and penalties, and/or maintaining a good brand image (Chu et al., 2018; Lowrey et al., 2023). Nevertheless, food banks continue to struggle to meet demand and to acquire perishable foods while they are still fresh. Thus, questions remain as to the effectiveness of such tax incentive policies in improving accessibility to fresh goods. It is also unclear who benefits most from such policies, the retailers, consumers, or society at large. In this paper, we aim to shed light on these questions. In particular, we investigate the impact of government tax-subsidies on a monopolist food retailer’s operational decisions, and how these decisions affect the government’s societal objectives including increasing food donations.
In this article, we model a food retailer’s operational planning decisions for a continuously deteriorating inventory over two periods, where the length of the selling season is determined based on the shelf-life of the products, informed by temporal data. The consumer demand is assumed to be both price- and quality-dependent. Before the start of the selling season, the retailer jointly determines the stocking quantity and first period price. At the end of the first period, future demand uncertainty is resolved, after which the retailer determines the inventory amount to carry forward and sets the price for the second period. The part of inventory that is not carried to period 2 is donated immediately to receive a tax-subsidy. We incorporate the U.S. government’s tax-subsidy policy for charitable food donations from Publication 526 (Internal Revenue Service, 2024) into the retailer’s after-tax profit function. The tax-subsidy is linked to the fair market value (FMV) of the goods. We characterize the retailer’s optimal policy and discuss the ramifications of the tax-subsidy policy for society, including its effectiveness in improving access to fresh goods.
Our analysis reveals several unexpected findings. We show that tax-subsidies may incentivize retailers to create supply scarcity by increasing donations, thereby raising the FMV of goods and amplifying the tax deduction collected. While subsidies encourage donations, they can unintentionally harm consumers by reducing supply and driving up prices. Moreover, contrary to conventional wisdom, we show that the retailer’s optimal donation quantity may decrease in the per unit tax-subsidy she receives but may increase in the quality of the on-hand inventory. We show that tax-subsidies raise both market price and stocking quantity in the first period. Notably, a triple-win outcome, where donations, consumer surplus, and retail profits increase simultaneously, is attainable only when the first period is long or when demand uncertainty is low and the first period is not short; both scenarios lead to low-quality donations in modest quantities. In contrast, when demand is highly uncertain and the first period is short (resulting in early—high quality—donations), the tax-subsidy policy causes a substantial reduction in consumer surplus, while the retailer enjoys enhanced deductions. These results highlight the mechanism through which FMV-dependent tax-subsidies can backfire, reducing both consumer surplus and total welfare while benefiting the retailer. Governments would need to carefully weigh the benefits from donations against the potential harm caused to consumers.
The rest of the paper is organized as follows. In Section 2, we review related literature. Section 3 outlines the retailer’s problem and the societal objective. In Section 4, we solve the retailer’s problem and develop her optimal policy. In Section 5, we present the managerial implications and consequences of the firm’s optimal policy on the societal objective. In Section 6, we conduct numerical experiments to assess the impact of several problem parameters on the retailer’s optimal decisions and social welfare. In Section 7, we offer concluding comments.
Related Literature
Our paper is related to the following research streams in the literature: (a) two-period pricing-newsvendor models, (b) tax-efficient supply chain management, and (c) food waste and charitable giving in operations management (OM).
Two-period pricing-newsvendor models: In this article, we examine the management of a perishable fresh food item that deteriorates over time, employing a two-period pricing-newsvendor model. This approach is widely used in the study of perishable inventory management. Among the salient works, Ferguson and Koenigsberg (2007) study a situation where a firm faces the competition between new and old products during the second period. Cachon and Kök (2007) study the salvage value estimation of a newsvendor. More recently, Pang et al. (2021) consider the advance selling and preorder policy of an e-retailer. Petruzzi and Dada (1999) describe important properties of the pricing-newsvendor problem. Our article extends this body of work by integrating corporate charitable giving into the management of deteriorating products.
Tax-efficient supply chain management: Our article can also be viewed as related to the growing body of the tax-efficient supply chain management literature. Much of this literature focuses on the transfer pricing strategy of multinational firms (MNFs) (Huh and Park, 2013; Shunko et al., 2014), where the objective is to facilitate the transfer of a product or service between two divisions of the same firm to leverage the low-tax rate in a country. More recent papers consider competing firms (Hsu et al., 2019) and even the possibility of backshoring (Huang et al., 2023). Our work differs from this literature by addressing operational decisions and tax policies specific to charitable giving, rather than conventional transfer pricing decisions.
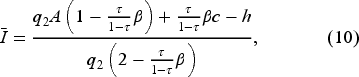
Food waste and charitable giving in OM: Environmentally responsible operations management, particularly with regard to food waste, has gained considerable attention. Several studies investigate factors influencing retail-level food waste, such as buy-one-get-one-free promotions (Wu and Honhon, 2023), retail sales-force incentive design (Akkaş and Sahoo, 2020), shipment policies for consumer packaged goods (Akkaş and Honhon, 2022), and the density of physical grocery stores (Belavina, 2021).
There is a growing literature that considers charitable donations as a part of responsible operations management practices. Lowrey et al. (2023) propose an oligopoly model in which one of the retailers considers donations as a means to boost the quality of her offerings by donating the aged inventory. Arya and Mittendorf (2015) develop a deterministic framework and analyze the effects of government subsidies on a supply chain that consists of a retailer and a supplier. Chu et al. (2018) incorporate donations into a firm’s decisions in a two-period pricing-newsvendor framework, where the firm earns tax deduction for charitable giving. However, they primarily analyze the problem numerically and consider neither the quality in demand formulation nor the efficacy of the tax-subsidy policy. Özbilge et al. (2024) examine a retailer’s optimal donation and pricing problem, where they assume a constant (not FMV-dependent) reward per item donated. They observe a monotonic relationship among selling price, donation quantity, and this reward. In this article, we show that the use of the U.S. government’s policy grants the retailer some control over the tax subsidy attained, leading to a substantially different optimal policy. Akkaş and Gaur (2022) highlight the role of government incentives in promoting food donations and recovery as a promising avenue for research.
Our article complements the existing literature by uncovering an effect that, according to our knowledge, has not been recognized previously. In particular, we show how a tax-subsidy for charitable donation can backfire and lead to the unintended consequences such as fewer donations or reduced consumer surplus. Moreover, we show under the current U.S. tax policy that total welfare improves only when the firm donates low quality inventory in modest quantity.
The Model
In this section, we provide a description of the retailer’s problem and the model. A glossary of notation used can be found in the online appendix.
The Setting
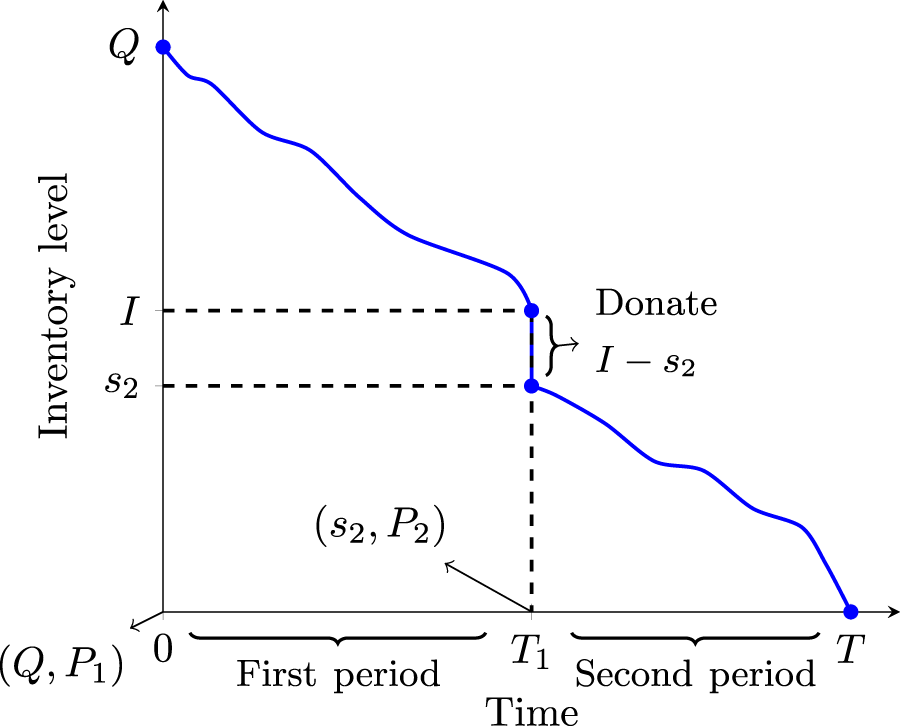
We consider a food retailer’s inventory management and pricing problem for a continuously deteriorating fresh food item. The retailer decides on how much inventory to stock at the beginning of the selling season to sell over two periods. Considering two periods allows us to recognize the deteriorating nature of fresh foods. The retailer makes joint inventory and pricing decisions in both periods. In doing so, the retailer seeks to maximize her after-tax profit. The sequence of events is as follows (see also Figure 1):
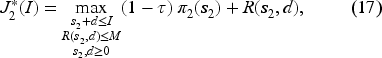
Prior to the selling season, the retailer observes the quality of the goods at the supplier’s site and jointly determines the ordering quantity , and period 1 price, .
At time , the retailer receives the goods and the selling season kicks off.
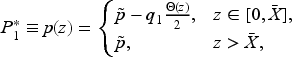
At time , the uncertain component of demand becomes known and the retailer observes the unsold inventory, . At this time, she carries units forward to be sold in the second period, donates units, and sets the second period price.1
At time , the goods expire and the selling season terminates.
Sequence of events.
Demand is assumed to be stochastic and both price- and quality-dependent. The length of the selling season is characterized by the shelf-life of the items, . Demand uncertainty is resolved at the end of period 1 with demand in period 2 becoming fully known. We assume the length of period 1 is , a parameter that is exogenously specified and corresponds to the amount of time it takes the retailer to resolve future demand uncertainty. This assumption is common in the perishable inventory management literature (Cachon and Kök, 2007; Chu et al., 2018; Fisher et al., 2001).
In period 1, the retailer incurs a purchasing cost per unit of inventory. She incurs holding cost, , per unit of inventory carried forward to the second period. To specify the tax-subsidy, we use the guidelines provided by the U.S. Internal Revenue Service (IRS). Accordingly, there are two factors involved while calculating charitable contribution deductions for food: FMV and cost basis. Publication 526 (Internal Revenue Service, 2024) states “When determining the fair market value [] take into account the price at which the same or substantially the same food items (as to both type and quality) were sold by you at the time of the contribution. Don’t reduce this amount because the food wasn’t or couldn’t be sold [ ] even though you produced the food exclusively for the purpose of transferring the food to a qualified organization.” Thus, the second period price, , is the FMV of the donated items. Publication 526 also defines the basis as “The basis of contributed inventory is any cost incurred for the inventory in an earlier year that you would otherwise include in your opening inventory for the year of the contribution.” Hence, we take as the basis cost of the donated goods.
Worksheet 1 in Publication 526 (Internal Revenue Service, 2024) specifies the reduction in taxable income for a unit donation of an inventory of cost as the minimum of twice the basis, , and the basis plus half of the profit margin that the firm would obtain if she sold the product instead, . In other words, the firm’s taxable income reduces by . Obviously, would already be deducted from the firm’s taxable income if she sold the product. Therefore, the additional deduction due to the firm’s in-kind donation is given as per unit. In line with Chu et al. (2018), we adopt a general parameterized form for the tax subsidy, , where . Under the current tax law, we have , , and . We also note that Worksheet 1. Donation of Food Inventory specifies a cap of 15% of the firm’s “total net income for the year from all trades or businesses from which food inventory was donated.” To preserve analytical tractability we disregard the cap in the original model but later show that the central findings still hold under the cap in Section 7.
The Demand Model
The retailer’s inventory deteriorates continuously during the selling season and so is the consumer valuation of the products. Let denote the quality of the goods at time , as perceived by consumers, where is the initial quality of the goods at the beginning of the selling season, and is the deterioration rate, which can be determined from temporal data.2 The function is nonnegative and decreasing in . There is a one-to-one relationship between and , as described by . In other words, the better the initial quality of the goods, the longer their shelf life. The specific form of is determined according to the quality deterioration profile of the goods.3 We define average perceived quality functions , , where and .4 We note that is decreasing in , implying that the longer the first period, the lower the quality of the items (and of possible donations) in the second period. Further details on the derivation of and are provided in Appendix 2. For simplicity, we hereafter use , .
The average per unit-time utility of a representative customer in period is defined as , where is the average per unit-time sales, is the selling price, and is the consumers’ valuation of the product per unit-time. This function captures the diminishing marginal utility of consumers. Modulating consumer valuation by quality is a common approach in the literature (Ferguson and Koenigsberg, 2007; Lowrey et al., 2023). Maximizing yields , which is the average per unit-time demand in period .5 We note that can also be considered a price-sensitivity parameter in this context, which can be interpreted as: the better the quality of the goods, the less price-sensitive the consumers are. The market potential, per unit-time, is composed of a deterministic part, , and a stochastic part, , which has realization that becomes known to the retailer at the end of the first period. As mentioned before, this is a plausible assumption for many perishables (Cachon and Kök, 2007; Chu et al., 2018; Fisher et al., 2001). These assumptions give rise to the following demand system:
We assume has a finite mean, , and standard deviation, , and it is drawn from a cumulative distribution , which is defined over , twice-differentiable in its domain and has a non-decreasing hazard rate. We also assume , , to ensure that the sale of goods generates a positive profit margin for the firm. Finally, we assume that the firm never sets a price that would result in negative consumer demand. Beyond the conventional economic rationale, an additional consideration is that excessively high prices may attract regulatory scrutiny and increase the likelihood of a tax audit. Moreover, the donation cap in Publication 526 (Internal Revenue Service, 2024) limits the maximum tax-subsidy attained, making an excessively high price unnecessarily risky for the firm.
Society’s Objective
The retailer, as a for-profit entity, aims to maximize her after-tax profit over the two periods, a detailed description of which is provided in Section 4. Governments offer tax-subsidies with aspiration of improving total welfare and accessibility to fresh goods. To avoid introducing additional notation, we briefly describe the government’s societal objective here and present the detailed formulation in Section 5.4. We define per unit-time total welfare, , as follows:
The first component of total welfare is the retailer’s profit, which improves with the tax-subsidy. The second component is consumer surplus. The impact of the tax-subsidy on consumer surplus is unclear, as it is not obvious how the tax-subsidy would affect prices. The third component is the dollar value of donations, made possible by the tax-subsidy. The fourth component is the dollar value of the tax-subsidy (affecting tax income that the society would have earned). Hence, the net effect of a tax-subsidy on total welfare is not clear. Our goal in this article is to untangle the impact of the tax-subsidy on total welfare and its components.
The Retailer’s Problem
In this section, we describe and solve the retailer’s problem both with and without the tax-subsidy. We do so using backward induction, starting with the second period.
The Second Period
The Problem Without Tax-Subsidies
Let denote the realized demand per unit-time. We use the inverse demand function, , for convenience. We first define the per unit-time before-tax profit function of the firm without donations:
Without a tax-subsidy, the retailer maximizes her profit from period 2 sales subject to an inventory constraint. Let denote the effective tax rate and denote the retailer’s optimal profit per unit-time without donations, provided that there are units of inventory available. Then,
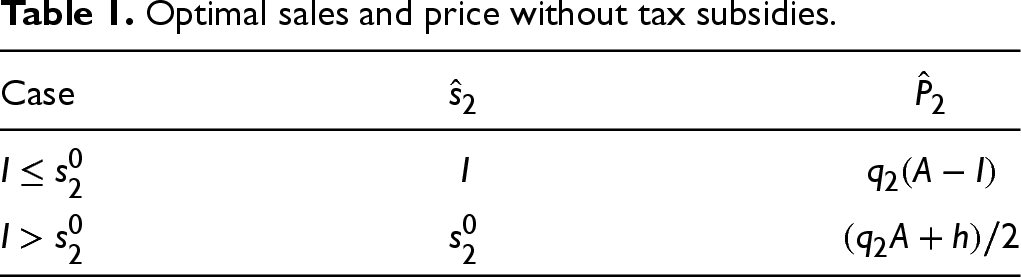
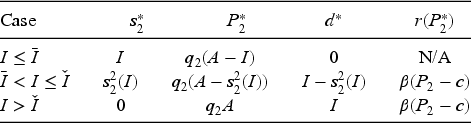
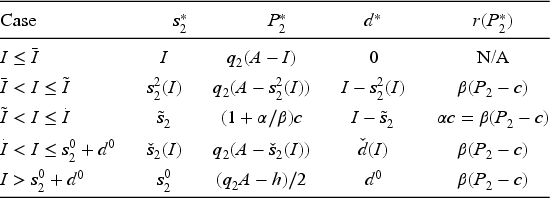
One can easily show that is concave. Define . The retailer’s optimal sales without the tax-subsidy, call it , and resulting price, are then obtained per Table 1.
Optimal sales and price without tax subsidies.
Case
As per Table 1, without tax-subsidies, there is a target sales quantity, , such that, when , the retailer simply sells all available units, whereas, when , she sells only units and the rest of the inventory goes to landfill. Note that () is increasing (decreasing) in . Additionally, both and are increasing in . In other words, without the tax-subsidy, both sales quantity and price are monotone in both on-hand inventory and quality.
The Problem With Tax-Subsidies
With the tax-subsidy, the retailer reduces her tax liability by donating food per the stated IRS policy. Letting denote the retailer’s optimal profit per unit-time with the tax-subsidy, then,
where is the per unit donation subsidy. The first term in the right-hand side of equation (6) stands for the retailer’s after-tax profit from sales, while the second term stands for the tax deduction she receives for her charitable donations.
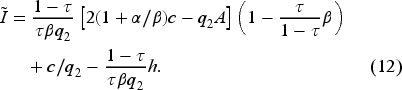
We introduce the following notation:
where satisfies , while and are the optimal sales quantities derived from solving the right-hand side of equation (6) without considering the inventory constraint for and , respectively.
Let , , and denote the optimal sales quantity, charitable donations, and price, respectively, with tax-subsidies. The following theorem characterizes the firm’s optimal solution.
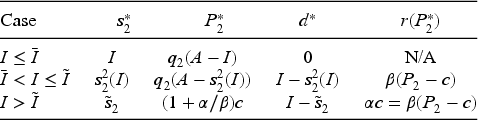
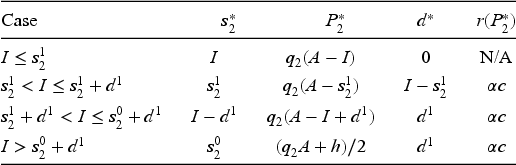
The firm’s optimal second period policy for different quality regimes can be specified as follows:
Low quality:
Medium quality:
High quality:
where , , and are defined such that , , and :
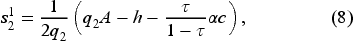
In the first scenario, the quality of the goods is low and so is their sales revenue. When inventory level is below , the retailer chooses to follow carry all strategy to meet the demand and does not engage in donations. When inventory level is between two threshold values, , she sells units, defined per equation (9), and donates the rest. For a sufficiently large inventory, , the firm follows donate all policy.6 The retailer faces analogous cases in the second scenario, where the quality of the goods lies within two threshold values. The retailer chooses to sell all available inventory when and gradually donates as grows for . However, when she has ample inventory, , she offers part of the inventory, , given by equation (7), in the market, and donates the rest. In the third scenario, the goods are so fresh that they qualify as high quality items. The firm sells up to the desired sales level, , given by equation (8), and donates the remaining inventory. Notably, this policy resembles the one without tax-subsidies given in Table 1.
Based on the results above, we make the following observations (we use increasing/decreasing in the weak sense, unless otherwise noted).
Under each scenario, there is an inventory threshold, below which the firm follows carry all strategy. Specifically, the threshold is in the low and medium quality scenarios and in the high quality scenario. Additionally, the optimal donation amount, , is increasing in .
The firm carries forward the entire available inventory when in both the low quality and medium quality scenarios, as well as when in the high quality scenario. In cases where the firm’s inventory is limited, as expected, sales yield greater revenue compared to donations. However, as on-hand inventory increases, the marginal contribution of sales to the profit diminishes and the retailer becomes more charitable.
Both the optimal sales and price, and , can be increasing or decreasing in on hand inventory, .
Interestingly, is monotone decreasing, therefore, we observe situations in which donations cannibalize the sales when the goods are of low or medium quality. In other words, the more inventory the retailer has the less she sells (and the more she donates), which is perhaps counter to intuition and to the policy without tax-subsidies. As the tax-subsidy is tied to the FMV of the goods, the firm faces an interesting trade-off: (1) each additional unit sold generates sales revenue, but simultaneously lowers the selling price, which may reduce ; on the other hand, (2) donating an extra unit relinquishes sales revenue while elevating the selling price, which may enhance and thereby compounding the total tax deduction collected. Thus, the interplay between sales revenue and tax-subsidy may result in a decrease (increase) in the selling quantity (price) as increases.
For a given on-hand inventory, , the firm’s optimal sales quantity (price) under the tax-subsidy is always lower (greater) than that without tax-subsidies, that is, and .
One can show that the inventory thresholds provided by Observation 1, and , are both less than . By Theorem 1 and Observation 2, we have (or ) is non-increasing (or non-decreasing) in for in the low and medium quality scenarios as well as in the high quality scenario. As a result, for a fixed , the tax-subsidy tends to decrease the firm’s sales and increase the market price. While generous charitable donations enable food banks to serve more people, they are also prone to erode purchasing power and drive more people to food banks. Hence, their impact on fresh food accessibility may be subtle. We delve into the broader consequences of the tax-subsidy in Sections 4–6. The following example illustrates the optimal inventory carrying/donation policy of the firm for medium quality.
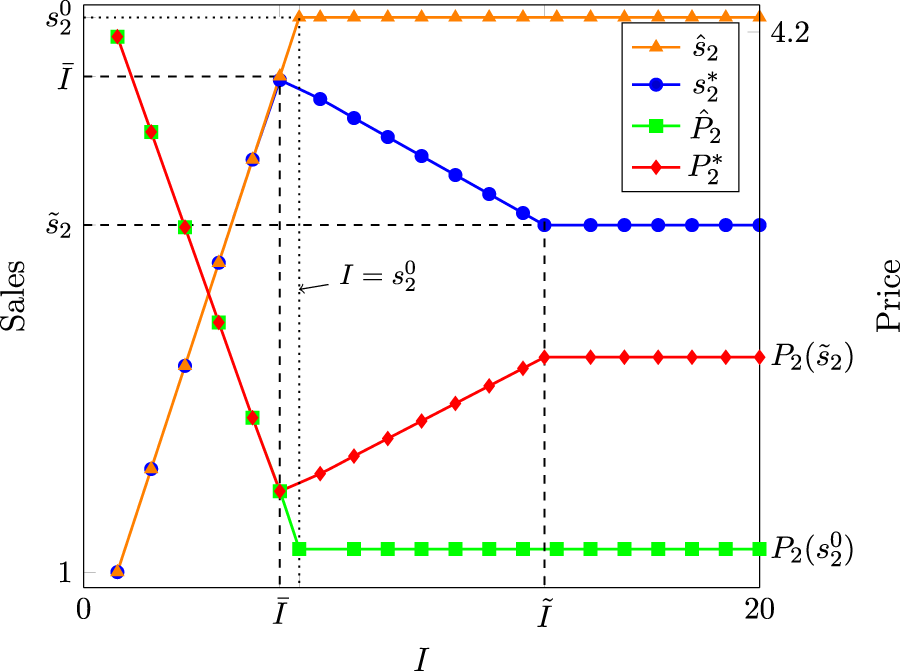
(Medium quality)
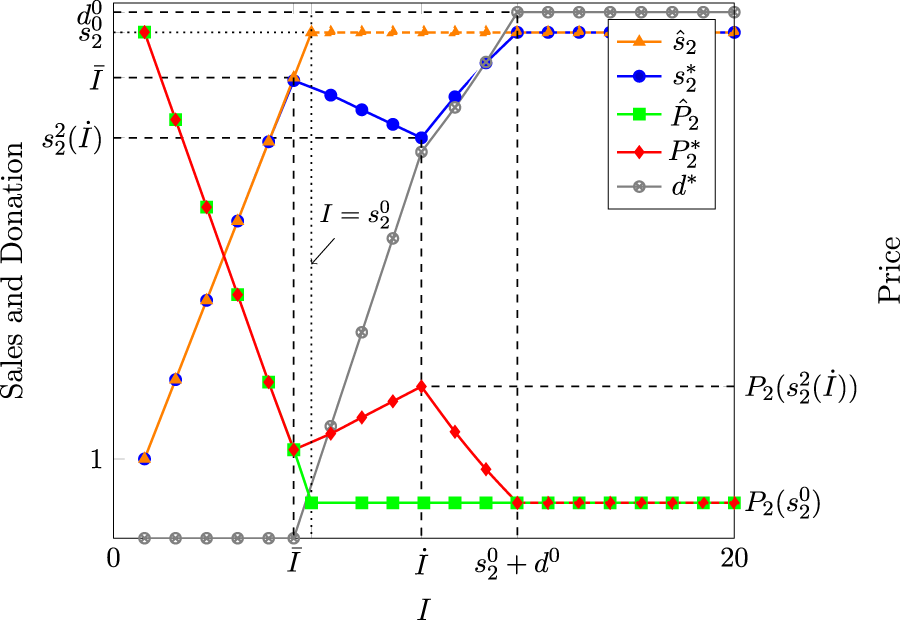
Let , , , with tax rate and government subsidy parameters and . This setting leads to , , , , and .
Figure 2 depicts the optimal sales amount and clearance price with respect to leftover inventory with and without the tax-subsidies. We do not include the firm’s optimal donation amount as it is simply . As described in Observation 1, the firm follows carry all strategy when . She starts selling (donating) gradually less (more) as increases for , as discussed in Observation 2. Finally, the optimal sales quantity settles at for . The market price, , shows the mirror image of the sales. The optimal solution without charitable giving results in a more straightforward policy, where the sales level, , ascends until and then settles at that point, resulting the optimal price . As given by Observation 3, we have and .
The optimal sales amount and market price with respect to different leftover inventory levels.
The First Period Problem
At the start of period 1, the retailer jointly determines the purchasing quantity, ,7 to be sold over two periods, and the first period price, , both with and without tax-subsidies. The market potential, , has an uncertain component, , defined on the interval with twice differentiable cumulative distribution function , density function , mean , and standard deviation .
The first period’s per unit-time demand can be written as , where is defined as the deterministic part of the demand, . To assure the positivity of demand, must be less than its upper-bound, . Following Petruzzi and Dada (1999), we define the stocking factor variable, , and optimize the problem over . We start by developing the firm’s random before-tax profit function per unit-time in the first period:
which is essentially a newsvendor problem with demand having an additive randomness. The retailer’s per unit-time expected before-tax profit can be represented as,
where is the expected shortage. Next, we derive some properties of the retailer’s first period before-tax expected profit function. Following existing literature (Petruzzi and Dada, 1999; Zabel, 1970), we first define the price for a fixed and search over the resulting optimal trajectory.
For a given , is maximized by a unique price given by
where is called the riskless price that maximizes the profit in the absence of uncertainty.
Note that when , we may realize as the firm will commit to her stocking quantity for two-periods. In such a case, there will be no shortage during the first period and the optimal first-period price will be the riskless price, . We see that is an increasing function for and that we assume to assure the positivity of demand for .
The retailer’s per unit-time expected before-tax profit in period 1, , is concave for if , and is unimodal with a local maximum, otherwise. Also, is a linearly decreasing function for with .
Petruzzi and Dada (1999) showed that is unimodal for , whereas, Lemma 2 extends their result by introducing the conditions under which is also concave, and evaluating the behavior of for .
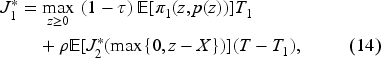
The retailer’s expected after-tax profit over two periods with tax-subsidies, denoted by , is given by
where is the discount rate. simply maximizes each period’s per unit-time profit by the corresponding period length. Replacing with in equation (14) yields the firm’s expected profit without tax-subsidies, . Notice that the conditions of Lemma 1 still hold as the second term in (14) is independent of the first period price and we can optimize the problem over the stocking factor. The following theorem describes the solution to the firm’s problem over two periods.
The optimal stocking factor, , can be found by an exhaustive search over, at most, three critical points.
It is worth mentioning that, in our numerical experiments, we have always found a unique for low and medium quality scenarios implying that a large variety of parameter combinations lead to a unimodal profit function.
Analysis and Implications of the Optimal Policy
In this section, we examine the impact of the tax-subsidy on the firm’s operational decisions and total welfare. In particular, we show the following:
A larger tax subsidy does not necessarily lead to an increase in donations. In some cases, it may actually result in a decrease in donations.
Lower (higher) quality does not always lead to more (fewer) donations.
Both period 1 price, , and stocking quantity, , increase under the tax-subsidy.
Total welfare, , does not necessarily increase under the tax-subsidy.
Greater Tax-subsidies May Lead to Fewer Donations
In this section, we analyze the role of the tax subsidy parameters on the firm’s optimal second period decisions and charitable donations.
A larger tax-subsidy does not always lead to more donations. In particular, the optimal donation amount, , is
increasing in , and
decreasing in when and quality category is medium (as per Theorem 1) and increasing otherwise.
Theorem 3 shows that, perhaps unexpectedly, an increase the tax may not necessarily result in more donation (recall that higher values of and are associated with a higher tax-subsidy). This result can be explained as follows. The firm faces a trade-off between donating more to capitalize on an extra deduction directly and selling more at a discounted price to improve revenue from sales. For instance, by donating an extra unit of inventory, the retailer reduces her taxable income but also foregoes the revenue she would obtain from the sale of that item and raises the selling price which, in return, may affect the amount of deductions received. The relative strength of these counter-acting forces determines the volume of charitable donations. This also underscores that, under the existing tax-subsidy framework, it is challenging, if not impossible, to find an combination that maximizes donations for all retailers.
Mathematically speaking, the tax parameters not only affect the optimal sales, but also determine the quality category of the goods by shifting the thresholds specified in Theorem 1. For example, varying may decrease while, at the same time, promote (demote) the goods to a higher (lower) quality category. Hence, we observe a change of rate or direction in donations with respect to a changing tax-subsidy. It is worth mentioning that is determined based on the chemical deterioration process of the goods (see Appendix 2 for details), whereas, the quality category of high, medium, and low, per Theorem 1, is a subjective classification based on market conditions, which include the tax-subsidy parameters. In particular, raising relegates goods to a lower quality category, i.e., falls in an inferior quality category and the retailer is better off selling less and donating more. However, increasing may result in falling in a better quality category. On the one hand, the firm receives a larger incentive to donate, but on the other hand, it has a greater valuation of the inventory. This is why we observe the undesired outcome of tax deductions only for varying values. When conditions given by the second part of Theorem 3 are met, we observe and . Therefore, increasing enables the retailer to attain the same amount of tax deduction for fewer donations. As shown by Figures 3(a) and 3(b) in Section 6.2, this effect is present over the two period problem as well. Hence, it remains unclear whether such a mechanism truly enhances food accessibility.
The impact of the length of first period and the tax-subsidy parameters on total welfare and donations.
Lower Quality Does Not Lead to More Donations
A factor affecting the retailer’s optimal decision in the second period is the quality (and shelf-life) of the goods, . Several factors, including the resolution of uncertainty in demand either earlier or later than anticipated, could potentially lead to a modification in the value of . The following theorem sheds light on the role of quality (and shelf-life) of the goods on the retailer’s donation decision.
The amount of donation is non-monotonic in product quality (and shelf-life). Specifically, can be increasing or decreasing in when , and always decreasing in , otherwise. Assuming holds, donations are
increasing in when quality is medium (per Theorem 1) and or when quality is low and ;
decreasing in , otherwise.
Theorem 4 demonstrates another effect, namely, a longer shelf-life (better quality) may result in more donations. The rationale behind this finding is explained as follows. Without the tax-subsidy, the retailer increases both the sales and price, that is, and are both increasing in . While this (intuitive) strategy improves the revenue from sales, it also curtails the tax deductions because of a decrease in donations and, therefore, may undermine the firm’s after-tax profit. Thus, the firm should carefully analyze the interplay between the marginal contributions of sales and donations, and Theorem 4 provides guidance for achieving that. This involves comparing the relative cost of carrying forward a unit of inventory, , and the relative deductible due to donating it, , both of which take values between 0 and 1. When the latter outweighs the former, we may observe an increase in charitable donations as the quality increases or, equivalently, the shelf-life prolongs.
To better understand why this effect occurs only for certain on-hand inventory and quality category combinations, we revisit Theorem 1. When the goods are categorized as high quality, the retailer always charges a sufficiently large price that yields . In this case, the profit margin is large enough to compensate for the drop in deductions. As a result, donations decrease as quality increases. On the other hand, when quality is medium or low with (corresponding to case of Theorem 4), we have , i.e., increasing boosts the tax deducted per unit of donation. Hence, if , the retailer carries fewer units over (donates more) to accelerate the increase in price due to the prolonged shelf-life (higher quality). Finally, when , we have and the retailer meets the increase in demand by selling more (donating less). We observe the same effect over two periods, as depicted by Figures 3(a) and 3(b) in Section 6.2.
Period 1 Price and Quantity Both Increase with Tax-subsidy
The opportunity of donating inventory affects the firm’s first period decisions as well. The following theorem shows that donations drive the retailer’s stocking quantity and first period price up.
Both the first period price and stocking quantity increase with the tax-subsidy. That is, and .
Theorem 5 points out an important consequence of charitable donations when government subsidies are tied to the market price. The retailer sees donations as a salvaging opportunity for the deteriorating inventory. As a result, she stocks more units and charges a higher price. Hence, it is not clear if the tax-subsidies address the government’s societal objective. Chu et al. (2018) report that either price or quantity increases with charitable donations. However, in their numerical example, the retail price drops while the stocking quantity rises. The difference between their results and ours can be partly explained by how randomness is considered. They assume a linear demand with a multiplicative random term. In line with Petruzzi and Dada (1999), the optimal price without uncertainty is higher than the optimal price under uncertainty when randomness is additive, but the reverse is true when randomness is multiplicative.
Tax-subsidies Do Not Always Improve Social Welfare
Let denote the expected surplus inventory at the end of period 1. Then, the optimal second period sales when the ending inventory of period 1 is equal to can be denoted by , which is the optimal solution to . We assume that donated goods contribute to total welfare by , where and reflect the increase in welfare due to charitable donations and serves as a calibrating parameter.We also consider the firm’s profit per unit-time over the selling season by defining .
The first term in (15) stands for the corporate profits. The second and third terms correspond to the (expected) consumer surplus in periods 1 and 2, respectively. The fourth term corresponds to the contribution of donations while the final term deducts the government subsidies paid from the welfare. As a benchmark, expected total welfare without government subsidies is given by
which consists of three terms with similar interpretations to the first three in . Note that two of the three components of total welfare increase in response to tax-subsidies: (1) corporate profits, that is , and (2) the contribution of donations, . Consequently, the third component, consumer surplus, determines whether tax-subsidies enhance total welfare. Although consumer surplus is likely to drop, it is not possible to arrive at a definitive conclusion. By Theorem 5, consumer surplus in the first period decreases as but we also observe an increase in unsold units at the end of period 1, that is as . Therefore, the direction of the change in consumer surplus is determined by market conditions. In numerical experiments, we observe that consumer surplus decreases under most market scenarios.
These findings give rise to the following observation.
When , there exists a threshold value, , such that if and only if .
Observation 4 points out that tax-subsidies are not always welfare-enhancing.
Results From Numerical Experiments
In this section, we present numerical results that illustrate the impact of randomness, the duration of the first period (which affects product/donation quality), and tax-subsidy parameters on the retailer’s optimal policy and total welfare. To allow for meaningful comparisons, we provide results for the benchmark case of no tax-subsidy.
We construct scenarios by considering different combinations of the data presented in Table 2. We consider a linear quality deterioration scenario, as described in Appendix 2, that gives rise to hours of shelf-life, but we also vary , which allows us to examine different combinations for the values of and . We note that fixing and varying would result in analogous scenarios. Given the fast deteriorating nature of the goods, we set to 1. We normalize the expected market potential, , to and vary the pair to alter the prominence of the uncertainty. According to the current tax law, the U.S. government imposes a corporate tax rate of . This gives rise to a feasibility region of for the tax incentive parameters. We consider different values of , with corresponding to goods of high quality in the second period, whereas indicates the goods are of low quality. Thus, we can examine all three quality categories. This setting generates 54 different scenarios. However, as specified in Theorem 3, and affect the firm’s optimal decisions in the second period in different ways. Therefore, we consider two cases: in Case 1, both parameters increase and in Case 2, both decrease as varies from 0.5 to 3.5. As a result, we solve 108 scenarios and present the highlights of our analysis in this section.
Parameter values used in numerical experiments. We consider all parameter combinations for two cases: Case 1 and 2 for different values of and .
,
,
,
,
Case 1:
Case 2:
The Retailer’s Optimal Policy
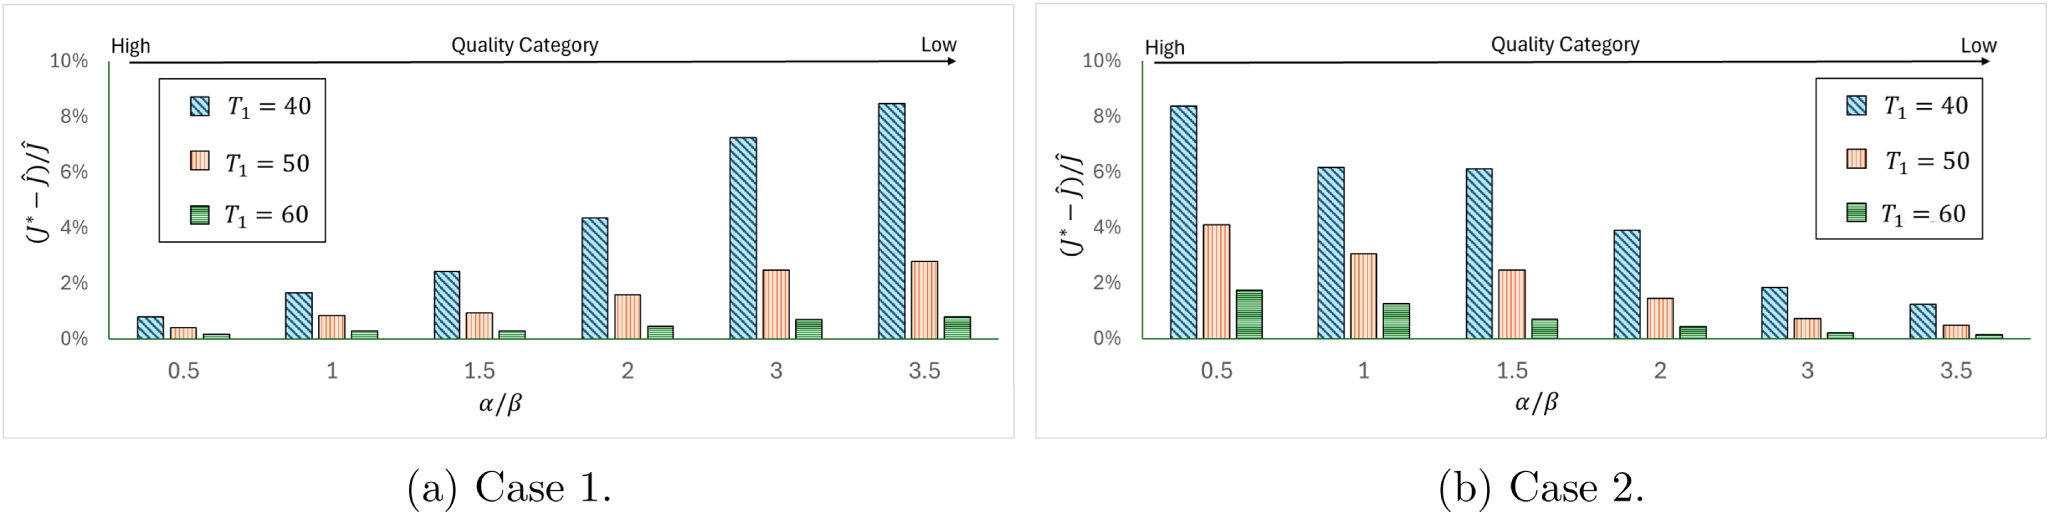
We analyze changes in the expected after-tax profit, , with respect to various values of and . A shorter first period simplifies operational planning and increases expected profits, and . Our focus is on the tax-subsidy’s impact on retailer profits. The results from Case 1 and Case 2 are averaged and shown in Figures 4(a) to 4(b). For a given , the profit gap grows as decreases. A shorter period improves the quality and quantity of leftover inventory and this allows the firm to leverage the second period price to increase the tax deduction. Moreover, a larger pair leads to a greater profit differential, particularly when is small. When , however, the profit improvement remains marginal. For both cases, the largest pair yield approximately 8% improvement in profit, while the lowest values yield gains under 2%. These results suggest that the magnitude of pair has a stronger influence on profitability than the firm’s quality categorization of the inventory.
The impact of the tax subsidy parameters and on the expected after-tax profit.
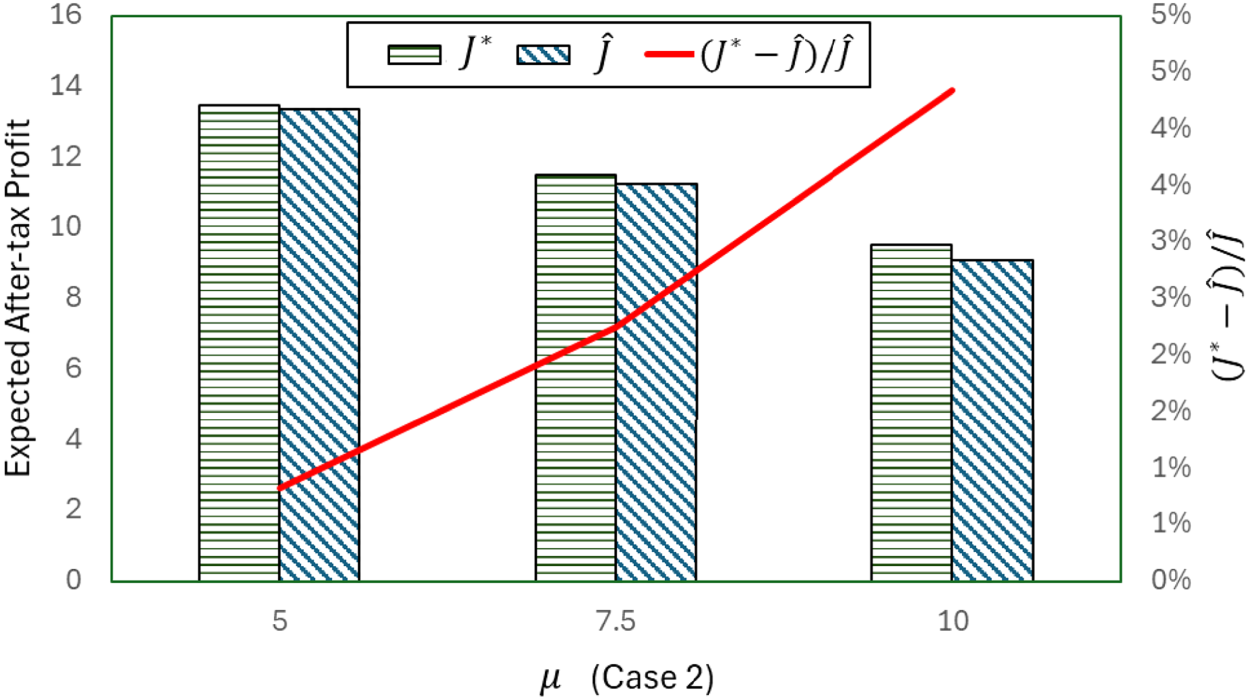
The impact of demand uncertainty on the expected after-tax profit.
Next, we examine the impact of uncertainty on the firm’s profit as illustrated by Figure 5. Because both Case 1 and Case 2 display similar results, we only present the graph for Case 2. We can see that the retailer suffers from higher uncertainty with or without the tax-subsidy. However, the firm’s profit under the former seems to be more resilient to uncertainty as the profit gap grows with the increase in the randomness in demand.
Total Welfare and Charitable Donations
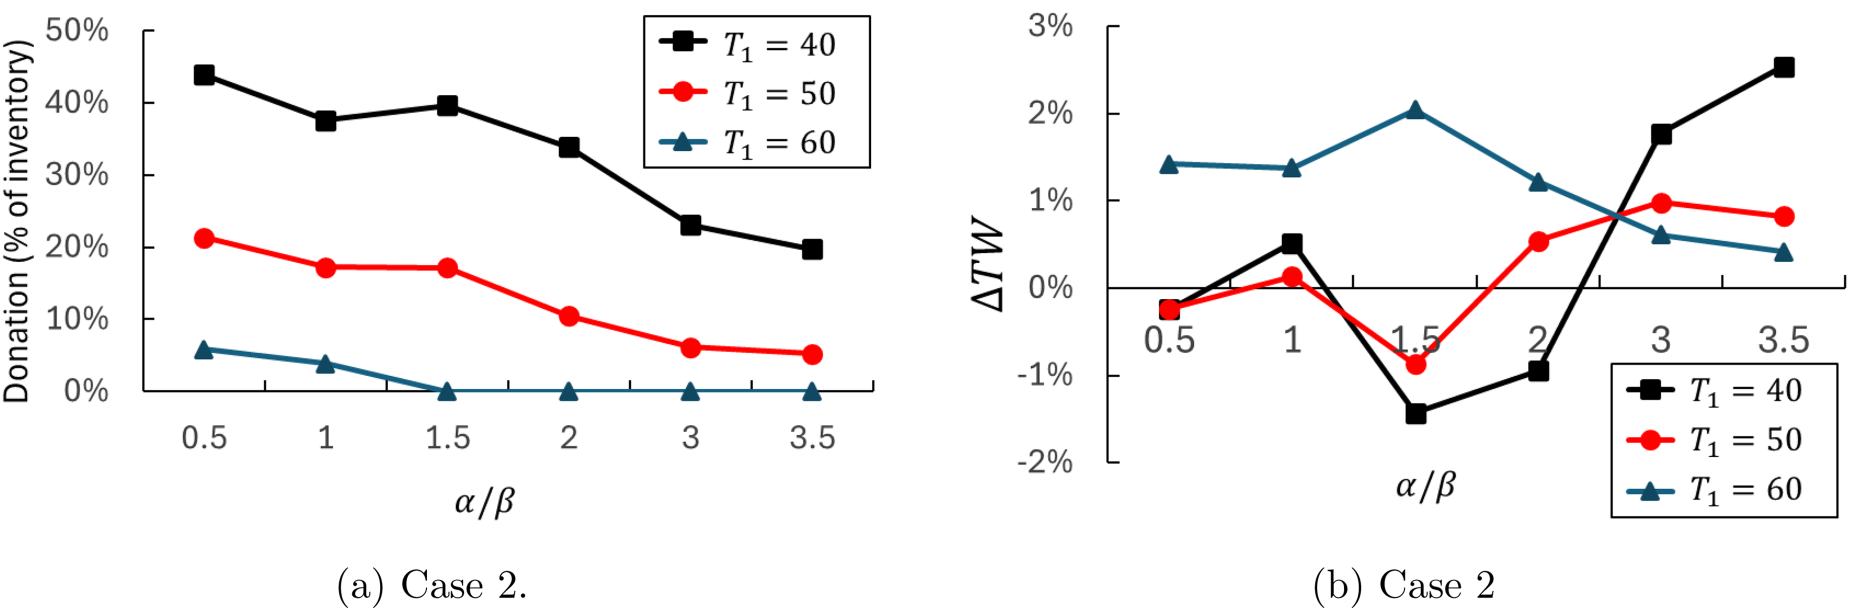
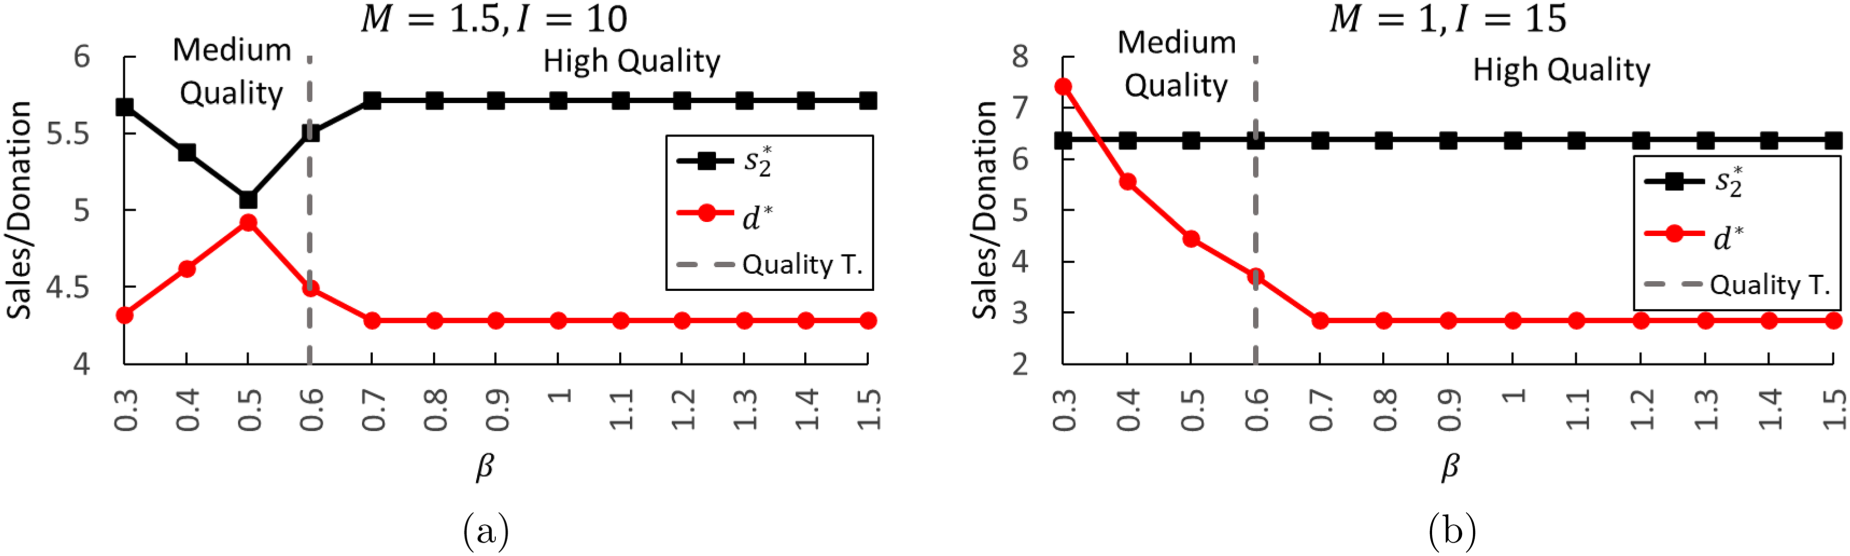
In this section, we examine the impact of varying problem parameters on total welfare and donations for and . We define and to denote relative changes in (expected) total welfare and consumer surplus.
Figures 3(a) and 3(b) illustrate the impact of , the length of period 1, and the tax-subsidy parameters on the proportion of (expected) donations within the leftover inventory at the end of period 1 and . These results are presented exclusively for Case 2, which offers particularly notable insights. Overall, changes in both total welfare and donations exhibit non-monotonic behavior with respect to varying tax-subsidy levels for . This finding extends the results of Theorem 3 to the two-period problem. Note that increasing (decreasing) increases (decreases) the quality of the inventory and, therefore, quality of donations. We observe an interesting effect whereby a firm donates a greater quantity when the goods are of better quality. This result generalizes the effect reported in Theorem 4. Interestingly, total welfare declines sharply as the donation amount increases. This is because the retailer donates more to mitigate the risk of creating a supply surplus in the market, thereby maintaining the value of the goods in period 2. However, this behavior reduces consumer surplus, leading to an overall decline in total welfare.
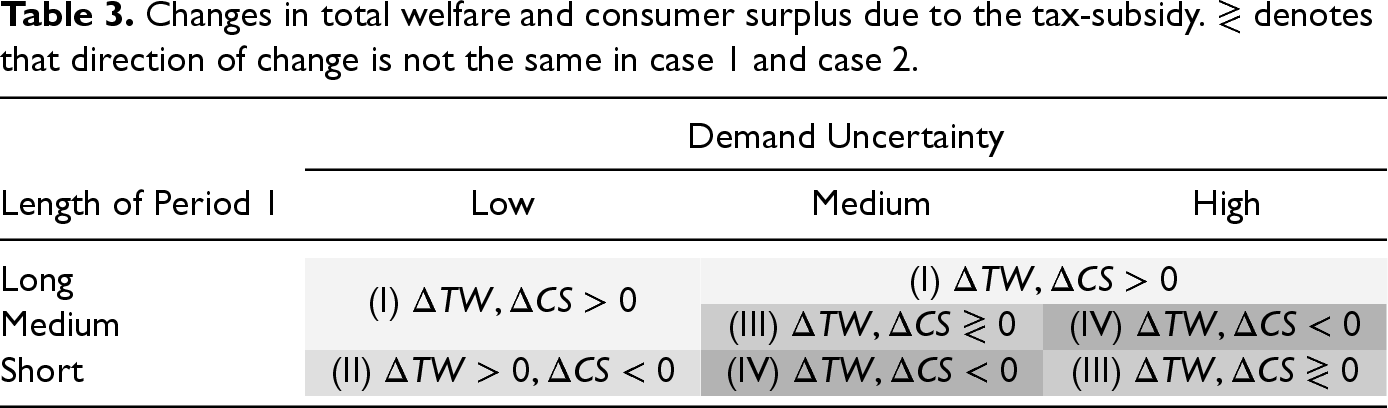
Finally, we examine the impact of demand uncertainty on total welfare and consumer surplus. From Table 3, we observe four possible outcomes: (I) triple-win in Case 1 and Case 2, (II) total welfare increases while consumer surplus decreases in both cases, (III) either total welfare or consumer surplus decreases in one of the cases, and (IV) total welfare and consumer surplus both decrease. These outcomes suggest that total welfare can increase in limited cases: long Period 1, i.e., late (and mediocre quality) donations, or low uncertainty.
When uncertainty is low, both the first-period price and the stocking quantity increase only marginally, but this growth entails a larger expected unsold inventory in the second period. As illustrated in Figure 3(a), the retailer tends to donate less when the ending inventory is of lower quality. Thus, the retailer carries more units forward to the second period thereby decreasing the second period price, which, in turn pulls consumer surplus up under the tax-subsidy. While all components of total welfare increase only marginally, their synergy raises total welfare considerably. On the other hand, when the uncertainty in demand is high, the retailer benefits most from the tax-subsidy. Both donations and profits increase but consumers pay more while the retailer enjoys extra profit. When uncertainty resolves early (region II), corresponding to a short first period (early, possibly, high quality donations), total welfare increases. However, this increase primarily stems from a sharp increase in profits, and it comes at the cost of a substantial drop in consumer surplus.
As a result, we observe that only region (I) achieves a triple-win. In other welfare-enhancing scenarios, the benefits come at a significant cost: a substantial reduction in consumer surplus, which lowers purchasing power and may increase reliance on food banks. This suggests that, under the current tax deduction framework, having retailers donate large quantities of high-quality food may limit the accessibility to fresh goods. Hence, governments should account for the delicate balance in the retailer market while leveraging FMV-dependent tax-subsidies to prompt charitable giving.
Extension: Systems with a Cap on Charitable Food Contributions
The U.S. tax law indicates that a firm is allowed to deduct 15% of its net income from all businesses or partnerships from which the food inventory is donated. In this section, we discuss how such a cap can be incorporated and examine its impact.
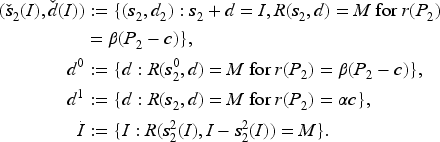
Placing a charitable contribution limit, denoted by (in dollars), for a given product entails the constraint . However, such a constraint poses challenges. First, it results in a non-convex feasible region. Second, the optimal solution might result in , implying that the retailer may lack the incentive to deplete all available units unless market conditions dictate otherwise. The retailer can either donate without receiving additional subsidy or carry the inventory forward to the next period. The latter is assumed, as it represents a more realistic scenario. Consequently, the firm’s problem in the second period becomes,
where is the tax-deduction. The optimal policy for the retailer under the cap is contingent upon both market conditions and the cap limit . A small value of implies a tight cap, while a large value suggests a relaxed cap. Define
We designate as the tight cap scenario, as the semi-tight cap scenario, and as the relaxed cap scenario. We outline the common cases in our analysis below, with more comprehensive details provided in the online appendix.
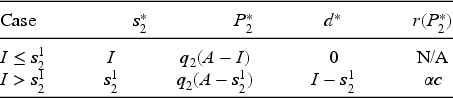
Five scenarios specify the firm’s optimal second period policy:
Low quality:
(Relaxed cap)
(Tight or semi-tight cap)
Medium quality:
(Relaxed or semi-tight cap)
(Tight cap): Same as Scenario (1.2).
High quality:
The firm’s optimal policy in the second period takes a more complicated form with a donation cap included. However, we still observe similarities with the case of no cap. For example, the donation thresholds mentioned in Observation 1 are unchanged and is still increasing in on-hand inventory, . Observations 2 and 3 continue to hold. Obviously, for a relaxed cap, the main findings of this study still hold. Thus, we delve further into the situations where the contribution cap is tight or semi-tight.
Let us revisit Example 1 with a cap of to gain a better understanding of the changes in the firm’s second-period policy. This parameter combination leads to a tight cap situation with and , yielding . Figure 6 illustrates the optimal policy. Since no longer needs to add up to , we also plot the optimal donation quantity, . We continue to observe that the retailer may choose to create the supply scarcity in the market to increase the FMV of the goods for .
The optimal sales amount and market price with respect to different leftover inventory levels.
Given the complexity of the retailer’s problem, analytical treatment becomes impractical to make further comparisons, prompting us to conduct numerical experiments. We are interested in verifying if the central findings of the original model still hold in the presence of a (semi-)tight cap. Thus, we focus on the relationship between the firm’s charitable giving behavior and the tax-subsidy (compared to Theorem 3), as well as the change in total welfare (compared to Table 3).
Starting with the former, we modify Example 1 for two scenarios based on available inventory and cap. In one case (Figure 7(a)), the inventory constraint is always binding and in the other case (Figure 7(b)), the cap constraint is always binding. The reason is that at least one of the constraints is binding in the firm’s optimal policy as presented by Theorem 6 and the firm’s optimal decisions depend on it. We also note that the tightness of the cap and quality category of the goods change with . The parameters result in either a tight or a semi-tight cap in all instances. As depicted in Figure 7(a), the issue of non-monotonicity of donations in the tax-subsidy still persists. Figure 7(a) illustrates even a more interesting case where the firm always receives the maximum deduction from charitable giving, resulting in staying unchanged but gradually decreasing.
Optimal sales and donation quantities for different values and cap/on-hand inventory scenarios.
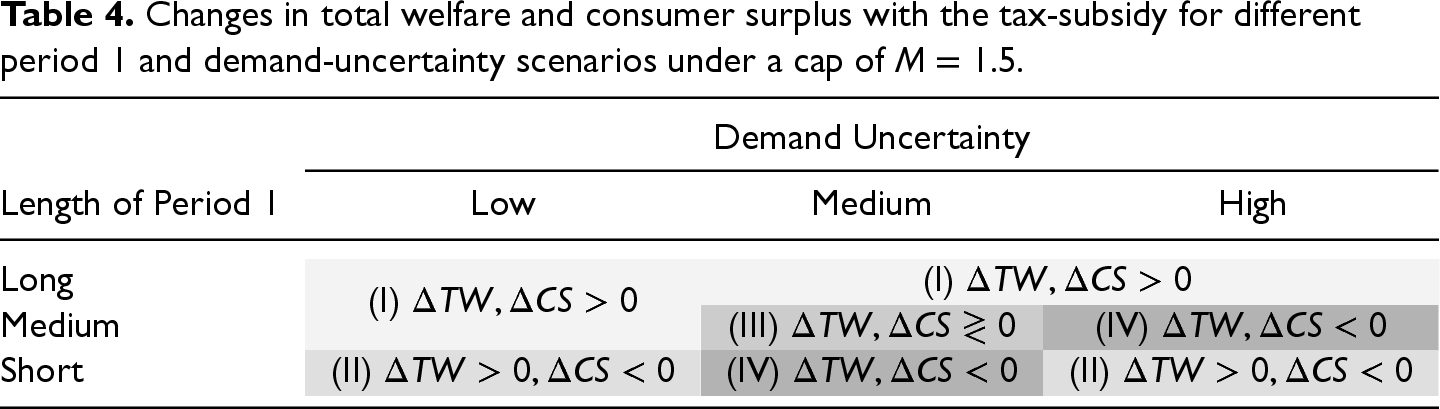
Next, we look at changes in total welfare in the presence of a cap. Table 4 shows four possible outcomes; all but outcome (III) are consistent across both scenarios outlined in Table 2. In contrast to results in Table 3, the cap alters only one outcome: under a short first period and high demand uncertainty, the result shifts from (III) to (II). Nevertheless, the results are similar: the triple-win outcome is achieved only when the first period is long or when it is of medium duration and demand uncertainty is low.
From the above analysis, we can see that the main findings of the original model remain valid under a tax-deduction cap. Our results suggest that products having highly uncertain demand may not be welfare-enhancing under an FMV-dependent tax-subsidy scheme. The non-monotoncity between donations and subsidy continues to hold. In such cases, for example, setting would lead to a basis-dependent policy and might mitigate the undesired outcomes. It is also worth noting that the model with a cap may result in surplus inventory for disposal at the end of period 2. Typically, food waste entails a fee for disposal in most countries. In this respect, equation (17) can be modified to account for a disposal cost without much disturbance in the solution (see Appendix 11 for the details).
Concluding Comments
This article explores the implications of government tax incentives on corporate charitable contributions in a retail setting involving perishable goods. We examine how such incentives influence the operational decisions of a monopolist retailer and the broader societal objectives of the government. We show that tax-subsidies based on FMV can have unintended adverse effects. In particular, the retailer may deliberately create a supply shortage to raise the selling price—and consequently the FMV of goods—to inflate tax deductions. Although this can increase the quantity of charitable donations, it may reduce consumer surplus and erode purchasing power. Additionally, we show that a higher subsidy may not lead to greater donations. The retailer may instead choose to donate fewer units to achieve the same tax deduction while increasing sales revenue. Interestingly, we show that the amount of donations is not monotonic in product quality. The retailer may donate less when inventory is of lower quality and more when it is of higher quality. We investigate conditions under which tax-subsidies can simultaneously increase donations, consumer surplus, and retail profit. This outcome is possible only when retailers donate low-quality goods in modest quantities. Our findings reveal how FMV-dependent tax-subsidies can backfire, reducing both consumer surplus and total welfare while benefiting the retailer. Governments must carefully weigh the benefits of donations against potential harm caused to consumers.
Future work that relaxes various modeling assumptions would help address limitations of the current work. For example, an interesting avenue for future research is to incorporate a demand forecast update model to allow partial resolution of demand uncertainty in period 2. It would then be interesting to examine the impact of uncertainty in period 2 on the firm’s decision regarding the timing of charitable contributions. Another avenue for future research is to consider settings with multiple products. It would be of particular interest to examine how assortment decisions and the charitable contributions cap are affected by donations. Finally, it would be worth considering settings with multiple retailers who compete and examining how competition affects decisions in the presence of donations.
Supplemental Material
sj-pdf-1-pao-10.1177_10591478251350098 - Supplemental material for Who Benefits From Government Tax-Subsidies for Corporate Charitable Food Donations?
Supplemental material, sj-pdf-1-pao-10.1177_10591478251350098 for Who Benefits From Government Tax-Subsidies for Corporate Charitable Food Donations? by Armağan Özbilge, Saif Benjaafar, Elkafi Hassini and Mahmut Parlar in Production and Operations Management
Footnotes
Acknowledgements
The authors thank the Department Editor Chris Tang, an anonymous Associate Editor, and two anonymous referees for their helpful comments and suggestions.
Declaration of Conflicting Interests
The authors declared no potential conflicts of interest with respect to the research, authorship, and/or publication of this article.
Funding
The author(s) disclosed receipt of the following financial support for the research, authorship, and/or publication of this article: This work was supported in part by the Natural Sciences and Engineering Research Council (NSERC) Alliance grant ALLRP 555620-20 and the NSERC Discovery grant RGPIN-2020-06792, both awarded to Elkafi Hassini, and in part by the NSERC Discovery grant RGPIN-2020-05712 awarded to Mahmut Parlar.
ORCID iDs
Armagan Ozbilge
Saif Benjaafar
Elkafi Hassini
Mahmut Parlar
Supplemental Material
Supplemental material for this article is available online (doi: ).
Notes
How to cite this article
Özbilge A, Benjaafar S, Hassini E and Parlar M (2026) Who Benefits From Government Tax-Subsidies for Corporate Charitable Food Donations? Production and Operations Management 35(2): 649–664.
References
1.
AkkaşAGaurV (2022) Om forum-reducing food waste: an operations management research agenda. Manufacturing & Service Operations Management24(3): 1261–1275.
2.
AkkaşAHonhonD (2022) Shipment policies for products with fixed shelf lives: impact on profits and waste. Manufacturing & Service Operations Management24(3): 1611–1629.
3.
AkkaşASahooN (2020) Reducing product expiration by aligning salesforce incentives: a data-driven approach. Production and Operations Management29(8): 1992–2009.
4.
AryaAMittendorfB (2015) Supply chain consequences of subsidies for corporate social responsibility. Production and Operations Management24(8): 1346–1357.
5.
BelavinaE (2021) Grocery store density and food waste. Manufacturing & Service Operations Management23(1): 1–18.
6.
BowmanPNgJHarrisonM, etal (2009) Sensor based condition monitoring. Building Radio frequency IDentification for the Global Environment (Bridge) Euro RFID project: 59.
7.
CachonGPKökAG (2007) Implementation of the newsvendor model with clearance pricing: how to (and how not to) estimate a salvage value. Manufacturing & Service Operations Management9(3): 276–290.
8.
ChuLYLiGRusmevichientongP (2018) Optimal pricing and inventory planning with charitable donations. Manufacturing & Service Operations Management20(4): 687–703.
9.
Coleman-JensenARabbittMPGregoryCASinghA (2022) Household food security in the United States in 2021. Technical report, U.S. Department of Agriculture, Economic Research Services.
FergusonMEKoenigsbergO (2007) How should a firm manage deteriorating inventory?. Production and Operations Management16(3): 306–321.
12.
FisherMRajaramKRamanA (2001) Optimizing inventory replenishment of retail fashion products. Manufacturing & Service Operations Management3(3): 230–241.
13.
GiuseppeAMarioECinziaM (2014) Economic benefits from food recovery at the retail stage: an application to Italian food chains. Waste Management34(7): 1306–1316.
14.
HsuVNXiaoWXuJ (2019) The impact of tax and transfer pricing on a multinational firm’s strategic decision of selling to a rival. Production and Operations Management28(9): 2279–2290.
15.
HuangHHeYLiDLiS (2023) Competing multinationals’ backshoring decisions: tax arbitrage versus production reliability tradeoff. European Journal of Operational Research311(2): 515–532.
16.
HuhWTParkKS (2013) Impact of transfer pricing methods for tax purposes on supply chain performance under demand uncertainty. Naval Research Logistics (NRL)60(4): 269–293.
17.
Internal Revenue Service (2024) Publication 526: Charitable Contributions (for Use in Preparing 2023 Returns). https://www.irs.gov/pub/irs-pdf/p526.pdf. The U.S. Department of the Treasury. (accessed: 10 February 2025).
18.
LabuzaTP (1982) Shelf-life Dating of Foods. Westport, CT, USA: Food & Nutrition Press, Inc.
19.
LowreyJDRichardsTJHamiltonSF (2023) Food donations, retail operations, and retail pricing. Manufacturing & Service Operations Management25(2): 792–810.
20.
OsvaldAStirnLZ (2008) A vehicle routing algorithm for the distribution of fresh vegetables and similar perishable food. Journal of Food Engineering85(2): 285–295.
21.
ÖzbilgeAHassiniEParlarM (2024) Optimal pricing and donation policy for fresh goods. European Journal of Operational Research312(1): 198–210.
22.
PangZXiaoWZhaoX (2021) Preorder price guarantee in e-commerce. Manufacturing & Service Operations Management23(1): 123–138.
23.
PetruzziNCDadaM (1999) Pricing and the newsvendor problem: a review with extensions. Operations Research47(2): 183–194.
24.
ShunkoMDeboLGavirneniS (2014) Transfer pricing and sourcing strategies for multinational firms. Production and Operations Management23(12): 2043–2057.
World Food Programme (2024) WFP Global Operational Response Plan 2023: Update # 10. Available at: https://rb.gy/b1qg50 (accessed: 1 May 2024).
28.
WuQHonhonD (2023) Don’t waste that free lettuce! impact of bogof promotions on retail profit and food waste. Production and Operations Management32(2): 501–523.
29.
ZabelE (1970) Monopoly and uncertainty. The Review of Economic Studies37(2): 205–219.
Supplementary Material
Please find the following supplemental material available below.
For Open Access articles published under a Creative Commons License, all supplemental material carries the same license as the article it is associated with.
For non-Open Access articles published, all supplemental material carries a non-exclusive license, and permission requests for re-use of supplemental material or any part of supplemental material shall be sent directly to the copyright owner as specified in the copyright notice associated with the article.