
Abstract
We study the click and purchase behavior of customers in an online retail setting by employing a structural estimation approach. In particular, we aim to understand the impact of the information available to the customer before and after the click on the customer’s search and purchase behavior. We propose a sequential discrete choice framework to model the customer’s search strategy, where the customer repeatedly decides between continuing her search by clicking on a product, or stopping her search and making a purchase/no-purchase decision. By combining the click and order data, our proposed structural framework allows us to disentangle and separately estimate the attractiveness of a product before and after the click. This, in turn, allows us to identify underrated products which we call diamonds in the rough: these are products that have low pre-click but high post-click attractiveness; thus, even though such products have a low chance of being clicked, they have a high chance of being purchased, if clicked. The proposed framework provides an online retailer with new tools and insights to better manage the product assortment based on customer click and purchase behavior. We estimate our model on a data set from the Chinese retailer JD.com. Through simulation studies, we illustrate how our model can be operationalized and used for improving assortment decisions by accounting for the customers’ search behavior. In particular, we focus on a subset of 126 substitutable products as a representative sample of the data and find that the optimal assortments under our model significantly increase the expected revenue compared to the actual assortments displayed by JD.com, and two multinomial logit (MNL) benchmarks.
Introduction

JD.com search page for earbuds (left), and the product page of a specific earbud (right).
The goal of this article is to study the click and purchase behavior of customers in an online retail setting by employing a structural estimation approach that combines customers’ click and order data. In particular, our proposed framework disentangles and separately estimates the attractiveness of products before and after the click. This, in turn, allows us to identify underrated and overrated products on the search page, and use the insights for improving assortment decisions.
Our work is motivated by the data sets that were provided by the MSOM society (Shen et al. 2020). The data sets provide transaction level data from JD.com which is one of the two largest Chinese online retailers. These data sets capture a “full customer experience cycle” from the time of click to purchase to receiving the product. The data sets provide information on close to 400,000 customers and 30,000 SKUs in one specific (unnamed) product category during the month of March in 2018. In this article, we focus on the click and order data. In particular, each entry in the click data set (which contains close to 6 million customer-tied click records) includes the user and SKU IDs, therefore we can track a user’s browsing history. We also have the time-stamps associated with each click which allows us to construct a “click sequence,” that is, the sequence in which a customer browses different SKUs.
Upon visiting the online retailer’s website, the customer is presented an assortment of products. In order to make her purchase decision, the customer might decide to click on a subset (or all) of the available products in order to collect further information about them. Specifically, the customer can observe certain characteristics of each product on the search page. Such observed characteristics might include general product attributes such as product price, brand, and average customer reviews which are readily available to customers on the website (search page); the left panel of Figure 1 shows an example for earbuds on JD.com search page. Based on such observed characteristics, the customer might find a subset of products attractive to explore, in which case she clicks on these products and visits their description (product) pages. On each product page, the customer can obtain a much more detailed description of the product. Specifically, there are some characteristics of the product which are not observable to the customer on the initial search page and are revealed only after the customer clicks on that product. Such pre-click unobserved characteristics might include product description, product specifications, detailed customer reviews, and even an instruction video as illustrated in the right panel of Figure 1. Thus, we define the observed product utility as the utility the customer gets from the product based on the product characteristics that are visible on the search page before the click. Similarly, we define the unobserved product utility as the utility the customer gets from the product based on the product characteristics that are only visible on the product page after a customer clicks on that product.
Even though the customer makes her click decision based on the observed product utilities, the customer’s final purchase decision is based on all the information acquired about the products consisting of both the observed and unobserved utilities. Hence, customers’ click decisions are impacted only by products’ observed utilities while their purchase decisions are impacted by both the observed and unobserved utilities (i.e., products’ total utilities which are the sum of observed and unobserved utilities). Thus, there is an important distinction between the observed and unobserved product utilities and how they impact the chance of a product being clicked or purchased. The retailer can benefit from disentangling the observed and unobserved parts of the product utility as this allows the retailer to classify products into different groups based on their pre- and post-click attractiveness (utilities), as shown in Table 1.
Product classification based on the observed and total utilities.
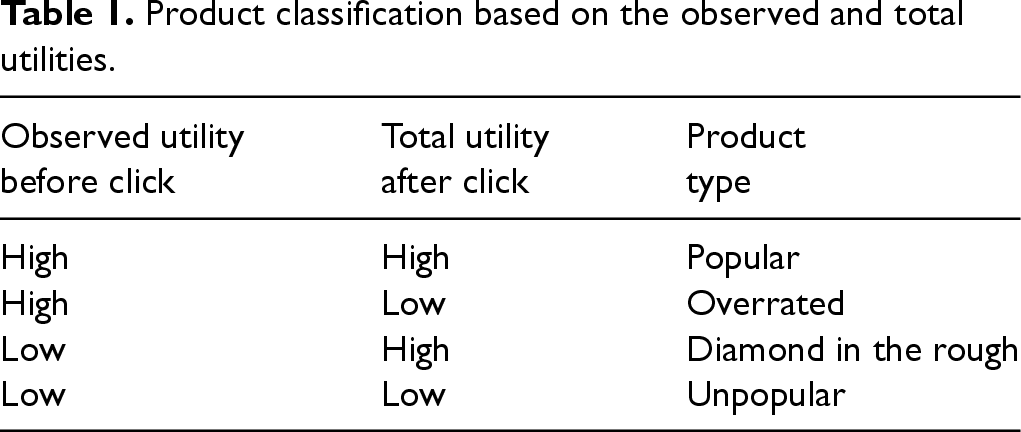
As can be seen in Table 1, products can be divided into four categories based on their observed and total utilities. The first and last categories of products have either consistently high or low utilities both before and after the click and as a result, have simultaneously high or low chances of being clicked and purchased—we refer to these as “popular” and “unpopular” products, respectively. The second group of products, which we call “overrated,” are those with high observed but low total utilities (due to their low unobserved utilities). These are products that have a high chance of being clicked by customers because of their high “face” values (i.e., observed utilities), but their chance of being purchased is low due to their low total utilities. In other words, obtaining more information on the product page reduces the attractiveness of these products for customers. Hence, these products may discourage customers from continuing their search (and perhaps making a purchase), especially those with higher search costs. On the contrary, the third group of products, which we call “diamonds in the rough”, are those with low observed utilities but high total utilities (due to their high unobserved utilities). Thus, even though such products have a low chance of being clicked, they have a high chance of being purchased, if clicked.
To see the value of this categorization, suppose that a product has low sales. This product belongs to category 2, 3, or 4 with at least one of its observed or unobserved utilities being low. If the product belongs to the diamond in the rough category, the retailer may decide to promote it on the search page to compensate for its low observed utility and increase its chance of being clicked and consequently purchased. If the product belongs to the overrated category, the retailer may decide to demote it on the search page or even remove it from the assortment so that customers do not spend time browsing but not purchasing it. Finally, if the product belongs to the unpopular category, the retailer may decide to still keep or remove it based on other assortment considerations (i.e., assortment depth or relationships with vendors) as the product is somewhat “innocuous.”
In our structural framework, we model the customer click and purchase behavior using a sequential discrete choice model. We assume that customers are utility maximizers and choose the option that maximizes their utility. Specifically, at any point during the search process, the customer must decide whether to continue her search by clicking on an unexplored product, or stop her search and make a purchase/no-purchase decision among the clicked products. The search, however, is costly for customers. Therefore, customers should balance the trade-off between the search cost and the benefit of finding a more desirable product during the search process. We assume that customers follow a one-step lookahead policy to decide their search strategy. Specifically, we assume that customers anticipate their expected maximum utility from a subsequent purchase/no-purchase decision, if they were to make one additional click. We note that our model incorporates heterogeneity across customers and products by assuming that the utilities are customer and product dependent. We also allow the search cost to vary across customers.
The model that we propose has two distinct features. First, in our model the customer’s utility from each product has two main parts (in addition to a random shock), one of which is observed and the other one is unobserved to the customer prior to the click. This characterization allows us to disentangle the attractiveness (utility) of a product to a customer before and after it is clicked. Second, not only does our model consider the clicks of a customer, but also it considers the sequence (order) in which the products are clicked. This is inspired by an interesting observation that we make from the data: the product sales are decreasing in the rank (order) of products in the click sequences. This shows that the first couple of clicked products seem to have the highest chance of being purchased. Therefore, the sequence of products that a customer browses (clicks) might indicate the order of attractiveness of those products to that customer.
We take a data-driven approach to identify a subset of products that are substitutable. Specifically, we consider the customers’ click histories and find a subset of products that have been frequently clicked together. This ensures that these products have been considered by customers in the same shopping event, and hence, have a high degree of substitution. We then take a representative sample of 126 products and 30,000 random customers. We estimate our model on this sampled data using maximum likelihood estimation. Our main findings and contributions are discussed next.
Our work is mainly related to two streams of literature: consumer search models, and choice models with consideration sets. In what follows, we review the most relevant literature in more detail.
The first stream of research related to our work studies consumer search models. In marketing there is an extensive and growing body of empirical literature on this topic. For instance, Hortaçsu and Syverson (2004) and Hong and Shum (2006) develop structural approaches to estimate the distribution of consumer search costs using aggregate data. In contrast, De los Santos et al. (2012) leverage individual-level data on web-browsing to study which classical search model is more consistent with observed data patterns. See also Koulayev (2014) and Honka and Chintagunta (2017) for similar studies. In contrast to our work, Koulayev (2014) observes click-stream data on search but not purchase activities; Honka and Chintagunta (2017) identify consumers’ search methods (sequential vs. simultaneous) by using a data set that contains individual-level information on consumers’ consideration sets and final purchases but not search sequences. We, however, study the click and purchase decisions of customers together.
There is also a great body of work in marketing which examines the effect of rankings (positions) on consumer choices. For example, De los Santos and Koulayev (2017), Ghose et al. (2012), Ghose et al. (2014), Koulayev (2014), and Ursu (2018) study the effect of rankings on consumer online choices in the hotel industry. We, however, disentangle the drivers of customer click versus purchase decisions, and use the obtained insights for assortment planning.
Closest to our work is that of Chen and Yao (2017) and Ursu (2018). Chen and Yao (2017) propose a structural model of consumer sequential search under uncertainty about attribute levels of products. Their model integrates consumers’ decisions of search and refinement (sorting and filtering) on an online platform. They use consumer click-stream data of an online hotel booking website and show that refinement tools have significant effects on consumer behavior and market structure. Our model is different from Chen and Yao (2017) in a number of ways: first, Chen and Yao (2017) focus on studying the impact of online refinement tools such as sorting and filtering on consumer search; our goal, however, is to disentangle the product attractiveness before and after the click and use the obtained insights for assortment planning; second, in Chen and Yao (2017) the customer’s optimal search strategy is characterized through the reservation utility model of Weitzman (1979), while we propose a one-step lookahead search policy as described in Section 4.3—a more detailed comparison of our search model with the reservation utility model of Weitzman (1979) is presented in Section 4.5. Ursu (2018) studies the impact of product rankings (positions) on online consumer search and purchase decisions. The author shows that rankings affect the consumer search by lowering the search costs, but conditional on search, do not affect purchases. There are a few major differences between the two works: first, Ursu (2018) focuses on studying the impact of product positions on consumer search, while we aim at disentangling the drivers of click versus purchase decisions and use the obtained insights for assortment planning; second, our models are different in that although we both consider unobserved product utilities which are revealed to customers after the click, Ursu (2018) assumes that the unobserved utilities follow a standard normal distribution (i.e., product utilities do not change on average after the click), while we estimate the unobserved utilities for each product separately by allowing them to change after the click—this, in turn, allows us to identify different types of products based on their attractiveness before and after the click; finally, Ursu (2018) uses the reservation utility model of Weitzman (1979) while we propose a one-step lookeahead search policy.
In the operations management literature several papers study the impact of consumer search cost on pricing, assortment planning, and market expansion (Cachon et al. 2005, 2008; Wang and Sahin 2018). In particular, Wang and Sahin (2018) propose a “consider-then-choose” model with search costs and study the assortment and pricing optimization problems. Our paper mainly differs from the aforementioned work in two ways: first, ours is a sequential search model, while that in Wang and Sahin (2018) is not a search model and only focuses on the consideration set formation (size) which is impacted by search costs; second, they study the assortment and pricing optimization problems analytically, while our contribution is largely empirical by developing a structural model for estimating the consumer search and purchase behavior. Another related work is Derakhshan et al. (2022) which proposes a polynomial-time approximation scheme for the online platform’s rank optimization problem in a setting with consumer sequential search. While Derakhshan et al. (2022) focus on optimizing the permutation of products on the platform, we focus on identifying different types of products by disentangling their attractiveness before and after the click. Moreover, Derakhshan et al. (2022) assume that all customers search the product positions in the exact same order (from top to bottom), while we do not limit the customer search pattern in our model.
The second stream of research related to our work studies consumer choice models with consideration sets. There is an extensive empirical literature in marketing and economics on consideration set formation. For example, Mehta et al. (2003), Kim et al. (2010), Kim et al. (2017), Honka (2014), and Chan and Park (2015) propose structural models for the formation of consideration sets resulting from consumer search, and model consumer purchase conditional on the consideration sets. The main difference between such works and ours is that the search sequences or the purchase decisions are not studied in the aforementioned papers. In contrast, we study both these decisions.
In recent years there has been a growing interest in the operations management literature in studying the “consider-then-choose” choice models where customers first form their consideration set and then make a purchase decision from that set. Aouad et al. (2024) study the assortment optimization problem under the click-based MNL choice model where given an assortment of products, each product has an exogenous chance of being clicked and thus considered by customers. Aouad et al. (2021) develop a dynamic programming framework to study the computational aspects of assortment optimization under a consider-then-choose model. Wang (2022) and Bai et al. (2024) study price and assortment optimization in settings where products with utilities above a certain threshold will comprise the customer’s consideration set. Farzaneh et al. (2023) study joint assortment and pricing under a feature-based consideration set choice model. Gallego and Li (2024) and Jagabathula et al. (2024) study demand estimation under uncertain (random) consideration sets. Our work mainly differs from such papers in that they focus on consideration set formation while we model the customer click and purchase behavior in a setting with search costs.
Data
The data sets available to us were provided by the MSOM society (Shen et al. 2020). These data sets provide transaction level data from JD.com which is one of the two largest Chinese online retailers. These data sets capture a “full customer experience cycle” that begins at the moment a customer browses through the products available on the platform before placing her order and ends at the moment the customer receives the product at her designated location. The data sets provide information on close to 400,000 customers and 30,000 SKUs during the month of March in 2018.
In this paper we focus on the click and order data. In particular, we study the click browsing history of customers and investigate the connection between such clicks and the purchase decisions of customers. We make several observations about the customers’ click behavior which inform the model that we develop in Section 4. We also have information on customer and product attributes (features) which we use in our model to capture the heterogeneity of customers and products.
The click data set contains close to 6 million customer-tied click records. Each entry in the click data set represents a user’s “click event” on a specific SKU’s product page. By visiting a product page, customers can review the detailed description of that product. Each click entry includes the user and SKU IDs, therefore we can track a user’s browsing history. We also have the time-stamps associated with each click which allows us to construct a “click sequence”; that is, the sequence in which a customer browses different SKUs. The click data contains clicks made not only by users who have made a purchase but also by users who did not end up purchasing any products. In fact, only 15% of users in the click data have placed an order. The order data set contains more than half a million order records that are associated with orders of close to half a million customers and more than 9,000 SKUs. The key information in each order entry includes the order, user, and SKU IDs, the order time, and SKU’s price and discount (if any).
The available data also contains information on customer and product attributes. The key information on products includes the SKU ID, product’s type (1 for JD-owned products or 2 for third-party merchants), and two numerical attributes—the specifics of such numerical attributes are not disclosed in the data set. The first attribute takes a value in
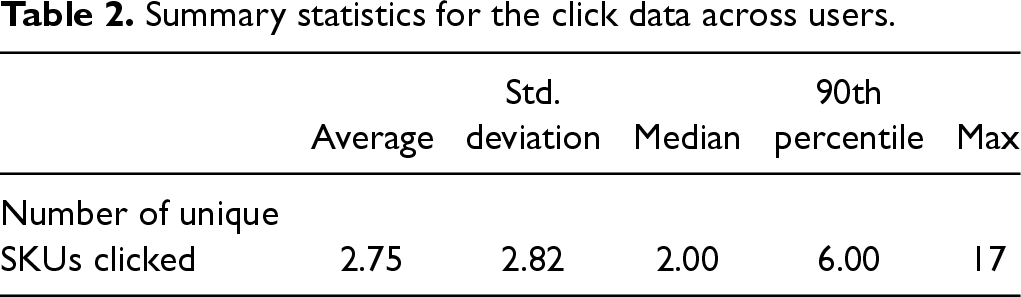
Table 2 provides a few summary statistics for the distribution of the number of unique SKUs clicked by each user, after removing the outliers. As can be noted from Table 2, the average number of clicked products is 2.75 while the median is 2 and the maximum is 17. This shows that the distribution of the number of clicks is positively skewed indicating that while the majority of customers do not click on more than a few products, there are some users who engage in a lengthier search process. The average number of clicks is a small number in comparison to the average number of products in the assortments displayed to customers (e.g., 25-30) which indicates that search is costly for customers. Thus, the model we develop in Section 4 indeed incorporates customer search costs.
As mentioned before, we are interested in studying the click sequence of users to investigate the connection between the click events and the purchase decisions of users. In order to establish such connections, we need to first define the click-rank of products.
Summary statistics for the click data across users.
Summary statistics for the click data across users.
Given a customer’s click history, the “click-rank” of a product is the index of the first time that the product appears in the customer’s click sequence.
Following this definition, in Figure 2 we illustrate the product sales as a function of the click-rank of SKUs among users who have clicked on 2 or more SKUs. For example, the first bar on the left side of Figure 2 shows the number of sold items that were the first product clicked by customers (i.e., click-rank=1). As can be seen in Figure 2, the product sales are decreasing in the click-rank of products; in other words, products with lower click-ranks seem to have a higher chance of being purchased. This observation indicates that the sequence of products that a customer browses (clicks) might indicate the order of attractiveness of those products to that customer. Therefore, the model that we develop in Section 4 should also account for the click-rank of products during the customer search process.
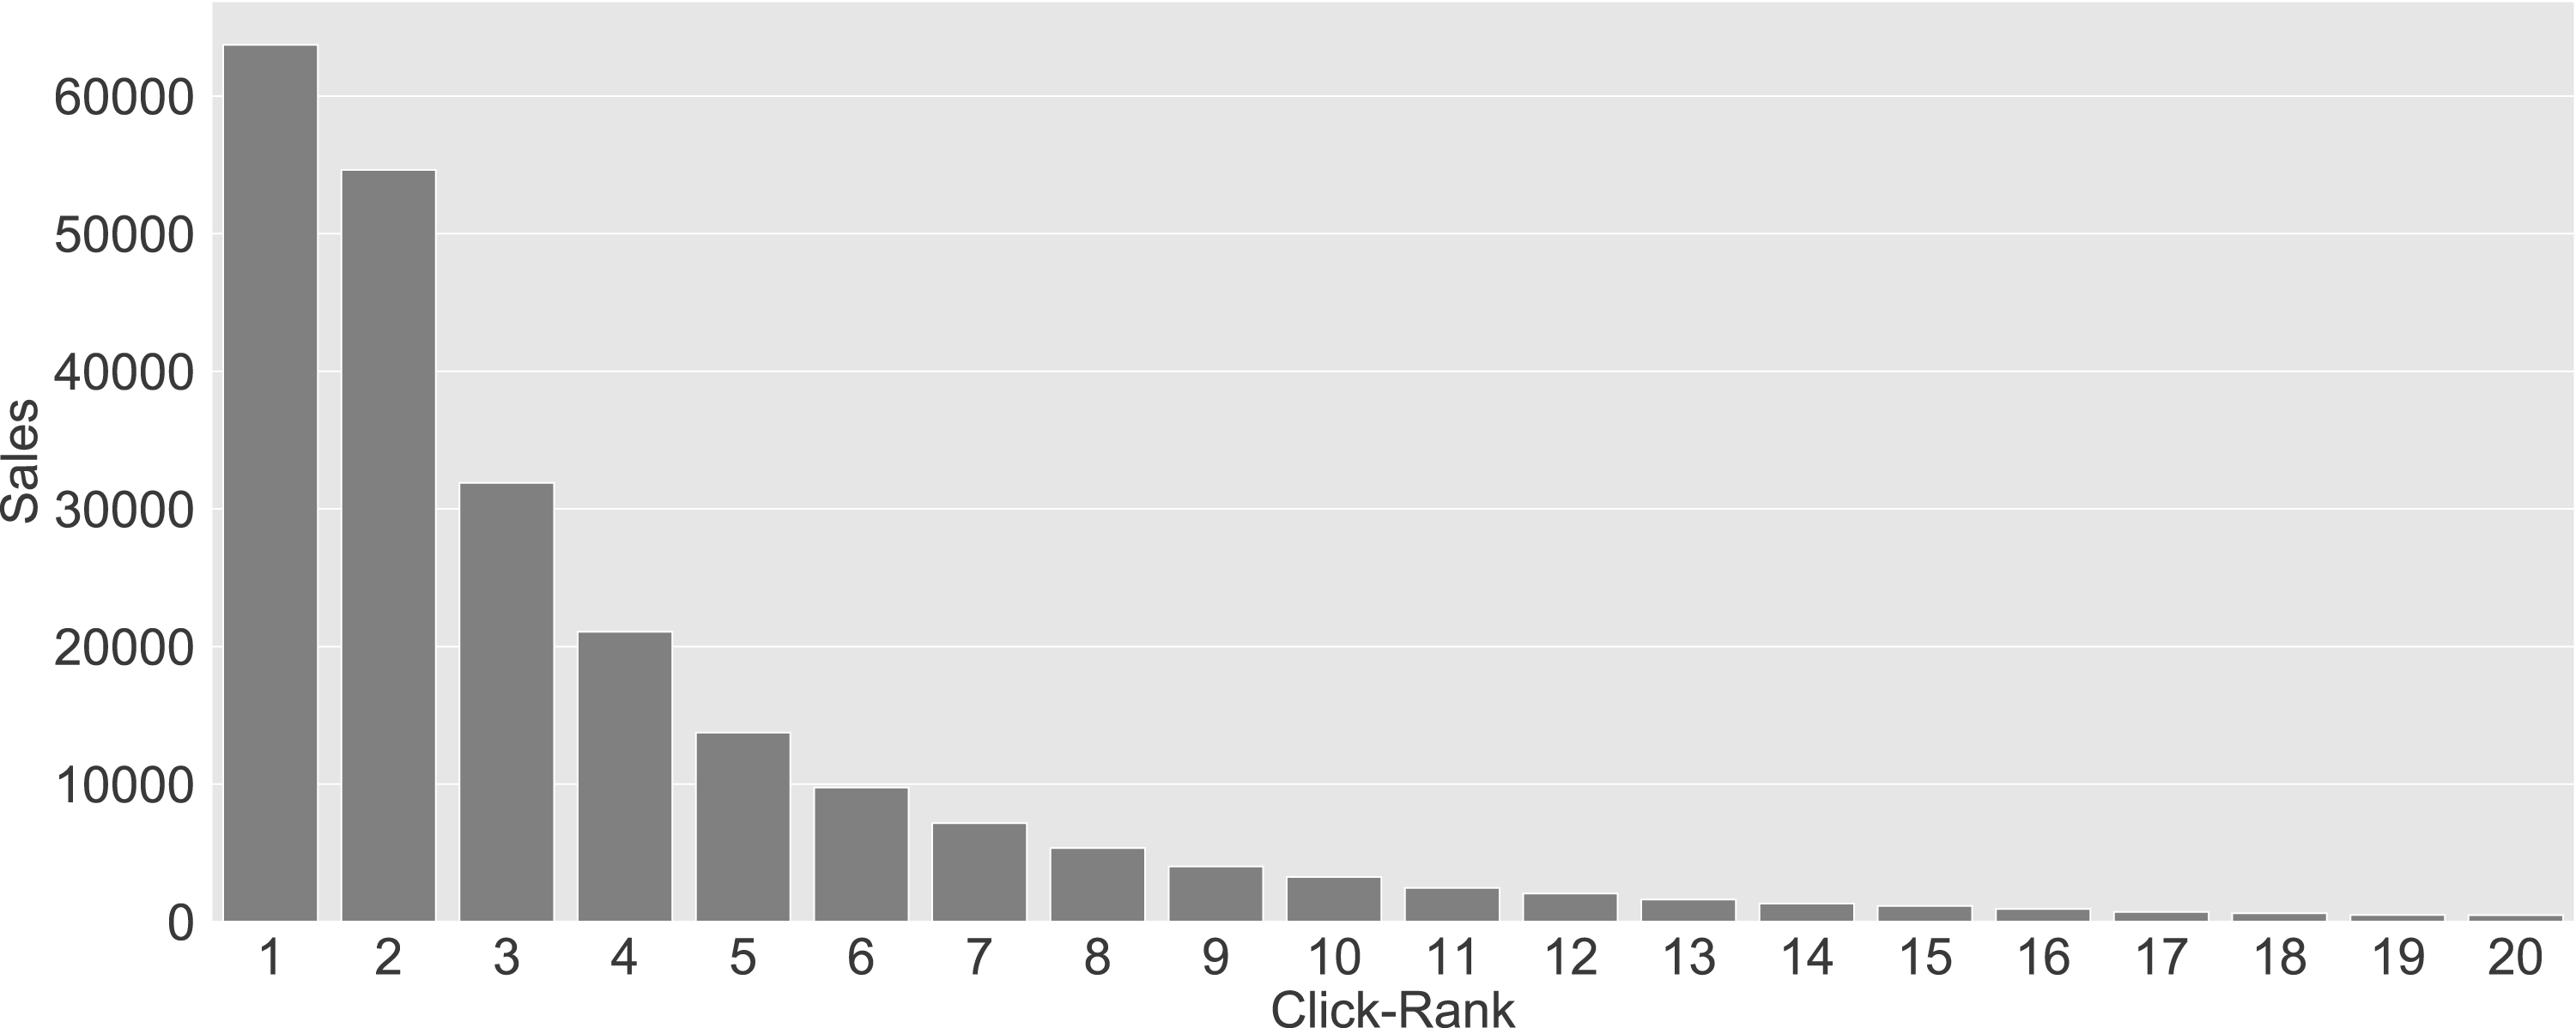
Plot of the number of purchases (sales) as a function of the click-rank of SKUs for click-ranks 1 through 20 among users with 2 or more clicked SKUs.
In what follows we motivate the need for a structural model in our setting. Any model for customer search (click) and purchase behavior needs to control for the offered assortments to capture the substitution patterns between products. For example, low sales of a product could be due to it being offered with a superior product in the assortment rather than the intrinsic unattractiveness of that product. The model also needs to control for the clicked products to capture the customers’ search behavior and cost. For example, a customer may not make a purchase from the offered assortment, but click on one of the products. Accounting for such a click is important as it could indicate the relative preference of the customer for that product over the other products in the assortment. Controlling for the substitution patterns and clicks efficiently is not possible using a reduced-form model for the following reasons:
Given that the substitution pattern between products depends on all products in an offered assortment, reduced-form models cannot effectively capture the substitution patterns as these models need to control for each product and each possible assortment using separate sets of coefficients. This makes the estimation procedure computationally intractable given that the number of possible assortments grows exponentially in the number of products. If a particular assortment or click sequence has not been observed in the data, making predictions or performing counterfactual is not possible using reduced-form models. The key idea of our paper is to disentangle the observed and unobserved product utilities to estimate the product attractiveness before and after the click. Such disentanglement, however, is not possible using a reduced-form approach that does not model the customer click and purchase behavior separately, and only tries to map product features to sales.
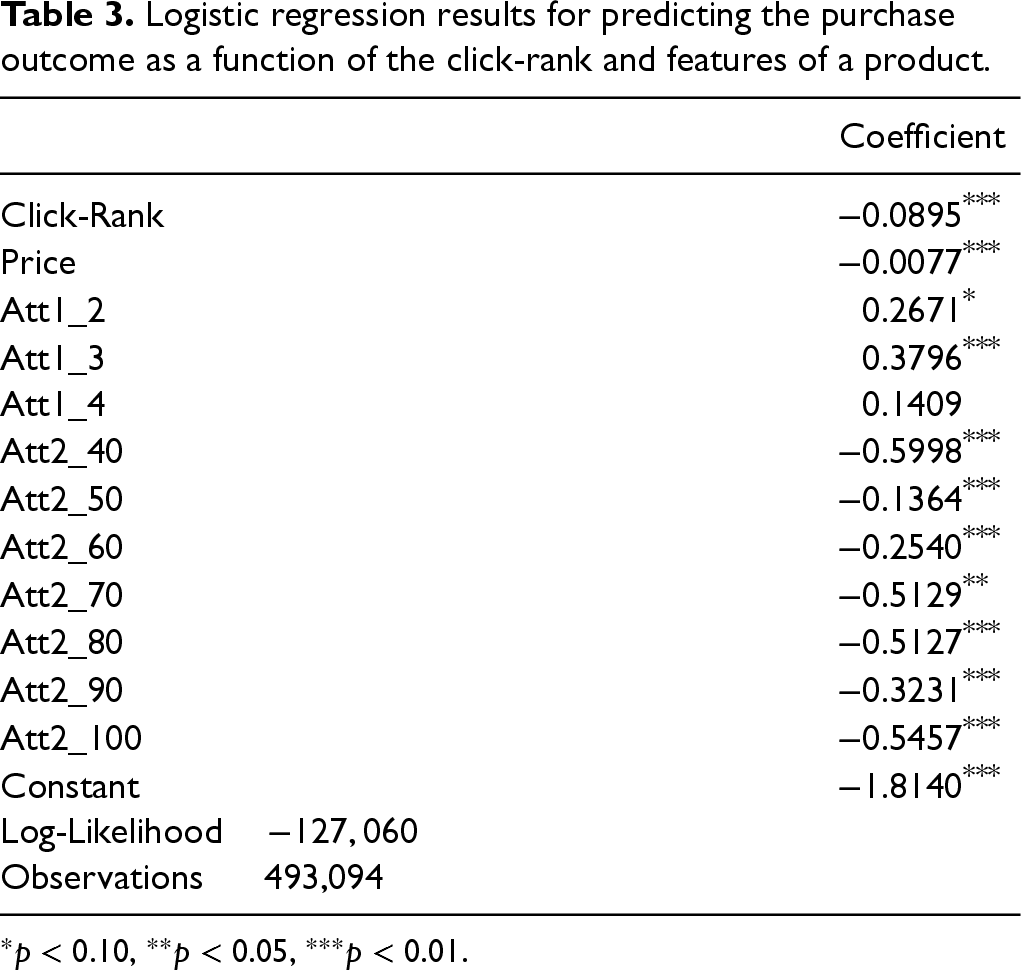
Thus, we propose a structural approach to address the issues above. As motivated by Figure 2, the click-rank of products should also be accounted for when estimating the customer search model. Before presenting our structural model in Section 4, we here provide reduced-form evidence to further justify why the sequence of clicks, which is a novel feature of our model, matters in understanding the customer click and purchase behavior. For this reduced-form analysis, we focus on the set of 131 substitutable products that we identify in Appendix EC.2 using a data-driven approach—please refer to that section for more details. We consider customers who have exclusively clicked on these products and run a logistic regression on their click and order data. Each row of this data indicates a customer’s click on a particular product. We use the binary purchase outcome as the response variable and the click-rank and product features as the independent variables. The logistic regression results are shown in Table 3. Except for the click-rank and price, the other product features are dummy indicator variables capturing the categorical information from the two available product attributes.
Logistic regression results for predicting the purchase outcome as a function of the click-rank and features of a product.
Logistic regression results for predicting the purchase outcome as a function of the click-rank and features of a product.
As can be seen from Table 3, the click-rank of a product is statistically significant in predicting the purchase outcome for that product. Moreover, its coefficient has a negative sign, indicating that a lower click-rank implies a higher purchase probability. These results further emphasize that our structural model should account for the click-rank of products during the search process—we discuss the role of click-rank on the customer click and purchase behavior in more detail at the end of Section 4.4 and in Proposition 1. The next section presents our customer click and purchase model.
In this section we present a structural model for customer click and purchase behavior which is informed by our observations from the data, as discussed in Section 3. Our model is a sequential discrete choice model where customers repeatedly decide between purchasing, clicking, or leaving the platform without a purchase. We first discuss the model preliminaries and basic notation in Section 4.1. We formally introduce the notion of observed and unobserved utilities in Section 4.2. We then introduce the customer choice model in Section 4.3, and discuss the choice probabilities in Section 4.4. We provide a discussion about some key aspects of the model in Section 4.5.
Model Preliminaries
We denote by
Suppose that customer
Customers do not purchase a product that they have not clicked on.
Assumption 1 implies that if after clicking on
The key idea of the article is to disentangle and separately estimate the attractiveness of a product to a customer before and after the click. Specifically, when customers search for a product, only a subset of product features (information) is observable on the search page. Such observable information drives the attractiveness (utility) of the product to the customer on the search page, before the click. We thus refer to the pre-click utility of the product as the observed utility. However, such observed information is usually not enough for customers to make their purchase decisions. Thus, customers incur a search cost and click on a product to investigate the product page of that item, which provides much more detailed information about the product. Such information can change the utility of the product to the customer. We refer to the post-click utility of a product as the total utility and call the change in product’s utility after the click the unobserved utility. In other words, the product page contains information that is not observable on the search page and thus, can change the utility of the product to the customer after the click.
To formalize the notions above, let 
If customer 
The customer’s final purchase decision will be based on all the information she has collected about a product. We call this the total utility of the product and define it as follows:

Our model is a sequential discrete choice model where customers repeatedly decide between purchasing, clicking, or leaving the platform without a purchase. We assume that customers are utility-maximizers and choose the option with the highest utility at any stage of the search. Specifically, the customer assigns a utility to each option and selects the one with the highest utility.
Let

Suppose that customer 

Customers are utility maximizers and choose the action that provides them with the highest utility. As a result, the optimal action of customer 
As discussed in Sections 3 and illustrated in Figure 2 and Table 3, the click-rank of products seems to provide insights about the order of attractiveness of products to customers. Thus, we propose a sequential search model in which the order of clicks matters in the customer search process. Specifically, the available information on the search page (i.e., the observed utilities) is the main driver of the customers’ click decisions. In other words, a product with a higher observed utility should have a higher probability of being clicked. This is formalized in the following Proposition.
The click probability of a product is strictly increasing in its observed utility. That is,
Proposition 1 shows that the click-rank of products for a customer should be, on average, in the order of the products’ attractiveness on the search page (i.e., the observed utilities
We assume that customers follow a one-step lookahead search policy to decide their click strategy. This policy is a simplification of a search policy where customers solve a discrete-time dynamic program to calculate their expected click utilities. In that dynamic program,
We also note that the inclusion of the term
Finally, we assume the customer’s pre- and post-click preference vectors
Estimation
In this section, we discuss our estimation strategy and results. Specifically, in Section 5.1 we discuss the details of our estimation procedure. We take a data-driven approach to select a representative (random) sample of the whole data to estimate our model. The summary of our sampling approach is discussed in Section 5.2. The estimation results are presented in Section 5.3.
Estimation Strategy
In this section we lay out a maximum likelihood procedure to estimate the parameters of the model. To account for customer heterogeneity, we assume that the preference vector of customers ( The vector of customer preference parameters before the click: The vector of customer preference parameters after the click: The vector of search cost parameters: The vector of unobserved product-specific utilities: The common belief 
Suppose that the sequence of actions of customer 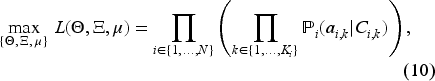
Let us discuss the impact of dimensionality on the estimation. Recall that
As discussed in the previous section, the number of parameters of the MLE problem and consequently the complexity of the estimation problem increases by the number of SKUs. Given that online retailers have thousands of products, scalability of the estimation problem could be of concern. However, when shopping online for a specific product (category), customers do not necessarily evaluate/search products from different categories in the same shopping visit. In other words, each customer searches within a specific product category (e.g., earbuds or laptops) comprised of substitutable products. As a result, customers’ click sequences as well as purchases will belong to a specific category of substitutable products. Hence, the retailer can estimate the parameters for each category of substitutable products in isolation. Moreover, customers might use different filtering tools on the website in order to narrow down the general assortment of products that they browse and click. The seller can leverage such information to further pinpoint the set of available products into a smaller subset of substitutable products which deem “most relevant” (e.g., products that have been clicked and/or purchased more often). Such insights on products can significantly reduce the number of products that should be considered for parameter estimation which, in turn, significantly reduces the computational burden of the MLE problem in (10).
One of the shortcomings of the provided data from JD.com is that even though all products belong to the same category, the name and details of that particular product category is not disclosed to us. Moreover, the attributes of the products in the provided data set are abstract numbers without definitions. As a result, identifying substitutable products is more cumbersome than in a setting where all products are identifiable. To address this issue, we take a data-driven approach to identify a subset of substitutable products. To do so, we first focus on products with average prices close to the median price. We then select a subset of SKUs that have frequently appeared together in customers’ click histories, which indicates that these products have a high degree of substitution. Finally, we take a random sample of customers who have exclusively clicked on these products. This results in a subset of the data with 30,000 customers and 126 SKUs. We note that in the selected sample of transactions, each customer purchases at most one product; thus, there are no multiple purchases in the selected data. Details of this data selection are discussed in Appendix EC.2. The goal here is to pick a subset of data that is representative of the entire data set to illustrate the value of our proposed framework and estimation strategy to obtain useful managerial insights.
Estimation Results
To estimate the parameters of the model, we solve the optimization problem in (10) using MATLAB optimization package. We solve the optimization for 20 random starting points. The optimization algorithm converges to the same solution for all starting points. To calculate the standard errors, we use the non-parametric bootstrap method (see Chapter 3 of Manski and McFadden 1981). The log-likelihood of the MLE in (10) is -167,829.35.
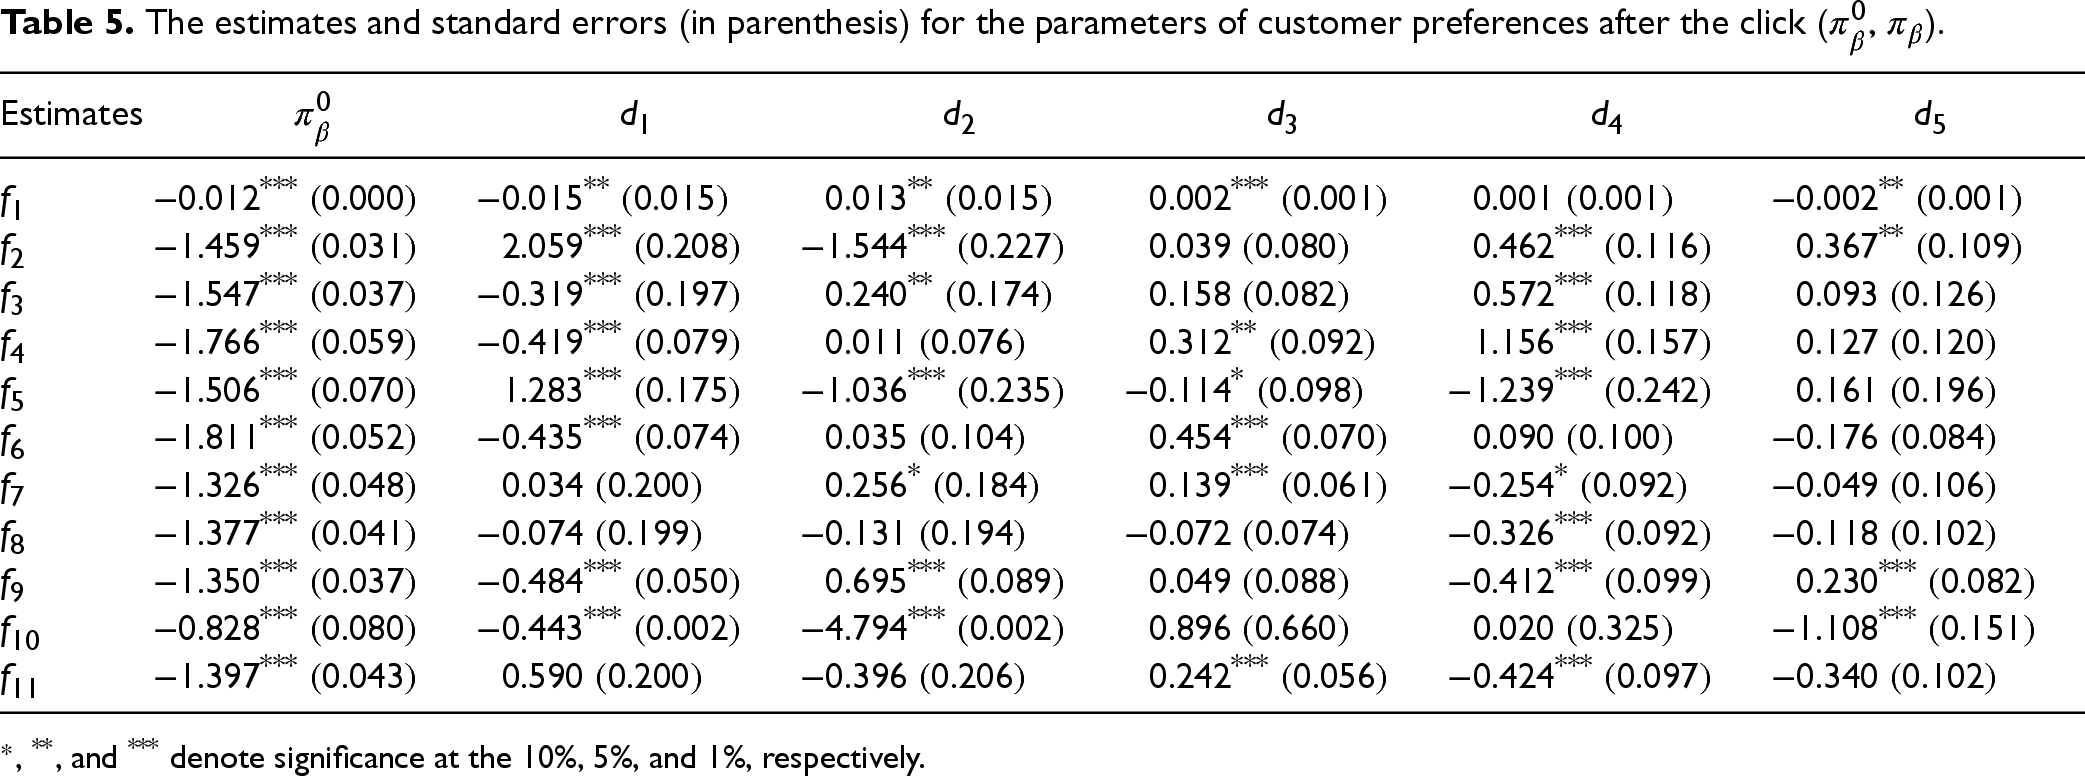
The estimates and standard errors of the customer preference parameters before and after the click are shown in Tables 4 and 5, respectively. In these tables, the indices
The estimates and standard errors (in parenthesis) for the parameters of customer preferences before the click (
,
).
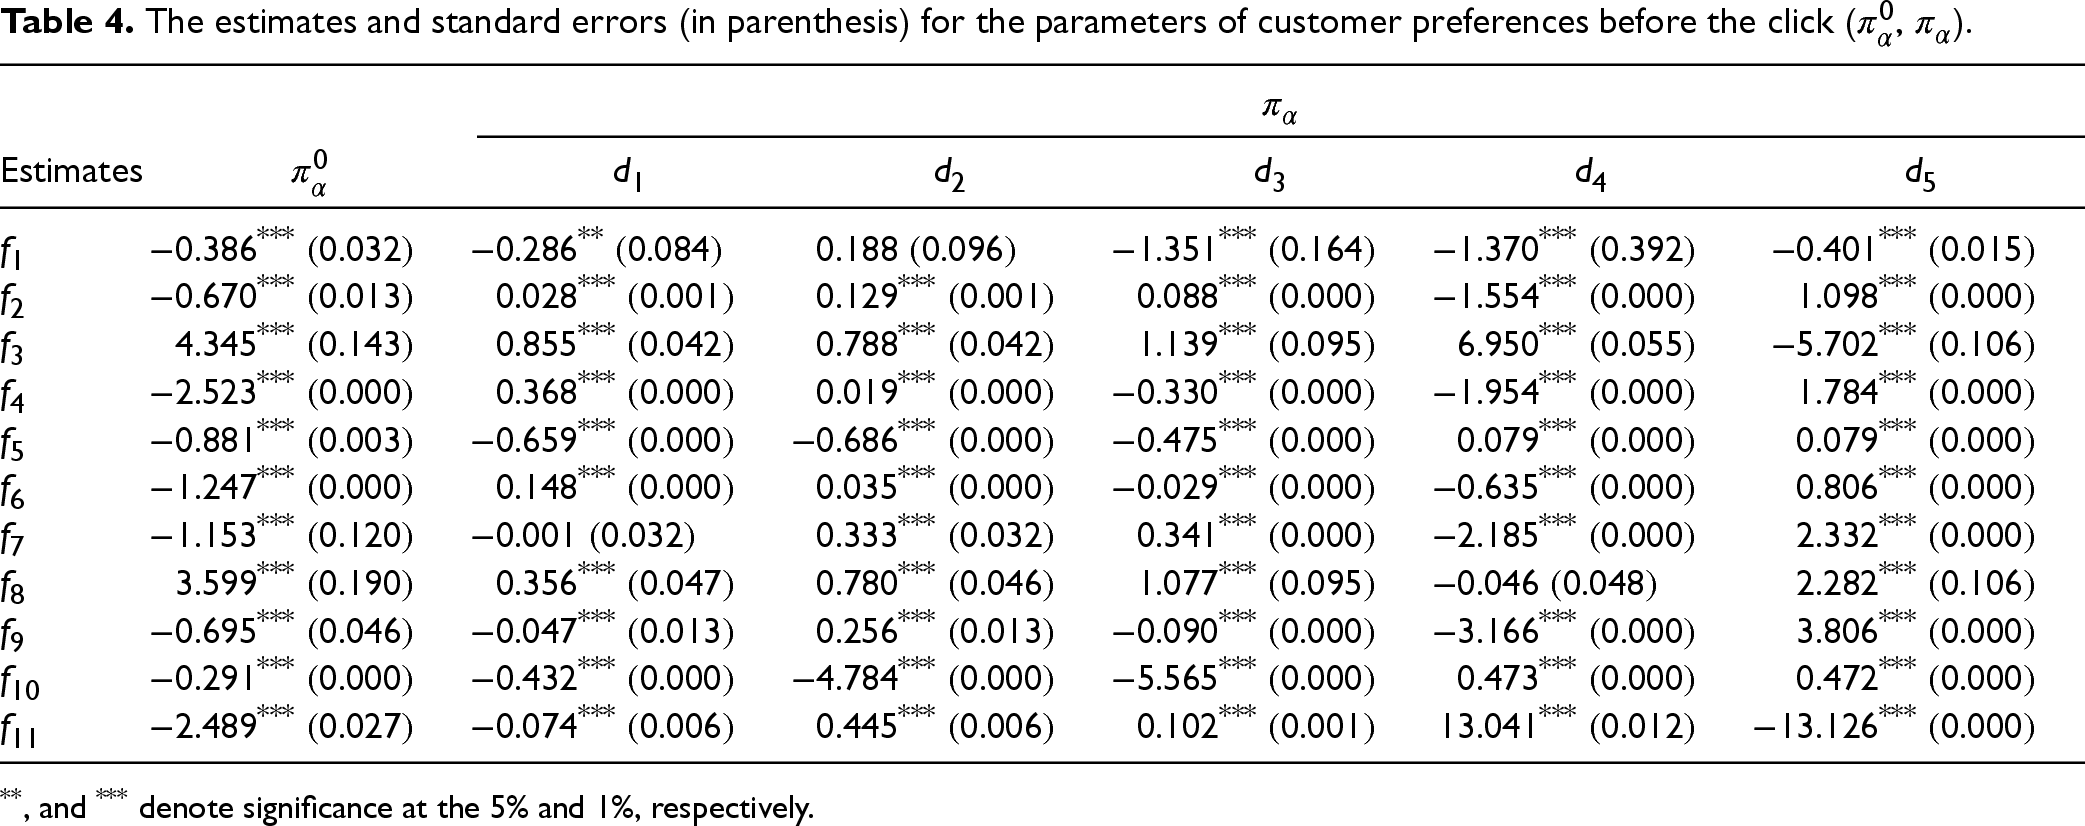
The estimates and standard errors (in parenthesis) for the parameters of customer preferences before the click (
**, and *** denote significance at the 5% and 1%, respectively.
The estimates and standard errors (in parenthesis) for the parameters of customer preferences after the click (
The estimates and standard errors for the parameters of customer search costs (
The estimates and standard errors for the parameters of customer search cost (
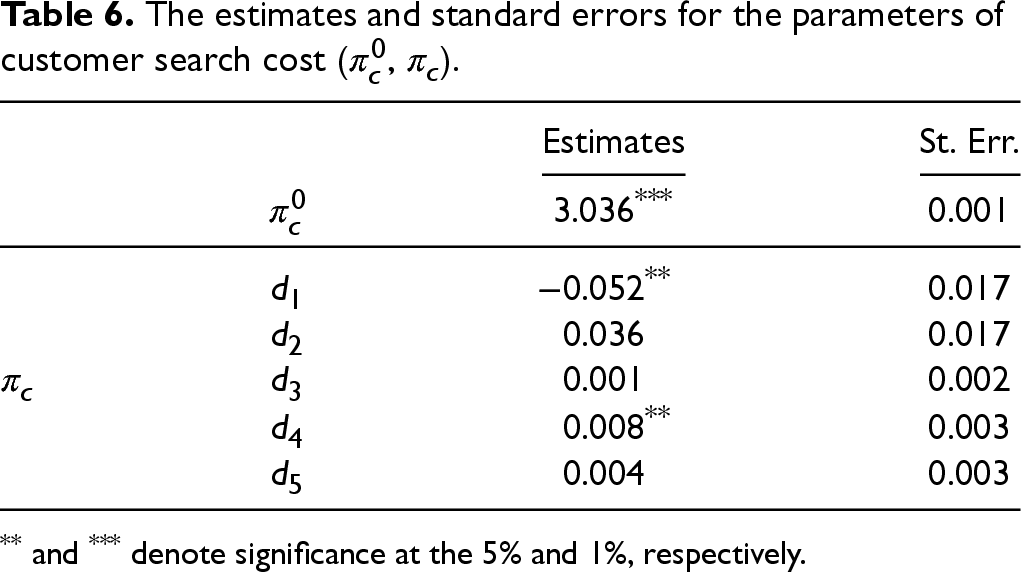
** and *** denote significance at the 5% and 1%, respectively.
The common belief parameter
Our estimation results reveal interesting insights about the customer click and purchase behavior. In this section we discuss such empirical insights and their managerial implications. In particular, in Section 6.1 we illustrate how clicks provide valuable information to customers. Section 6.2 discusses how our model can be used to identify different types of products based on their observed and unobserved utilities and in particular identify the underrated “diamond-in-the-rough” products. Finally, we illustrate in Section 6.3 how our model can be operationalized in practice and used for improving the assortment decisions. We have also performed several robustness checks, which are discussed in Appendix EC.4.
Value of Click
Our framework enables the retailer to not only measure the (pre-click) observed utilities of products for customers but also their unobserved utilities that will be revealed only after clicking on the product. As mentioned before, customers’ click behavior is not impacted by the unobserved utilities of products as they are not known to the customer prior to the click. Nevertheless, the unobserved utilities affect the total utility of the product for customer and, in turn, impact the purchase decision. Specifically, we find that the utility of observed product features to customers after the click (i.e.,
To shed further light on the value of click to customers, we also investigate whether there is any correlation between the (pre-click) observed utility of products (i.e., 
Our framework enables the retailer to identify two specific types of products which we call “diamonds in the rough” and “overrated.” In what follows, we discuss what we mean by diamond-in-the-rough (henceforth, DIR) and overrated products, and the implication of identifying such products for the retailer’s assortment decisions and revenue.
DIR products are generally underrated products that do not have a high observed utility (
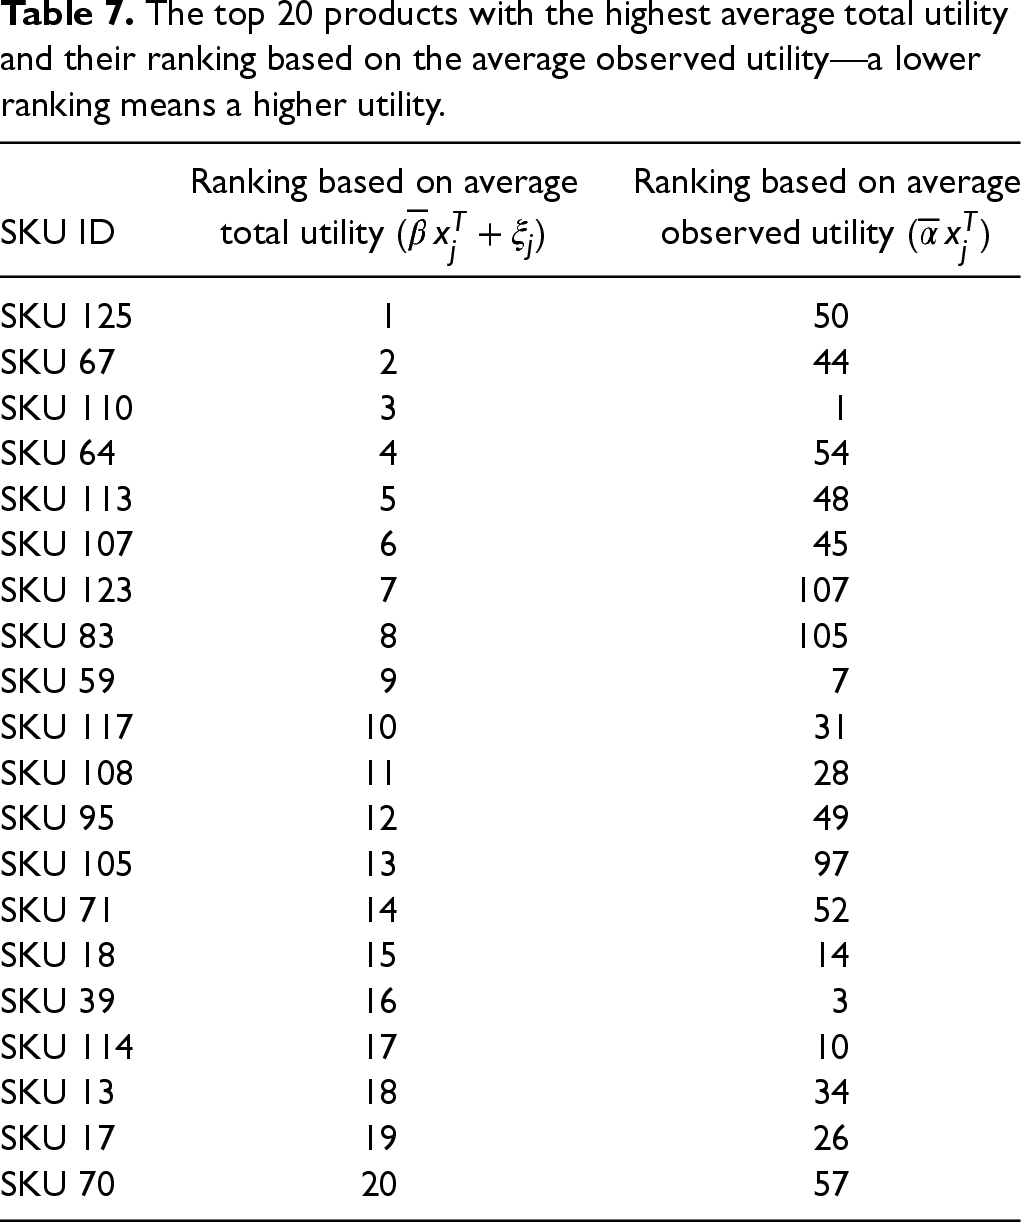
To illustrate the ideas better, we use our estimation results to rank the 126 SKUs based on the following values: (a) product’s average observed utility
The top 20 products with the highest average total utility and their ranking based on the average observed utility—a lower ranking means a higher utility.
The top 20 products with the highest average total utility and their ranking based on the average observed utility—a lower ranking means a higher utility.
The DIRs are products with a high ranking index based on the average observed utility but a low ranking index based on the average total utility. For example, SKU 125 and SKU 67 are two such products. They are ranked 1
If the retailer could bring the DIR products to customers’ attention, the chance of click and consequently purchase of these products could be increased. Thus, the retailer might benefit from experimenting with giving more visibility to DIR products on the search page. There are different mechanisms through which the retailer could shine the spotlight on such products. For example, the retailer can highlight these products on the search page or add tags such as “spotlight product” (similar to “Amazon’s Choice” tags on Amazon.com or “Our Experts Recommend” at Best Buy) to entice customers to click on them. Another option is to display such products in the top positions on the search page. On the contrary, the retailer potentially could demote the overrated products on the search page (or remove them from the assortment altogether) so that customers do not spend time browsing but not purchasing them. In Section 6.3, we illustrate how the assortment decisions can be improved using our model by accounting for the unobserved product utilities and differentiating the DIR from overrated products.
In this section we illustrate how our model can be operationalized in practice and used for improving assortment decisions—this can be achieved by personalizing the assortment offerings for each customer type (Bernstein et al. 2019, 2022), or highlighting (promoting) certain products from the assortment on the search page. We focus on our subset of 126 substitutable products as a representative sample of the data and run simulations to compare the expected revenue of the optimal assortment under our model and the following three benchmarks:
The comparison with the two MNL benchmarks illustrates the importance of accounting for the customer search behavior when making assortment decisions. Specifically, the first MNL benchmark assumes that the most attractive products on the search page have the highest chance of being purchased, ignoring the possibility that the information provided on the product pages (i.e., the unobserved utilities) might change the customers’ utilities for products. The second MNL benchmark adjusts the product utilities by accounting for the unobserved part, but still does not consider that customers engage in a costly search process by considering only a few products from the full assortment by clicking on them and exploring them in more detail—the first MNL benchmark has the same shortcoming as well. The comparison with the assortments displayed by JD.com illustrates the potential gain relative to the status quo.
We will discuss the details of the numerical experiments next, but in short, we find that the optimal assortments under our model can significantly improve the expected revenue and result on average in more than 35% improvement in revenue over the MNL optimal assortments, and more than 24% improvement over the actual assortments.
Comparison With MNL Optimal Assortments
We run simulation experiments where we assume that the ground truth is based on our model; that is, customers search for products according to our model. We then use Monte Carlo simulation to estimate the expected revenue generated from different assortments. We compare the expected revenue of the optimal assortment under our model, with that of the two MNL benchmarks discussed above. We note that when calculating the expected revenues under different assortments, we use the same model (i.e., the model described in Section 4) as the ground truth so that the comparison is fair. The difference in revenues comes from the fact that the displayed assortments are optimal under different models.
We first illustrate the idea through an example and then report the results across 1000 random instances. We use the rank-ratio metric to identify the DIR, overrated, and medium-ranked products, as discussed in Section 6.2. We then select the 5 DIR products with the lowest rank-ratio, the 5 overrated products with the highest rank-ratio, an 5 randomly selected medium-ranked products. Specifically, the full assortment is comprised of SKUs 64, 67, 83, 123, 125 as the DIRs, SKUs 46, 91, 92, 102, 119 as the overrated products, and SKUs 3, 4, 7, 8, 9 as the medium-ranked products. We compare the optimal assortments of size 10 suggested by different benchmarks for one customer profile as a representative example. We find that the optimal assortment under different benchmarks includes all products except the following SKUs:
To investigate a more comprehensive set of instances and reduce the chance of cherry-picking, we generate 1,000 random assortment instances of size
Comparison With Actual Assortments
We replicate the assortment experiments from the previous section but compare our optimal assortments with the actual assortments displayed by the platform (i.e., JD.com). There are 30,000 customers in the sampled data that we have used for estimation in Section 5.3. For each of these customers, we consider the first 15 products (based on the order of the customer click) that JD.com has displayed to that customer as the full assortment of products. We then consider the first 10 products as the “actual” (most relevant) assortment displayed to the customer by JD.com.
JD.com uses its own algorithm to decide what assortment to display to each customer and indeed does not assume that our model is the ground truth, thus the identified actual assortments represent the status quo. We then find the optimal assortment of size 10 (among the full assortment of 15 products) through enumeration and find the expected revenue gap between the actual and optimal assortments. We find that on average (across 30,000 customers), the optimal assortments suggested by our model improve the expected revenue by more than 24% (after discarding the outliers) over the actual assortments used by JD.com, based on our model as the ground truth.
Impact of Assortment Size on Revenue
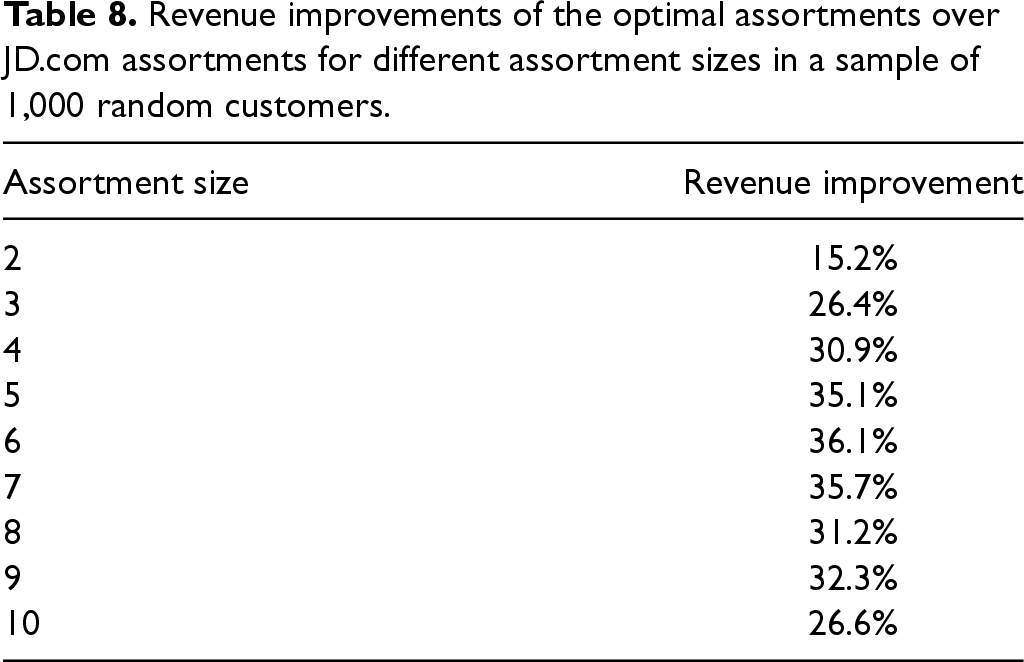
We also study how the revenue improvement changes with the assortment size. To do so, we repeat the exercise from Section 6.3.2 by taking a random sample of 1,000 customers and calculating the revenue improvement of the optimal assortment suggested by our model over the actual assortment used by JD.com. The main difference now is that we vary the assortment (capacity) size from 2 to 10 (while still using a full assortment of size 15, as in Section 6.3.2). The revenue improvements (in percentage) are reported in Table 8 for different assortment sizes. As can be noted from the table, the revenue improvement seems to have an inverted-U shape as a function of the assortment size. That is, as the assortment (capacity) size increases the revenue improvement generally increases up to a point and then starts decreasing. The intuition for this is that as the number of possible assortments that can be displayed to the customer increases, there is more potential for revenue gain by offering a different (optimal) assortment. There, the inverted-U shape is the result of increasing the assortment capacity size (i.e., choosing a larger subset of products), which first increases and then decreases the number of feasible assortments that can be offered. For example, for an assortment size of 2, there are 105 possible assortments that can be selected from the full set of 15 products, while for an assortment size of 7 or 8, there are 6,435 possible assortments that can be offered.
Revenue improvements of the optimal assortments over JD.com assortments for different assortment sizes in a sample of 1,000 random customers.
Revenue improvements of the optimal assortments over JD.com assortments for different assortment sizes in a sample of 1,000 random customers.
To sum up, the results in Section 6.3 show the potential of using our model for improving the assortment decisions. This, however, is with the caveat that our results are likely an overestimation of what might happen in practice because they are obtained under the assumption that the ground truth is based on our model. Thus, we cannot necessarily claim that these exact revenue improvements are generalizable to other e-commerce settings; however, our developed methodology can be applied to and leveraged in other product search (e-commerce) settings to identify underrated/overrated products, and our results showcase the value of operationalizing this model in improving the assortment decisions. In most practical settings, customers indeed engage in a costly search process by clicking on different products to collect more information. Our results show that in such settings accounting for the customer search behavior as well as the unobserved product utilities (which will be revealed after the click) can change the composition of the optimal assortment and significantly increase the revenue.
In this article, we propose a structural model to study the customer click and purchase behavior in an online retail setting. Our work is motivated by the data sets from JD.com which were shared by the MSOM society. These data sets provide information on close to 400,000 customers and 30,000 SKUs in one specific (unnamed) product category during the month of March in 2018. We combine customers’ click and order data to study their search behavior. In particular, we construct the click sequence of customers in order to disentangle the drivers of customer click versus purchase decisions.
We propose a structural framework to model the customer click and purchase behavior using a sequential discrete choice model. In particular, we assume that the customer’s utility from each product has an observed and unobserved part (in addition to a random shock). The observed part of the utility is known to the customer prior to the click based on the product characteristics displayed on the search page—such observed characteristics might include general product information such as price and brand. However, the unobserved characteristics (utility) of the product can only be learned by the customer if she clicks on the product and explores the product page. Such unobserved characteristics might include detailed customer reviews, product specifications, etc., which are only displayed on the product page after the click. Given that the search is costly for the customer, she must decide whether to continue the search by clicking on an unexplored product, or stop the search and make a purchase/no-purchase decision. The customer assigns a utility to each option and chooses the one with the highest utility at any stage of the search. We assume that customers follow a one-step lookahead policy to decide their search strategy. Specifically, we assume that customers anticipate their expected maximum utility from a subsequent purchase/no-purchase decision, if they were to make one additional click.
We take a representative sample of the data and estimate the model parameters on that set. Our estimation results show that the value of click for customers can be quite significant. This is evidenced by the fact that the estimates of the product-specific unobserved utilities vary significantly across products and can significantly change the product utility after the click; moreover, the product-specific unobserved utilities have almost no correlation with the observed utilities. Most importantly, our structural framework allows us to disentangle the observed and unobserved parts of product utilities and identify the diamonds in the rough: these are underrated products with low observed utilities but high total utilities (i.e., sum of observed and unobserved utilities) due to their high unobserved utilities. Given that the click decisions are only impacted by observed utilities but purchase decisions are driven by total utilities, such diamond-in-the-rough products have a low chance of being clicked, but a high chance of being purchased, if clicked. Consequently, the retailer might benefit from bringing such products into the spotlight and promoting them to customers on the search page. Through simulation studies we illustrate how our model can be operationalized and used in practice for improving assortment decisions. In particular, we find that by accounting for the unobserved product utilities and customer search cost, our model can change the composition of the optimal assortment and significantly increase the revenue. Specifically, we focus on a subset of 126 substitutable products as a representative sample of the data and find that based on our model, the optimal assortments (suggested by our model) improve the expected revenue by more than 24% over the actual assortments displayed by JD.com, and by more than 35% on average over two MNL benchmarks that use either the product observed or total utilities to find the optimal assortments.
Future research can study and quantify the impact on sales of spotlighting the diamond-in-the-rough products in a randomized experiment. To this end, one of the shortcomings of the JD.com data set is that the product location information on the search page is not available—in the online appendix, we perform a robustness check using a proxy for product location. Thus, although our proposed framework allows us to identify the underrated diamond-in-the-rough products and use the insights for improving the assortment decisions, it is not possible for us to directly measure the sales impact of promoting such products on the search page. This can be investigated in future research where the retailer experiments with spotlighting the diamond-in-the-rough products by giving them more visibility on the search page. Moreover, if a more detailed set of product and customer features is available in the data, one can incorporate non-linear terms in the utility function to further improve the model flexibility. In addition, the dataset captures only one visit (purchase) from each customer, and provides limited information as to how customers evaluate products during their search process. Thus, having access to a much richer data set could help make the obtained results and insights even more robust. Finally, because the data is from March 2018, which coincides with the Chinese New Year, the data period may not reflect typical consumer purchasing processes.
Supplemental Material
sj-pdf-1-pao-10.1177_10591478251350097 - Supplemental material for Diamonds in the Rough: Leveraging Click Data to Spotlight Underrated Products
Supplemental material, sj-pdf-1-pao-10.1177_10591478251350097 for Diamonds in the Rough: Leveraging Click Data to Spotlight Underrated Products by Sajad Modaresi, Seyed Morteza Emadi and Vinayak Deshpande in Production and Operations Management
Footnotes
Declaration of Conflicting Interests
The authors declared no potential conflicts of interest with respect to the research, authorship, and/or publication of this article.
Funding
The authors received no financial support for the research, authorship, and/or publication of this article.
Notes
How to cite this article
Modaresi S, Emadi SM and Deshpande V (2026) Diamonds in the Rough: Leveraging Click Data to Spotlight Underrated Products. Production and Operations Management 35(2) 606–624.
References
Supplementary Material
Please find the following supplemental material available below.
For Open Access articles published under a Creative Commons License, all supplemental material carries the same license as the article it is associated with.
For non-Open Access articles published, all supplemental material carries a non-exclusive license, and permission requests for re-use of supplemental material or any part of supplemental material shall be sent directly to the copyright owner as specified in the copyright notice associated with the article.