
Abstract
E-waste take-back regulation in the United States requires producers to manage their products at the end of life. This legislation aims to stimulate product and process innovations that reduce the environmental impact of E-waste. In this study, we employ a staggered difference-in-differences approach to explore the causal relationship between state E-waste regulations and eco-innovation among producers. Our results indicate that E-waste regulations significantly boost the number of eco-patents filed by producers, with the effect intensifying as regulatory pressure increases. Additionally, our findings show that regulated producers tend to focus more on upstream resource efficiency innovations than on downstream waste management. This research offers valuable insights for policymakers and industry practitioners aiming to enhance practices for E-waste management.
Introduction
Electronic wastes (E-waste) have been rapidly growing and contributing to major environmental risks (World Economic Forum, 2019). More importantly, conventional treatments for E-waste have reached a breaking point. For example, landfills and incineration facilities are close to hitting the emission limits (Deer, 2021), and shipping E-waste to developing countries is increasingly met with resistance and is no longer a viable solution (Kottasová, 2018). Ultimately, long-term solutions require an innovative transformation of E-waste management. E-waste take-back regulation, based on the extended producer responsibility (EPR) principle, has been adopted as a major policy instrument to engage producers in a physically and/or financially responsible manner for electronic product end-of-life (EoL) treatment (Atasu et al., 2009; OECD, 2016). In the United States (US) since 2003, 25 states (plus the District of Columbia) have passed take-back regulations to address the concerns surrounding E-waste (Atasu et al., 2013). Compared with state EPR regulations that apply to non-E-waste, such as paint, furniture, pharmaceuticals, and mercury-containing items, E-waste regulations encompass the most subcategories of products and cover the broadest geographical regions (see Electronic Companion EC.1 Table A1 for more details).
E-waste regulations are intended not only to reduce environmental risks in products’ EoL stage but also to reclaim the resources in E-waste (Petru, 2015). For example, recycling 1 million cell phones can recover
The extent to which E-waste regulations can drive innovation in the US remains uncertain, primarily due to the lack of empirical evidence supporting the effectiveness of state-level regulations (Wharton, 2016). Countries such as Canada, Japan, and China, along with the European Union, have created nationwide policies for E-waste recycling and reuse. These policies generally impose consistent requirements on producers. By contrast, in the US, there is no agreement on federal legislation, and states need to develop their solutions (Zhao et al., 2021). According to Scott Cassel, the founder of the Product Stewardship Institute: “By the end of that [legislative] process, there were a number of policy options on the table. However, the electronics industry could not come to an internal agreement on what it wanted. That resulted in no national agreement, and the issue was thrown back to the states to develop their own solutions. But no one-state model emerged. And manufacturers are still not united as a single industry because of competing interests” (Wharton, 2016). Thus, practitioners continue to debate the efficacy of state-level legislation, since individual states may have limited market influence to significantly affect global companies. Furthermore, state take-back regulations may impose various compliance standards on producers. For example, states such as Illinois, Indiana, Minnesota, New York, Vermont, and Wisconsin mandate specific levels of take-back amounts but enable producers to buy credits or pay a surcharge if they fail to meet the requirements. Others, such as Missouri, Oklahoma, Texas, and Virginia, only require payments for registration and encourage take-back program adoption without specifying levels of take-back performance. According to the 2011 Texas report, of the 24 million pounds of E-waste in 2010, 92% was collected by only four producers—Dell, Samsung, Sony, and Altex Electronics (a small private company). The remaining 8% was gathered by 38 producers, with 36 producers not collecting any E-waste (Texas, 2011). The various compliance schemes in state regulations may enable producers to fulfill regulatory obligations without innovating, complicating the incentive of eco-innovation.
To fill this important gap, in this research, we ask: Does state E-waste take-back regulations motivate a producer to eco-innovate? To examine our research question, we collect and combine unique data from three sources: the United States Patent and Trademark Office Patent Database (USPTO), state government reports of E-waste regulations, and Compustat. In particular, we identify a list of the regulated producers from the state reports. We consider the introduction of the E-waste regulations as an exogenous shock to the producers and employ staggered difference-in-differences (ST-DID) estimation with propensity score matching (PSM) to study the regulation and eco-innovation relationship.
Our main results suggest a substantial increase in eco-patent filings by producers under E-waste regulation. This main finding indicates that regulating product responsibility in the EoL phase significantly motivates producers to develop innovative solutions. Second, we find that the positive regulation effect exists across state regulations with different schemes (e.g., fee-upon-sales and fee-upon-disposal and with or without specified take-back performance levels). The effect is more pronounced among producers under regulations with more stringent take-back requirements, such as regulations with mandatory take-back performance levels. Finally, we find that the regulation impact varies across different innovation categories: E-waste regulation primarily encourages innovations focused on upstream resource efficiency, while it is less likely to promote the development of downstream waste management innovations. Additionally, it does not significantly affect innovation aimed at reducing pollution. These findings suggest that the positive effect of regulation on general eco-innovation is largely driven by producers’ focus on upstream resource efficiency, where they are incentivized to reclaim resources during the EoL stage.
This study makes several contributions. First, analytical research in sustainable operations management (OM) generally supports the idea that take-back regulations should motivate producers to innovate (Atasu and Van Wassenhove, 2012). However, the environmental economics literature provides mixed perspectives. E-waste regulations introduce new operational processes for EoL product management, which should encourage innovation. However, the significant resource commitments required to meet take-back obligations, combined with the inherent risks of R&D, might reduce a producer’s incentive for eco-innovation (De Jesus and Mendonça, 2018; Huang et al., 2019). Our study provides some of the first empirical evidence demonstrating the effectiveness of state E-waste regulations in the US in promoting eco-innovation. Second, prior analytical research explores the optimal design of compliance schemes (Atasu, 2019; Atasu et al., 2009; Gui et al., 2015), with limited empirical evidence. Our study demonstrates that the effectiveness of state regulations exists across different regulatory schemes and further highlights the importance of regulatory compliance schemes in shaping innovation outcomes: more stringent take-back obligations increase producers’ commitment to eco-innovation. Third, our study contributes to the sustainable OM and environmental economics literature by suggesting that E-waste regulations positively influence innovation in upstream resource efficiency while negatively impacting innovation in downstream waste management. This difference, together with the insignificant impact on innovation for pollution reduction, highlights a targeted focus on eco-innovation by producers post-regulation. This finding suggests that the motivation to reclaim resources during the EoL stage may be a key driver for producers to innovate under E-waste regulations.
Our research provides implications for both policymakers and practitioners. A long-term goal of E-waste take-back legislation is to encourage eco-innovation in product design, production processes, and solid waste management. Our findings suggest that policymakers should promote state-level legislation, given its effectiveness in motivating eco-innovation. Furthermore, for future state legislation or regulation amendments, policymakers should consider emphasizing mandatory take-back activities with specified performance levels to encourage greater eco-innovation. Policymakers should also realize the heterogeneous impact of regulation on different innovation categories. Given that regulated producers may concentrate their innovation efforts on upstream resource efficiency instead of downstream waste management, policymakers can support this trend by promoting collaboration between producers and recyclers. This partnership may further foster innovation for recyclers in waste management, complementing the producers’ efforts. Additionally, managers should view compliance with E-waste regulations not just as a legal requirement but as an opportunity to drive innovation within their organizations. As the trend in state take-back legislation in the US moves toward potentially more stringent standards, committing to eco-innovation allows managers to navigate the varying regulatory environments in multi-state operations effectively.
The rest of this article is organized as follows. We describe our quasi-experiment setting and review the literature related to EPR, focusing specifically on E-waste regulation and eco-innovation, in Section 2. We discuss our data and variables in Section 3. We present our empirical strategies in Section 4, followed by a discussion of the main results, extended analyses, and robustness tests in Sections 5 and 6. Finally, we conclude with academic and managerial implications in Section 7.
Empirical Setting and Literature
E-waste Regulation and Empirical Setting
Regulations based on the EPR aim to transfer the environmental responsibility and associated financial burdens of a product’s EoL from consumers or governments back to the producer (Alev et al., 2020). In comparison, other regulations (e.g., emission regulations) concentrate mostly on reducing pollution before the EoL stage and do not assign product-specific responsibilities to producers. 1 The OECD also highlights the uniqueness of EPR: “While other policy instruments tend to target a single point in the chain, EPR seeks to integrate signals related to the environmental characteristics of products and production processes throughout the product chain” (OECD, 2001).
Since the early 1990s, the US has progressively implemented EPR regulations, which encompass multiple product categories (Jacobs and Subramanian, 2012; Nash and Bosso, 2013). From the National Conference of State Legislatures (NCSL), we collect information on all state EPR regulations in the US, covering batteries, electronics, furniture, mercury-containing items, and more, along with their enactment year information (see Electronic Companion EC.1 Table A1). The regulations specific to E-waste affect the greatest number of states and include the broadest product scopes, such as smartphones, TVs, tablets, and printers. Considering the geographic and product scopes, our research specifically focuses on the impact of E-waste regulations.
According to state E-waste regulations, firms that produce (or import) and sell regulated products exceeding certain sale thresholds in the state are subject to the regulations (Alev et al., 2020). In compliance with the regulations, these producers must register with the State Department of Environment (DoE) to sell their products. The DoE compiles and publishes reports summarizing recycling outcomes in response to the regulations, and these reports list all registered producers each year. In Electronic Companion EC.1 Figure A.1, we provide the snapshots of the state reports from Maine and Maryland as examples, highlighting the registered producers.
Unlike other countries with national regulations, the US relies on state regulations to manage E-waste (Zhao et al., 2021), which became effective at different times and adopted various compliance schemes. For example, California enacted the earliest state regulation in 2003 and adopted a fee-upon-sales scheme, which requires a fee for EoL treatment to be charged while purchasing covered devices. Other states adopted a fee-upon-disposal scheme, in which the recycling fee is paid when the product is actually returned for recycling (Nash and Bosso, 2013; Plambeck and Wang, 2009). Among the states other than California, eleven states passed regulations with specified recycling performance levels. This means that registered producers in these states are required to take back their E-waste according to the amounts specified by the state DoEs. Other states only require the payment of a registration fee or the adoption of a take-back program without specifying recycling performance levels. Electronic Companion EC.1 Table A2 shows the variations of state E-waste regulations in regard to the effective year and product coverage, and it differentiates the states with or without specified recycling levels.
The state E-waste regulation mandates the offering of take-back and recycling programs for the producers’ products, allowing for properly examining the effectiveness of the regulations’ general shocks. In particular, E-waste regulations are established by state legislatures and are focused on specific product categories, making them unlikely to be influenced by the operations of individual producers.
Under E-waste regulations, eco-innovation becomes crucial. 2 E-waste regulations can promote eco-innovation in the following ways. First, take-back and EoL treatment processes are often new to producers (e.g., disassembling complex printed circuit boards (PCBs) or removing lead from CRT TVs), who need to make serious investments in novel eco-innovations (LetsRecycle, 2007). The investments may lead to filing new patents related to advanced disassembly and recycling technologies (e.g., Apple’s Daisy Robot) or product eco-design (e.g., HP Elite Dragonfly made of recycled plastics) (Bacchus, 2020; Purdy, 2019). Second, states implement E-waste regulations and often follow these with stricter rules, which motivates firms to seek long-term and sustainable solutions. For example, Minnesota’s E-waste regulation in 2007 required producers to collect 60% of the weight of their sales during the first year of the program, increasing to 80% in subsequent years (GreenBiz, 2007). South Carolina enacted E-waste regulation in 2010 and made amendments in 2021. The amendment specifies an expanded list of covered devices and enforces increased producer responsibility (e.g., offering more collection sites and reporting specific evidence of their take-back initiatives) (Heffernan, 2022). The possibility of stricter obligations following early regulations suggests that short-term solutions, such as sourcing take-back to recyclers, will likely incur substantial recurring compliance costs that will only increase in the future (Barrieu and Fehr, 2014; Sparta, 2024). Additionally, under regulatory pressure, producers may pursue eco-innovation to effectively reclaim resources from E-waste, which can help offset the costs associated with meeting these obligations in the long run. For example, Dell has implemented eco-innovation strategies to reclaim resources from E-waste. Through its Asset Recovery Services, Dell has developed advanced recycling programs that efficiently recover valuable materials, such as copper and aluminum, from old electronics (Abbatiello, 2023). This helps the company meet regulatory obligations and reduces future costs associated with raw material sourcing, making the recycling process potentially economically viable.
Related Literature
In this section, we provide a brief overview of other related literature. Our research intersects with and contributes to the fields of EPR in sustainable operations management and environmental economics.
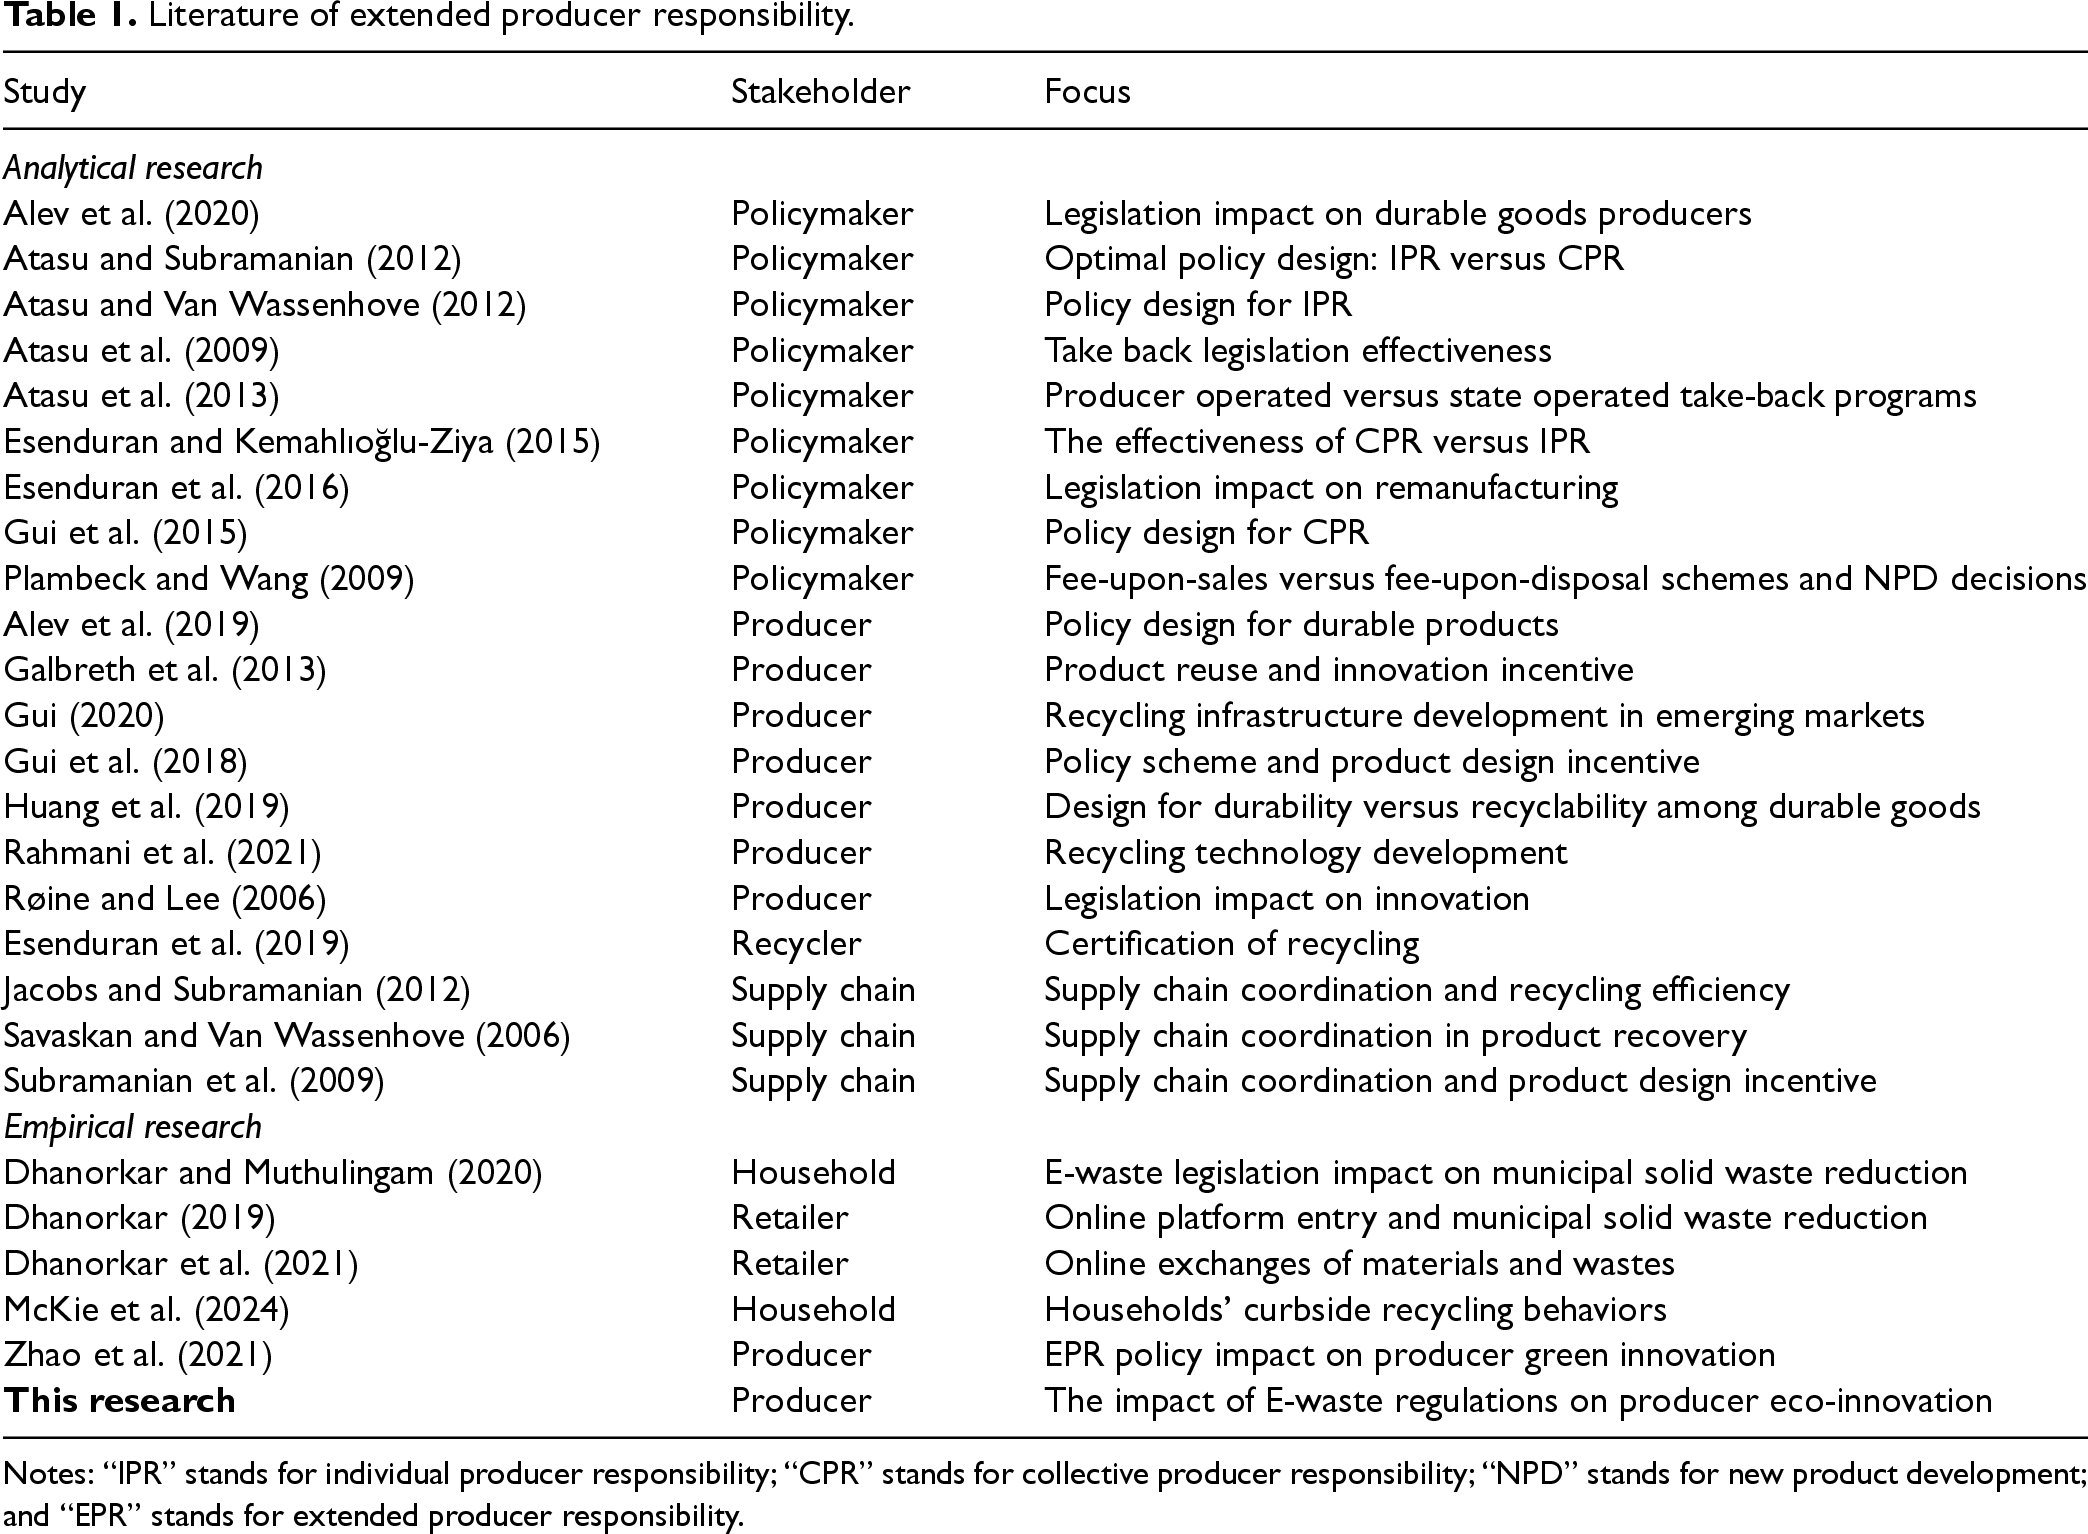
EPR has been viewed as an important policy instrument in the sustainable OM literature. The literature investigates the implications of EPR on key stakeholders, addressing aspects such as optimal EPR policy design (Atasu et al., 2009; Gui et al., 2015), EPR regulation effectiveness (Atasu et al., 2013; Plambeck and Wang, 2009; Zhao et al., 2021), waste recovery management (Esenduran et al., 2020), supply chain collaboration (Jacobs and Subramanian, 2012; Savaskan and Van Wassenhove, 2006; Subramanian et al., 2009), and individual behaviors (Dhanorkar, 2019; Dhanorkar and Muthulingam, 2020; McKie et al., 2024). Despite the theoretical depth of these discussions, empirical research on the effectiveness of E-waste regulations remains limited, primarily due to challenges in data availability. In Table 1, we summarize the major analytical and empirical studies on EPR in OM.
Literature of extended producer responsibility.
Literature of extended producer responsibility.
Notes: “IPR” stands for individual producer responsibility; “CPR” stands for collective producer responsibility; “NPD” stands for new product development; and “EPR” stands for extended producer responsibility.
Analytical studies have explored the optimal design of take-back policies, such as the efficiency of individual and collective take-back (Atasu et al., 2013; Esenduran and Kemahlıoğlu-Ziya, 2015) and the competition between original equipment manufacturers and independent remanufacturers (Esenduran et al., 2017). Our work contributes to the analytical literature investigating the product design implications of EPR as a form of eco-innovation (e.g., Atasu and Van Wassenhove, 2012; Galbreth et al., 2013; Gui et al., 2018; Huang et al., 2019; Røine and Lee, 2006). Specifically, E-waste take-back legislation aims to reduce the negative environmental impact of E-waste by minimizing waste sent to landfills and incentivizing producers to design eco-friendly products (Atasu and Van Wassenhove, 2012; Huang et al., 2019). Recent research emphasizes that designing products for recyclability and integrating with recycling technologies can enhance recycling and reuse efficiency (Esenduran et al., 2019; Esenduran and Kemahlıoğlu-Ziya, 2015; Rahmani et al., 2021). Our focus on eco-innovation includes both upstream eco-design and downstream waste management technologies, providing a comprehensive measure to evaluate the effectiveness of E-waste regulations.
Additionally, the analytical literature has discussed how fee-upon-sales versus fee-upon-disposal schemes influence new product development and overall recycling efficiency in different ways (Plambeck and Wang, 2009). In the US, besides schemes, state regulations also vary in their performance goals, with some specifying recycling performance levels while others do not (Jacobs and Subramanian, 2012; Nash and Bosso, 2013). Motivated by these studies, our study also explores the heterogeneity of state regulatory schemes, including fee-upon-sales and fee-upon-disposal, coupled with specified and non-specified recycling performance levels. By doing so, our research provides a deeper understanding of the varied landscape of E-waste regulations and their implications for eco-innovation.
Furthermore, existing empirical research about product take-back commonly focuses on the role of retail platforms (Dhanorkar, 2019) or household behaviors (McKie et al., 2024) in waste reduction. Our research contributes to this field by providing one of the first empirical studies to examine the effectiveness of E-waste regulations at the producer level. A recent study by Zhao et al. (2021) finds that the nationwide Implementation Plan of the EPR System in China positively affects firm-level green innovation, highlighting government subsidies as the key mechanism. However, according to the Atasu et al. (2009: 252) interview with the European Waste Electrical and Electronic Equipment (WEEE) Directive, most manufacturers have concerns about subsidizing take-back—larger or more established producers may gain more benefits than smaller producers, potentially leading to competitive imbalances. Consequently, legislators do not view subsidies as a viable way to facilitate take-back (Atasu et al., 2009). Our research extends the literature by examining the effectiveness of E-waste regulations in the US at the state level, considering the complexity introduced by variability in both the timing of legislation and compliance schemes. We further contribute to the literature by exploring the heterogeneous impacts of these regulations on different categories of eco-innovation, offering insight into how producers allocate resources to innovations targeting upstream and downstream processes in response to regulatory pressures.
Our research also contributes to the environmental economics literature by exploring the relationship between E-waste regulations and producer eco-innovation. The literature has extensively discussed how regulations affect innovation, offering insight that may be relevant to our study on E-waste regulations (Aghion et al., 2023; Porter and Linde, 1995). For example, Aghion et al. (2023) concluded a significant negative impact of labor regulations on firm innovation, primarily due to changes in firm size. The roles of environmental regulations can be complex due to the burden of compliance costs as well as the incentive of new process transformations (Demirel and Kesidou, 2011; Maxwell and Decker, 2006). In particular, while environmental regulations often result in high compliance costs, firms’ innovation efforts may offset these costs and enhance resource productivity in the long run (Porter and Linde, 1995). For example, emission regulations mandate firms to reduce greenhouse gas (GHG) emissions, which can lead to substantial operational costs (Demirel and Kesidou, 2011; Maxwell and Decker, 2006). To comply, firms may invest in new technologies capable of reducing emissions, thereby potentially improving production efficiency through waste reduction and energy savings (Porter and Linde, 1995). Additionally, eco-innovation can signal to policymakers that producers are proactively managing environmental risks, potentially resulting in more lenient regulatory oversight (Maxwell and Decker, 2006). However, regulations may also fail to incentivize eco-innovation due to resource constraints (De Jesus and Mendonça, 2018). Meeting environmental obligations requires significant resource commitments, and the costs associated with redesigning processes, customer education, advertising, and monitoring can limit internal environmental R&D investments (Carrión-Flores et al., 2013). The existing literature often focuses on eco-innovation in general terms or focuses specifically on aspects like energy savings or emission reductions, often neglecting innovations aimed at EoL treatments. The specificity of E-waste regulations has also been previously under-studied potentially due to data constraints. By examining how producers allocate resources to innovation under E-waste regulatory pressures, our research offers valuable insight into the environmental economics literature.
Finally, our research contributes to a growing body of OM literature that utilizes quasi-experimental methods to examine the effects of regulations. Recent studies have explored topics such as the impact of marijuana legislation (MML) on toxic releases from state facilities (Dhanorkar et al., 2023), the influence of constituency statutes on managerial short-termism (Aral et al., 2023), and the effects of E-waste regulations on waste reduction (Dhanorkar and Muthulingam, 2020). We build on this literature by leveraging a unique quasi-experimental setting created by regulatory shocks from state E-waste regulations, with a specific focus on producer-level eco-innovation. We believe our unique dataset and this novel context provide a valuable foundation for future research on other aspects of state E-waste regulations.
To address our main research question, we construct detailed firm-level panel data from multiple data sources. We explain our data collection and variable construction steps in the following subsections.
Data Sources
We first introduce two secondary data sources: the United States Patent and Trademark Office Patent Examination Data System (USPTO) and Compustat North America (Compustat). We collect patent data from USPTO, including filed/granted date, assignee, and cooperative patent classification (CPC) code. Using assignee and date information, we identify if a firm listed in Compustat has filed or been granted a patent at a given time. The CPC data include around
More importantly, we identify firms that have come under E-waste regulations. State governments require producers to submit a registration to the DoE before they can sell or offer regulated products within the state. The state DoEs compile comprehensive lists of all registered firms, including firm names and associated regulated product information, and disclose these in state reports to outline specific obligations. In Electronic Companion EC.1 Figure A.1, we provide examples of these registered producer lists, which are released by state DoEs. Following these lists, DoEs may issue notice letters to each producer detailing the required scales of take-back. We categorize these registered firms as regulated producers and include them in the treatment group of our quasi-experiment design (discussed in Section 4). By collecting the producer lists from annual state reports, we can track a firm’s regulation history, including the state(s) where a firm was initially regulated and the year the regulation began. We then manually match this information with Compustat data, using firm names to identify the regulated firms within our sample. Any Compustat firms not listed as registered producers throughout our observation period, excluding those in the finance sector, are considered as not subject to state E-waste regulations and are included in the initial control pool.
In total, we collected data on
Variable Descriptions
Our dependent variable measures a firm’s eco-innovation. Control variables measure other firm-level financial and operational characteristics that may affect eco-innovation. We also define variables as matching covariates if the variables may affect a firm’s likelihood of being a regulated firm. The details of propensity score matching are introduced in Section 4.2.
Dependent Variables
We use filed eco-patent counts as the dependent variable (Kemp and Pearson, 2007; Marin and Lotti, 2017):
Filed Eco-Patent (Eco-Patent). For each firm-year, we count the total number of eco-patents filed and code the variable as 0 if the firm has not filed any eco-patent in a given year.
While the previous literature also uses granted patents to measure a firm’s innovation outcomes, filed eco-patents are more appropriate for our research as they provide a clearer indication of a firm’s commitment to eco-innovation (Flammer and Kacperczyk, 2016). 4 Using the USPTO dataset, we can determine the exact timing of patent filings, allowing us to distinguish between eco-patent filing behaviors before and after regulatory enforcement.
To enhance the robustness of our findings, we also analyze granted eco-patents as an alternative dependent variable. Furthermore, we address potential issues of zero-inflation in our dependent variable, where firms’ filed but ungranted eco-patents are coded as 0, by employing zero-inflated negative binomial models. More details on these methods can be found in Section 5.4.
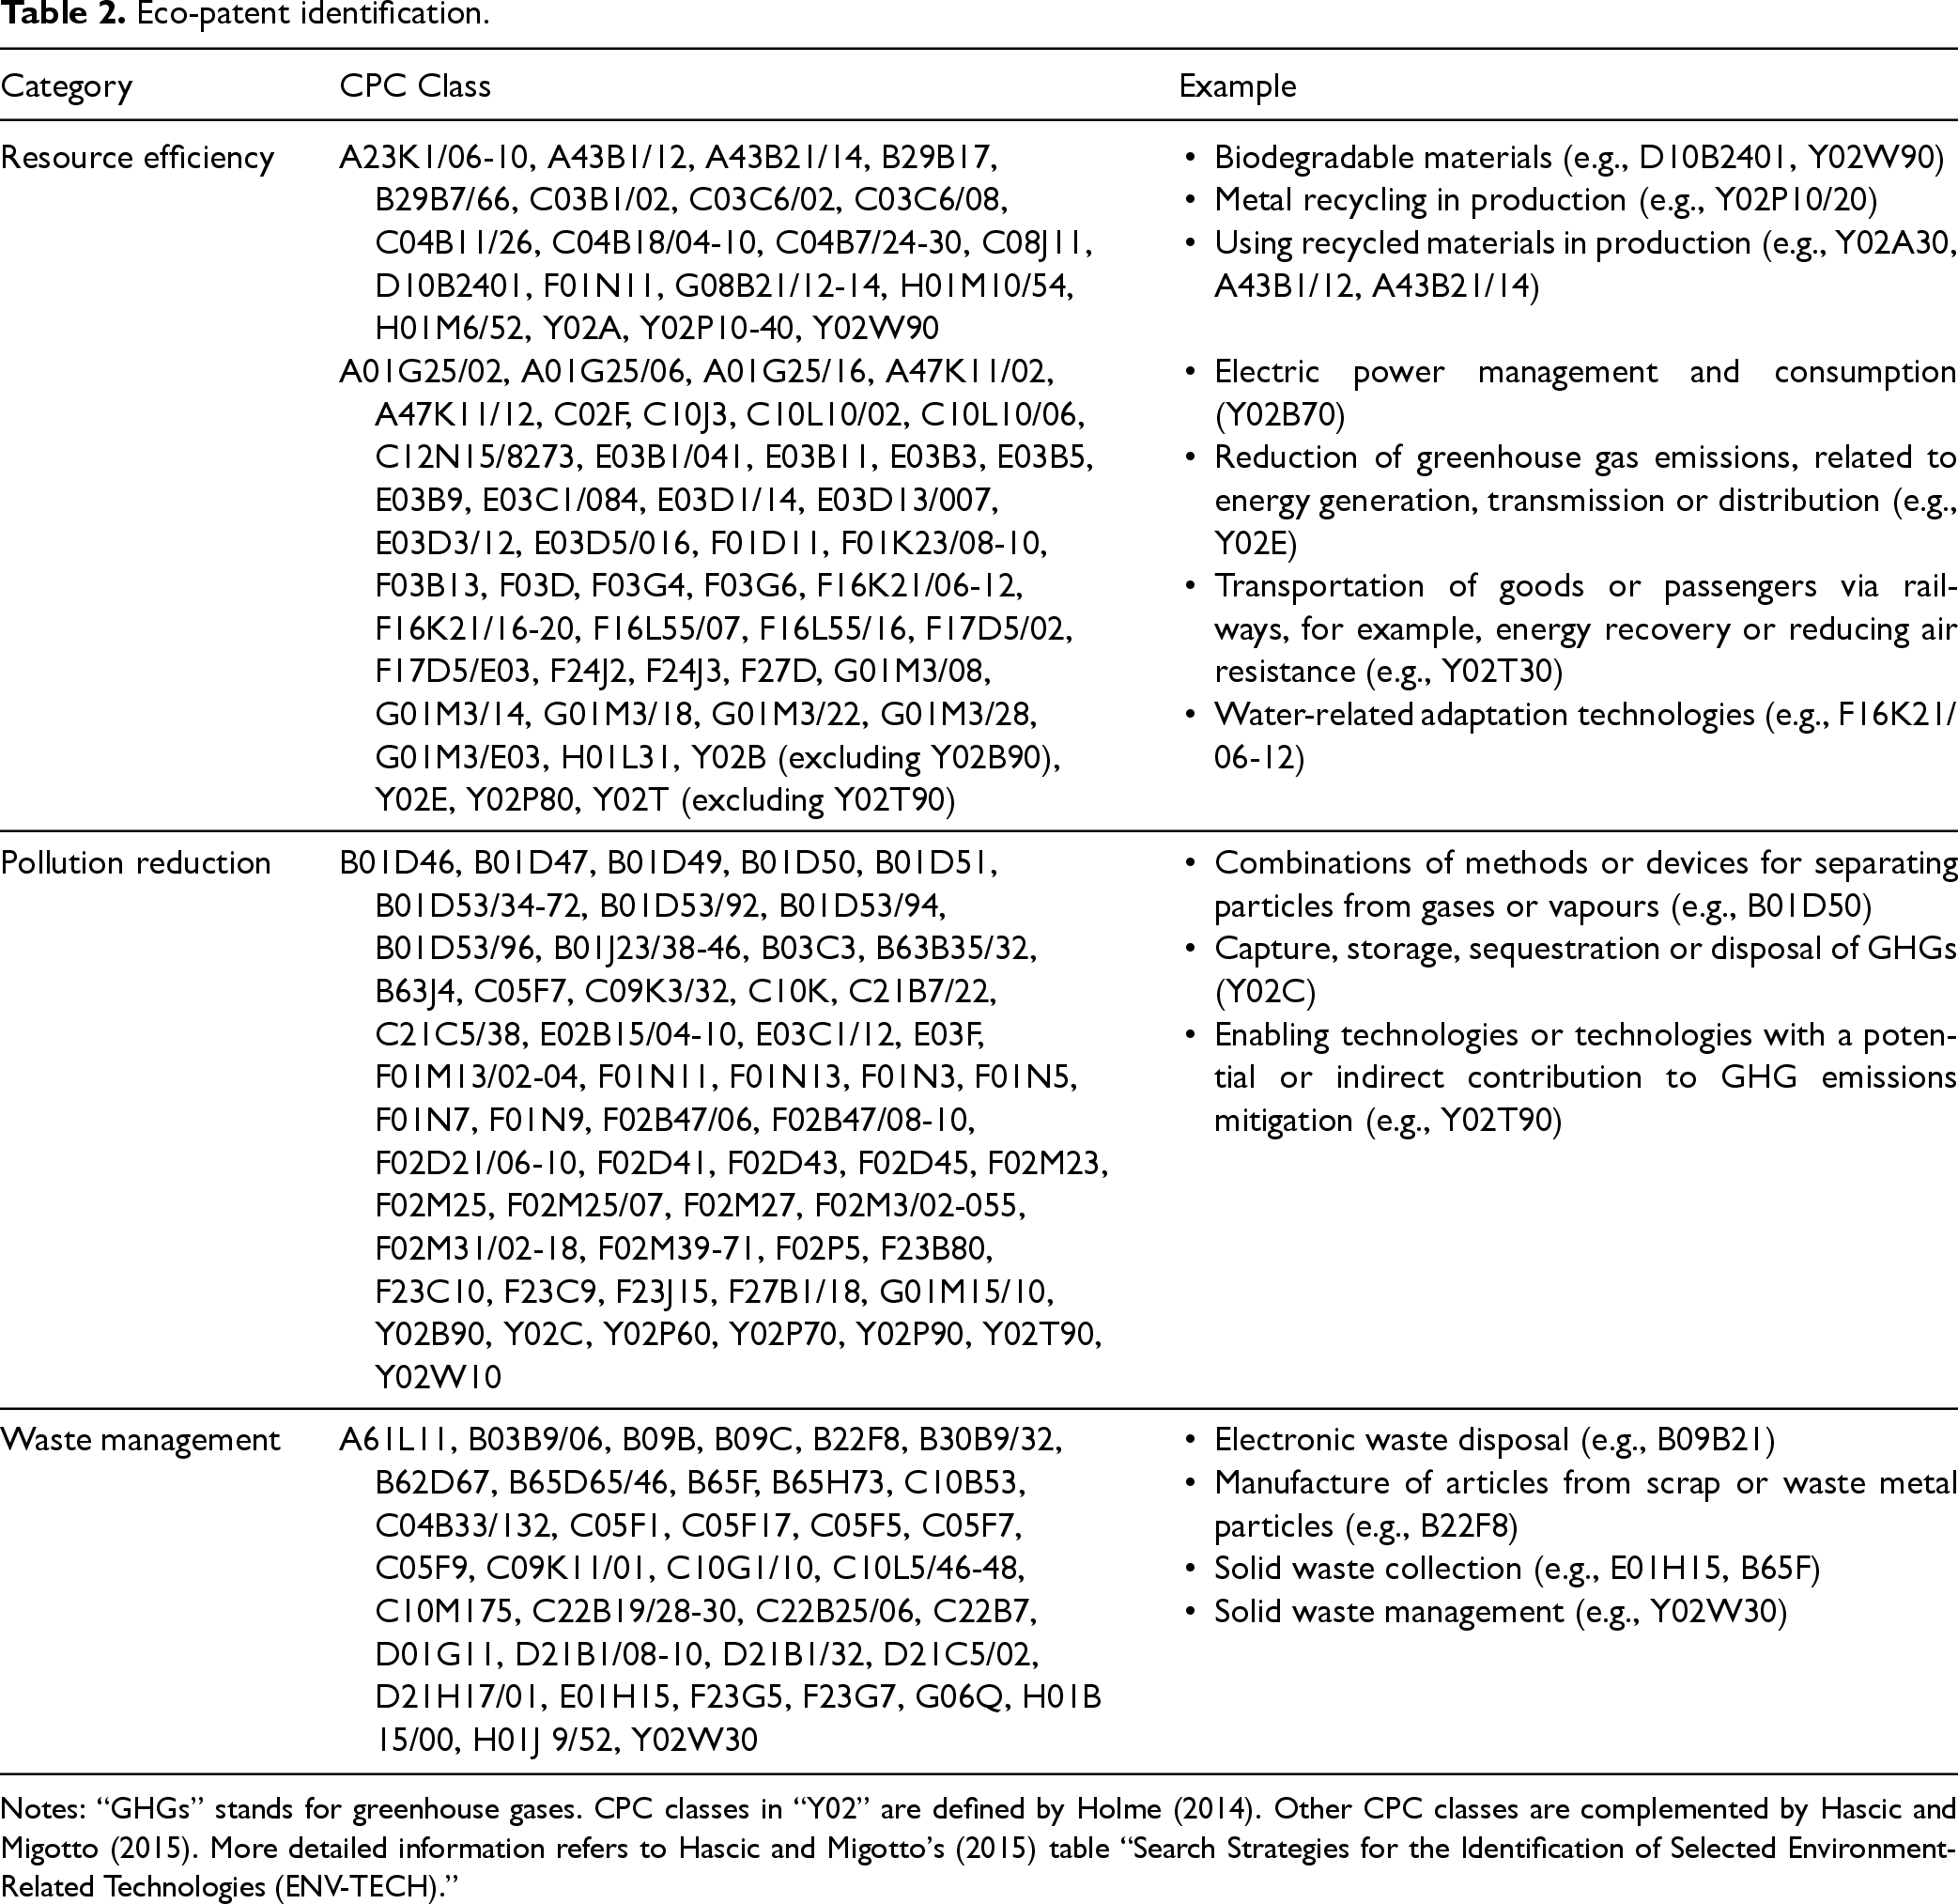
We identify eco-patents based on the CPC codes using two sources. First, the USPTO includes environment-related patents under the ‘‘Y” class (Holme, 2014). For instance, Y02W covers technologies in waste management, Y02P covers climate change mitigation technologies in the production or processing of goods, Y02E covers climate change mitigation technologies in energy generation, and Y02C covers greenhouse gas capture and storage-related technologies. Second, Hascic and Migotto (2015) provided a comprehensive list of CPC codes related to eco-friendly technologies, expanding upon the categorization of the USPTO. By combining these two sources, we compile eco-innovation-related CPC codes in Table 2.
Eco-patent identification.
Eco-patent identification.
Notes: “GHGs” stands for greenhouse gases. CPC classes in “Y02” are defined by Holme (2014). Other CPC classes are complemented by Hascic and Migotto (2015). More detailed information refers to Hascic and Migotto’s (2015) table “Search Strategies for the Identification of Selected Environment-Related Technologies (ENV-TECH).”
To investigate the impact of E-waste regulations on a firm’s heterogeneous innovation orientation across the entire product life cycle, we further explore the sub-categories of eco-patents. Specifically, our categorization of eco-patents is inspired by Calcott and Walls (2005), who argue that EPR regulations incentivize innovations targeting both upstream and downstream processes, each with distinct focuses. Innovations targeting upstream processes aim to redesign products or processes to mitigate environmental harm, while innovations targeting downstream processes focus on recycling or reuse to minimize waste in landfills (Calcott and Walls, 2005).
We break down innovations targeting upstream processes further into “resource efficiency” and “pollution reduction,” which are adapted from the environmental economics literature (Johnstone et al., 2010; Lanjouw and Mody, 1996). These categories focus on improving designs and processes to reduce environmental impacts before reaching the end-of-life stage, but each has a distinct emphasis.
Resource efficiency (Resource): Innovation related to an eco-friendly product or process design and water or energy saving in the stages before the end of life (Johnstone et al., 2010). For example, designs for recycling or using reusable, recycled, or biodegradable materials in product design or product processes, as well as technologies for saving or recycling water or using clean energy in production, are included. We count the total number of filed eco-patents for resource efficiency and code the variable as
Pollution reduction (Pollution): Innovation for reducing GHG or pollution resulting from other chemicals in the stages before the end of life (Lanjouw and Mody, 1996). For example, technologies for the capture, storage, sequestration, or disposal of GHG are included. We count the total number of filed eco-patents for pollution reduction and code the variable as
For innovations focusing on downstream processes, we focus on “waste management” eco-patents, which tackle waste management issues at the EoL stage.
Waste management (Waste): Innovation related to waste collection, recycling, or environmental disposal in the EoL stage (Jana et al., 2023). For example, technologies for removing toxic materials from waste and recycling precious metal from scrap or waste particles are included. We count the total number of filed eco-patents for downstream reuse/recycle/disposal and code the variable as
We control for firm-level and market-level variables that may affect a firm’s eco-innovation.
Return on assets (ROA). We use ROA, the income before taxes scaled by total assets, to account for a firm’s financial performance.
Other patents (PAT). We use the natural-logged total number of granted patents, excluding granted eco-patents, scaled by the natural-logged total assets, to control for a firm’s propensity to patent.
State EPR (EPR). We control for the number of EPR regulations that cover non-E-waste products in the states where the firms are headquartered to capture the potential impact of the state’s regulatory environment for EPR on local firms’ overall attitudes toward product take-back. According to the existing literature, the attitudes of top management teams towards social and environmental responsibility can be influenced by the political and regulatory environment at the state level (Di Giuli and Kostovetsky, 2014). Consequently, other EPR regulations may direct the attention of top management teams toward EoL product management and foster the development of innovative solutions.
Industry concentration (HHI). We utilize the Herfindahl–Hirschman index (HHI) based on two-digit SIC codes to capture an industry sector’s concentration (Fu et al., 2019). The higher the value, the lower the degree of competition within the sector. Industry-level concentration may affect a firm’s propensity to differentiate itself through innovation.
Market share (MTKS). We control for a firm’s annual sales scaled by total annual sales among all firms in the same two-digit SIC industry sector to capture a firm’s industry-based market share (Pennetier et al., 2019). Firms with a higher market share may be more likely to innovate to stay competitive, with customers having heterogeneous preferences for eco-innovative products.
We construct a set of firm-level variables as covariates for propensity score matching (PSM) to match our treatment and control firms. More details of the matching process are given inSection 4.2.
Total assets (SIZE). We use the log-transformed total assets to account for firm size.
R&D intensity (RDI). We use the R&D expenditure scaled by total assets to account for a firm’s innovation capability.
Financial leverage (LEV). We use the short-term debts scaled by total sales to account for a firm’s financial constraints.
Capital intensity (CI). We use the fixed capital scaled by the total assets to account for a firm’s asset liquidity.
Inventory turnovers (INV). We use the cost of goods sold scaled by inventory expense to account for a firm’s operational efficiency.
Methodology
In this section, we describe a ST-DID model to test the relationship between E-waste regulations and eco-innovation. The ST-DID approach is often used to estimate the causal effect of a policy or treatment on an outcome variable while taking into account the various timings of treatment introduction (Callaway and Sant’Anna, 2021).
In a DID setting, both treatment and control groups need to have clearly defined pre- and post-treatment periods and only the treatment group should be treated in the post-treatment period. Unlike situations where all treated firms receive treatment at the same time, our sample includes treated firms that were treated in different years. Therefore, the pre- and post-periods for the control firms must correspond to their matched firms in the treatment group. Moreover, firms in the control group should be statistically similar to those in the treatment group to provide fair comparisons across the pre- and post-treatment periods. To overcome these challenges, we utilize a combination of PSM and ST-DID techniques. The PSM method helps us reduce selection bias by finding control firms that closely resemble the treated firms (Imbens and Rubin, 2015). After we match these firms, we can then clearly define the pre- and post-treatment periods for the control firms based on their matched treated firms. This approach ensures that each control firm serves exclusively as a control for the specific treated firm to which it is matched, rather than for all treated firms.
In the following subsections, we first introduce the construction of the treatment and control groups. Then, we explain our identification strategy. We also present a set of identification checks to ensure robustness and validity in Section 5.1.
Treatment and Control Pool Cleaning
Using all Compustat firms that are not in the finance sectors (SIC 6000-6999), we create an initial sample, namely Full Sample. The time span is from 1999 to 2016. The Full Sample includes
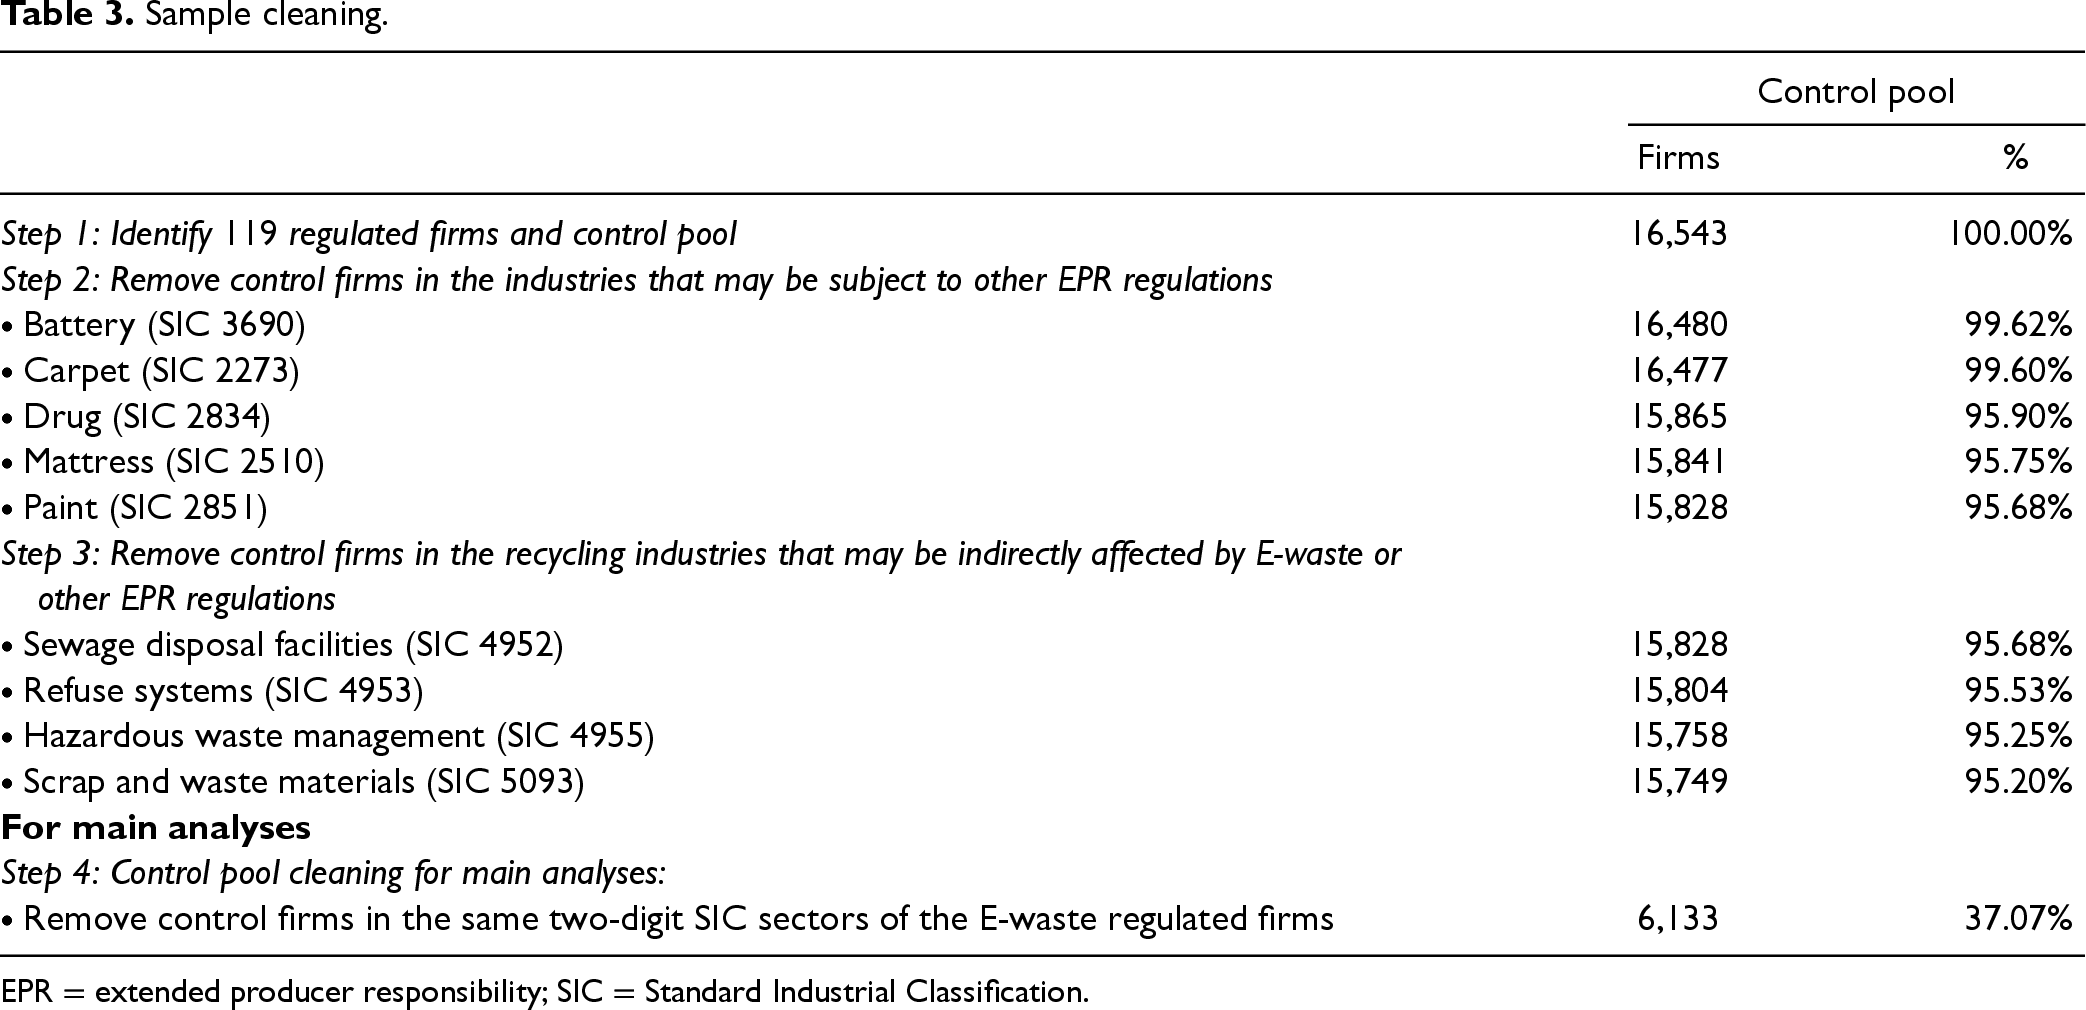
Sample cleaning.
Sample cleaning.
EPR = extended producer responsibility; SIC = Standard Industrial Classification.
In Step 1, we identify
The treatment effect of E-waste regulations can be contaminated if firms in the control group are subject to other EPR regulations. We hence remove control firms that can be regulated by other EPR regulations in Step 2, including firms in the battery (SIC 3690), carpet (SIC 2273), mattress (SIC 2510), drug (SIC 2834), and paint (SIC 2851) industries. In this step, we remove
In the later steps, we account for the potential violation of the stable unit treatment value assumption (SUTVA), an important assumption under the DID setting. SUTVA can be compromised if firms within our control group are indirectly affected by E-waste regulations (Bertrand et al., 2004; Imbens and Rubin, 2015).
Firms in the recycling industries can also be indirectly affected by E-waste or other EPR regulations as they may be involved in handling the take-back processes. In Step 3, we remove recycling firms, including the firms in the scrap and waste materials (SIC 5093), sewage disposal facilities (SIC 4952), hazardous waste management (SIC 4955), and refuse systems (SIC 4953) industries. Thus, we remove
In Step 4, we further remove control firms in the same sector (two-digit SIC) as the regulated firms. This is because these control firms, potentially competitors of the regulated firms, could be indirectly influenced by E-waste regulations due to market dynamics. For example, regulated firms might share take-back obligations with their component suppliers, indirectly increasing the supply chain costs for their competitors and subsequently reducing their competitors’ investment in eco-innovation. In this step, we remove
After these steps of initial sample cleaning, the full sample retains
Summary statistics,
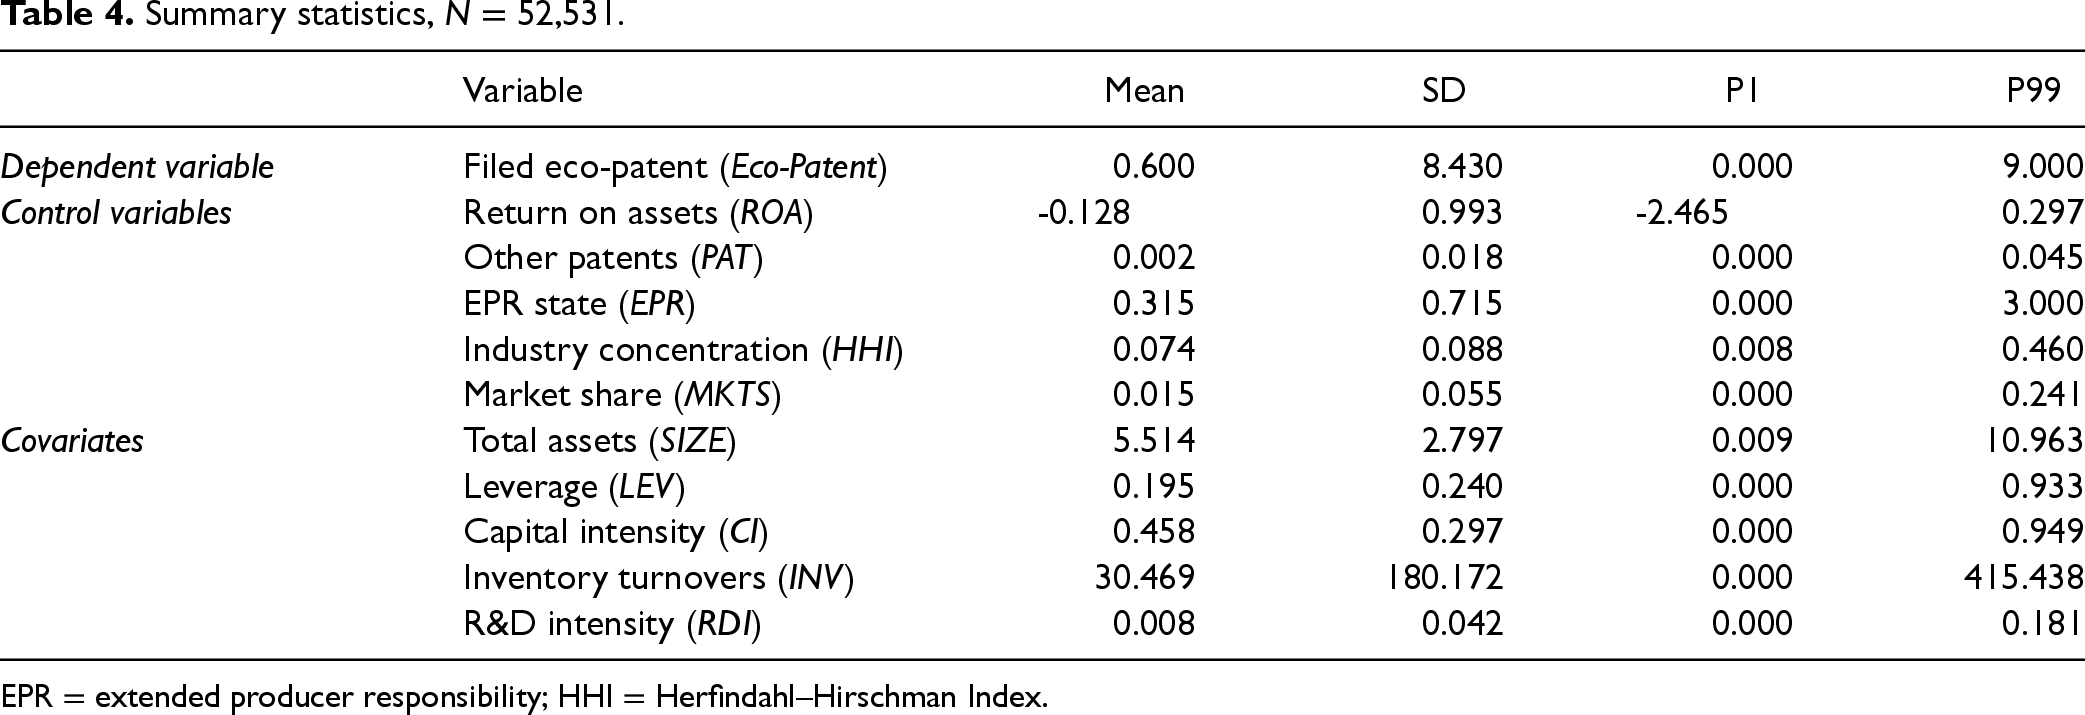
EPR = extended producer responsibility; HHI = Herfindahl–Hirschman Index.
Correlations (*
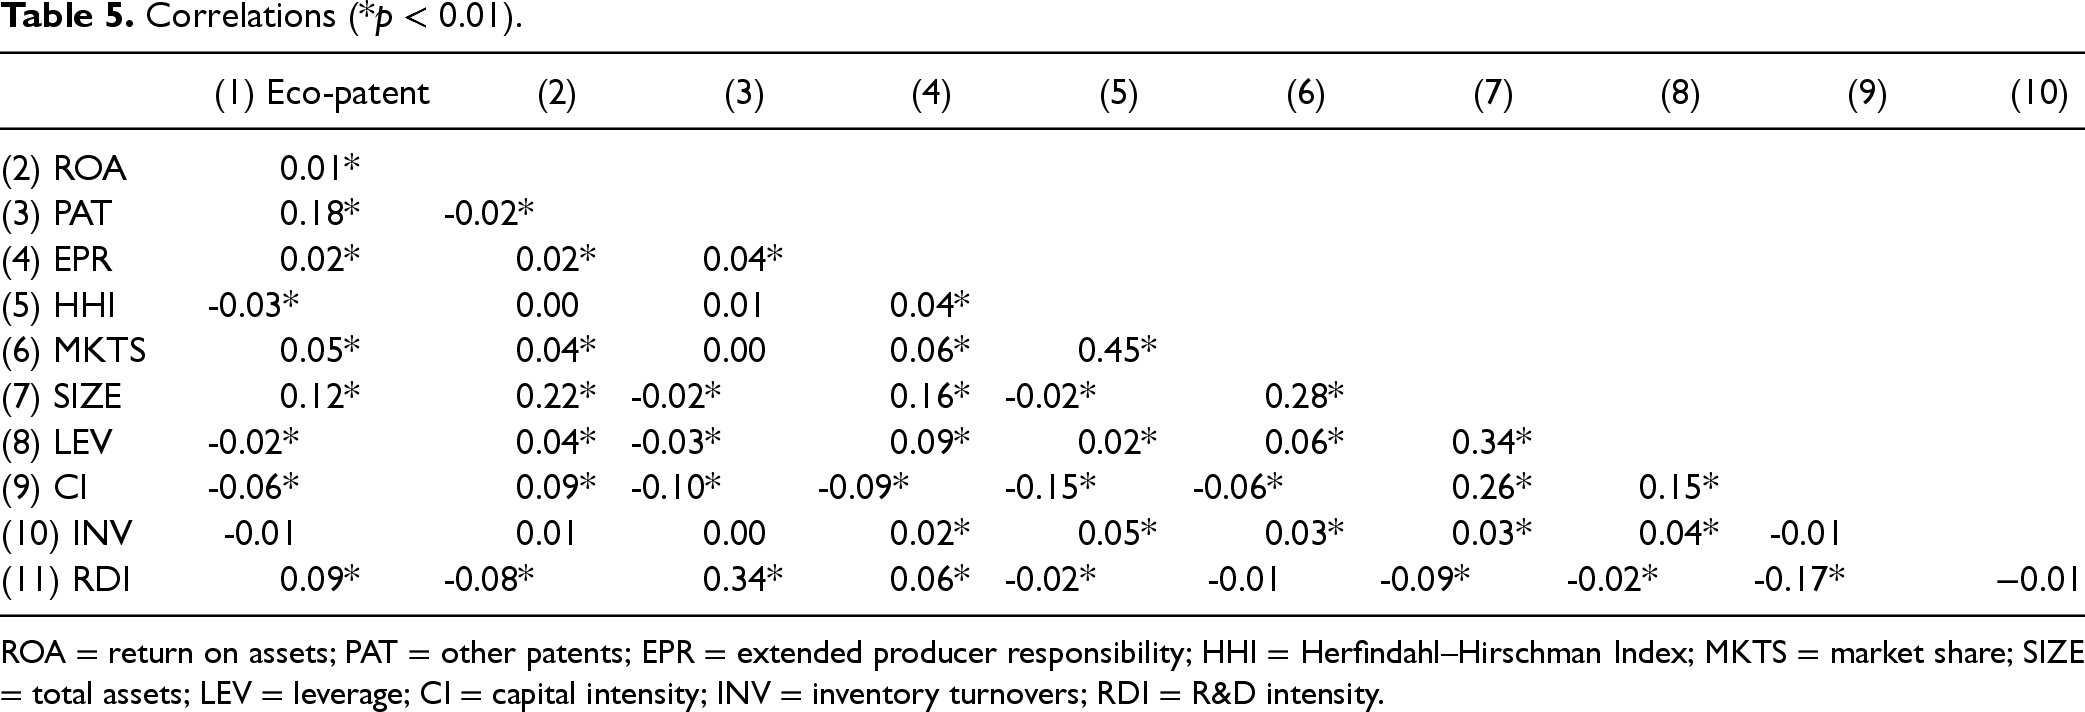
ROA = return on assets; PAT = other patents; EPR = extended producer responsibility; HHI = Herfindahl–Hirschman Index; MKTS = market share; SIZE = total assets; LEV = leverage; CI = capital intensity; INV = inventory turnovers; RDI = R&D intensity.
We define the treatment group variable (Treatment) as a binary variable that differentiates firms based on the treatment and control pool assignments. All firms in the pool of treated firms are coded as
In an effort to enhance the robustness of our findings, we introduced an alternative control pool, including firms that are outside of regulated firms’ two-digit SIC sectors and are not regulated firms’ direct suppliers (see Section 5.4 for more details).
In this section, we construct the final sample (DID Sample) for examining the impact of E-waste regulations using a PSM approach with staggered treatment adjustments.
Propensity Score Matching
Non-random assignment of firms to our treatment and control groups can introduce bias in estimating the treatment effect. In other words, E-waste regulations may selectively target products and firms with larger market shares, potentially leading to pre-existing trends in eco-innovation development that can influence the validity of the estimates. To resolve this potential issue, we apply PSM to construct a control group that is comparable to the treatment group in terms of the likelihood of being regulated before the treatment’s occurrence. In particular, PSM has been commonly used to minimize selection bias in quasi-experimental studies. According to Rosenbaum and Rubin (1983: 44), PSM can be used to ‘balance treatment and control groups on a set of observable characteristics (i.e., to make the groups as similar as possible for those observed characteristics).
We identify a set of matching covariates that may affect a firm’s likelihood of being impacted by E-waste regulations and eco-innovation performance. First, we include SIZE and CI. Larger firms are more likely to eco-innovate and are more likely to be regulated by state legislation. Specifically, firm size and asset liquidity are closely related to a firm’s sustainability strategy, which may affect its eco-innovation decisions. Second, we include INV and LEV. Policymakers may consider producers’ operational capability and financial constraints when designing regulations. These factors may affect a firm’s resource allocation for take-back processes and eco-innovation investment. Third, we include RDI to capture a firm’s general innovative capability. Policymakers may target innovative firms to regulate and expect them to innovate for the environment (Kemp and Pearson, 2007). A firm’s R&D investment also affects its ability to eco-innovate. With these matching covariates, the matched control group should be similar to the treatment group in terms of firm size, financial constraints, operational efficiency, and innovative capability.
Staggered Treatment Adjustment
By examining state reports, we can determine whether a producer is registered in a particular state and year. Given that states in the US may implement E-waste regulations at different times and for different product categories, producers may face regulations in different regions and at different times. This may result in variations in the years in which producers were first regulated. Such staggered treatment timing further complicates the parallel trends assumption test because the pre- and post-treatment periods for a control firm are not directly defined but depend on its matched treated firm (Callaway and Sant’Anna, 2021).
To determine the initial year a producer is treated under regulation, we identify the calendar year in which it first appears as a registered producer in a state government report. We treat each treated year as discrete and perform a PSM for a sample of the treated firms in that year and the pool of control firms (Dong et al., 2018). Within the sample, we use the nearest-five neighbor approach (NN5) to select the closest five control firms for each treated firm while allowing replacement, that is, a control firm can be matched with multiple treated firms in the same matching period. We also perform robustness checks in Section 5.4 with the nearest-one and nearest-three neighbor matching, and the results remain qualitatively consistent.
Post-Treatment Period
The ST-DID technique relies on the parallel trends assumption, which may be violated in the absence of an appropriate control group or clear pre- and post-treatment periods in the control group. We match the control group for each firm in the treatment group and construct the post-treatment periods while accounting for the staggered legislation impacts.
We use a set of Probit regressions to calculate propensity scores, and the dependent variable is Treatment:
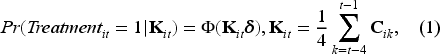
In the PSM process, we enforce regulated firms to be matched with control firms that are in different two-digit SIC sectors but headquartered in the same states. If any regulated firm is unmatched, we would then match them with firms that are in different two-digit SIC sectors and headquartered in different states. We also require the before and after treatment period length to be balanced across the treatment and control groups. Regulated firms lacking a complete eight-year period—comprising four years before and four years after receiving treatment—are excluded from the matching process. These three matching steps yield our final DID sample, including
We further relate the pre- and post-treatment periods of control firms to their matched firms in the treatment group and create the post-treatment period indicator. We code the post-treatment binary variable (After) as
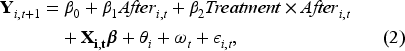
Because our dependent variables are count variables, we incorporate an ST-DID setup into a negative binomial model
5
in equation (2), based on our final matched sample.
In this section, we first perform a set of identification checks to examine whether our PSM-ST-DID design can identify the treatment effect of E-waste regulations. We then present the main results and a set of robustness checks.
Identification Check
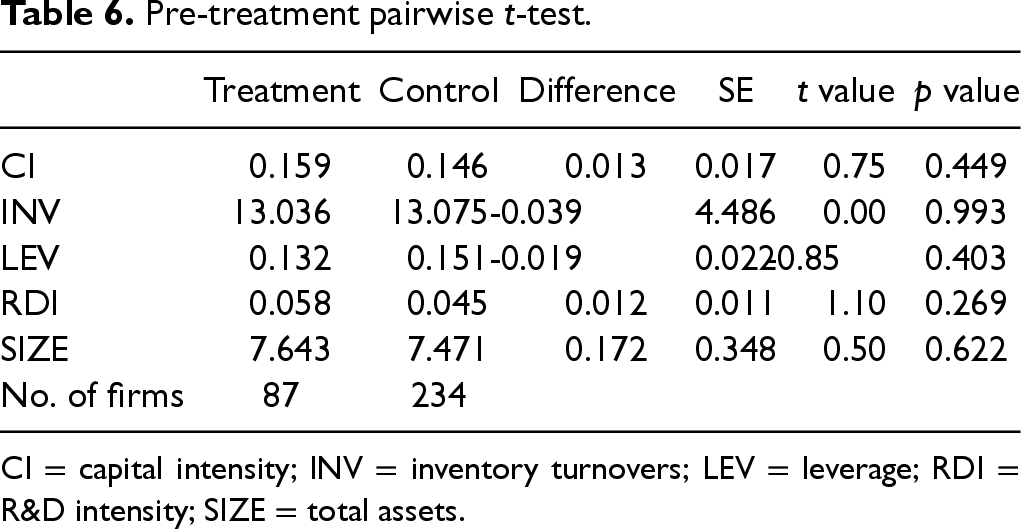
We first check the propensity score and matching covariates balance. In Table 6, we present the mean differences of the matching covariates between the treatment and control groups in the pre-treatment period. Based on a set of pairwise t-tests, we do not observe significant differences in the means of the covariates, which shows strongly balanced distributions in the pre-treatment phase.
Pre-treatment pairwise t-test.
Pre-treatment pairwise t-test.
CI = capital intensity; INV = inventory turnovers; LEV = leverage; RDI = R&D intensity; SIZE = total assets.
We conduct a before-versus-after analysis focusing on the treatment group and present this as a preliminary finding.
7
The sample in this analysis includes the
Main Results
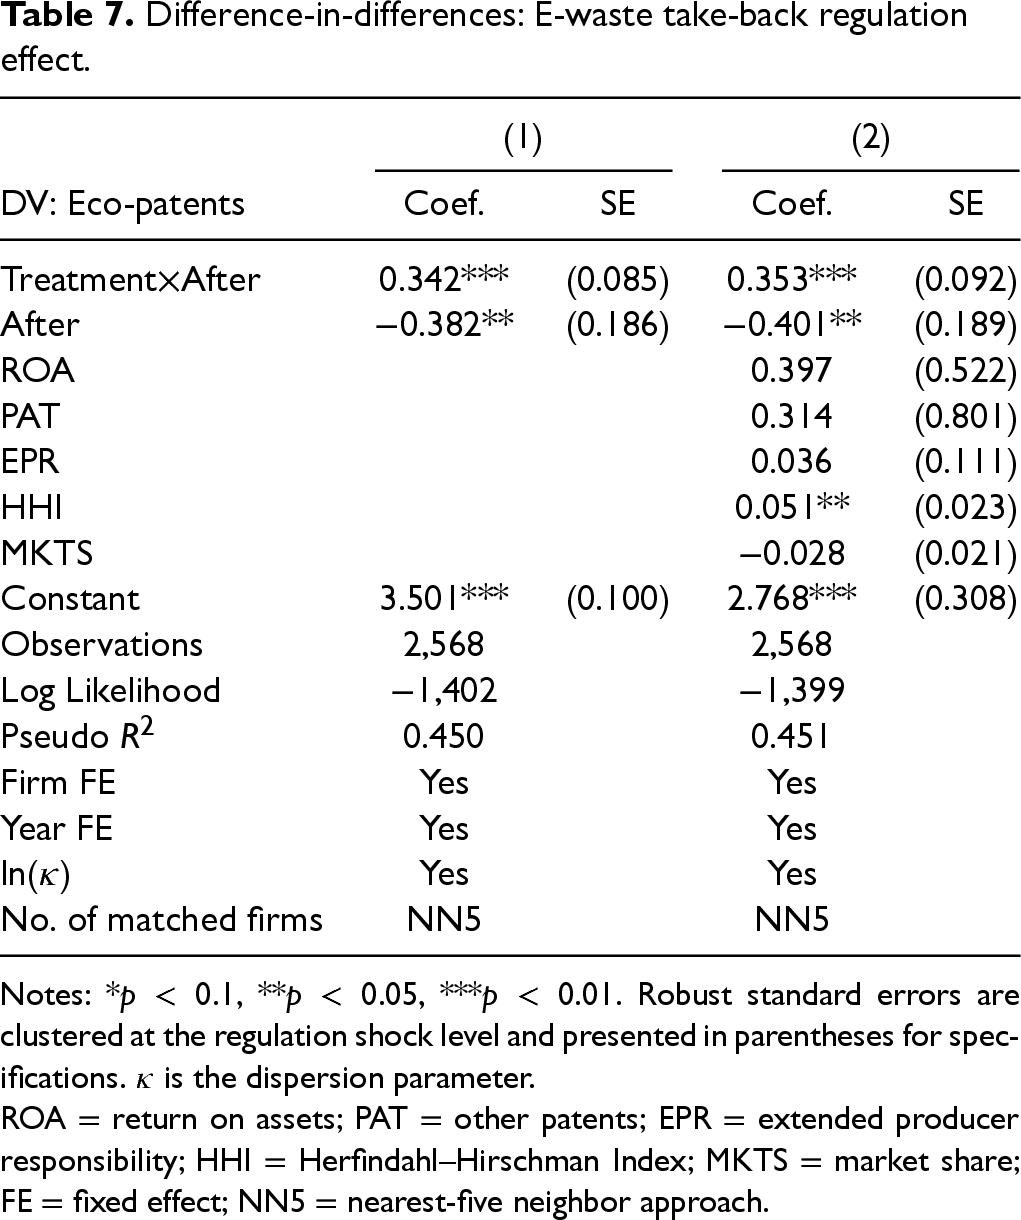
In Models 1 and 2 of Table 7, we summarize the treatment effects of E-waste regulations on eco-innovation using a four-year before-after window. Firm and year-fixed effects are included. Treated producers and their matched control firms are clustered according to the first state(s) to regulate the treated producers. 8 Model 1 is a baseline model without control variables. Model 2 presents the effects of the control variables. Specifically, greater HHI is positively associated with the likelihood of eco-patent filing by producers, suggesting that higher market concentration, dominated by fewer firms, provides these firms with more resources and market power to invest in R&D for eco-friendly technologies.
Difference-in-differences: E-waste take-back regulation effect.
Difference-in-differences: E-waste take-back regulation effect.
Notes: *
ROA = return on assets; PAT = other patents; EPR = extended producer responsibility; HHI = Herfindahl–Hirschman Index; MKTS = market share; FE = fixed effect; NN5 = nearest-five neighbor approach.
In both models, the coefficients of Treatment
We further explore how producer eco-innovation changes dynamically after being regulated. In particular, we estimate equation (3):
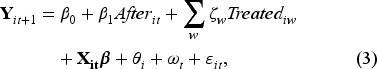
We report the estimates in Figure 1. We see no difference between the treated and control firms in the pre-treatment period. This finding allows us to rule out the likelihood that producers anticipate that they will be regulated and eco-innovate in advance (Angrist and Pischke, 2009). We further show that after being regulated, the difference between the control and treated firms becomes positive and increases significantly over time. These dynamic changes also reinforce our findings that E-waste regulations positively impact the likelihood of eco-patent filing.
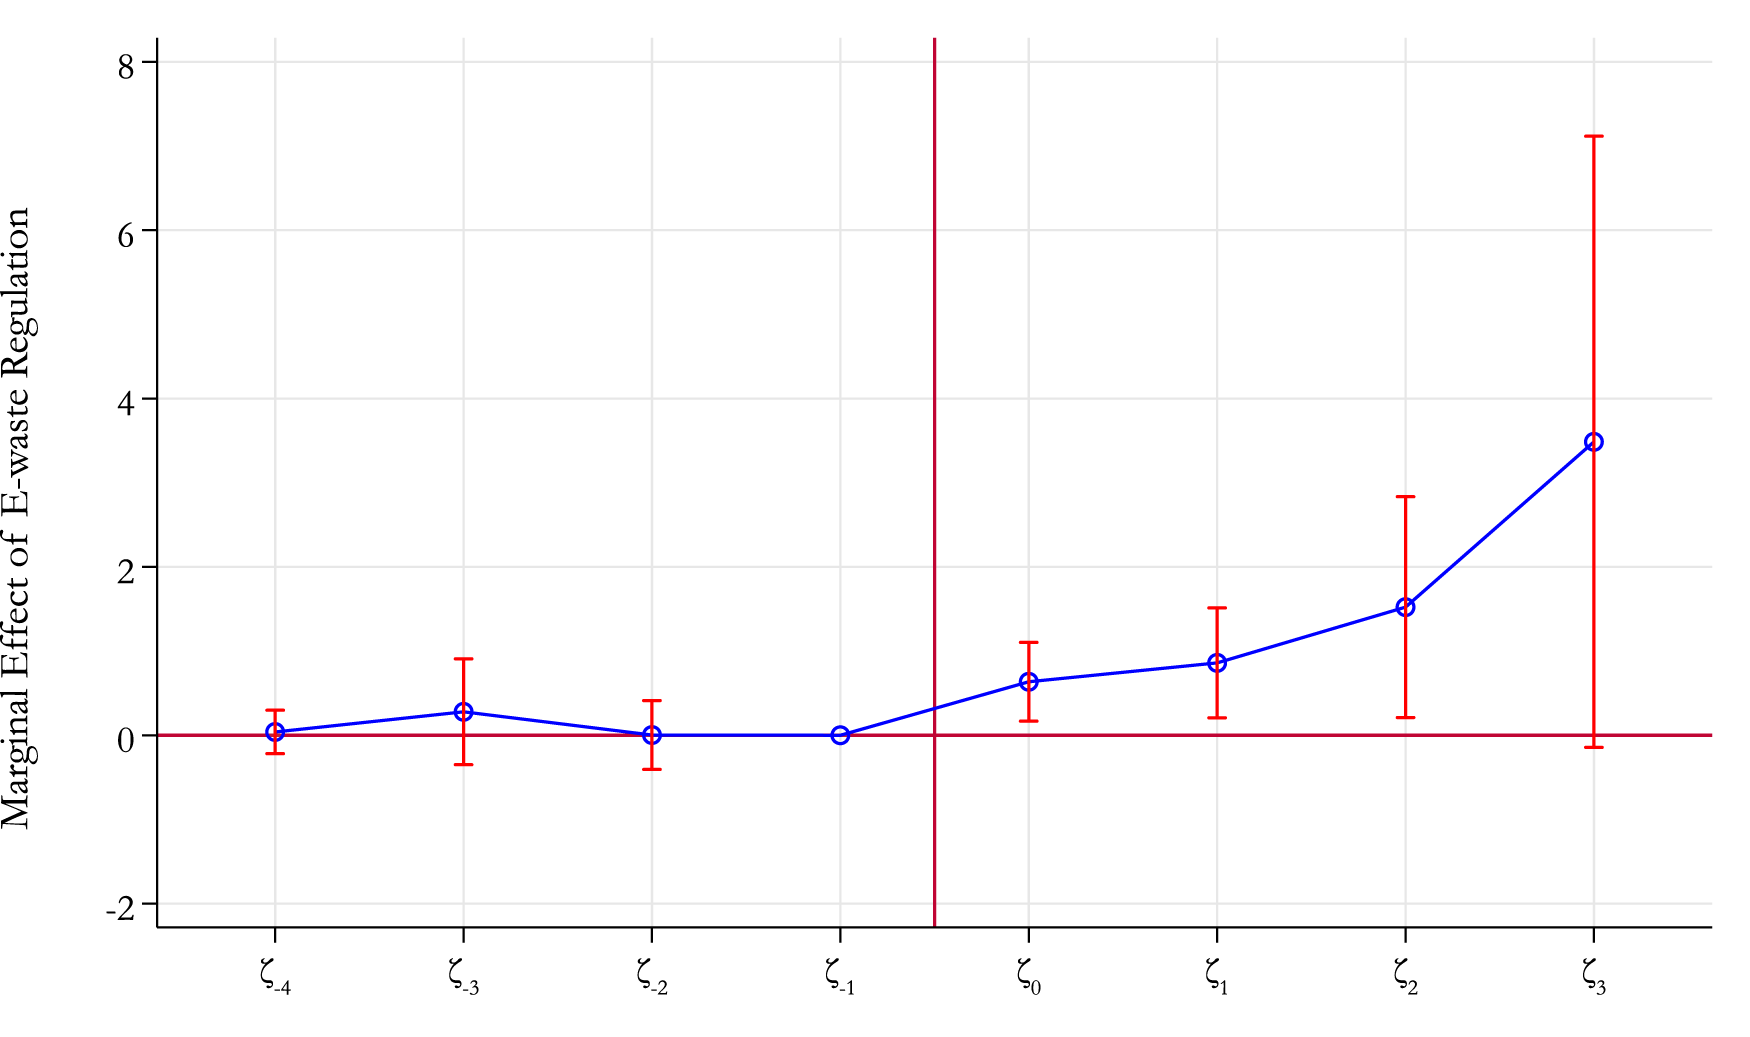
Dynamic treatment effect. Notes: The solid line captures the marginal treatment effects of E-waste regulations, and the whiskers capture the confidence intervals at 95%. The marginal effect in the one year before being regulated is standardized as zero. The vertical threshold differentiates the group differences before and after being regulated.
In Electronic Companion EC.2, we conduct supplementary analyses to evaluate the robustness of our findings. Specifically, we demonstrate that our main results remain qualitatively consistent under various conditions, including (a) alternative control groups, (b) treatment scale differences, (c) variations in treatment timing, (d) alternative methods of standard error estimation, (e) different model estimation approaches, (f) alternative dependent variables, and (g) variations in the matching processes.
Extensions: Heterogeneous Treatment Effects
In this section, we further explore the impacts of E-waste regulations under various compliance schemes among state regulations and producer preferences across different eco-innovation categories.
Various Compliance Schemes of State E-waste Regulations
In the main analysis, we find a positive and significant treatment effect of E-waste regulations on eco-innovation. The various state regulations in the US specify different levels of take-back obligations and allow for different compliance options. Thus, the treatment effect may be heterogeneous, depending upon each state’s regulation. We conduct this extended analysis to illustrate how heterogeneous state regulations affect producer eco-innovation.
As shown in Electronic Companion EC.1 Table A2, 11 states have specified take-back performance levels with penalties (e.g., producers fined or banned from selling their products in the state). These states also allow producers to purchase credits and/or pay a surcharge if they fail to meet the take-back requirements (Nash and Bosso, 2013). 9 For instance, New York’s E-waste regulation allows manufacturers to reach collection levels using surplus collection credits from previous years and buying surplus credits from other manufacturers. The rest of the state regulations do not mandate any recycling performance but instead require that producers offer take-back programs free of charge to consumers. Regulated firms in these states may have the flexibility to decide their take-back efforts and even incur no clear penalty if they do not offer any take-back program (Texas, 2011).
We categorize the state regulations into three types: (1) California (CA), (2) regulated states without specified mandatory take-back performance levels (Non-Enforced), and (3) regulated states with specified mandatory take-back performance levels (Enforced) (Nash and Bosso, 2013). 10 We treat CA regulation as an independent type because it is the only state regulation following a fee-upon-sales scheme (Plambeck and Wang, 2009).
A summary of our results is provided in Electronic Companion EC.1 Table A5. We include Figure 2 to illustrate the marginal effects of each type of regulation. Overall, our findings indicate that the treatment effect remains positive and significant across all three types of regulation—even E-waste regulations without mandating take-back performance can significantly motivate firms to eco-innovate. This finding suggests that firms may be internally motivated to eco-innovate, possibly in foreseeing more stringent rules and rising future costs. Consequently, firms may pursue eco-innovation for long-term benefits. We also find that the greatest significant positive impact comes from the state regulations that enforce performance levels, despite offering various compliance options. This finding suggests that when producers are subjected to stricter E-waste regulations, they are more likely to increase their eco-innovation efforts.
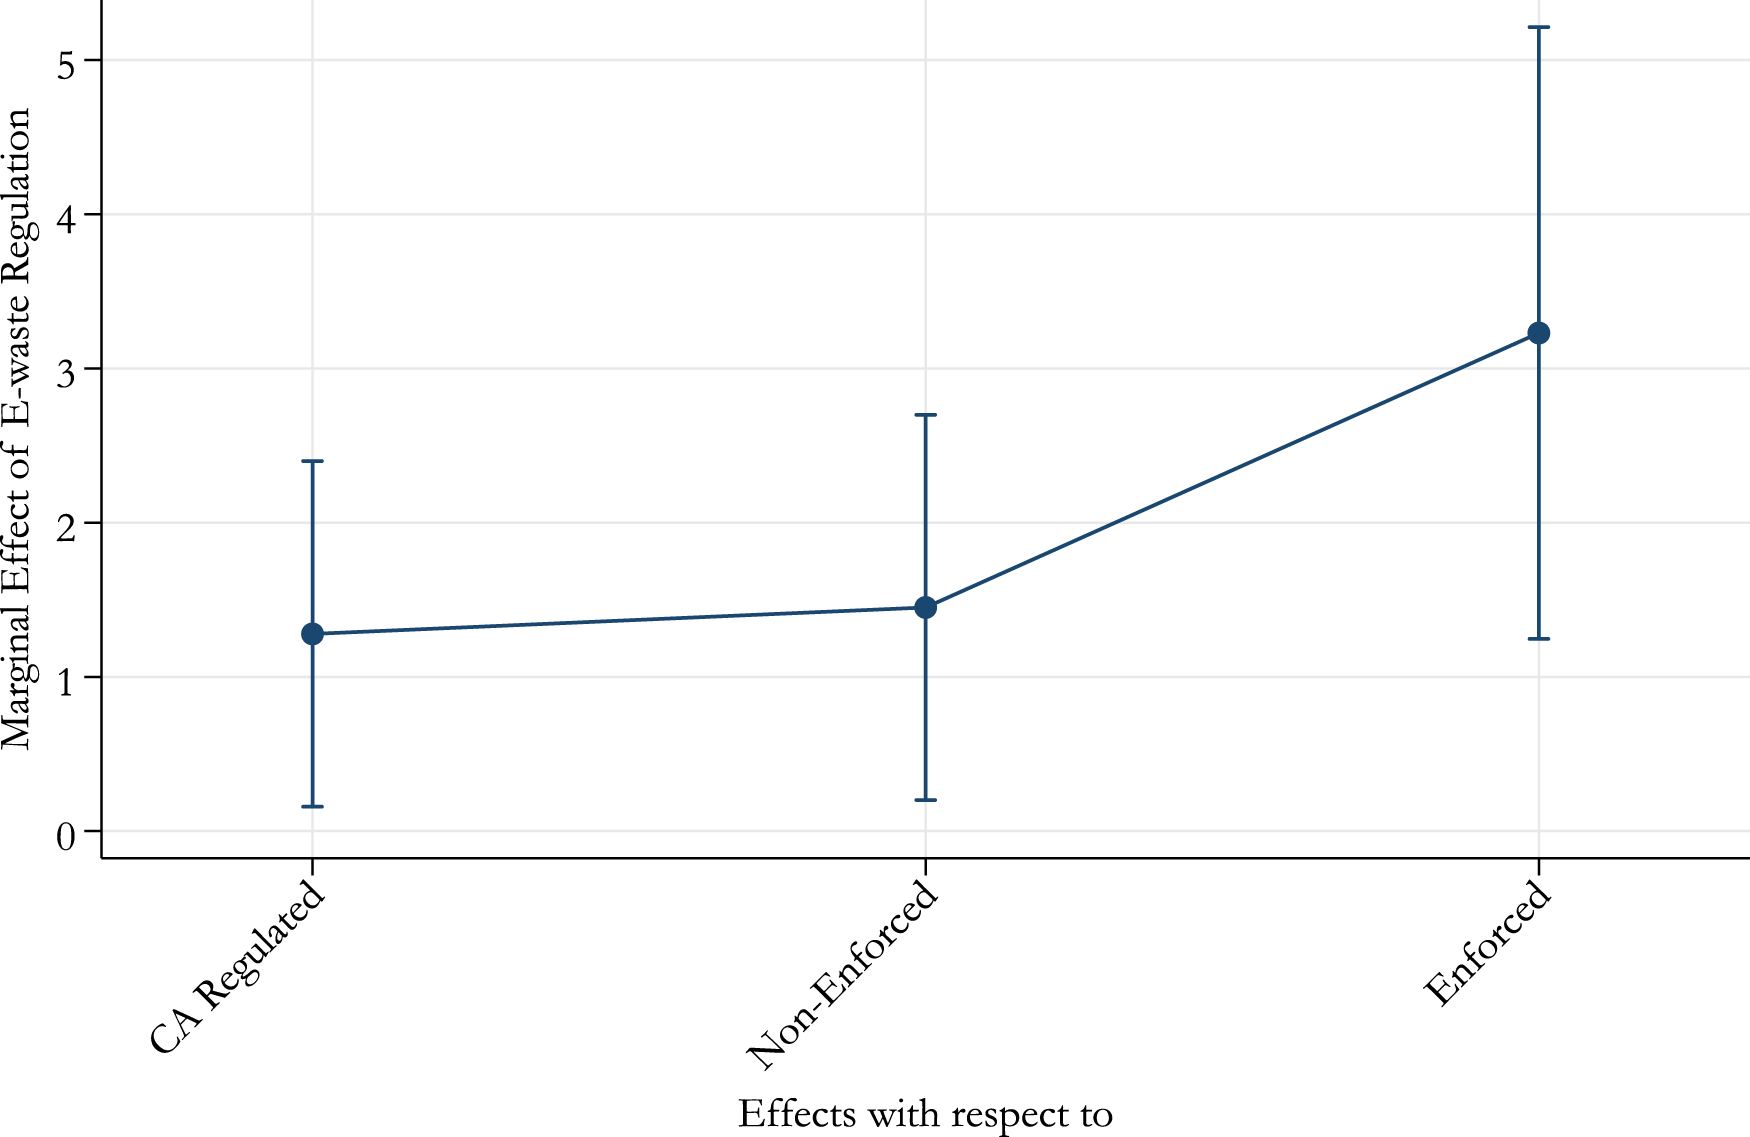
The heterogeneous effects of state regulations. Notes: The whiskers capture the confidence intervals at 95%.
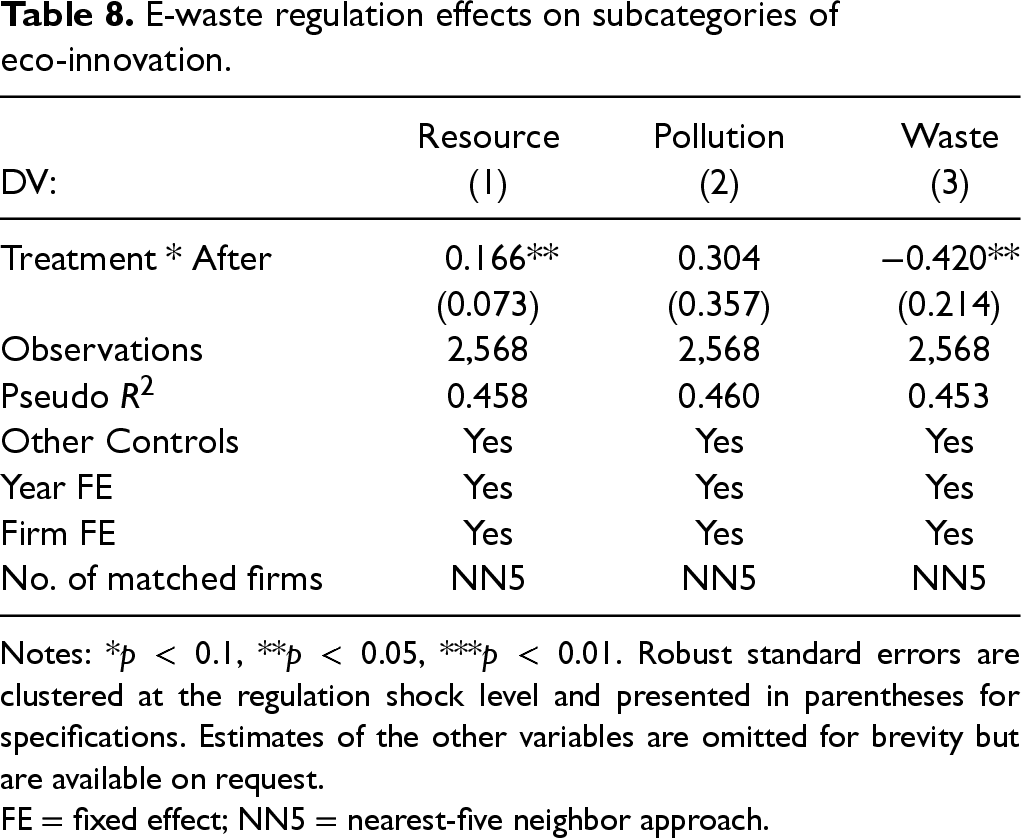
Eco-innovation may extend to the entire product life cycle involving both upstream design and downstream recycling processes. Prior studies have explored the positive impact of EPR regulations on overall eco-innovation (Røine and Lee, 2006; Zhao et al., 2021). Given that producers have limited resources, it remains unclear to what extent E-waste regulations can drive producers’ eco-innovation in different life-cycle stages. To further examine the effectiveness of E-waste regulations on eco-innovation throughout the entire product life cycle, we extend our analysis by differentiating a producer’s eco-innovation efforts into more detailed subcategories. We use Resource Efficiency, Pollution Reduction, and Waste Management, introduced in Section 3.2.1, as the dependent variables in equation (2).
In Table 8, we show that the regulation impacts are heterogeneous across the product life cycle. In Model 1, we find that regulation significantly motivates firms to file more patents for resource efficiency (
E-waste regulation effects on subcategories of eco-innovation.
E-waste regulation effects on subcategories of eco-innovation.
Notes: *
FE = fixed effect; NN5 = nearest-five neighbor approach.
Overall, the mixed regulation impacts suggest that conflicting interests of producers in different eco-innovation subcategories may lead to substitution between innovations aimed at upstream and downstream processes, particularly when sourcing choices of recycling processes become available. Specifically, innovations focused on upstream processes, which are typically conducted in-house, can simplify EoL treatment challenges. This simplification may render downstream innovations less necessary, as these can often be more effectively managed by other supply chain partners, such as recyclers. For example, Dell collaborates with Wistron GreenTech for its E-Waste recycling program. Wistron GreenTech utilizes advanced mechanical shredding and separation technologies to efficiently extract valuable metals and other materials from PCBs of Dell products (Paben, 2018). Meanwhile, Dell enhances its product design at the upstream level by integrating recycled materials, such as carbon fiber and gold, and using renewable energy sources, such as hydropower for aluminum processing (Abbatiello, 2023). This strategy allows Dell to concentrate its innovation efforts on upstream processes that include in-house customization, reducing the need to invest in downstream waste management innovations. Recyclers like Wistron GreenTech, with their specialized downstream capabilities, effectively complement Dell’s upstream efforts.
In this research, we combine multiple data sources and draw a unique sample to empirically explore the impact of state E-waste regulations on eco-innovation in the US. Our analyses reveal a significant positive effect of such legislation on the advancement of eco-innovation among producers. Furthermore, we explore the nuanced impacts of E-waste regulations, examining the heterogeneity in state regulatory schemes and producers’ preferences towards different eco-innovation categories. These insights not only enrich the sustainable OM literature but also offer valuable implications for both policymakers and managers aiming to enhance sustainable practices for EoL treatment.
Theoretical Contributions
This research contributes to the literature on sustainable operations management by being one of the first empirical studies on the effectiveness of E-waste regulations on eco-innovation in the US. Prior literature largely focuses on how EPR policy design affects design for recyclability (Huang et al., 2019) or recycling technology development (Rahmani et al., 2021). For producers without existing knowledge and capabilities in take-back, developing relevant eco-innovation allows these producers to expand their core activities for better economic and environmental benefits. We find that producers are more likely to eco-innovate after regulation, thereby highlighting the effectiveness of state E-waste regulation on eco-innovation development. Furthermore, we show that the positive regulation effect is stronger after being regulated in states with more stringent take-back enforcement, suggesting that greater regulatory pressures foster eco-innovation.
Furthermore, recent EPR studies emphasize that the coordination between key stakeholders in the EPR system, for example, producers and recyclers, may incentivize more advanced innovation (Rahmani et al., 2021). In particular, the improved product design for recyclability requires complementary recycling technologies to maximize the economic benefits of recycling and reuse (Atasu, 2019). Our research contributes to the literature by highlighting the differentiated innovation focus of producers. Specifically, our findings indicate that E-waste regulations promote producer innovation in resource efficiency before the EoL stage but appear to discourage innovation in waste management during the EoL stage. This finding highlights a potential substitution between innovations targeting upstream and downstream processes and the opportunity for coordination with other supply chain partners, such as recyclers, who can handle EoL processes. These supply chain partners may be able to focus more on developing downstream innovations that complement the producers.
Managerial Implications
Our findings provide important implications for policymakers. Eco-innovation is essential to reduce environmental risks, such as carbon emissions and waste disposal (Demirel and Kesidou, 2011; Kemp and Pearson, 2007). Given the effectiveness of state E-waste regulations, we suggest policymakers need to continually promote legislation at the state level. Policymakers should also consider mandating take-back program adoptions and recycling levels in future legislation or regulation amendments to better incentivize eco-innovation. Furthermore, policymakers need to recognize that producers’ focus in eco-innovation is primarily during the upstream phase, especially in terms of resource efficiency innovation. Prioritizing innovations that enhance design for recyclability or re-usability not only helps reduce EoL treatment costs but also facilitates value extraction from take-back processes in the long term.
Additionally, while our findings indicate that producers may have decreased their interest in innovation for waste management post-regulation, further analysis in Electronic Companion EC.1 Figure A.2 shows an increase in eco-patent filings by recyclers for downstream waste management, particularly from 2003 to 2011. This trend suggests that recyclers may have become more involved in waste management innovation. Consequently, our findings indicate that producers may prioritize in-house eco-innovation targeting upstream processes, whereas recyclers can contribute to eco-innovation in waste management for downstream processes (Rahmani et al., 2021).
Our findings also provide implications for managers. While take-back requires high upfront costs and a steep learning curve, the accumulated take-back knowledge enables producers to acquire new competitive advantages by encouraging eco-innovation. Moreover, with limited resources, producers may need to choose more specific eco-innovation to complement take-back. Based on our findings, innovating for eco-design and resource-saving can be preferable as designing easier-to-recycle products upstream eases the difficulties in take-back processes and improves the efficiency of reclaiming resources in E-waste. Producers may also collaborate with external recyclers in developing complementary recycling technologies for efficient value extraction from E-waste.
Limitations and Future Research
As with other empirical studies, this paper has a few limitations, which present useful opportunities for future research. First, our data panel length is limited in studying the impacts of the initial E-waste regulations on eco-innovation due to the availability of eco-patent information. Considering that some states have recently begun making amendments to the initial regulations, future research can consider the new impacts generated by the amendments if and when additional patent data become available. Second, our research is focused on the impact of E-waste regulations. Future research can explore the impacts of EPR regulations that apply to subjects beyond E-waste. For instance, there is a growing state legislative trend regarding drug take-back programs (Atasu, 2019). Exploring how drug take-back regulations affect environmental pollution and incentivize innovation could be valuable. Third, potential supply chain factors, such as partnerships between producers and third-party recyclers, may affect eco-innovation but are not considered in this paper because of a lack of take-back process details. With richer data, future research could extend the scope of our research to the supply chain context. For example, as some producers may partner with third-party recyclers and suppliers to handle take-back, the complementarity between the supply chain partners’ eco-innovation capabilities would be compelling to explore. Fourth, our research is limited to the discussion of eco-innovation. Take-back regulations may have impacts on other firm performance measures. For example, take-back regulations require producers to establish new capabilities for storing and transporting EoL products. Producers may struggle with differentiating and sorting returned EoL products and other customer-returned products in their inventory management system (Lewins, 2019). To what extent take-back regulations disrupt the existing operational processes is ripe for additional study. Overall, we believe the understanding of take-back regulation effectiveness will be better understood with richer take-back process-level information. We hope this research can stimulate further work in this field.
Supplemental Material
sj-pdf-1-pao-10.1177_10591478251328587 - Supplemental material for E-waste Take-Back and Producer Eco-innovation: Empirical Analysis of State Regulations in the United States
Supplemental material, sj-pdf-1-pao-10.1177_10591478251328587 for E-waste Take-Back and Producer Eco-innovation: Empirical Analysis of State Regulations in the United States by Yuqi Peng, Sining Song, Sriram Venkataraman and Yan Dong in Production and Operations Management
Footnotes
Acknowledgments
The authors sincerely thank the department editor, the senior editor, and the three reviewers for their constructive guidance and valuable suggestions, which have greatly improved this article.
Declaration of Conflicting Interests
The author(s) declared no potential conflicts of interest with respect to the research, authorship, and/or publication of this article.
Funding
The author(s) received no financial support for the research, authorship and/or publication of this article.
Notes
How to cite this article
Peng Y, Song S, Venkataraman S and Dong Y (2025) E-waste Take-Back and Producer Eco-innovation: Empirical Analysis of State Regulations in the United States. Production and Operations Management 34(10): 2991–3009.
References
Supplementary Material
Please find the following supplemental material available below.
For Open Access articles published under a Creative Commons License, all supplemental material carries the same license as the article it is associated with.
For non-Open Access articles published, all supplemental material carries a non-exclusive license, and permission requests for re-use of supplemental material or any part of supplemental material shall be sent directly to the copyright owner as specified in the copyright notice associated with the article.