
Abstract
Under a relational contract, the value placed on expected future business must outweigh the short-term temptations to deviate for the buyer–supplier relationship to persist. Operational and relational factors that influence this trade-off have been explored, however, there is a considerable lack of research on the moderating effects of supplier and market characteristics. We offer insights into how supplier service models and market dynamics impact suppliers’ decisions to renege on the relational contract. Limited access to transactional and contractual data has restricted previous exploration. We overcome this limitation with a detailed dataset in the for-hire truckload transportation sector. We find that a third-party brokerage service model is better able to overcome operational demand challenges and maintain service due to lower capacity constraints and pooling effects as compared to asset-based providers. Furthermore, when the overall market is capacity-constrained, long-term relationships become less of a deterrent for suppliers to reject business. In addition, during tightly constrained markets, suppliers respond with higher rejection rates to short-term demand surges but not to historical demand variability.
Keywords
Introduction
The buyer–supplier relationship plays a critical role in performance when contractual terms are loose and terms are not court-enforceable (Bernstein, 1992; Taylor and Plambeck, 2007). Both parties uphold informal agreements because there is value placed on expected future business (Baker et al., 2002). When one party reneges on contractual expectations, it can be costly for the other side, leading to lower service levels and a damaged reputation with its own customers (Brahm and Tarzijan, 2016).
Various factors—both operational and relational—can influence each side’s value placed on the relationship and willingness to stick to the relational contract. For example, operational factors such as total demand volume (Heide and Miner, 1992) can lead to a higher likelihood that parties stick to the contract, whereas demand variability (Fynes et al., 2005) can lead to suppliers reneging because serving that business is operationally more costly. In terms of relational factors, more frequent interactions (Cousins and Menguc, 2006) and longer relationships (Fynes et al., 2008) can lead to a higher value placed on the relationship, greater expectations of future business, and higher likelihood that parties adhere to the contract. In addition, parties’ characteristics and factors external to the relationship may lead to reneging in the short-term. For example, the supplier’s business model may determine which business it prioritizes. Moreover, as external market conditions may create higher priced alternatives and entice the supplier away from the agreement, the value placed on the future of the relationship must be greater than the temptation to deviate from the contract (Macchiavello and Morjaria, 2015). However, despite research on the operational and relational interactions in the buyer–supplier relationship and their direct effect on performance (e.g., Autry and Golicic, 2010; Qian et al., 2021; Villena and Craighead, 2017), few studies explicitly consider how parties’ characteristics and factors external to the relationship may impact the relationship (Macchiavello and Morjaria, 2015; Terpend et al., 2008).
In their review of two decades of buyer–supplier relationship research in top supply chain management journals, Terpend et al. (2008) note that “[t]he effects of many buyer, supplier and market characteristics, as well as product characteristics have yet to be explored” (Terpend et al., 2008, 43). We address this “paucity of research that has considered mediating or moderating effects” (Terpend et al., 2008, 42) and study how supplier business model and market dynamics moderate the relationship between operational (e.g., demand variability) and relational (e.g., long-term business relationships) factors and supplier performance and address the following research question:
We explore these moderating effects in for-hire truckload (TL) transportation services in the US where nonbinding, relational contracts between buyers (shippers) and their transportation service providers (carriers) dominate outsourced service interactions (Acocella and Caplice, 2023). The TL industry is a major sector in the US, with annual revenues estimated between $153 billion (U.S. Census Bureau, 2020) and $403 billion (AT Kearney, 2021). It is highly fragmented, with hundreds of thousands of mostly small carriers (FMCSA, 2021) and is extremely competitive, with a Herfindahl–Hirschman Index three orders of magnitude below the official definition of an unconcentrated market (Caplice, 2021). Incomplete and relational contracts are the norm (Acocella and Caplice, 2023; Caplice, 2007) and the legal costs to punish for contract defection for either side are prohibitively high (Scott et al., 2020). Suppliers place a high value on future business because of strong economies of scope (Caplice, 2007)—that is, the per unit cost to serve customers decreases as suppliers build transportation networks based on—often different—buyers’ interconnected business needs (i.e., lanes or origin–destination pairs).
We address our research question with a large transactional dataset from major transportation buyers in the US TL sector over five years. The dataset contains the TL shipment (load) offers from each buyer to the contracted supplier. It denotes the supplier’s decision whether to accept or reject the business (i.e., to ship the load). The dataset contains hundreds of contracted suppliers across buyers’ networks of TL lanes. It includes the price of each contracted load and information about the supplier and the market. We also observe loads that exchange on the spot market—an open marketplace where supply and demand are immediately matched at a one-off transactional price. The spot market represents suppliers’ outside option to the contract. With this dataset, we model suppliers’ decisions to accept business offerings.
We find that supplier service type indeed moderates the effects of operational factors on performance. Due to the pooling of capacity, third-party brokers are better able to handle operationally difficult demand than asset-based providers. However, we do not find evidence that service type impacts relational factors; both supplier types place a similarly high value on long-term relationships. However, we do find that market condition impacts relational factors: during a tightly constrained market when the outside financial option is high, suppliers are pulled from customers with which they have long-term relationships. In other words, market forces dominate the effect of long-term partnerships. We also find evidence that during these tightly constrained markets, short-term demand surges lead to a higher likelihood that the supplier will renege on the contractual relationship.
We make three contributions to this research and organize them based on the framework of Makadok et al. (2018). First, relating to the mode of theorizing, we add to the scarce set of numerical and empirical (rather than analytical) studies on relational contracts. Such empirical studies are limited, as detailed transaction data of specific buyer–supplier pairs over time are difficult to obtain (Macchiavello and Morjaria, 2022), do not explicitly state a contract is in place (Gil and Zanarone, 2017), or do not directly observe supplier defection or business rejections (Macchiavello and Morjaria, 2015). Our dataset overcomes each of these challenges.
Second, we contribute using Makadok et al.’s (2018) constructs lever by exploring moderating effects. While the direct impact of operational and relational aspects of the buyer–supplier relationship has been found to impact supplier performance (Fynes et al., 2005; Min et al., 2005), we address how they may be moderated by the supplier’s business model and market conditions. For example, in a study closely related to ours, Scott et al. (2017) empirically consider the TL buyer–supplier relationship at the buyer–supplier dyad level. The authors show the direct effect of operational and relational factors on supplier performance. We build on this study by demonstrating moderating effects on these factors. In another related study, Scott et al. (2020) consider a moderating effect of market conditions on suppliers’ choice of contract type—but not on performance, as we do. We generalize our findings and add to the broader buyer–supplier relationship literature by addressing the dearth of studies that consider how the supplier and market impact or moderate the relationship (Terpend et al., 2008).
Our third contribution relates to Makadok et al.’s (2018) phenomenon lever by offering insights specific to the freight transportation literature. Operational outcomes are not often included in strategic freight procurement decisions (Acocella and Caplice, 2023). Much of the existing transportation buyer–supplier relationship research emerged in the 1980s and 1990s as the industry adjusted postderegulation and considered the shift toward contractual relationships (Crum and Allen, 1991; Maltz, 1993). However, more nuanced exploration is lacking. While there is increased interest in utilizing empirical data to inform strategic decisions, this area is still relatively limited. As such, we add to this growing body of research.
The remainder of this study is organized as follows. We discuss the relevant literature in Section 2. We formulate our modeling framework and hypotheses in Section 3 and our empirical methodology in Section 4. The results of our model and the impact of each hypothesized moderating factor are discussed in Section 5. We discuss the contributions of our findings and their implications in Section 6 and conclude with the limitations of this research and future directions in Section 7.
Research Context
In this section, we describe the background on relational contracts and specifics of the TL industry in the US that lay the groundwork for the remainder of this study.
Relational Contracts
The presence and performance of relational contracts have often been explored in settings of weak contract enforcement. For example, they have been studied in developing economies (Macchiavello and Morjaria, 2022) where legal institutions are fragile or inaccessible (Greif, 1993; Shou et al., 2016). However, they also arise in settings where the cost of adjudication is prohibitively high relative to the business transaction (Gil and Zanarone, 2017). In these settings, strong relationships are expected to improve performance outcomes (Day, 2000; Krause et al., 2007). The value that each party places on the relationship can influence their likelihood to renege (Macchiavello and Morjaria, 2015). Value is placed on potential future business that may arise, known as the shadow of the future (Heide and Miner, 1992; Lumineau and Oxley, 2012), which is weighed against the parties’ temptation to deviate from the relationship (Macchiavello and Morjaria, 2015). A supplier’s temptation to deviate increases with the value it can realize from an alternative, outside option (Baker et al., 2002). The contractual relationship continues so long as the value placed on future business is at least as great as the temptation to deviate. Macchiavello and Morjaria (2015) formalize this trade-off as a dynamic incentive compatibility constraint.
There are several reasons for a supplier to renege on a relational contract. For example, strategic default comes about when one party can maintain its contractual agreements but chooses to work with an outside party, typically for financial benefit. Blouin and Macchiavello (2019) describe strategic default as a form of ex post moral hazard in which the supplier observes its market choices and then “decides whether to honor the sale contract and sell to the buyer or whether to search for an alternative buyer and attempt to default” (Blouin and Macchiavello, 2019, 911). Alternatively, operational reasons for defection may be due to unanticipated demand surges or capacity constraints, for example, leading one party or the other to be unable to uphold its commitments (Carson et al., 2006). A provider may simply not have capacity available in time if there is a short lead time or if demand exceeds expected contractual volumes. Uncertainty within the relationship leads to a higher likelihood of parties reneging (Walker and Weber, 1984; Williamson, 1985).
Operational factors such as demand patterns (Rinehart et al., 2004) and relational factors such as the business relationship length (Carr and Pearson, 1999; Krause et al., 2007) influence the value placed on the relationship and relationship quality (Leuschner et al., 2013; Qian et al., 2021). We extend the existing work by demonstrating how these factors may be moderated by supplier type (Villena and Craighead, 2017) and market conditions (Macchiavello and Morjaria, 2021).
Transportation Industry Background
The relational contract in the TL industry results from both supply and demand uncertainty. When buyers establish transportation contracts, 1 the expected amount of business over the contract period (typically one year) is communicated by the buyer and planned for by the supplier (Caplice, 2007; Miller et al., 2020). But these business volumes are not compulsory commitments (Scott, 2015) because TL buyers’ own customer orders cannot be precisely forecasted so far in advance. As a result, TL contracts do not apply to individual transactions but rather to a “series of shipments” over a period of time (US House of Representatives, 1993).
At the same time, the supplier cannot guarantee that capacity will be available when and where it is needed. Its equipment may be full or may be available but too costly to reposition in time. Alternatively, the carrier may choose to allocate available capacity to higher-priced options (i.e., strategic default). Industry norms have been established to monitor and manage contracted supplier acceptance rates (the percentage of business offered to the supplier that it accepts and serves) as a performance metric (C.H. Robinson, 2015; Uber Freight, 2019). As such, TL contracts are fixed in price but nonbinding in the amount of business the buyer offers the supplier and in the amount of offered business the supplier accepts (Scott et al., 2017). 2
As an alternative to the contract interaction, an active spot market is available for buyers (Miller et al., 2020). The transportation spot market is an open marketplace where capacity is auctioned for immediate service at a one-off transactional rate for that shipment. Buyers typically—but not always—use the spot market as a backup option when a contracted supplier rejects a load. Suppliers typically communicate their available capacity and current locations on load boards, which can be physical (e.g., at truck stops) or digitally provided platforms. Historically, buyers want to avoid heavy reliance on the spot market; prices tend to be highly volatile and represent the dynamic nature of the immediate balance between trucking supply and demand. Spot market prices may cost the buyer up to double the contract price in a highly constrained or tight market (Scott, 2015), but they can also fall far below contract rates in an oversupplied or soft market.
Supplier Business Model: Asset-Based Providers Versus Third-Party Brokers
TL services are performed by two primary supplier types: asset-based providers (typically called carriers) and third-party brokers. Asset-based providers either own the tractors and trailers they use to move freight and employ drivers (Baker and Hubbard, 2003) or subcontract to smaller, independent owner-operators. As a result, asset-based providers cannot easily scale up capacity to serve irregular demand surges. They make a profit by ensuring contract prices for the freight they accept are higher than their fixed and operational costs to serve that business.
Third-party brokers connect the buyer and ultimate supplier. They exist in many industries’ supply chains such as manufacturing (Mutha et al., 2019), agricultural equipment (Brennan et al., 2022), and financial services (Hatzakis et al., 2010). In these cases, the relationship is between the buyer and the third-party broker rather than directly between the buyer and asset-based supplier (Choi and Wu, 2009).
In the TL setting, third-party brokers do not own the transport equipment. 3 They remove buyers’ burden of securing capacity (La Londe and Cooper, 1989; Lindsey et al., 2013) by accessing a large pool of typically smaller, asset-based providers, aggregating their capacity and matching it to buyers’ demand. Thus, third-party brokers can more quickly expand capacity availability to serve unexpected demand than asset-based providers. Third-party brokers buy and sell transportation based on their expectations of spot market prices (Sheffi, 1990) so their profit margins are tied to how well they can manage market dynamics (Acocella et al., 2020; Scott, 2019). As a result, asset-based providers and third-party brokers have different operations and internal cost structures, which drive distinct relationships with buyers (Lindsey and Mahmassani, 2015; Scott, 2018).
Transportation Market Condition
Freight markets fluctuate between periods of oversupply and undersupply—referred to as soft and tight markets, respectively (Acocella et al., 2020; C.H. Robinson, 2017; Pickett, 2018). These market cycles follow national macroeconomic trends impacted by consumer patterns across industries (e.g., construction, retail, and food and beverage). During soft markets, demand falls below suppliers’ available capacity, contract prices are typically higher than spot market prices, and the financial incentive for the supplier to stick with the contract is strong. However, during tight market periods, suppliers typically have a more attractive outside spot option; demand rises relative to available supply, pushing prices upward (Coyote Logistics, 2023). As a result, there is a greater temptation for suppliers to deviate from the contract.
The impact of market dynamics on suppliers’ freight acceptance decisions is studied in Scott et al. (2017) and Acocella et al. (2020). Both sets of authors find that a main contributor to contracted suppliers’ tight market acceptance decision is how competitive the buyers’ contract price is with prevailing market prices. We build on this research to develop our hypotheses and empirical models.
Model of the Value of Future Business and Hypotheses
We formalize our discussion of suppliers’ value of their relationship with buyers under a relational contract framework where potential future business acts as a deterrent from subpar supplier performance (the shadow of the future) (Heide and Miner, 1992; Lumineau and Oxley, 2012). The dynamic incentive compatibility constraint suggests that the relational contract will continue so long as the value of the continued relationship is at least as great as the temptation to deviate from the contract (Macchiavello and Morjaria, 2015).
Applying this to the TL context, which exemplifies extralegal exchanges (Scott et al., 2020), parties rely on nonlegal mechanisms to enforce contractual agreements (Bernstein, 1992). How suppliers weigh their value of future business against the temptation to deviate can be measured by their likelihood of accepting contracted business from the buyer—that is, the supplier’s acceptance rate (Scott et al., 2017). Buyers and suppliers rely on demonstrated performance, previous interactions, and long-term relationships to inform them of the others’ future likelihood of maintaining contract expectations (Masten, 2010; Scott, 2015).
Operational factors such as demand variability (Fynes et al., 2005) and relational factors such as relationship duration (Min et al., 2005) impact suppliers’ performance. For example, in the TL setting, higher demand variability leads to lower freight acceptance rates (Acocella et al., 2020; Scott et al., 2017). Longer, closer relationships lead to higher value placed on future business and can lead to a higher freight acceptance rate (Scott et al., 2020).
We theorize on how characteristics of the supplier and market influence operational and relational factors and impact supplier performance. We build on Scott et al. (2017), which demonstrates that consistent demand patterns (operational factor) and long-term relationships (relational factor) correlate to a better freight acceptance rate (supplier performance). Adding to this, we measure the moderating effects of supplier business type and market conditions on these direct relationships. We outline our hypotheses in the following subsections, summarized by the theoretical model depicted in Figure 1.
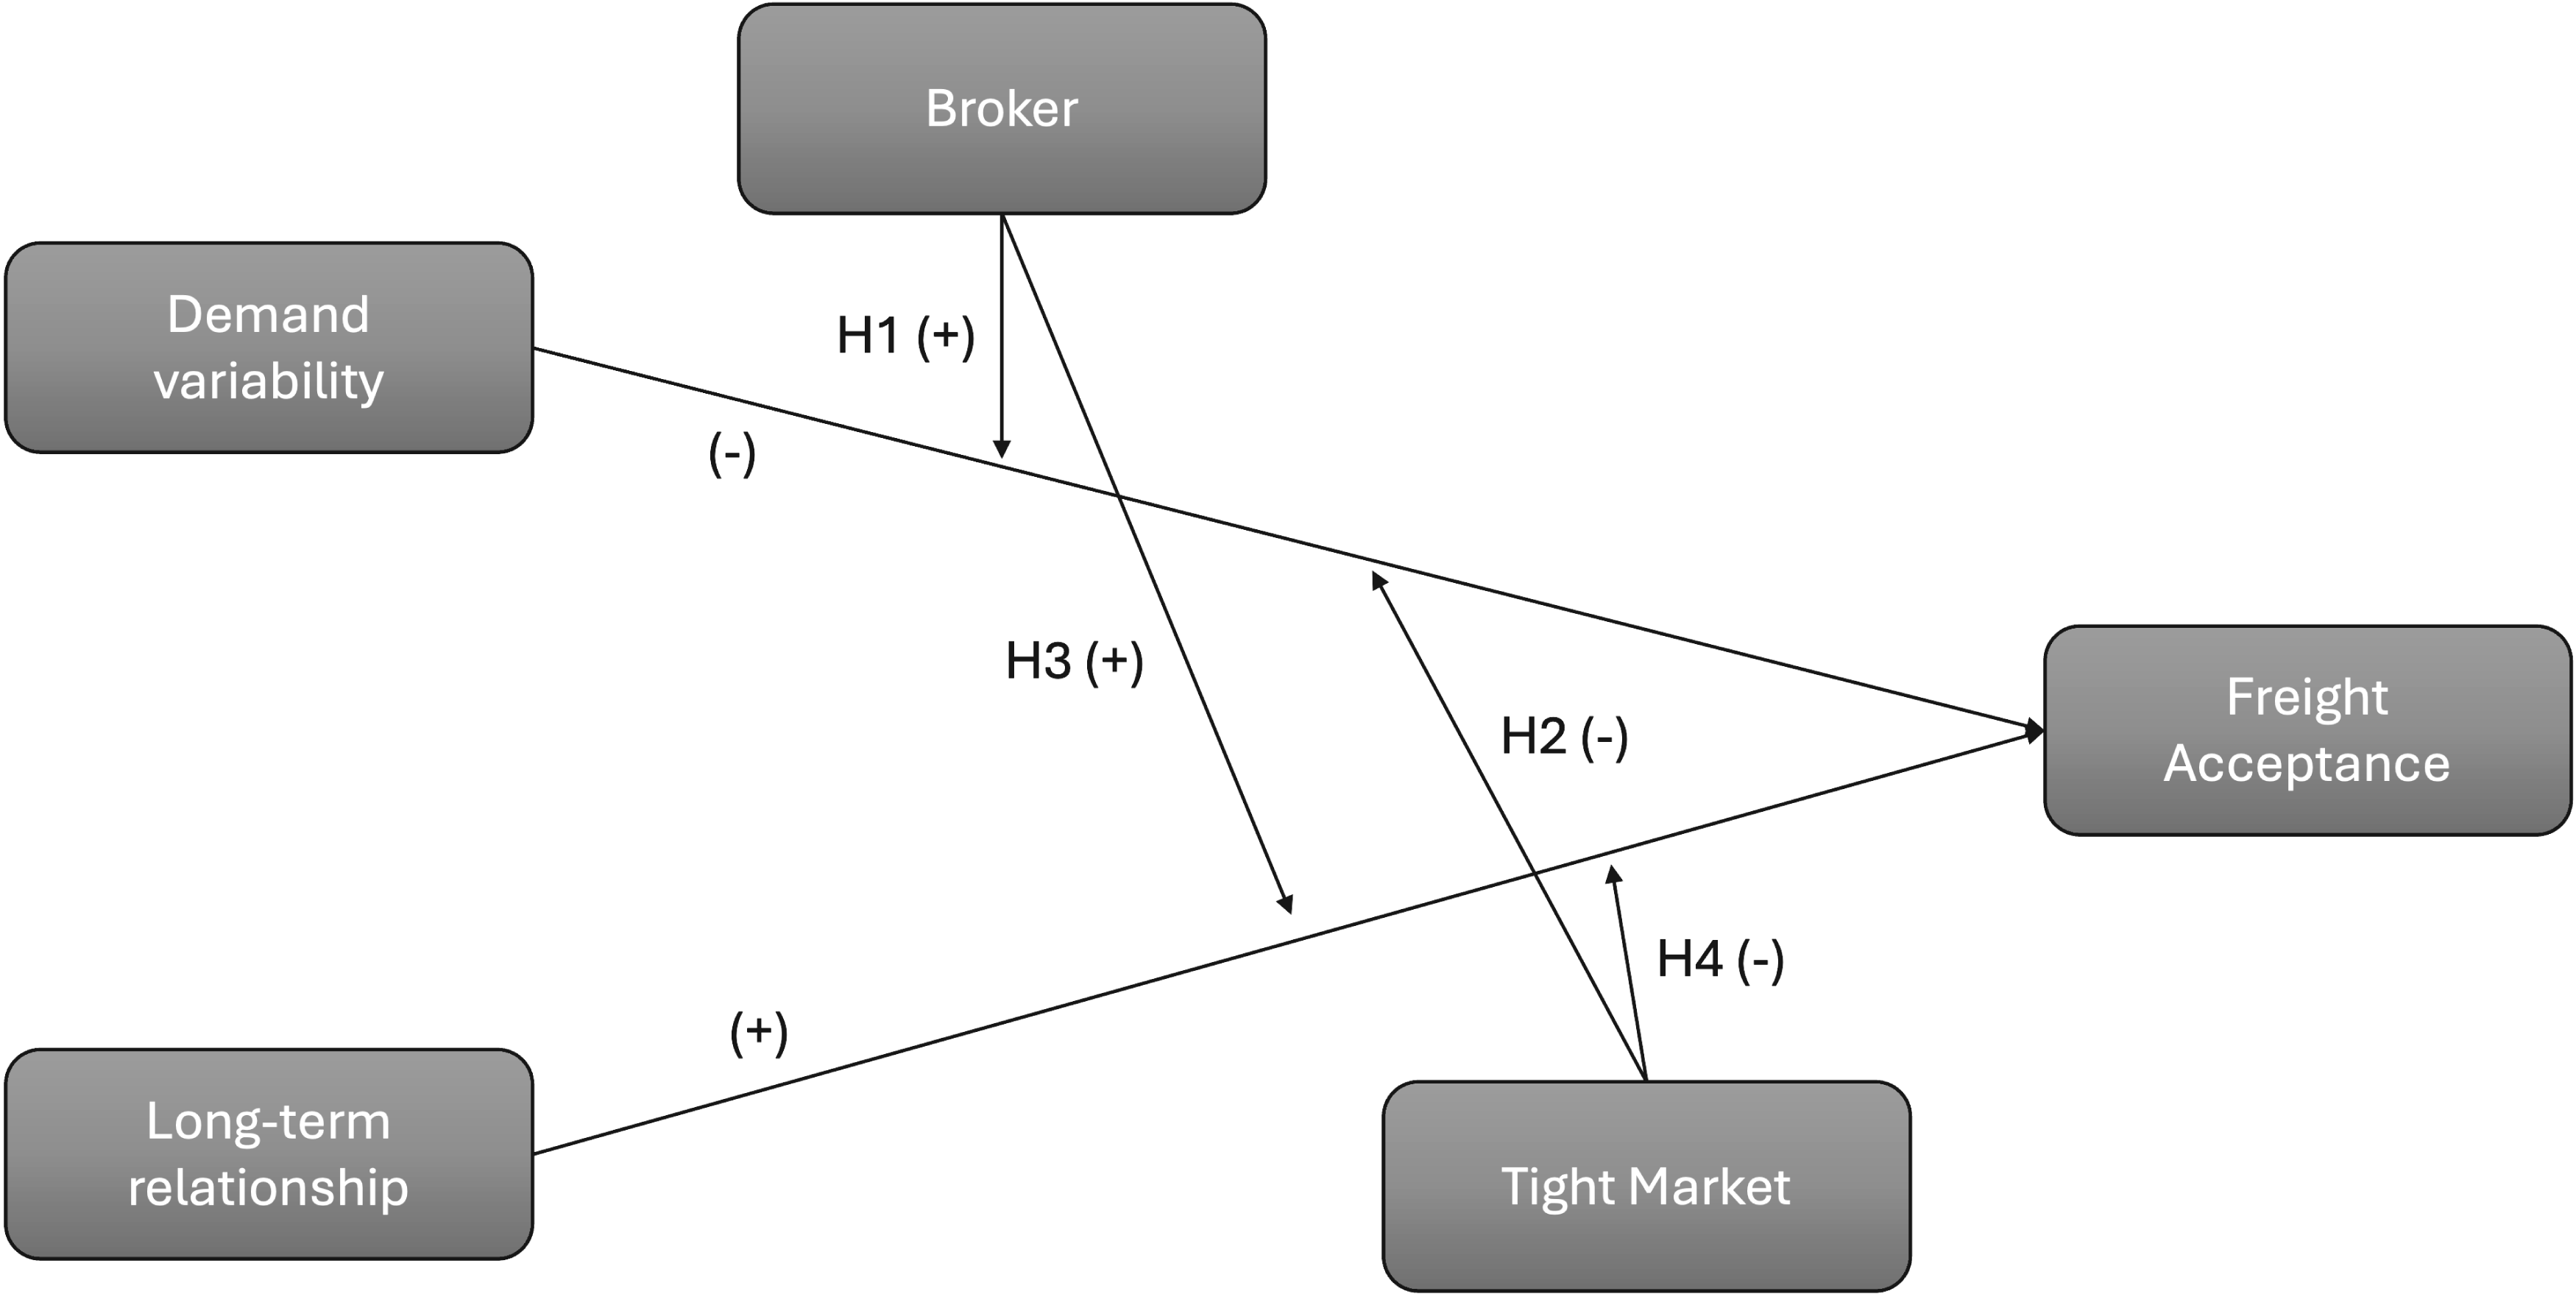
Theoretical model.
We measure operational factors in terms of demand patterns. Historical interactions over time impact the dynamic buyer–supplier relationship (Autry and Golicic, 2010). In particular, demand patterns affect a provider’s operational costs and ease of doing business with a customer. While the total number of interactions may indicate a strong buyer–supplier relationship (Dwyer et al., 1987; Heide and Miner, 1992) because fulfilling past business implies the supplier will also fulfill future business (Brown and Serra-Garcia, 2017), high volume can also lead to reduced performance if capacity is fixed; the TL setting is governed by economies of scope rather than scale (Caplice, 2007). Suppliers place a high value on relationships with predictable demand (Carson et al., 2006; Scott et al., 2017). Variability in demand can take different forms, such as week-to-week shipment volume fluctuations or large, unexpected surges. Suppliers are less likely to accept business with highly variable demand patterns as well as with short-term surge spikes (Acocella et al., 2020; Scott et al., 2017). We explore how this relationship is moderated by supplier type and market condition.
Asset-based providers and third-party brokers may respond to this variability differently. Asset-based providers have a fixed capacity fleet and are therefore sensitive to demand variability that can create network imbalances. Such demand is more difficult for asset-based providers because they are subject to strong economies of scope (Caplice, 2007) rather than economies of scale, which have been shown to be constant in the TL sector (Miller and Muir, 2020; Muir et al., 2019). That is, asset-based providers require consistent and reliable demand to create a balanced transport network across hundreds of customers and thousands of lanes (Acocella et al., 2020; C.H. Robinson, 2013).
Third-party brokers aggregate capacity from many suppliers. This pooling effect allows them to adapt and cover uncertain demand more readily. They are not as constrained by the need to create balanced networks in the same way as asset-based providers. In the setting of local deliveries for example, Castillo et al. (2018) find that a crowdsourcing platform—a third-party capacity aggregator similar to the third-party broker in our TL context—is better suited to find capacity for unexpected demand than the asset-based provider. This leads to our first hypothesis:
H1: Compared to asset-based providers, third-party brokers positively moderate the relationship between demand variability and freight acceptance.
In tightly constrained and uncertain market environments, buyer–supplier quality and performance degrade (Srinivasan et al., 2011). Variable demand may be experienced by suppliers differently during capacity-constrained, or tight market conditions as compared to loose, or soft markets. Tight market conditions exacerbate challenges that arise with variable demand. During tight markets, demand surpasses supply. Suppliers effectively face random demand and sometimes short lead times from buyers (Berbeglia et al., 2010; Powell et al., 1988) and they do not have enough capacity when and where it is needed. Because consistent demand is more easily planned for, suppliers can anticipate and more effectively serve this steady business (Carson et al., 2006). Thus, in tight markets, suppliers deprioritize the business that is operationally more difficult to serve.
One mechanism by which this may occur is a financial motivation to deviate. When market conditions tighten and a supplier’s outside spot price increases relative to the contract price, there is a greater incentive to choose the higher priced option (Blouin and Macchiavello, 2019), perhaps acting opportunistically (Scott et al., 2020). Suppliers may be more likely to be profit-chasing due to low-profit margins and seek higher-priced alternatives, thus rejecting business tenders more frequently for less desirable businesses (i.e., variable demand). This leads to our second hypothesis:
H2: Compared to soft market conditions, tight markets lead to a more negative relationship between demand variability and freight acceptance.
Relational Factors and Supplier Performance
In addition to the operational factors that may influence supplier performance, we consider relational factors. For example, frequent interactions (Cousins and Menguc, 2006; Heide and Miner, 1992) and the length of the ongoing business relationship (Carr and Pearson, 1999; Krause et al., 2007) can lead to better performance (Fynes et al., 2008; Min et al., 2005). Long-term historical relationships can indicate a commitment to continued future business (Barry and Terry, 2008), which can lead to suppliers placing a higher value on the relationship and prioritizing the buyer’s business (Macchiavello and Morjaria, 2015). Thus, long-term relationships often lead to better supplier performance. As above, we study how supplier type and market condition moderate this relationship.
Third-party brokers match buyers’ needs with providers’ available services by pooling capacity. They create value by acquiring knowledge of each party’s business needs (e.g., network and shipment characteristics) over time, bridging information asymmetries between parties (Marsden and Lin, 1982; Burt et al., 2002). When there is uncertainty in suppliers’ performance quality and sellers’ needs, third-party brokers possess private information gathered through their long-term relationships (Uzzi and Lancaster, 2003). This private information is how third-party brokers differentiate themselves (Bidwell and Fernandez-Mateo, 2010).
While asset-based providers also gain information about buyers’ needs through long-term relationships, they are network- and capacity-constrained. Without access to the pool of diverse and available capacity that third-party brokers have, asset-based providers cannot use the knowledge obtained through the long-term relationship to the same extent that third-party brokers can (Lindsey and Mahmassani, 2017). As a result, third-party brokers can create appropriate matches that lead to better performance (Bidwell and Fernandez-Mateo, 2010) (i.e., higher freight acceptance rates) than asset-based providers. This leads to our third hypothesis:
H3: Compared to asset-based providers, third-party brokers lead to a more positive relationship between long-term relationships and freight acceptance.
The performance benefits from a long-term relationship may fluctuate following cyclical market conditions (Autry and Golicic, 2010). Supplier performance declines during tight market conditions (Acocella et al., 2020). In part, this is because suppliers’ temptation to deviate is greater during market periods when their outside option is higher (Baker et al., 2002; Macchiavello and Morjaria, 2021). Moreover, on average, the supply of capacity is below demand—suppliers do not have the equipment available and cannot accept all the business offered to them (Scott et al., 2017).
While suppliers do not want to risk potential future business from buyers by offering poor performance and reliability (Heide and Miner, 1992; Lumineau and Oxley, 2012), they become less concerned with maintaining performance as the length of the relationship (LOR) increases, particularly when the economic environment is constrained (Blouin and Macchiavello, 2019; Macchiavello and Morjaria, 2015). This is because the supplier has already established itself as a reliable partner. Therefore, they believe that a performance reduction due to market constraints would not risk future business potential (Macchiavello and Morjaria, 2015). This suggests that long-term suppliers’ behavior differs during constrained markets as compared to soft markets. Therefore, market forces may have a greater influence on performance than does the benefit of a long relationship. This leads to our fourth hypothesis:
H4: Compared to soft market conditions, tight markets negatively moderate the relationship between long-term relationships and freight acceptance.
Empirical Methodology: Data and Variable Definitions
We approach our hypotheses using a uniquely detailed transactional dataset. Our partner company, TMC, a division of C.H. Robinson, offers managed transportation services to customers (shippers) and provides us with transaction data from 2015 to 2019 of all of the long-haul loads (i.e., those that move a distance greater than 250 miles) for 68 buyers of various sizes and industries and their 395 contracted suppliers, both asset-based providers and third-party brokers. 4 The data provide operational information of each load’s tender sequence; that is, the date, time, and price at which each load is offered to the contracted supplier, that supplier’s accept or reject decision, and, if needed, backup suppliers’ accept or reject decisions. The data include the price at which the load is ultimately accepted along with an indication if it is moved on the spot market or by contract.
The dataset contains 1.7 million loads before cleaning and 318,466 after cleaning, 5 all of which originate and terminate in the continental US. From the subset of tenders to contracted suppliers, we model the probability of the binary outcome of whether a load is either accepted or rejected by the contracted supplier as a function of operational and relational factors that influence this decision as well as how the supplier type or market condition moderate the direct relationships. We control for load, lane, buyer, and supplier characteristics described in the following subsections. Our unit of analysis is at the load level.
Moderating Variables
We hypothesize on the moderating effects of two factors: asset-based provider versus third-party broker, and tightly constrained versus soft capacity markets. The first factor relates to the supplier’s business model. Asset-based providers and third-party brokers each provide different services, have distinct cost structures, and as a result, interact with their buyers in unique ways. We observe an indicator in our dataset for each supplier, which identifies if it is a third-party broker or asset-based provider.
Our second hypothesized moderating effect relates to the market conditions: whether it is soft, when supply exceeds demand, or tight, when demand exceeds supply. Our dataset spans two distinct market conditions: a soft market observed from the first week of February 2016 to the first week of July 2017 and again after the second week of January 2019 until the end of the time frame covered by the dataset; and a tight market observed before the first week of February 2016 and from the first week of July 2017 to the second week of January 2019. Acocella et al. (2020) justify these market periods by identifying the weeks in which a statistically significant change is observed in the underlying structure of the TL freight market. In addition, these dates are corroborated by additional market indices (e.g., Cass Truckload Linehaul Index [Cass Information Systems, 2024], American Trucking Association’s Truck Tonnage Index [U.S. Bureau of Transportation Statistics, 2024], and the Coyote Curve, which represents the relative contract and spot prices over time [Pickett, 2019]).
Operational and Relational Factors
Our operational factor, demand variability, has been shown to impact suppliers’ ability and willingness to accept load offers (Scott et al., 2017). In relational contracting, historical demand variability introduces uncertainty that can harm the relationship (Carson et al., 2006). In the TL setting, historically consistent demand allows suppliers to better anticipate capacity needs (C.H. Robinson, 2013; J.B. Hunt, 2015), reduce the cost to serve, better utilize their equipment and drivers, and, ultimately, improve tender acceptance rates (Acocella et al., 2020; Scott et al., 2017).
We measure historical demand variability based on the recent lane-level patterns from the buyer to the contracted supplier. Specifically, we calculate the historical demand variability, coefficient of variation (CV), as the shifted 4-week rolling CV of the volume offered by the buyer to the supplier on each lane. CV is an appropriate measure of demand variability, which has been shown to create difficulties for suppliers to serve buyers (Abolghasemi et al., 2020; Balakrishnan et al., 2004). We consider only weeks in which business is offered to the supplier. In this way, we measure the variability of the materialized volume rather than conflating it with demand (in)frequency. We demonstrate the robustness of this operationalization in Section 5.3.
Our relational factor, LOR, has also been shown to impact relational contract performance (Carr and Pearson, 1999; Krause et al., 2007) and, in the TL setting, suppliers’ ability and willingness to accept load offers (Acocella et al., 2020; Scott et al., 2017). We hypothesize that the LOR between buyer and supplier may impact the supplier’s performance—namely how the supplier prioritizes the business for that buyer. Long-term relationships may contribute to mutual trust and understanding as they allow both parties to become familiar with each other’s expectations, communication preferences, and facilities (Richardson, 1993; Banerjee and Duflo, 2000). This familiarity leads to a more efficient and effective partnership, as both sides can anticipate and address potential issues before they escalate. With time, the supplier can better anticipate and plan for operational issues that may come up for that buyer. In other words, the supplier can learn how to better serve the buyer.
In the TL context, long-term TL buyer–supplier relationships reduce suppliers’ opportunistic behavior to maintain a relationship (Douglas, 2006) and improve overall performance, specifically carrier acceptance rates (Zsidisin et al., 2007). This direct effect has more recently been demonstrated by Scott et al. (2017). Building from this work, we measure the (log) LOR between the buyer and supplier as the number of days since the first contracted shipment we observe in our dataset. 6
Supplier’s Outside Option: Spot Rate Differential
To represent the supplier’s best-known alternative to the contract price at the time of the load tender, we construct the spot rate differential (SRD). It is calculated as the difference between the current lane-specific spot price and the load contract price, as a percentage of the contract price:

The SRD calculation requires knowledge of each lane’s spot price at the time a load is offered. While we do not observe such data consistently across all lanes and time, given the breadth of our dataset, we can calculate benchmark spot market prices. Our dataset approximates the market dynamics as it comprises many buyers’ load tenders across the continental US. We corroborate this claim by comparing two statistics from our dataset to external industry data. First, we measure the correlation between the time series of average contracted supplier acceptance rate in our dataset (a real-time supplier behavior) and the Morgan Stanley Freight Index, which represents overall practitioner sentiment of the market’s supply and demand. The correlation between the two time series is 85.2% (Scott et al. (2017) use a similar justification process). Second, the correlation between our national average contract price and that of the Producer Price Index for Long Distance TL Transportation by the Bureau of Labor Statistics is 89.0%.
Daganzo (2005) shows that point-to-point (linehaul) transportation costs result from a combination of fixed and variable costs. Based on this, we reconstruct spot prices for each origin region to destination region modeled using multiple linear regression with heteroskedastic robust standard errors. We regress the point-to-point linehaul price of loads that are moved on the spot market in our dataset on origin and destination region binary variables.
7
These represent fixed costs. We include a set of time binary variables and a continuous distance variable, which represents the suppliers’ variable costs (Ballou, 1991). A similar benchmarking methodology is used by Acocella et al. (2020); Scott (2015); Scott et al. (2017). The lane-specific spot price for a given time,

We observe all tendered TL loads of our sample buyers (shippers) and each contracted supplier’s (carrier’s) accept/reject decisions. The dependent variable,
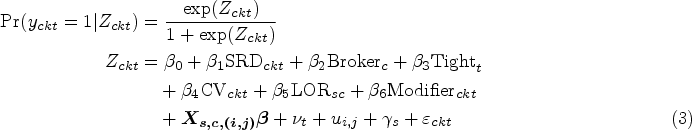
However, we observe the same set of suppliers making repeated decisions across the same set of lanes for the same set of buyers throughout the date range. As a result, we must explore whether the variations we observe result from time-variant fixed effects, time-invariant random effects, or both (Bell and Jones, 2015). We find that the time-varying, within-group (lane and shipper) effects outweigh those of the time-invariant random effects and that within-group (supplier) correlations are insignificant. As such, we adopt a fixed-effects logistic model as follows:
The matrix of variables,
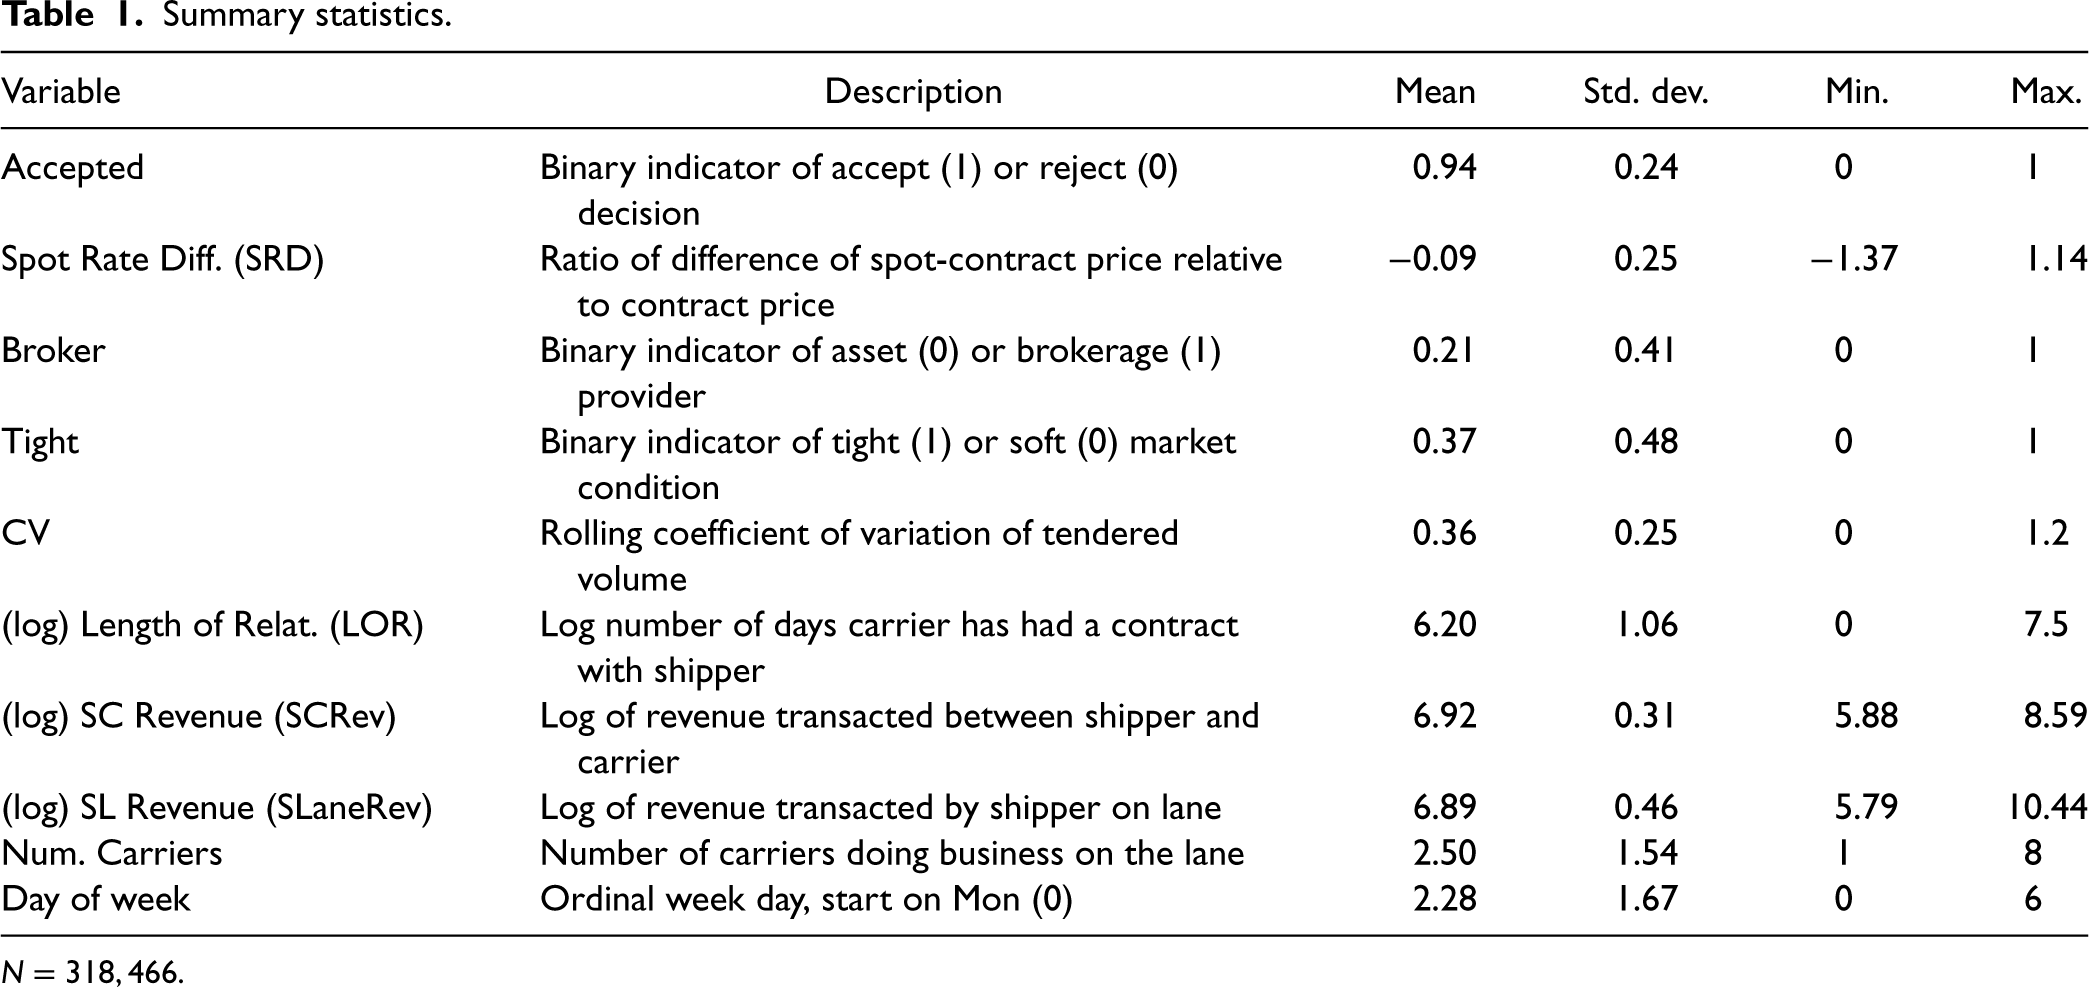
Summary statistics.
Our panel dataset introduces a set of empirical challenges we must overcome. First, we have repeated measures—our measured outcome variable (load acceptance) is measured for the same individual supplier at multiple points in time, on different lanes, and for different buyers. This violates the assumption of independence of residuals (Certo and Semadeni, 2006; McNeish and Kelley, 2019). Our empirical context guides our choice of how to overcome this. We are interested in population rather than individual-specific effects (Ballinger, 2004). In such cases, a detailed consideration of the covariance structure may not be necessary; demonstrating the robustness of the results is sufficient (Gardiner et al., 2009). In our models, standard errors are clustered by a supplier to allow for such correlations. We discuss our robustness approach in Section 5.3.
Second, nested datasets such as ours are hierarchical in nature. Our unit of analysis, loads, can be grouped into lanes. This suggests there are two types of variances: differences between lane groups and differences within a lane group. High between-group variance suggests that each group differs from one another to a large degree regarding a given variable. High within-group variance indicates that the variable differs for the group over time (Certo et al., 2017).
We measure attributes at individual (Level 1) load metrics aggregated to grouped (Level 2) lane levels. To explore the possibility that variance should be partitioned across one or both of these levels, we measure the intraclass correlation coefficients (ICCs), which express the relative fraction of the variance that can be attributed to between-group effects relative to total variance (Certo et al., 2017). We find low ICC values for both operational and relational variables at Level 2 lane clustering (all
While we do not make formal hypotheses regarding the following variables, we do control for their effects in each model. They follow previous studies that have considered the load acceptance decision (e.g., Acocella et al., 2020; Scott et al., 2017) as control variables and fixed effects. To control for the relative size of the relationship between the buyer and supplier, we include a measurement of the (log) revenue transacted between the buyer and the supplier. Similarly, to control for the importance of the lane itself to the buyer’s business, we control for the (log) spend the buyer attributes to the lane. And to control for the relative attractiveness of the lane in the market, we control for the number of suppliers that do business on the lane.
Next, we consider fixed effects. First, day-of-week fixed effects may impact drivers’ willingness to accept loads. Drivers may have a tendency to drive during the week and get home on weekends. Thus, there may be an end-of-week or weekend effect, for example. As discussed earlier, we include lane-fixed effects due to the nested nature of our panel dataset. Indicators for the lane’s origin and destination regions are included to account for their relative attractiveness. As discussed in Section 4.3 and by Acocella et al. (2020) and Scott et al. (2017), supplier acceptance is expected to vary across different inbound or outbound regions due to the business opportunities present in those regions. We include in our supplier acceptance model a binary variable for each of the 15 regions of the US defined by general market demand patterns of our transportation management partner company. We chose the California region as our origin region indicator and the Ohio River region indicator as our destination to omit in the regression model, which are the regions that represent the average amount of outbound and inbound volume. Finally, due to the repeated observations of the same set of buyers tendering shipments across different lanes to different suppliers, we include shipper-fixed effects. The model variables are summarized in Table 1 and their correlation matrix is demonstrated in Table 2.
Correlation matrix.
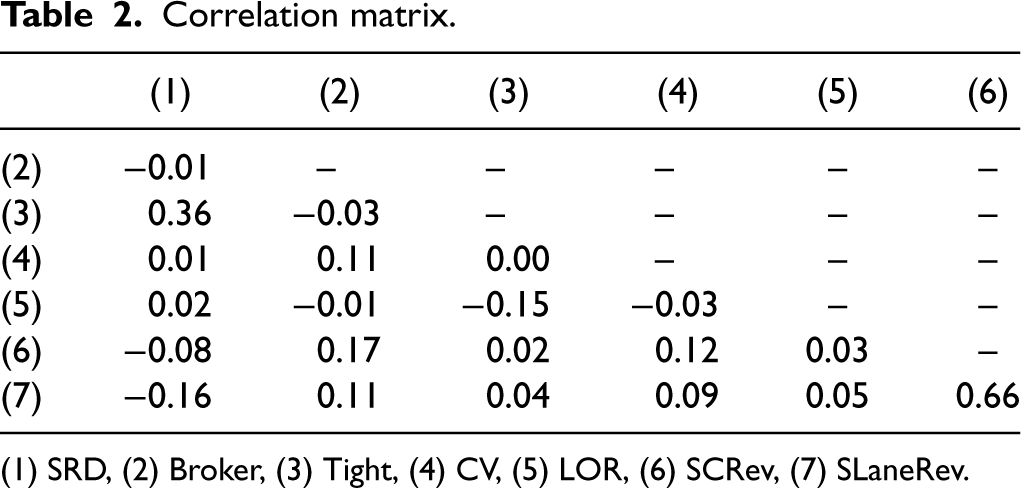
(1) SRD, (2) Broker, (3) Tight, (4) CV, (5) LOR, (6) SCRev, (7) SLaneRev.
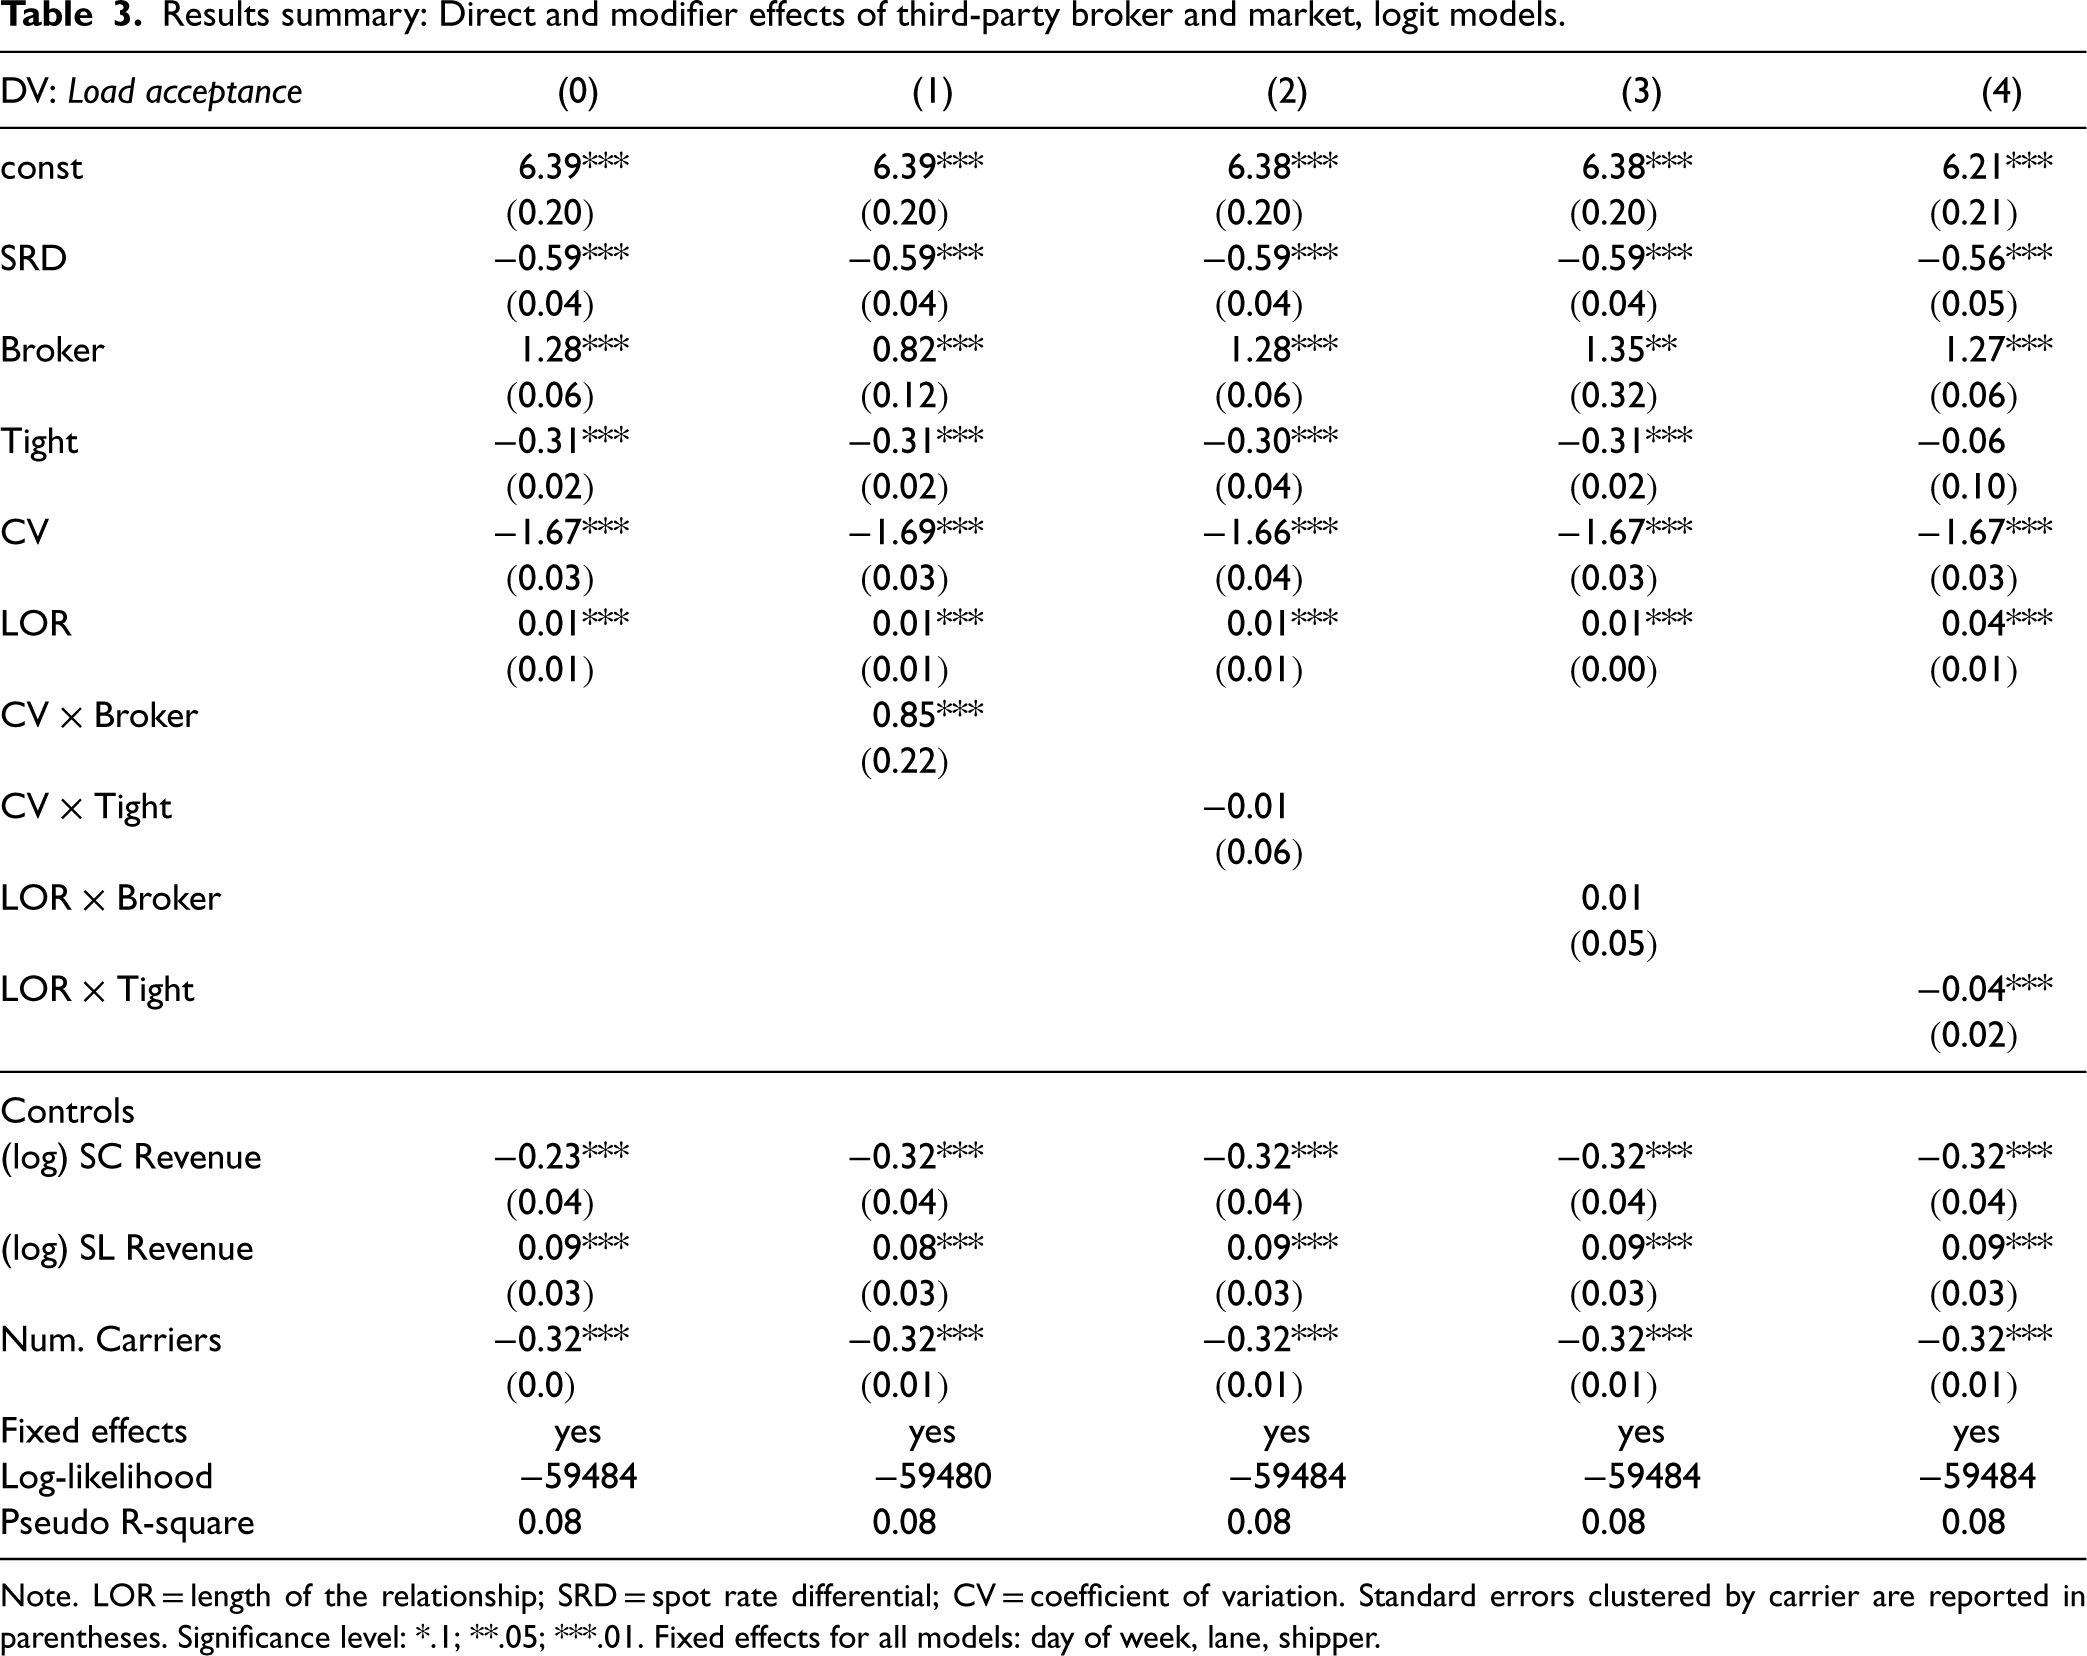
In this section, we summarize our results by discussing the fixed effects logistic regression models for each hypothesis. The results are tabulated in Table 3. We highlight the direct relationship results in column (0) of Table 3, which validate our base model, as it replicates the model and results of Scott et al. (2017) with one exception; since the authors do not explore the effects of supplier business model on acceptance decisions, they do not include the Broker variable in their model as we do. All else equal, third-party brokers are more likely to accept loads than their asset-based counterparts. This is due to their access to a large base of capacity. Similarly, as expected, loads are less likely to be accepted during tight markets, because demand exceeds capacity and contracted suppliers are both limited in capacity and may seek higher-priced available alternatives. Thus, the results of our direct effects model support those demonstrated in the previous literature.
Results summary: Direct and modifier effects of third-party broker and market, logit models.
Results summary: Direct and modifier effects of third-party broker and market, logit models.
Note. LOR = length of the relationship; SRD = spot rate differential; CV = coefficient of variation. Standard errors clustered by carrier are reported in parentheses. Significance level: *.1; **.05; ***.01. Fixed effects for all models: day of week, lane, shipper.
Next, we explore the hypothesized moderating effects of the supplier service type and the market conditions. The moderating effect of the third-party broker business model on the operational factor, demand variability tCV, is shown in column (1) of Table 3. We find a positive, significant moderating effect of the supplier being a third-party broker (CV
We can better interpret the size of the moderating effects by exploring the odds ratios and percent change in odds of this interaction term, as described by Allison (2009). The effect of the supplier business model on demand variability shows that a shipment is
To further explore the interaction effect sizes, we apply the “pick-a-point” approach (Rogosa, 1980) to test the conditional effect of the operational and relational factors at different levels of the modifiers (i.e., third-party broker vs. asset-based provider, and tight vs. soft markets), which is commonly used to probe effect size of interactions in fixed-effects models (Bauer and Curran, 2005). We find that the difference in slope of CV for asset-based providers and third-party brokers is statistically different (
Regarding the effect of market conditions on the relationship between demand variability and supplier performance (column (2)), we do not find a statistically significant result. That is, we do not find evidence that variable demand is more or less likely to be accepted in soft or tight market conditions. Thus, we reject H2. Similarly, we do not find statistically significant effects of the third-party broker on the relational factor, LOR, as demonstrated in column (3). As a result, we reject H3. This suggests that both asset-based providers and third-party brokers place a similarly positive value on frequent interactions and long-term relationships (positive direct effects), which may indicate a higher potential for future business from the buyer. This reinforces the conclusion that brokers should not be used solely as backups to asset-based providers. We discuss this further in Section 6.
Finally, we find evidence supporting the moderating effect of market condition on the LOR (column (4)); the statistically significant coefficient supports H4. Suppliers may be pulled from contracts even with long-time customers if the temptation to deviate due to external market conditions is strong enough. In other words, while in soft markets, long-term relationships demonstrate better performance than shorter relationships, these benefits do not hold as markets tighten. In other words, both short- and long-term relationships struggle to hold contractual commitments during tight markets.
We apply the odds ratio and percent change in odds approach of Allison (2009) to demonstrate the size of the moderating effect of market conditions on the relationship between LOR and supplier performance. There is a 3.9% lower likelihood of load acceptance in tight markets as compared to soft markets, for suppliers and buyers with long-term relationships. We conclude that, while strong relationships may be important to the transportation buyer–supplier interaction, tightly constrained markets put additional pressure on suppliers to renege on the relational contract to a tangible degree.
Post-hoc Analysis: Heterogeneity of Volatility Measure
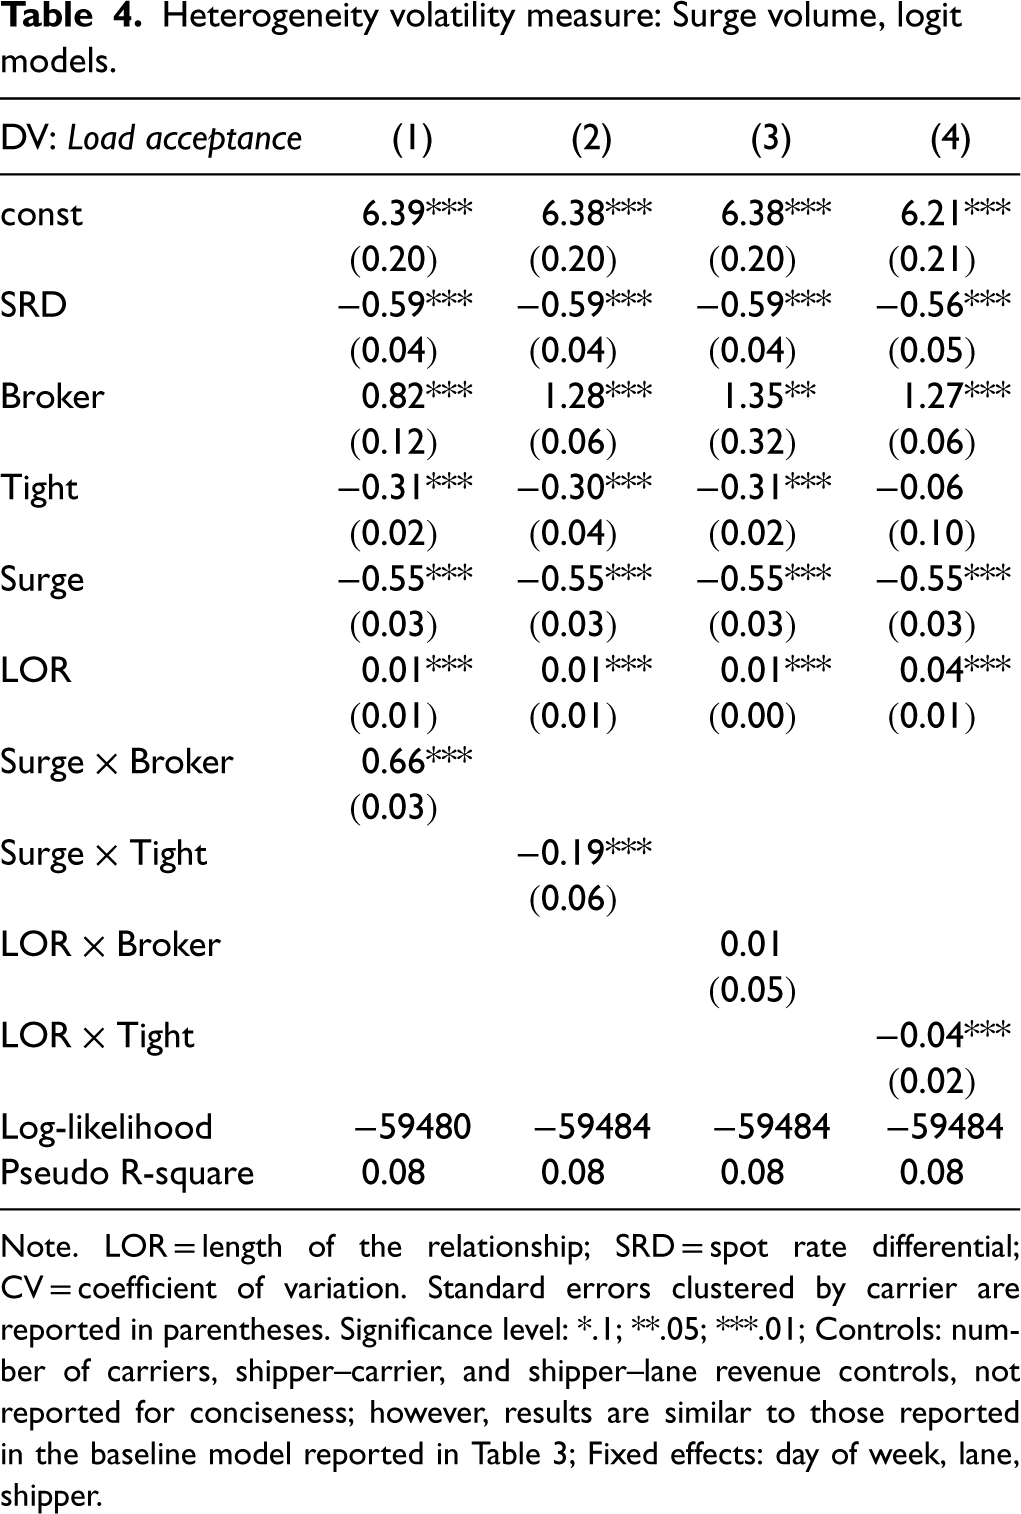
Our measure of operational factors that influence supplier behavior, CV, is a measurement of historical trends. However, suppliers may perceive—and thus respond to—short, abrupt operational challenges differently. To explore this possibility, we consider surge volume: business offered above the expected, weekly volume from the buyer on the lane. 10 Importantly, surge volume represents a defection from the relational contract expectations initiated by the buyer and we measure the supplier’s response to this behavior. Asset-based providers can typically manage surge volumes of approximately 10% (Singh, 2021). However, as volume reaches and surpasses 20% of the awarded volume, suppliers are often unable to serve the excess demand. Moreover, buyers commonly call for contracted suppliers to flex up with increased demand, often up to 20% above the awarded volume, as a stipulation of the service level expectations in the contract.
Each load in our dataset is assigned to its corresponding surge category as follows. If the load rank within the week is less than or equal to the awarded volume proxy plus 10%, the load is assigned to the Awarded category. Otherwise, the load is assigned to the Surge category. We discuss the robustness of this definition in section 5.3. The results are presented in Table 4. Columns (1), (2), (3), and (4) correspond to hypotheses H1, H2, H3, and H4, respectively.
Heterogeneity volatility measure: Surge volume, logit models.
Heterogeneity volatility measure: Surge volume, logit models.
Note. LOR = length of the relationship; SRD = spot rate differential; CV = coefficient of variation. Standard errors clustered by carrier are reported in parentheses. Significance level: *.1; **.05; ***.01; Controls: number of carriers, shipper–carrier, and shipper–lane revenue controls, not reported for conciseness; however, results are similar to those reported in the baseline model reported in Table 3; Fixed effects: day of week, lane, shipper.
We find that the results for short-term abrupt operational challenges—surge volume—during tight markets indeed differ from our results obtained for historical demand patterns: the coefficient for the interaction between Surge and Tight in column (2) of Table 4 is negative and significant. Recall that the coefficient for the interaction between CV and Tight in column (2) of Table 3 is not significant. Thus, we conclude that these short-term demand surges during tight market conditions are operationally more challenging for suppliers to accept than loads on historically volatile demand lanes during tight markets.
To demonstrate the robustness of our results, we perform a set of checks. First, we check that our choice of definitions of independent variables does not influence the results. For example, we alter our definition of demand variability in two ways. First, we use the week-to-week percent change in volume. This measure is more consistent with demand variability used in practice. The results can be found in Table EC.1 of the online appendix. Second, we consider the threshold for which we define surge volume. We test setting the threshold at 5%, 15%, 20%, and 25% as compared to 10% in our post-hoc analysis. The results in Table EC.2 of the online appendix show that the 10% threshold is appropriate.
We similarly test the robustness of our definition of the relationship factor. Rather than the LOR, we use the frequency of interactions. Higher frequency often points to a more positive relationship, whereas infrequent demand patterns can be operationally problematic for suppliers (Rinehart et al., 2004). Frequent interactions are more easily planned for and indicate a commitment to continued future business (Barry and Terry, 2008). Model estimates are similarly in line with those presented in the main results and can be found in Table EC.3 of the online appendix.
Next, we test the model definition. We test the lane fixed effects model choice, which captures the within-group (lane) effects that dominate the variance observed. Instead, we develop a hybrid model (Allison, 2005; Schunck, 2013), which calculates coefficients for the fixed and random effects separately. The results support our fixed effects modeling choice: the negative (i.e., nonsignificant) results of a Wald test suggest that the between-group effects are not significantly biasing an estimate of the within-group effect. Note that hybrid models can lead to biased model estimates for nonlinear dependent variables Allison (2005, 2009). However, we use this formulation solely to validate our fixed effects model choice. The model results can be found in Table EC.4 of the online appendix.
An additional check on model choice relates to potential issues introduced by our repeated measures dataset. To account for potential correlations between repeated measures, marginal models such as generalized estimating equations (GEEs) may be used to calculate (logistic) regression coefficients that measure the average response in the population (Ballinger, 2004; Gardiner et al., 2009). The coefficient estimates in GEE models consider the covariance matrix between the outcomes of the same individual (Greene, 2003). As such, GEE models result in consistent estimation of coefficients. We include our GEE model results in Table EC.5 of the online appendix. As expected, the coefficients are the same, but despite the higher standard error terms, the statistical significance of our main results hold—they are robust to the potential correlations between repeated measures.
Finally, we test the impact of removing the buyer, supplier, and lane control variables and find that the results hold, as demonstrated in Table EC.6 in the online appendix. We also reconstruct our models using only high-volume lanes. We define these as the lanes that constitute the top 25th percentile of volume. As noted by Caplice (2007), “
Discussion
Our empirical study of relational contracts offers both theoretical and practical implications, which we discuss in the following sections.
Theoretical Contributions
We address a set of gaps in the literature with three distinct contributions, framed within the levers of theorizing by Makadok et al. (2018): the mode of theorizing, the constructs explored, and the phenomenon. First, we offer an expansion of the mode of theorizing for relational contracts, which has been limited by a lack of detailed empirical data availability (Macchiavello and Morjaria, 2022) and explicit indication of informal contractual agreements (Gil and Zanarone, 2017). Our results are based on a dataset of buyer–supplier dyads with confirmed relational contracts. We observe the buyer–supplier relationship through transactional exchanges and the supplier’s decisions to accept business tenders over time and across geographic markets.
Next, we examine new moderating constructs in the relational contract theory. Previous research has explored the direct effects of operational and relational factors on relationship quality (Qian et al., 2021) and the likelihood that the parties will uphold their business relationship (Acocella et al., 2020; Scott, 2015). However, exploration of moderating effects has been limited (Terpend et al., 2008). The results of our exploration of the suppliers’ service model show that due to third-party brokers’ access to and aggregation of capacity, they are better able to serve businesses with variable demand as compared to asset-based providers. We find that third-party brokers are more than twice as likely to stick to the relational contract for business that is operationally difficult to serve. This adds to the theoretical and empirical relational contract literature (Macchiavello and Morjaria, 2022). We also demonstrate that suppliers respond to short-term surges in demand differently as compared to historically volatile demand business channels. While the latter are treated similarly between soft and tight markets, short-term demand spikes are deprioritized in tightly constrained markets. Our results also suggest that both third-party brokers and asset-based providers similarly value long-term relationships. With these results, we add to the literature on third-party brokers (e.g., Choi and Wu, 2009).
In addition, we find that market conditions impact relational factors. Long-term relationships become less of a deterrent for supplier defection in tightly constrained markets. During these market conditions, freight rejections are almost 4% more likely, even with long-term relationships in place. Suppliers may be pulled away from their relational contracts by higher priced outside options or due to a reduced emphasis on proving their performance quality (Macchiavello and Morjaria, 2015). We add to the work that has explored direct relationships between the LOR and contract performance (Carr and Pearson, 1999; Krause et al., 2007).
Our third contribution relates to the phenomenon lever described by Makadok et al. (2018). We demonstrate how relational contract theory, which has often been explored in emerging economy contexts (Shou et al., 2016; Macchiavello and Morjaria, 2022), can be applied to a context in a developed economy, specifically the TL transportation industry in the US. Despite the industry’s size and importance, and the broad interest in transportation buyer–supplier relationships, Zsidisin et al. (2007) find that the research is scarce and predominantly anecdotal in nature. Moreover, most of the transportation buyer–supplier relationship literature is qualitative or survey-based (e.g., Crum and Allen, 1991; Dobie, 2005; Douglas, 2006; Gibson et al., 1993; Hubbard, 2001; La Londe and Cooper, 1989; Larsen et al., 2002; Lu, 2003; Rinehart et al., 2004). While the focus on qualitative research is not problematic, this points to a gap in the research that we address.
Operational contract outcomes are not frequently considered in strategic TL procurement decisions (Acocella and Caplice, 2023) and there has been limited research on the moderating effect of market characteristics (Autry and Golicic, 2010). We demonstrate how a third-party broker may respond differently to operational demand pattern variability and uncertainty as compared to asset-based providers and how this can be utilized in procurement decisions. This builds from the work of Acocella et al. (2020), La Londe and Cooper (1989), Lindsey et al. (2013), and Scott et al. (2020) and demonstrates how the value of future business differs by supplier service models. In addition, we demonstrate how market conditions influence long-term suppliers’ decisions, as suggested by Acocella et al. (2020) and Scott et al. (2017). As a result, we offer transportation buyers a set of operational and relational factors that should be considered when establishing contracts with service providers during dynamic freight markets.
Managerial Implications
This work can further help inform transportation practitioners’ decisions. The provider service type results suggest that business lanes with variable demand may be better contracted to a third-party broker rather than an asset-based provider. This can support buyers’ supplier selection decisions: contracting the right type of carrier to each lane based on demand patterns can help maintain load acceptance rates, keep buyers out of the spot market due to carrier rejections, and reduce associated unanticipated cost escalations.
Third-party brokers have typically been used as a backup service provider, with a reputation of charging buyers more and undercutting suppliers (CTSI-Global, 2020). In the 1980s, there was a rapid expansion of the number of third-party competitors and services offered (Acocella and Caplice, 2023). As a result, third-party brokers have focused on proving their dedication to the buyer relationship matches that of asset-based providers. For example, brokers have continued to demonstrate themselves by aiming for guaranteed performance for buyers (Yoon et al., 2016; Lindsey et al., 2013). Our results highlight brokers’ success in offering better performance in particular network settings.
The impact of market conditions on relationship duration and supplier acceptance suggests buyers should not expect to rely solely on long relationships during tight markets. Instead, they should emphasize keeping contract prices competitive, as suggested by Acocella et al. (2020), to increase the supplier’s performance. For example, if buyers expect the market to tighten following a procurement event, they can consider updating prices frequently with mini-bids or dynamic pricing (Caplice, 2021) with long-term suppliers to encourage contract compliance.
Transportation markets have faced extreme fluctuations in the balance of supply and demand during and following the COVID-19 pandemic (Coyote Logistics, 2023). Freight prices, influenced by consumer spending on goods, increased by 45% from the beginning of 2021 to mid-2022, then declined by 27% by June 2023, as demonstrated by the US Bureau of Labor Statistics Truck Tonnage Index (US Bureau of Labor Statistics, 2023).
Making matters more difficult, during the large increase in freight demand during 2021, growth patterns and the mix of types of freight moving differed across lanes in the US and created short-term demand surges in some areas and dramatically reduced volumes in others (Caplice, 2021; Miller, 2021). As our results demonstrate, this makes building balanced networks more difficult for suppliers, particularly asset-based providers, which are capacity-constrained. Thus, the impact of supplier type and market conditions on operational and relational factors we explore in this study will continue to be relevant and important considerations for transportation practitioners.
Limitations and Future Research
This study is not without its limitations. Due to the observational nature of our dataset, we cannot control for outside influences on suppliers’ acceptance decisions. We attempt to account for these factors by including controls for such variables that have been previously identified as contributing factors. However, there may still be alternative explanations for suppliers’ acceptance decisions and relationship value. For example, there may be network-based reasons for a supplier to accept or reject individual load tenders that we cannot observe (e.g., a supplier may accept a load because it puts it in an advantageous geographic location, irrespective of the buyer-specific relationship). However, we model how the average likelihood of load acceptance is influenced. As such, we overcome some aspects of this limitation.
Furthermore, we limit the focus of this study to US-based buyers and suppliers in the TL industry. In this context, the most common supplier service models are asset-based providers and third-party brokers. However, the third-party freight forwarder business model is common in other parts of the world, such as Europe. Rather than simply matching buyer and seller as the third-party broker does, the freight forwarder takes responsibility for storing, packing, and moving the freight. Because our data do not contain such providers, they are outside the scope of our study. However, the pure matching service model is common in other industries as well. Therefore, we retain generalizability to other buyer–supplier contexts. Moreover, as noted earlier, other supplier service models exist. For example, some large asset-based providers also offer brokerage services. In these cases in our study, we consider the relationships distinct.
This leads to other avenues for future research. One direction could consider providers that offer multiple service models and study which network segments and in which market conditions performance differs from pure asset-only or broker-only providers. Additional future research may explore other performance metrics that are important for theory and practice but that we do not obtain from our observational dataset. These may include on-time pick-up and delivery (perhaps controlling for lead time from the buyer), and even strategic-level performance, such as bidding behavior in future contractual negotiation rounds. Moreover, the buyer’s performance is outside the scope of our study. Future research should consider how buyers’ characteristics and market constraints impact buyers’ performance in the relational contract context. This can help providers navigate market dynamics, prioritize customers’ business, and set and submit contract bid prices.
Supplemental Material
sj-pdf-1-pao-10.1177_10591478241277463 - Supplemental material for Great Expectations: The Moderating Effects of Supplier Service Model and Market Dynamics on Relational Contract Performance
Supplemental material, sj-pdf-1-pao-10.1177_10591478241277463 for Great Expectations: The Moderating Effects of Supplier Service Model and Market Dynamics on Relational Contract Performance by Angela Acocella, Chris Caplice and Yossi Sheffi in Production and Operations Management
Footnotes
Acknowledgments
The authors would like to thank the anonymous reviewers and editor team for greatly improving the quality of this manuscript.
Declaration of Conflicting Interests
The authors declared no potential conflicts of interest with respect to the research, authorship, and/or publication of this article.
Funding
The authors received no financial support for the research, authorship, and/or publication of this article.
Notes
How to cite this article
Acocella A, Caplice C and Sheffi Y (2024) Great Expectations: The Moderating Effects of Supplier Service Model and Market Dynamics on Relational Contract Performance. Production and Operations Management 33(11): 2121–2138.
References
Supplementary Material
Please find the following supplemental material available below.
For Open Access articles published under a Creative Commons License, all supplemental material carries the same license as the article it is associated with.
For non-Open Access articles published, all supplemental material carries a non-exclusive license, and permission requests for re-use of supplemental material or any part of supplemental material shall be sent directly to the copyright owner as specified in the copyright notice associated with the article.