
Abstract
In biopharmaceutical manufacturing, fermentation processes play a critical role in productivity and profit. A fermentation process uses living cells with complex biological mechanisms, leading to high variability in the process outputs, namely, the protein and impurity levels. By building on the biological mechanisms of protein and impurity growth, we introduce a stochastic model to characterize the accumulation of the protein and impurity levels in the fermentation process. However, a common challenge in the industry is the availability of only a very limited amount of data, especially in the development and early stages of production. This adds an additional layer of uncertainty, referred to as model risk, due to the difficulty of estimating the model parameters with limited data. In this article, we study the harvesting decision for a fermentation process (i.e., when to stop the fermentation and collect the production reward) under model risk. We adopt a Bayesian approach to update the unknown parameters of the growth-rate distributions, and use the resulting posterior distributions to characterize the impact of model risk on fermentation output variability. The harvesting problem is formulated as a Markov decision process model with knowledge states that summarize the posterior distributions and hence incorporate the model risk in decision-making. Our case studies at MSD Animal Health demonstrate that the proposed model and solution approach improve the harvesting decisions in real life by achieving substantially higher average output from a fermentation batch along with lower batch-to-batch variability.
Keywords
Introduction
The biomanufacturing industry has developed several innovative treatments for cancer, adult blindness, and COVID-19 among many other diseases. Despite its increasing success, biomanufacturing is a challenging production environment. Different from classical pharmaceutical manufacturing, biomanufacturing methods use living organisms (e.g., bacteria, viruses, or mammalian cells) during the production processes. These living organisms are custom-engineered to produce highly complex active ingredients for biopharmaceutical drugs. However, the use of living organisms also introduces several operational challenges related to batch-to-batch variability in the production outcomes.
The drug substance manufacturing can be broadly categorized into two main steps: fermentation and purification operations. During the fermentation process, the living organisms grow and produce the desired active ingredients. Specific characteristics of active ingredients (e.g., monoclonal antibodies, biomass, proteins, antigens, etc.) could vary across different drugs. In the remainder of this paper, we refer to the resulting target active ingredient as protein. After fermentation, the batch continues with a series of purification operations to comply with stringent regulatory requirements on safety and quality. Our main focus in this study is the fermentation process.
The fermentation process is typically carried out inside a stainless steel vessel called bioreactor. Bioreactors are equipped with advanced sensors to achieve a highly controlled environment via monitoring of critical process parameters (e.g., cell growth rate, protein accumulation, impurity accumulation, etc.). Figure 1 uses industry data to illustrate the main dynamics of a batch fermentation process. As the fermentation continues, we observe from Figure 1(a) that the amount of protein produced during fermentation increases exponentially over time. Hence, this specific phase of fermentation is known as the exponential growth phase. However, the exponential growth phase continues only for a finite period of time (e.g., several hours or days depending on the application) because of the inherent limitations of biological processes (e.g., limitations in media, cell viability, and growth). After the exponential growth phase, the fermentation enters a stationary phase in which the protein production stops and the batch needs to be harvested. In addition, we observe from Figure 1(b) that unwanted impurities accumulate inside the bioreactor along with the desired proteins. The specific nature of impurities varies across applications but impurities often represent unwanted byproducts, such as ammonia, dead cells, etc. These impurities are subsequently filtered and eliminated through a series of purification operations.
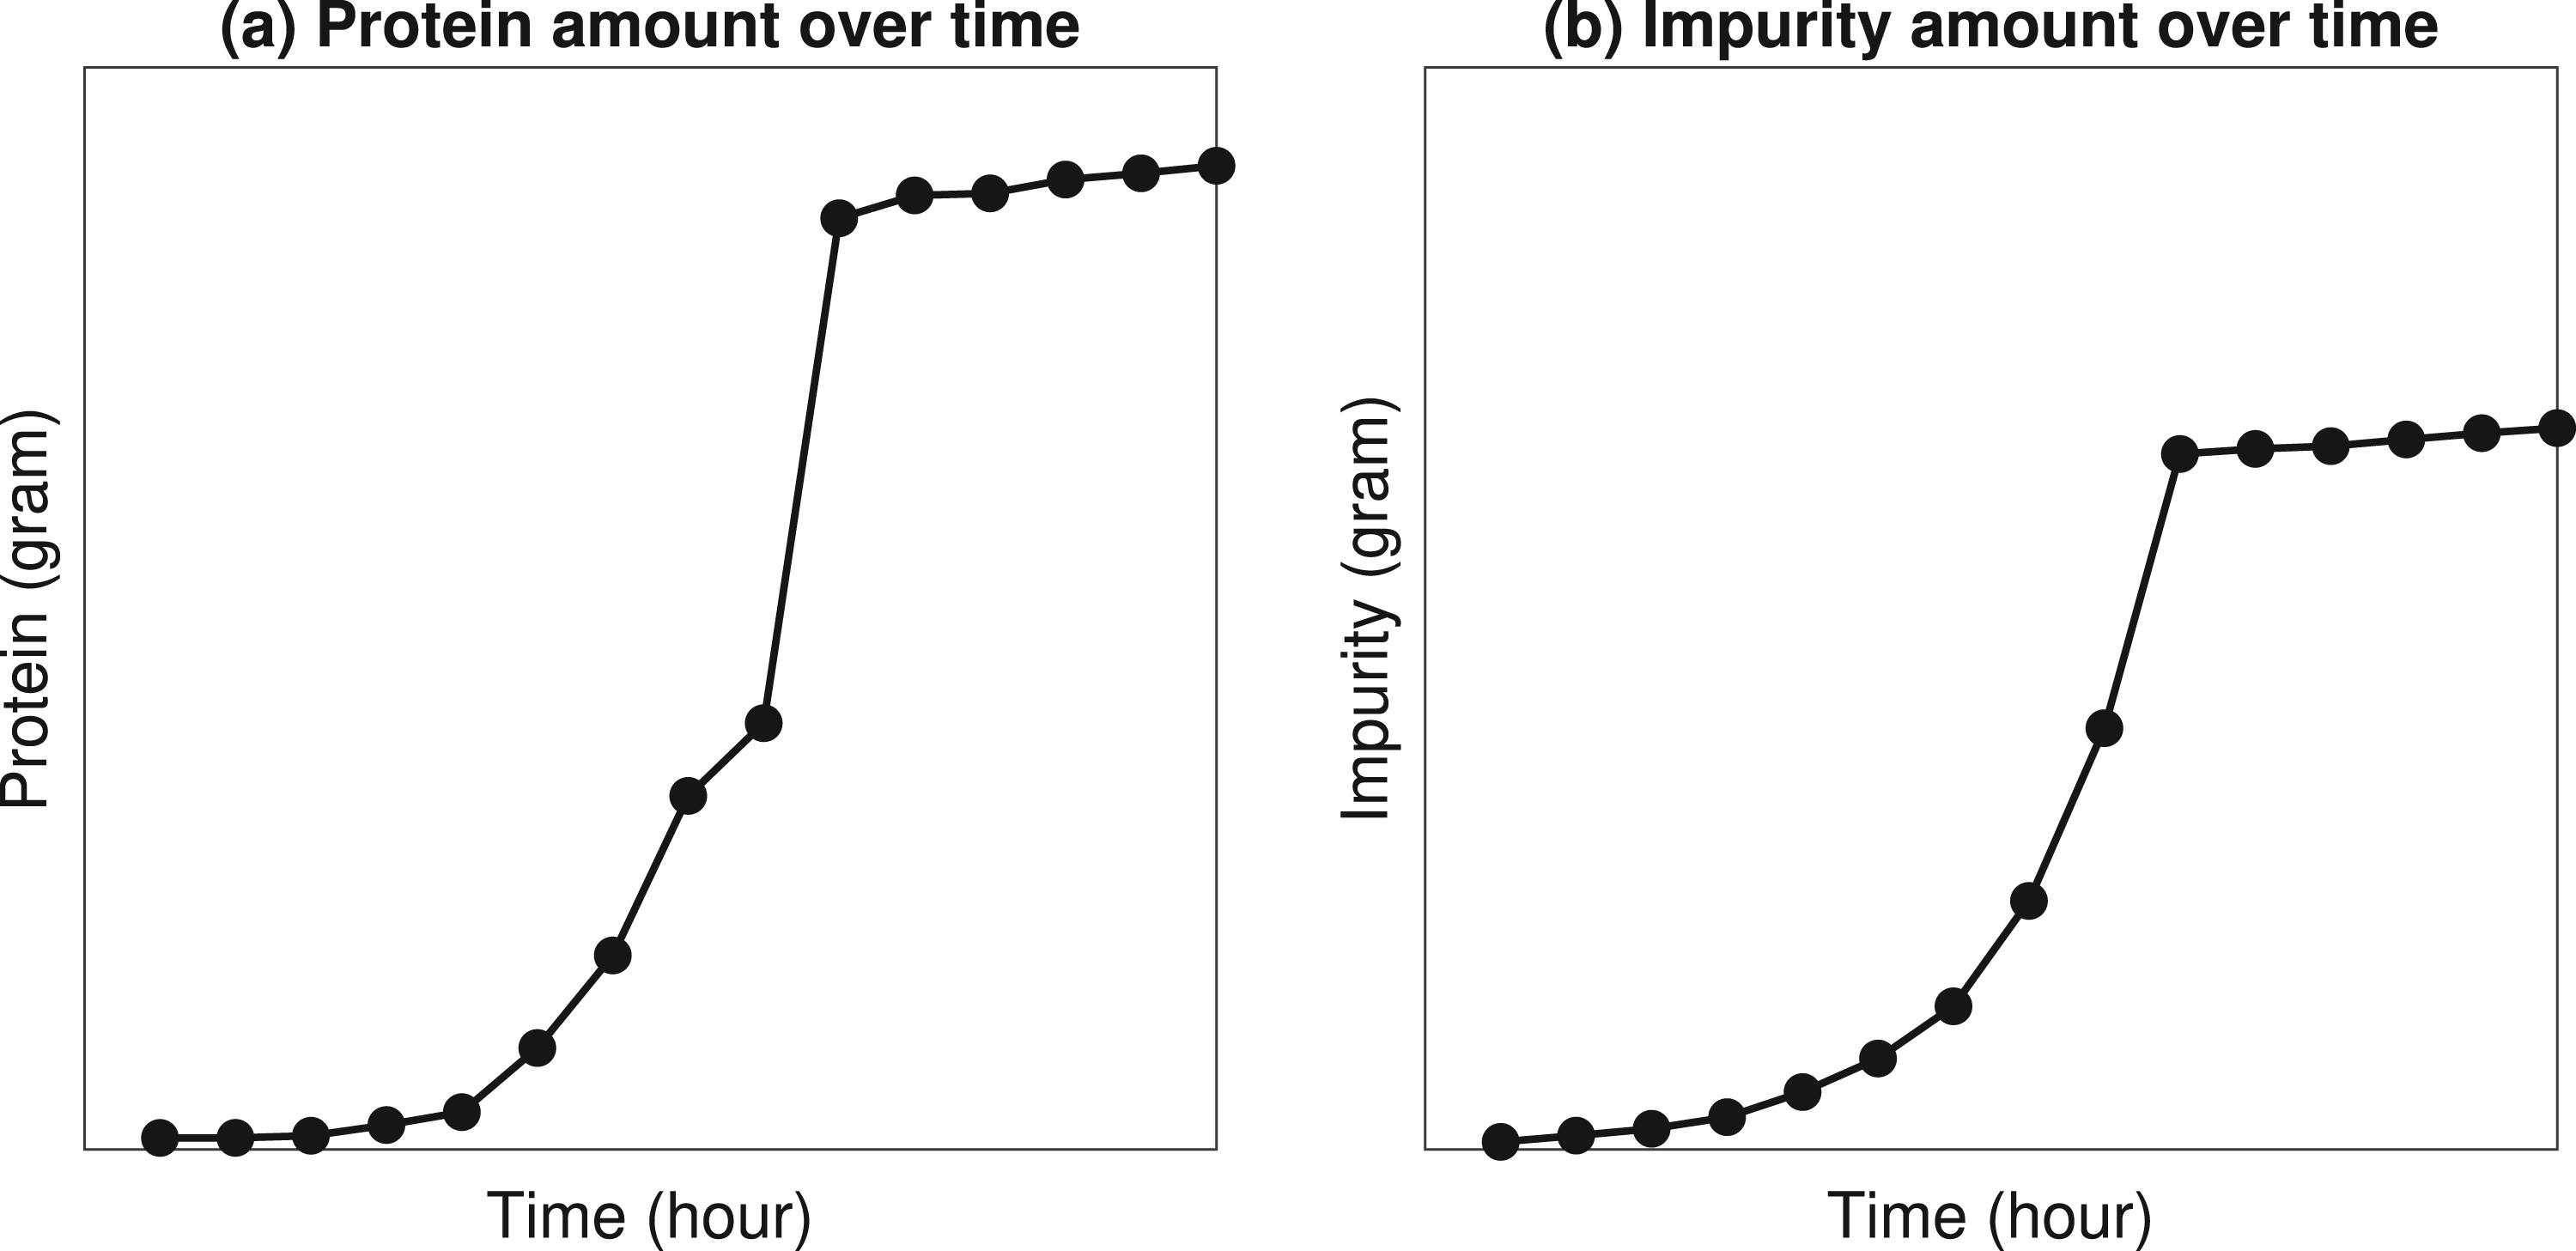
Illustration of fermentation dynamics using industry data from MSD.
The simultaneous growth of desired proteins and unwanted impurities, as shown in Figure 1, is often known as the purity–yield trade-off in fermentation processes. From a practical perspective, the purity–yield trade-off presents a critical challenge in fermentation harvesting (stopping) decisions. In order to achieve a high protein content, the decision maker may be inclined to harvest the fermentation as late as possible. However, waiting too long to harvest can result in higher levels of impurity. As a result, the difficulty (cost) of subsequent purification operations may increase. Therefore, the purity-yield trade-off has financial implications (e.g., expected revenue increases as protein yield increases, but expected cost increases as impurity levels increase). These trade-offs motivate our main research question: (1) What is an optimal harvesting policy (i.e., when should we stop the fermentation) to maximize the expected profit obtained from a batch?
In addition to the purity–yield trade-off, process “uncertainty” imposes another critical challenge on harvesting decisions. In particular, two types of process uncertainty are commonly encountered in biomanufacturing practice: (i) inherent stochasticity and (ii) model risk. In our problem setting, inherent stochasticity represents the uncertainty in the amounts of protein and impurity produced throughout fermentation, and it is often caused by the inherent complexity of biological systems. Because living organisms are used during fermentation, the rate at which proteins and impurities accumulate is random (although fermentation is carried out under identical conditions). Therefore, the inherent stochasticity of biological processes motivates our second research question: (2) How can we develop an analytical model to learn the inherent stochasticity of fermentation processes and incorporate it into optimal harvesting decisions?
Most often, the inherent stochasticity can not be controlled but can be predicted through historical process data. However, building a reliable prediction model can be challenging when there is only a limited amount of historical process data. We refer to the resulting uncertainty in the prediction model itself as the model risk. The problem of decision-making under limited data (i.e., under model risk) is a critical concern for both research and development (R&D) projects and industry-scale applications. In biopharmaceutical R&D projects, each protein is unique such that the scientists re-engineer and manufacture it for the first time. This implies that harvesting decisions are typically made under limited R&D data. In industry-scale applications, the problem of limited data becomes relevant every time a change occurs in equipment or raw materials. For example, the supplier of raw materials (i.e., medium or seed cells) might change their formulations, the management might purchase a new bioreactor, etc. Such changes have a substantial impact on the output of fermentation which often makes the historical process data obsolete or unreliable. Thus, it is of practical importance to have a harvesting strategy that accounts for the model risk, leading to our third research question: (3) Given a limited amount of historical data, how can we develop a learning mechanism to simultaneously account for inherent stochasticity and model risk while making harvesting decisions? In addition, the harvesting strategies commonly used in the industry do not account for model risk and may lead to suboptimal decisions. The industry needs a better understanding of how to manage model risk under small data, and how to exploit the structural properties of an optimal policy to facilitate its implementation. These observations motivate our final research question: (4) What are the structural characteristics of optimal harvesting policies? How does their performance compare to the alternative harvesting policies used in practice?
Contributions
To address the aforementioned research questions, we build a solution framework based on a reinforcement learning model using the theory of Bayesian statistics and Markov decision processes. A key aspect of our work is that we build analytical models that combine the knowledge from life sciences and operations research (OR) to support biomanufacturing decisions under limited historical data and the inherent stochasticity of biological systems. In life sciences research, there are well-known mechanistic models to predict the evolution of fermentation (Doran, 2013). However, existing models do not mathematically capture both aspects of limited process data and the inherent stochasticity of fermentation. Our study is a first attempt to optimize fermentation harvesting decisions in biomanufacturing under limited data, and combines the knowledge from life sciences and stochastic modeling to derive guidelines that improve industry practices.
We characterize the control-limit structure of the optimal policy with respect to the impurity level. We also show that the myopic policy which makes the harvesting decisions by looking only one period ahead is optimal under a perfect-information setting and some practically-relevant sufficient conditions. Furthermore, we study how the posterior predictive distributions of the growth rates affect the harvesting decisions under the myopic policy in the presence of model risk. Our framework enables decision makers to do a rigorous assessment of the impact of limited data on harvesting decisions, and provides managerial insights on the value of collecting additional data. This research is an outcome of a multi-year collaboration with MSD Animal Health in Boxmeer, Netherlands. The facility in Boxmeer is a leading biomanufacturing hub in Europe that conducts both biopharmaceutical R&D and large-scale production. Since September 2019, the developed framework has been used in daily operations to support harvesting decisions. The implementation has resulted in around
Literature Review
There is a wide range of papers in operations management with a focus on pharmaceutical industry. For example, Plante et al. (1999) maximized the expected quality in a pharmaceutical production process by explicitly modeling the quality parameters of raw materials, the parameters of the production process, and the interactions between them. In real-world case studies, Martagan et al. (2016a) optimized the purification-related decisions for engineer-to-order proteins, and Sahling and Hahn (2019) determined a master production schedule for weekly demand for a multi-level biopharmaceutical manufacturing process. Subramanian et al. (2020) investigated how pharmaceutical manufacturers switch from early-stage drug discovery and late-stage drug development. At supply chain level, Zhu et al. (2021) proposed a forecasting method to predict demand for pharmaceutical products, and Zhao (2023) provided an overview of complex pharmaceutical supply chains. Also at the supply chain level, Xu et al. (2023) investigated a pharmaceutical manufacturer’s usage of different types of distributors for speciality drugs. The operations management literature on food processing and agribusiness is also relevant to our work due to the biological nature of the products (Lowe and Preckel, 2004; Azoury and Miyaoka, 2013; Bansal and Nagarajan, 2017). For example, Rajaram and Karmarkar (2004) considered the scheduling of multiproduct batch operations in the food-processing industry to minimize setup and quality costs, and Jahandideh et al. (2020) considered learning across batches and decay in the performance of the catalysts used in the production process. Blackburn and Scudder (2009) studied supply chain design strategies for fresh produce after their harvesting. More recently, Bansal et al. (2024) addressed a crop harvesting problem in the presence of a time-quality trade-off. In the remainder of our review, we restrict our scope to studies related to biomanufacturing applications. In particular, our work is most closely related to two streams of research: (1) modeling and control of fermentation based on a known model that describes the dynamics of the fermentation process, and (2) reinforcement learning approaches to predict and control fermentation processes.
A vast body of life sciences literature focuses on modeling the biological dynamics of fermentation processes. In particular, predictive models are built to estimate the evolution of fermentation, and then these models are used to guide the search for optimal control strategies. In this context, most studies develop deterministic or stochastic models to predict and control fermentation. Deterministic models typically build kinetic process models (i.e., differential equations) on cell growth and product formation (McNeil and Harvey, 2008; Doran, 2013; Putra and Abasaeed, 2018). These kinetic models are also integrated with optimization models. For example, Chang et al. (2016) constructed a dynamic flux balance model for a fermentation process. They developed a closed-loop control for feed rate and dissolved oxygen concentration profiles to maximize yield production.
Data-driven stochastic optimization is relatively understudied to predict and control fermentation processes. Existing studies typically focus on the inherent stochasticity of fermentation. For example, Peroni et al. (2005) used approximate dynamic programming to maximize yield and minimize process time in fed-batch fermentation. Xing et al. (2010) adopted a Markov chain Monte Carlo approach to optimize the kinetics of a fermentation process. More recently, Martagan et al. (2016b) and Martagan et al. (2020) developed a Markov decision processes (MDP) model to optimize fermentation operating decisions. However, their optimization models are built based on sufficiently large historical data, and hence are not equipped to capture the impact of model risk (limited historical data) on biomanufacturing decisions. Martagan et al. (2023) developed a portfolio of decision support tools to reduce biomanufacturing costs. Koca et al. (2023) optimized the timing of so-called bleed-feed decisions, enabling pharmaceutical manufacturers skip intermediary biorector setups in batch fermentation processes. However, they did not consider the model risk. Xie et al. (2022) considered model risk in an interpretable semantic bioprocess probabilistic knowledge graph for production stability control, but they do not optimize the harvesting decisions. To the best of our knowledge, this paper is the first to simultaneously capture the inherent stochasticity of biological systems and model risk to optimize harvesting decisions in biomanufacturing systems.
Reinforcement learning approaches have been recently developed for bioprocess control. For example, Treloar et al. (2020) and Nikita et al. (2021) developed model-free deep-Q-network-based reinforcement learning approaches to maintain the cells at target populations by controlling the feeding profiles and maximize the yield by controlling the flow rate. Zheng et al. (2020) and Zheng et al. (2023) constructed a model-based reinforcement learning for biomanufacturing control, with a predictive distribution of system response. After that, Zheng et al. (2020) proposed a simulation-assisted policy gradient algorithm that can efficiently reuse the previous process outputs to facilitate the learning and the search for the optimal policy. Our paper is different from these studies in two ways. First, we study the harvesting problem in fermentation, while Zheng et al. (2020) focused on a chromatography problem. Second, we explicitly incorporate the posterior distributions of unknown fermentation-process parameters as knowledge states of the MDP model and study the structure property of optimal policy, which can enhance interpreability and feasibility of the proposed approach for real manufacturing practice.
To be specific, we adopt model-based Bayesian reinforcement learning as our solution approach. Compared to model-free approaches, it allows us to interpret model risk by quantifying the uncertainty in the process parameters. Furthermore, although it is often less computationally efficient than a model-free approach, it can incorporate known process dynamics and any prior information about model risk into decision making. A comprehensive review of Bayesian reinforcement learning methodologies can be found by Ghavamzadeh et al. (2016). Since solving the original model-based Bayesian reinforcement learning is notoriously complex due to potentially huge state space, various approximation algorithms have been developed, including offline value approximation (Poupart et al., 2006); online near-myopic value and tree search approximation that focus on realized knowledge states in planning (Ross et al., 2008; Osband et al., 2013; Fonteneau et al., 2013); and exploration bonus based methods where an agent acts according to an optimistic model of MDP under uncertainty (Kolter and Ng, 2009; Asmuth and Littman, 2011; Asmuth et al., 2012). Motivated by those studies, we develop a model-based Bayesian reinforcement learning approach, which can account for model risk in guiding fermentation harvesting decisions.
Model
Section 3.1 introduces a stochastic mechanistic model to represent the protein and impurity accumulation in the fermentation process. Section 3.2 presents a Bayesian approach to capture the uncertainty in the unknown parameters of this model, and describes how this uncertainty can be updated with new protein and impurity observations collected during the fermentation process. Finally, Section 3.3 presents an MDP model formulation, accounting for both inherent stochasticity and model risk, to optimize the harvesting decision in the fermentation process. An overview of the mathematical notation is provided in Appendix EC.1.
Fermentation Process Modeling
The accumulation of protein and impurity amount in the exponential-growth phase of a fermentation process is commonly modeled with the so-called cell-growth kinetics mechanism (Doran, 2013). The cell-growth kinetics mechanism is often represented as an ordinary differential equation. To be specific, the protein amount at time
Because living biological systems (e.g., cells) are used in the fermentation process, their specific growth rates are random; see, for example, Templeton et al. (2013) and Odenwelder et al. (2021). We let

The protein and impurity growth rates are assumed independent because there are many biological and chemical factors that randomly influence the “production speed” for impurity and protein, that is, the rate of generating metabolic wastes and antibody proteins (Tsao et al., 2005; Xing et al., 2010). The independent and normally distributed growth rates are commonly used in the literature to model their random variations over time (Wechselberger et al., 2013; Mockus et al., 2015; Möller et al., 2020). We also validated this assumption using historical data in our case study, as described in Section 5.1. The stationarity assumption for the growth rate distributions is linked to the fact that the fermentation process has a well-controlled cell culture condition, where the so-called metabolic quasi-steady state is achieved. Thus, the metabolic flux (and hence the corresponding distribution of the protein and impurity growth rates during the exponential growth phase) does not change over time. This assumption is also validated in our case study (Section 5.1).
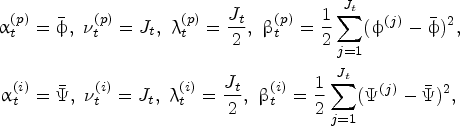
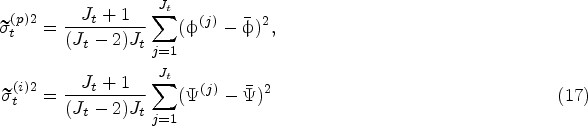
The true parameters of the underlying stochastic model for the protein and impurity growth rates, denoted by
Specification of Prior Distribution
For the protein growth rate, we build the joint prior distribution of


Suppose that


Given the Bayesian model described above, the density of the protein growth rate at time

The same result holds for the predictive impurity growth-rate

It is of practical importance to optimize when to harvest the fermentation process under limited historical data. We will formulate this problem as a Markov decision processes (MDP) model with Bayesian updates on the parameters of the protein and impurity growth-rate distributions.
Decision Epochs
We consider a finite-horizon discrete-time model with decision epochs
Physical States
The levels of protein and impurity during the fermentation process constitute the physical states. In practice, there is an upper limit on the cell density that can be accommodated by a bioreactor with a certain volume. Thus, it is undesired to continue fermentation beyond a certain level of protein accumulation. We let
Action Space
At a decision epoch before reaching the stationary phase, we can either continue the fermentation process one more time period (denoted by action
Knowledge State
Since the true parameters
Hyper States & Hyper State Transition
We introduce the hyper states

In (11), the first term
At any decision epoch
At any decision epoch

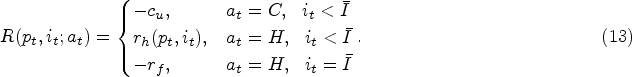
Let

The value function
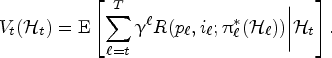

At the decision epoch

Section 4.1 presents a characterization of the variability in the posterior predictive distribution of the growth rates. Section 4.2 provides some analytical properties of the optimal policy. Note that our MDP model is a variant of the classical optimal stopping problem (Ferguson, 2000). A well-known class of policies for optimal-stopping problems is look-ahead policies. Motivated by its simplicity for applying in practice, we consider the one-step look-ahead policy (referred to as myopic policy) in Section 4.3. Finally, Section 4.4 discusses our solution approach to obtain the optimal policy. All the proofs and the algorithm procedure are provided in the Appendix in the E-Companion.
Growth-Rate Variability Under Model Risk
Recall that the uncertainty in the protein and impurity growth rates comes from two sources: the inherent stochasticity of the fermentation and the model risk. Conditional on the historical data collected until the decision epoch
Let
Conditional on the historical data
We notice from Proposition 1(i) that the bias
Notice that Proposition 1 also applies to the impurity growth model. To be specific, the same results hold for the predictive variance
We start our analysis by first showing the monotonicity of the value function, and then present sufficient conditions for the existence of a control-limit policy with respect to the impurity level.
Given the knowledge state
Based on the monotonicity properties presented in Theorem 2, we can derive sufficient conditions for the existence of a control-limit policy with respect to the impurity level as follows.
At any decision epoch

Proposition 3 presents the existence of a critical threshold
Note that the condition (18) is more likely to be satisfied as the relative value of the failure penalty
In this section, we consider a one-step look-ahead policy as a practically appealing alternative policy. We refer to it as the myopic policy because it makes the harvesting decisions by only comparing the reward of harvesting at the current decision epoch with the expected reward of harvesting at the next decision epoch. We study the myopic policy because it can be implemented by only maintaining a posterior distribution of the unknown growth-rate distribution parameters. It can be relevant to many small-sized biomanufacturing companies that may not have the necessary infrastructure or expertise to compute the optimal policy.
Myopic Policy Under Perfect Information
We first consider the case where the true parameters of the underlying stochastic model are known, referred to as the perfect-information case. That is, the parameters
Let

The policy that takes the harvest decision the first time the protein and impurity levels enter a state in
Our objective is to establish when the myopic policy is optimal in the perfect-information setting. Proposition 4 establishes the optimality of the myopic policy under some specific conditions.
Consider a fermentation process starting with protein level
The conditions in Proposition 4 assure that the physical state space
While equation (20) is the closed-form characterization of a starting protein-level lower bound for the optimality of the myopic policy, the condition (21) is not immediately intuitive. To make it easier to interpret, we simplify (21) by applying a Taylor series approximation. To be specific, by applying first-order Taylor series approximation of the nonlinear terms on both sides of inequality (21), it can be approximated as

In this section, the true parameters of the underlying stochastic model for the growth rates are not known anymore. That is, there is a model risk. Our objective is to investigate how the model risk affects the harvesting decisions of the myopic policy. When there is model risk, the expected reward of harvesting at the next decision epoch is calculated by using the posterior predictive distributions of the growth rates (i.e., the distributions characterized in (9) and (10)). Let

The policy that takes the harvest decision the first time the inequality
We will study the effect of model risk on the harvesting decisions of the myopic policy by investigating how the so-called harvest boundary, which is given by

Figure 2 plots the harvest boundary for various levels of model risk. To be specific, Figure 2 introduces a scaling factor
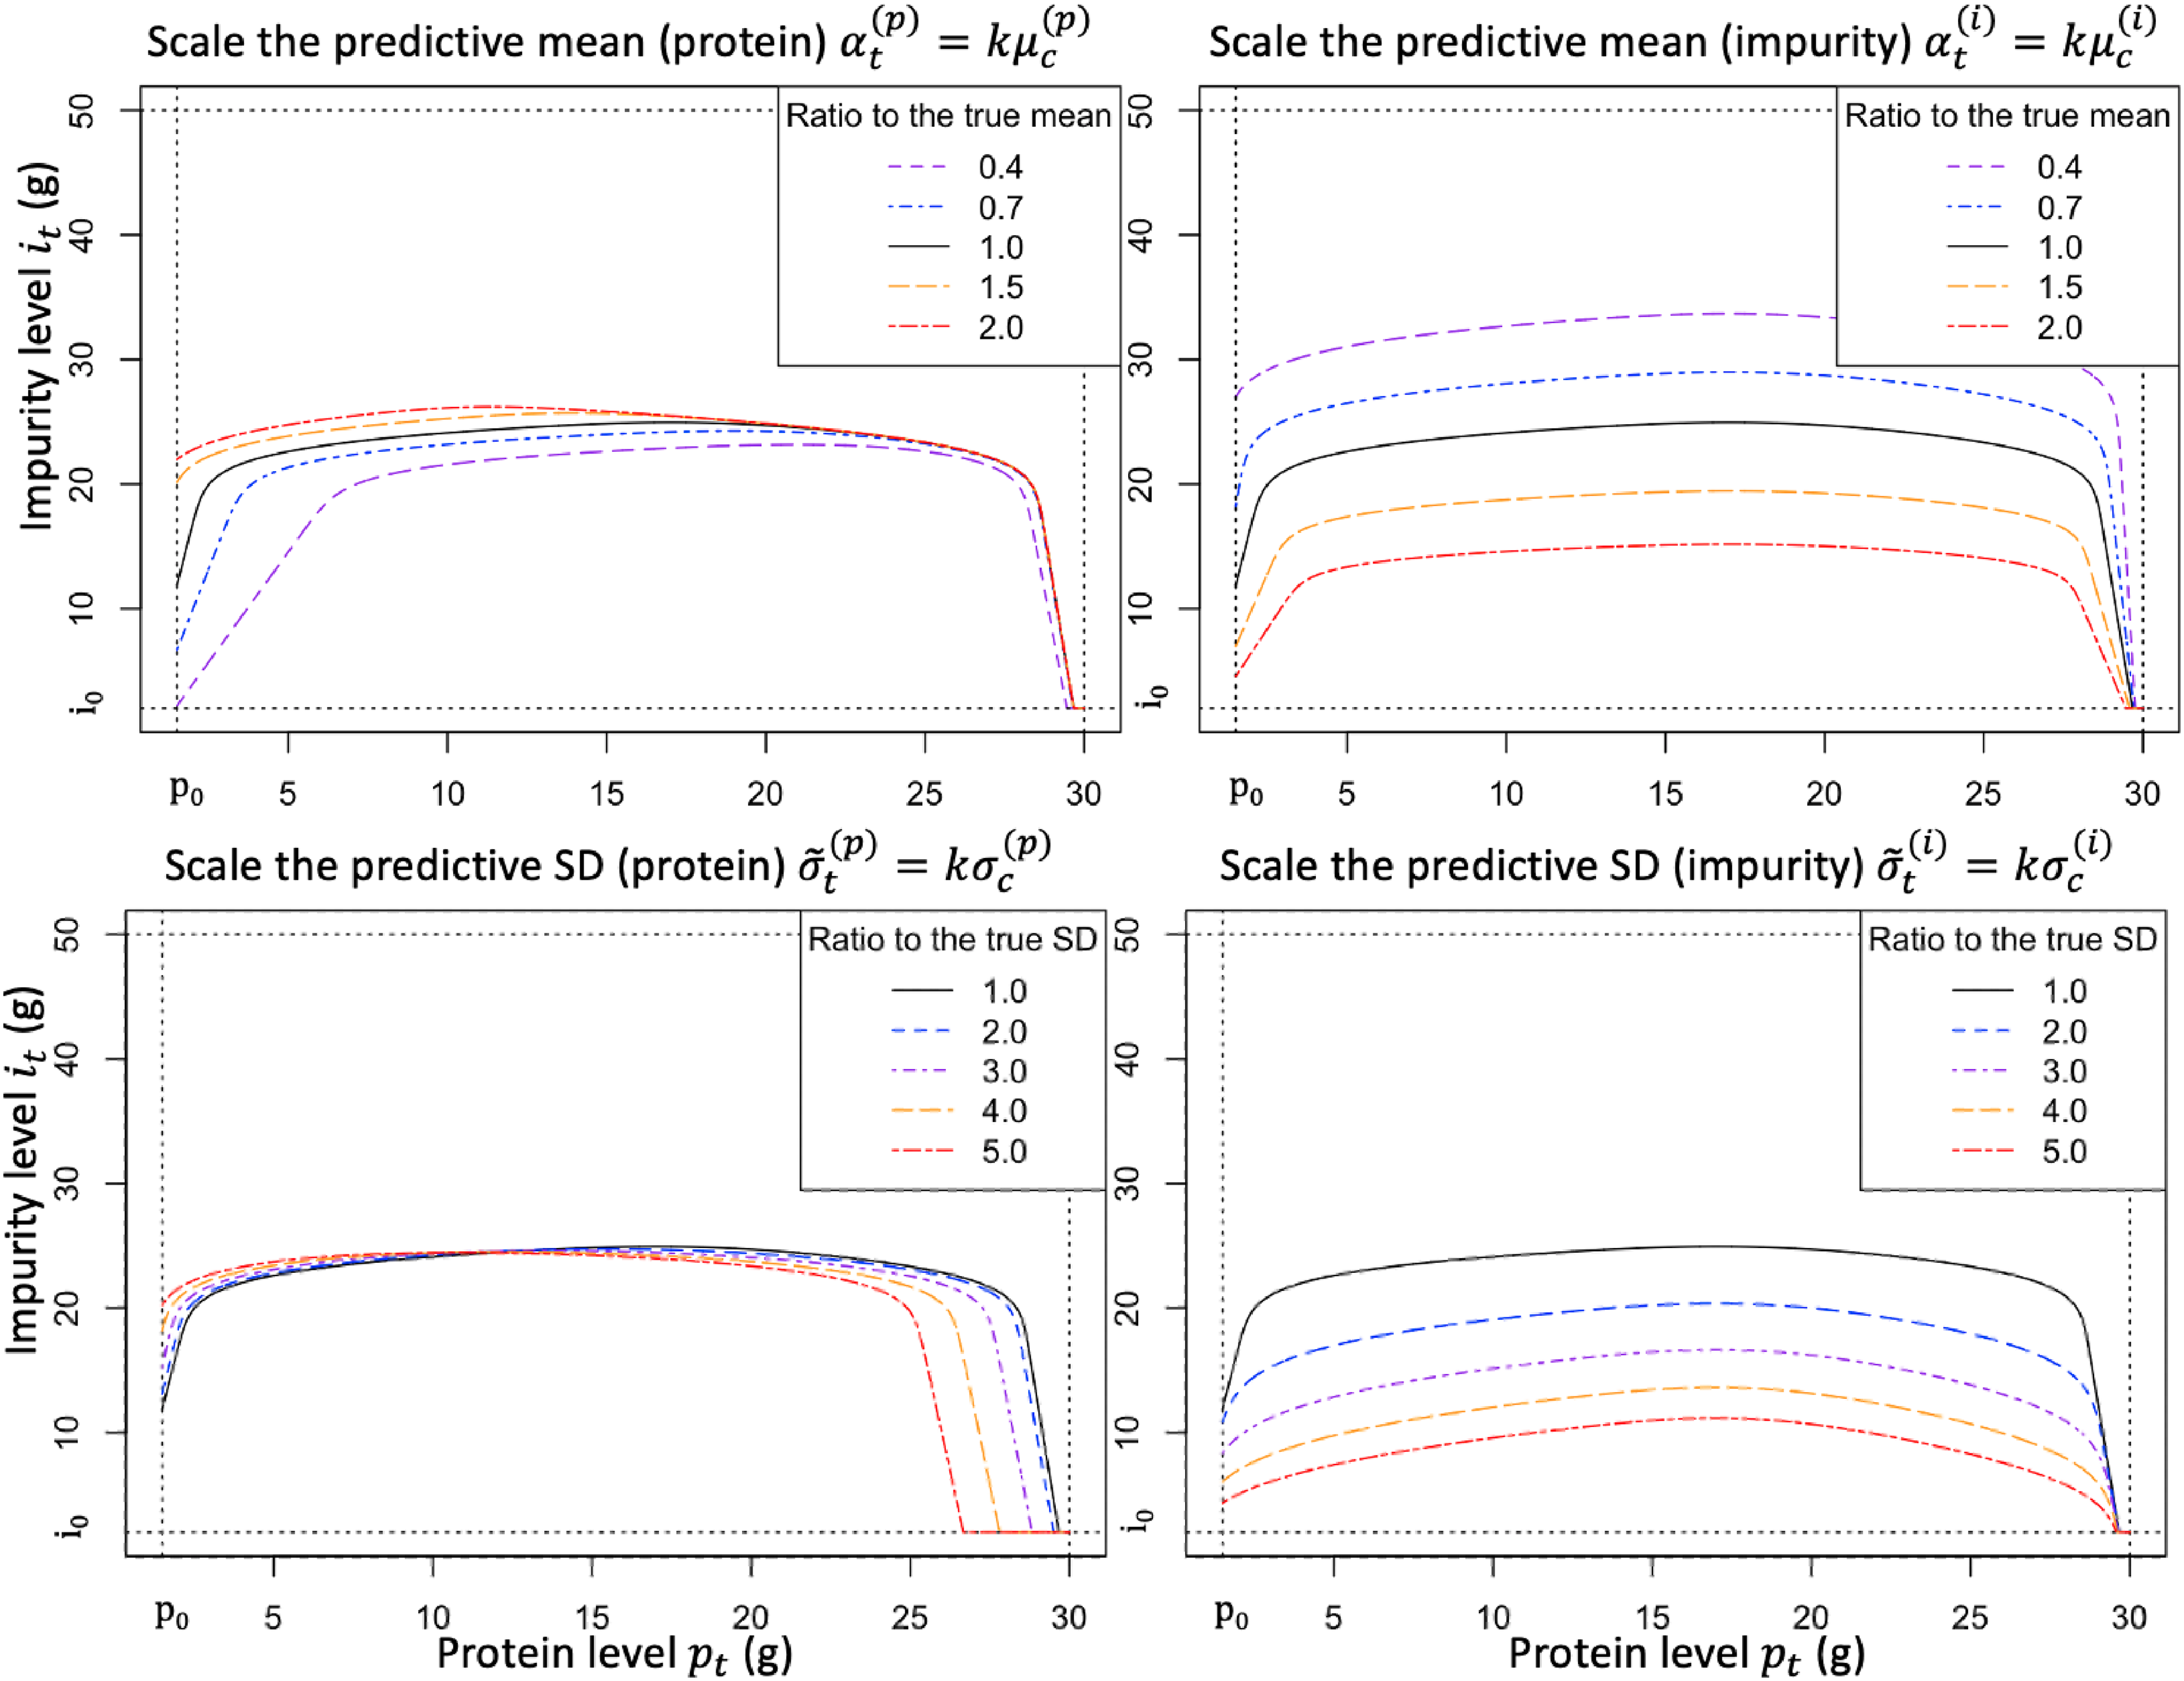
Illustration of how the harvest boundary is affected by the model risk (based on the case study parameters presented in Section 5.1).
Figure 2 (top, left) shows that as the predictive mean of protein
Proposition 5 formalizes our observations from Figure 2 by establishing the monotonicity of the function
The function increasing in decreasing in increasing in decreasing in
Proposition 5 can be useful in understanding how the model risk would influence the harvest boundary of the myopic policy. For example, if the predictive mean
As the size of the historical data
Proposition 6 is useful in practice as it tells us that the myopic policy under model risk becomes similar to the myopic policy under perfect information, which we already know to be optimal under the conditions in Proposition 4. Intuitively, this represents the situation with a sufficient amount of historical data such that the underlying fermentation process is already learned accurately.
In this section, we introduce our solution approach to compute the optimal policy that minimizes the objective function in (14). Different from the myopic policy in Section 4.3, we now consider the effect of learning from future data on harvesting decisions (in a forward-looking manner). Recall that the harvest action at physical states


However, computing this dynamic program is notoriously difficult and also not necessary in practice, given that the optimal policy is only needed starting from a specific physical state (which evolves by visiting certain states more likely than others) in the real-life execution of the fermentation process. Therefore, we adopt a solution approach that executes the policy in an online manner, which means that we focus on estimating the Q-function in (26) at a particular current state
We present a case study motivated by the implementation at MSD Animal Health. To protect confidentiality, we disguised MSD’s original data and used representative values to generate insights.
Experiment Setting and Analysis Overview
The starting protein and impurity for each batch are
Analysis Overview
We use the case study to generate insights for practitioners. For this purpose, we consider various practically relevant strategies as a benchmark and compare their performance:
The mean and standard deviation of the total reward achieved by different strategies.
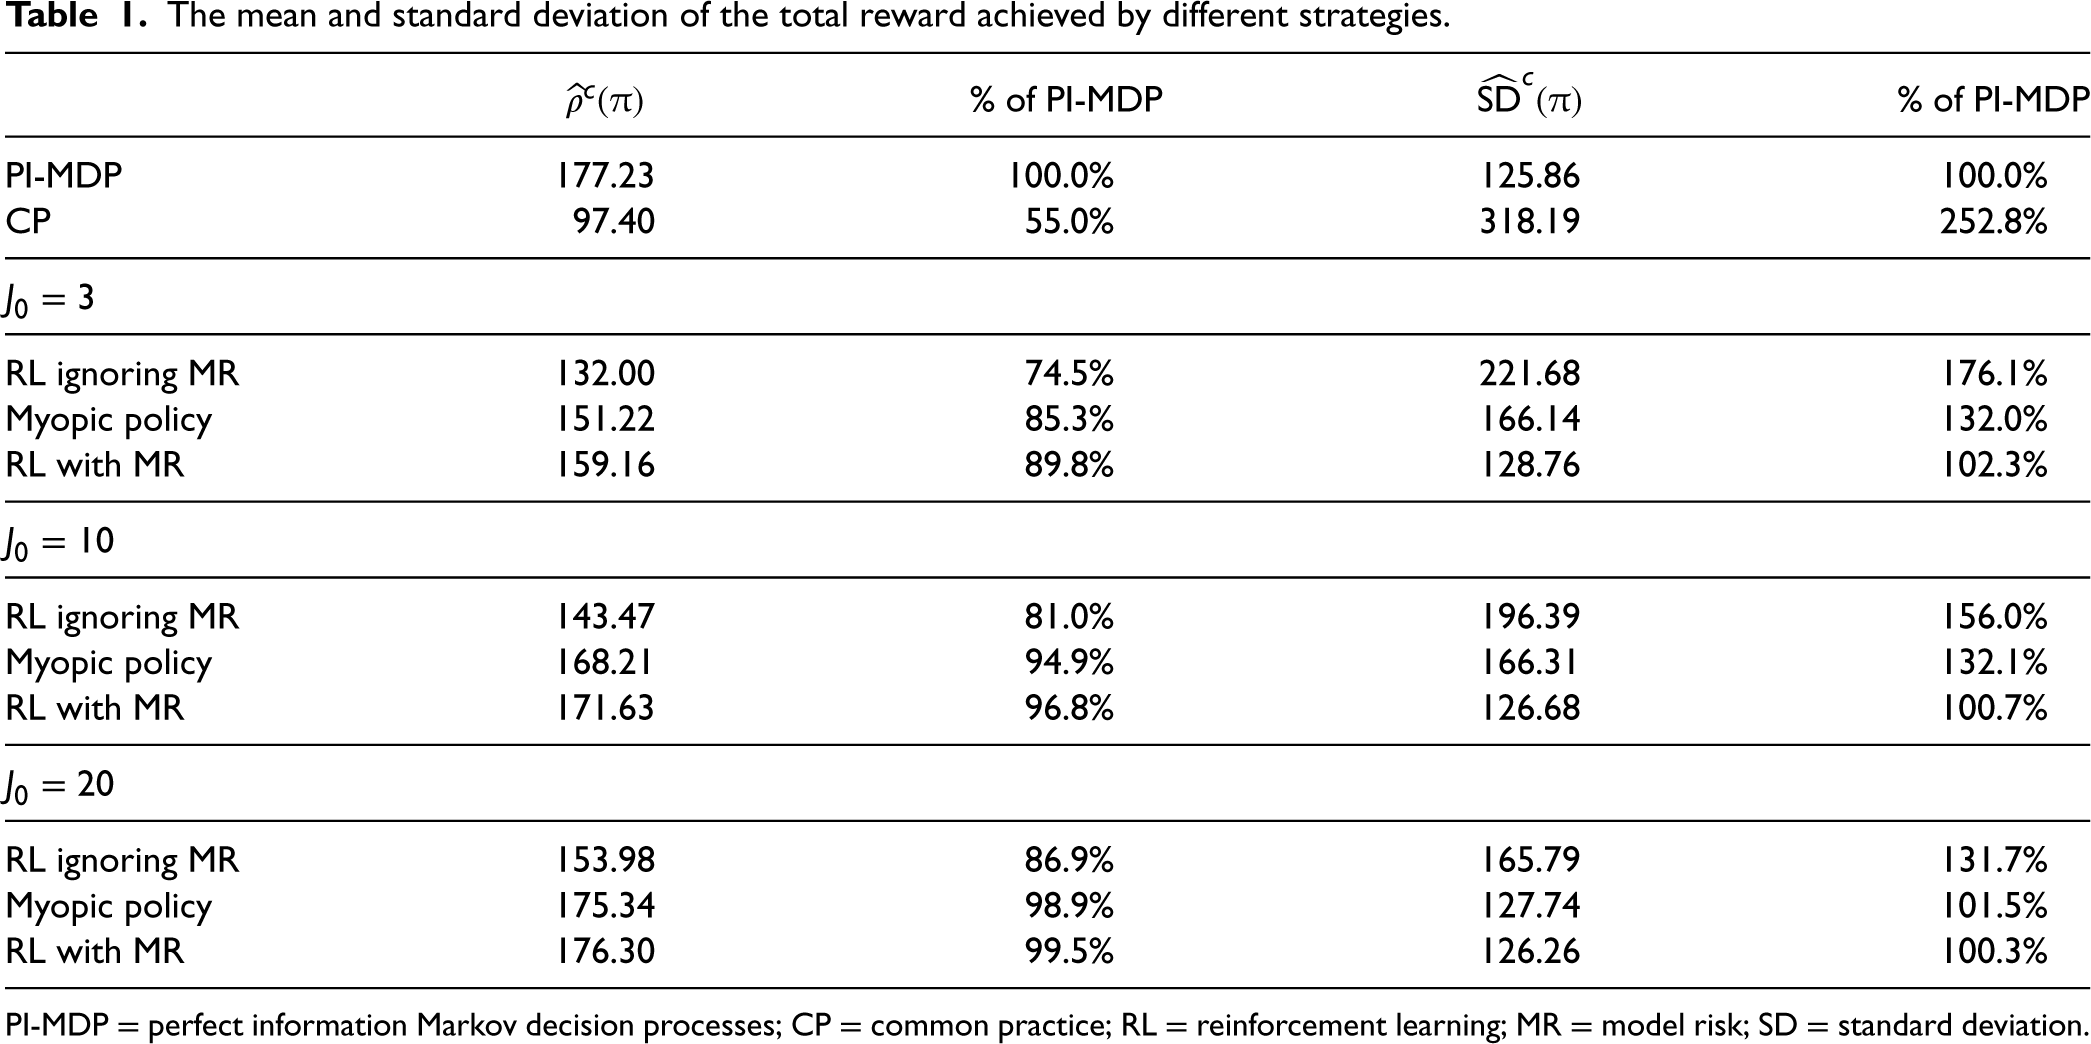
PI-MDP = perfect information Markov decision processes; CP = common practice; RL = reinforcement learning; MR = model risk; SD = standard deviation.
We now evaluate the performance of benchmark strategies described in Section 5.1. In particular, we focus on the expected total reward
We observe from Table 1 that the strategy RL with MR provides substantial benefits (in terms of the performance metrics
Figure 3 provides an analysis of the harvesting times under PI-MDP, CP, and RL with MR strategies to better understand the reason for the performance difference between these strategies. Specifically, we record the decision epoch at which the harvesting decision is realized in each of the 100 simulation replications (similar to obtaining the results in Table 1 as described in Appendix EC.2.2), and we plot the histogram of these realized harvesting decision epochs (recall that the time between two decision epochs is 6 h). As a managerial insight, Figure 3 indicates that the poor performance of the CP strategy in our case study is due to late harvesting decisions, as can be seen by comparing the harvesting decision epochs under CP with those under PI-MDP. This can be explained by the tendency of the CP policy to collect as much protein as possible by ignoring impurity-related costs and failure risk. However, our proposed “RL with MR” strategy takes into account the model risk, and the distribution of harvesting moments becomes similar to that of the PI-MDP, leading to the superior performance of “RL with MR” as observed in Table 1.
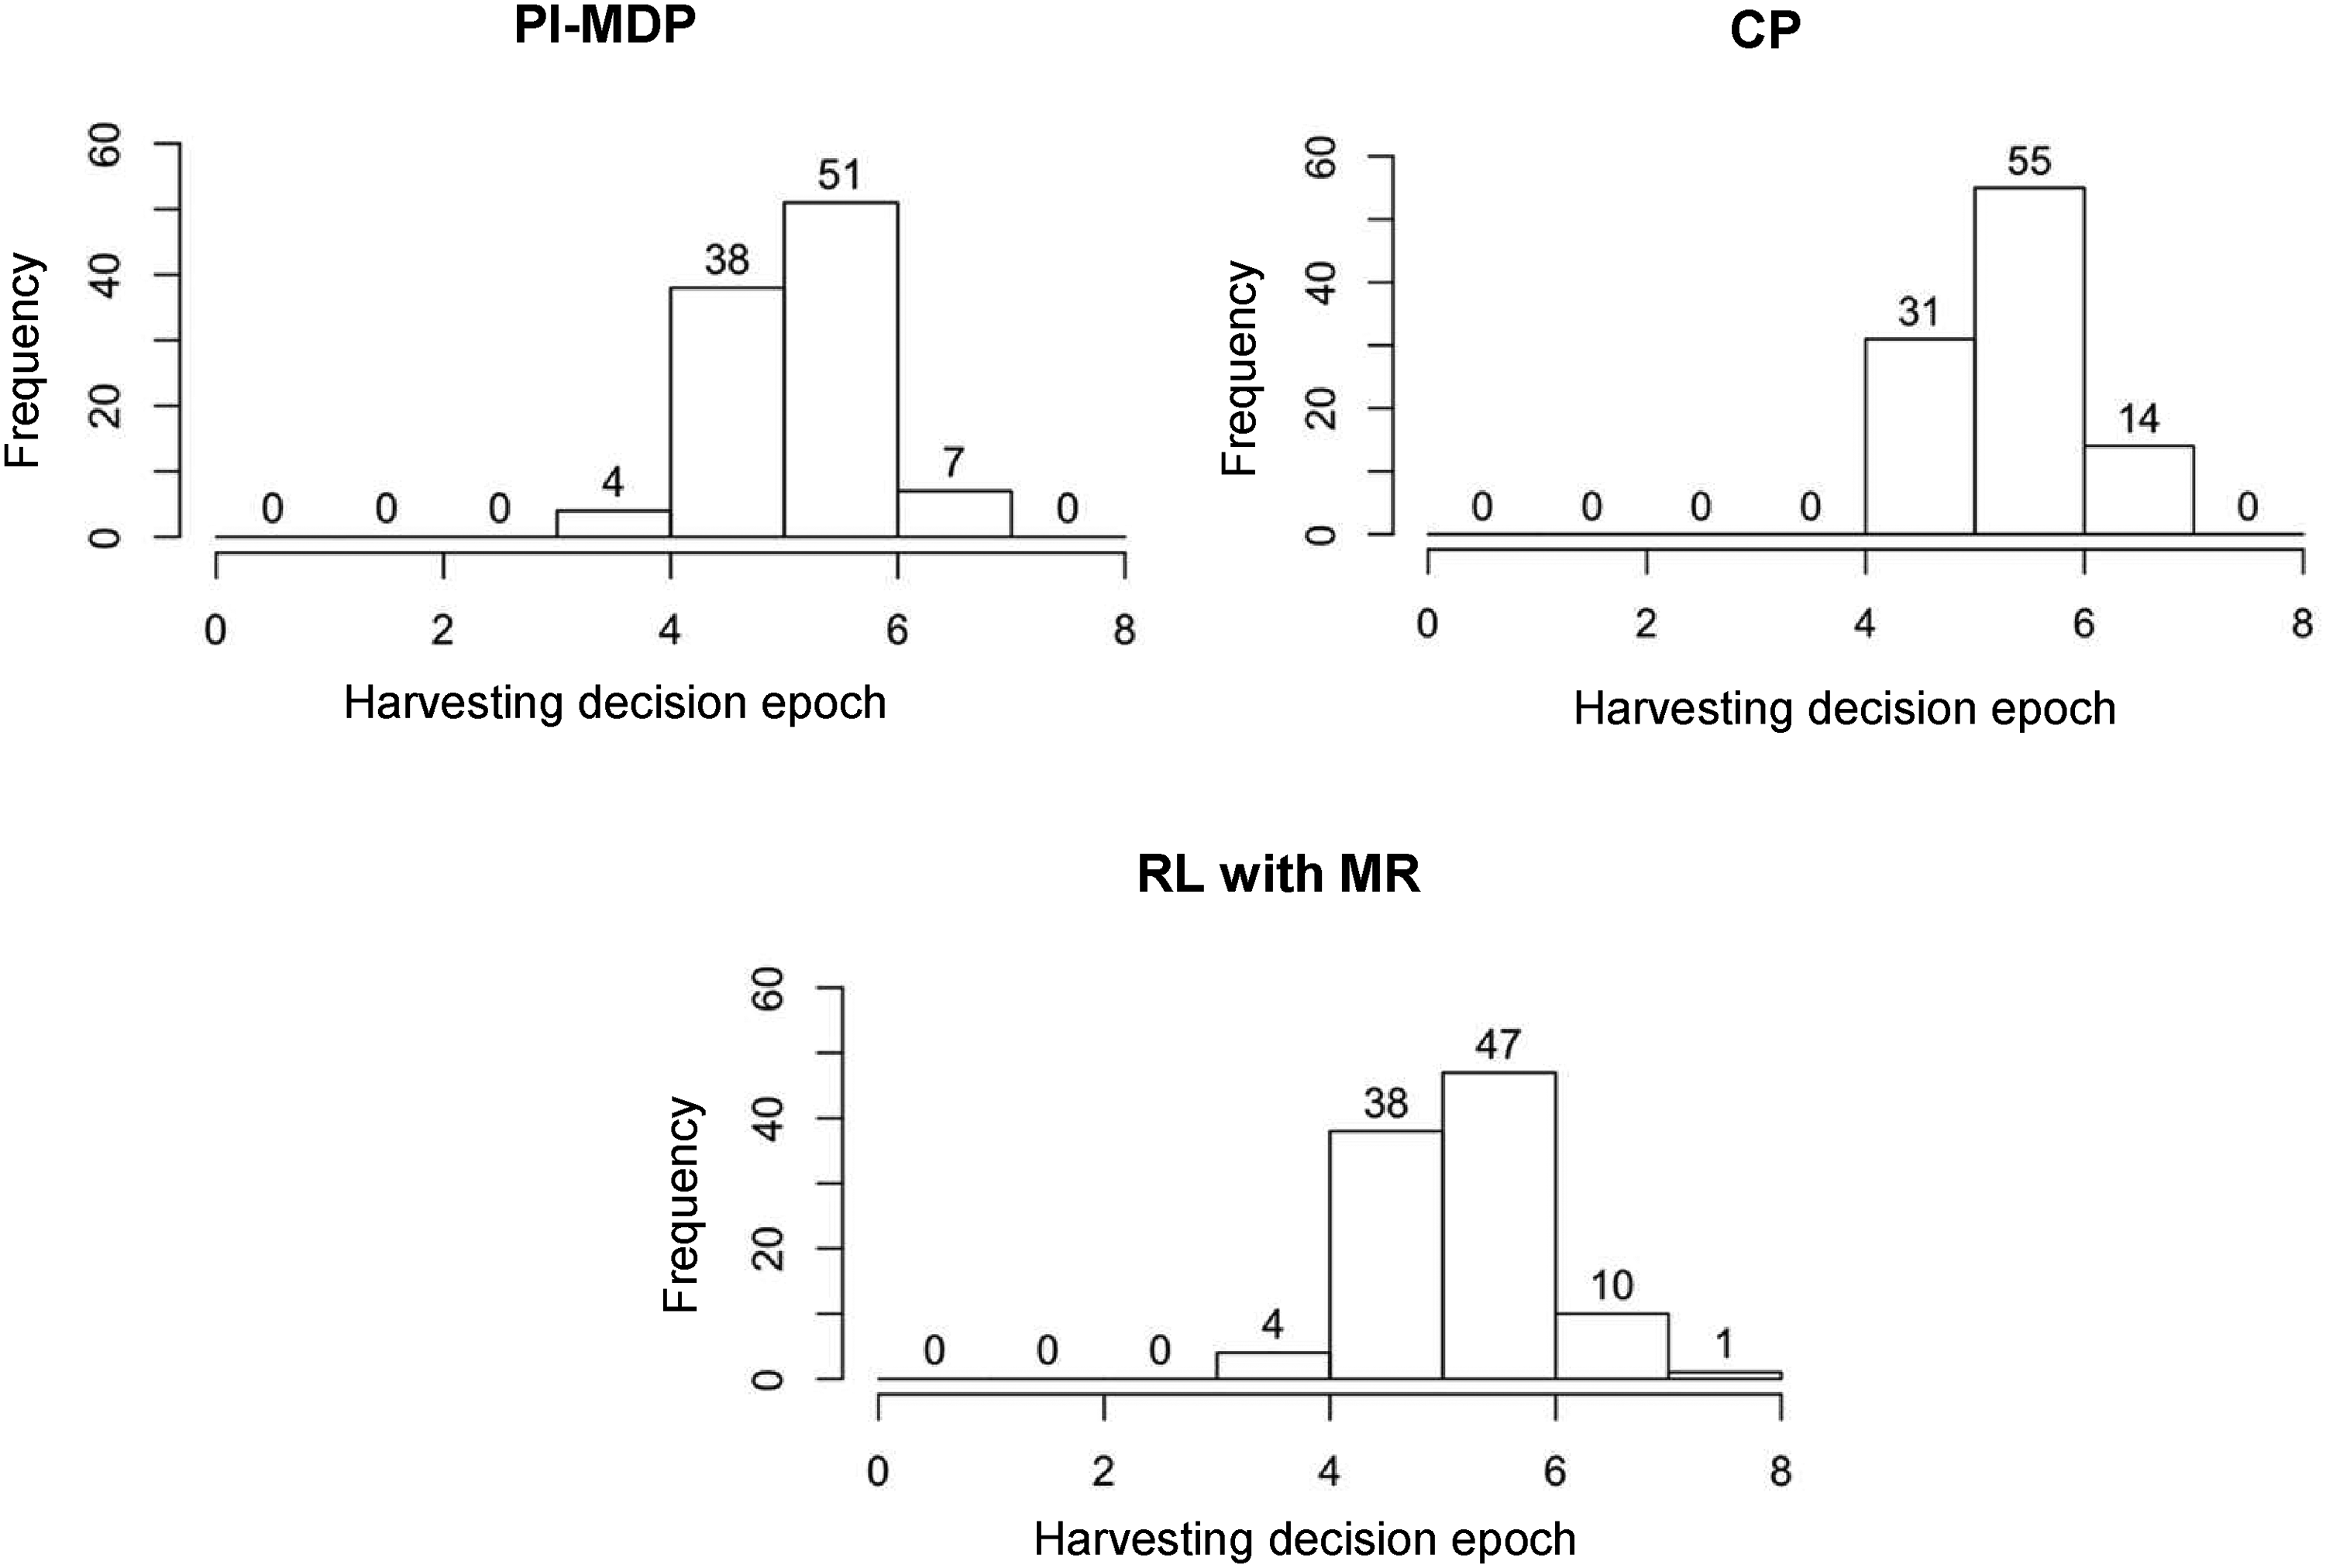
The frequency of the number of decision epochs at which the harvesting decision is made for the case with
We illustrate the impact of model risk on harvesting decisions. For this purpose, our analysis considers two different sizes of historical data,
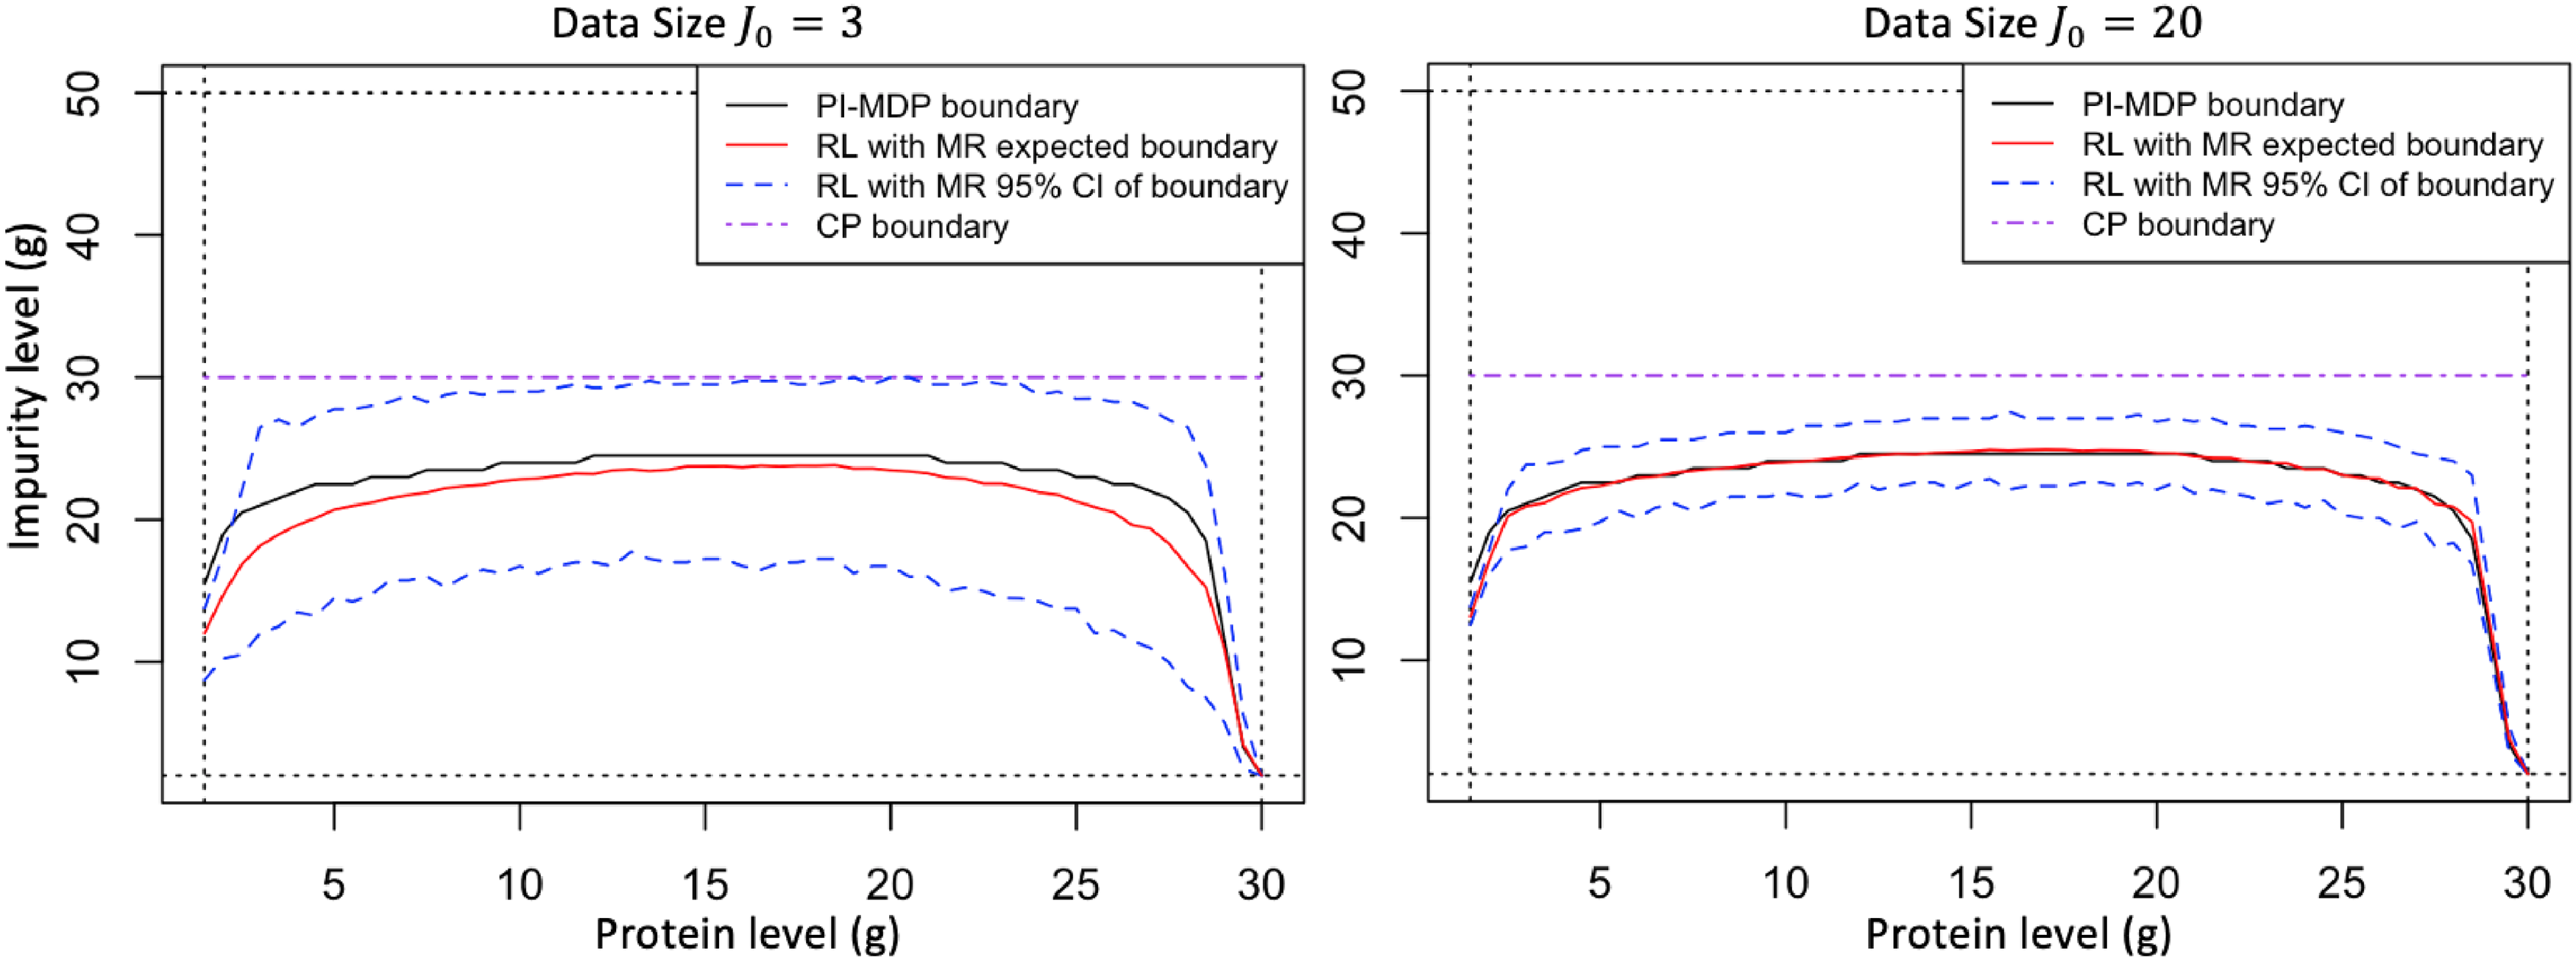
Optimal harvesting thresholds (above curve denotes harvest region) with
Figure 4 indicates how the optimal harvesting threshold moves as the number of historical data
In industrial applications, contextual information may be available either through expert judgments or historical data from similar processes, and this information can provide an informed starting point to build prior information on unknown process parameters. Our results so far assumed non-informative priors when there is no historical data (see Appendix EC.2.1). Considering the availability of historical data of size
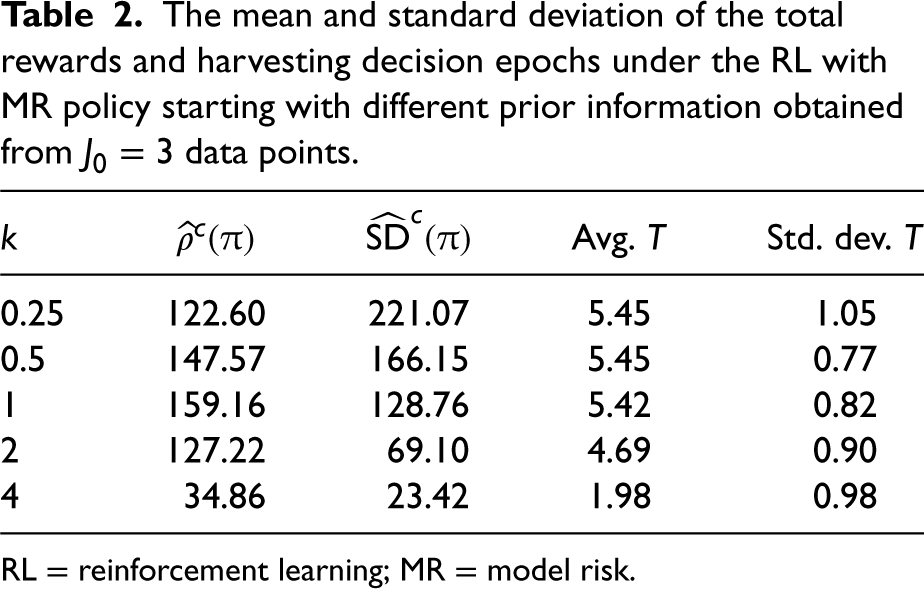
The prior information may not always be an accurate representation of reality, e.g., two fermentation processes that are thought to be similar (e.g., using similar seed cultures) may eventually behave very differently. In Table 2, we investigate how the total rewards and harvesting times would change if the prior information were obtained from historical data generated from another fermentation process with mean protein and impurity growth rates equal to
The mean and standard deviation of the total rewards and harvesting decision epochs under the RL with MR policy starting with different prior information obtained from
data points.
The mean and standard deviation of the total rewards and harvesting decision epochs under the RL with MR policy starting with different prior information obtained from
RL = reinforcement learning; MR = model risk.
Table 2 allows us to understand how the quality of the prior information affects the total rewards and the harvesting times. For example, building the prior by using a data set that comes from a process that has half of the mean growth rates of the current process (i.e.,
We quantify the real-world impact obtained at MSD’s daily operations in Section 6.1 and elaborate on the implementation process in Section 6.2.
Impact
The optimization framework has been implemented at MSD since 2019. The project focused on various products manufactured in Boxmeer and had a significant impact on business metrics. As an example, Figure 5 shows the implementation results for a specific product. The x-axis represents time and the y-axis represents batch yield (the value of y-axis starts from 0, but its scale is not shown for confidentiality reasons). In this figure, “batch yield” represents
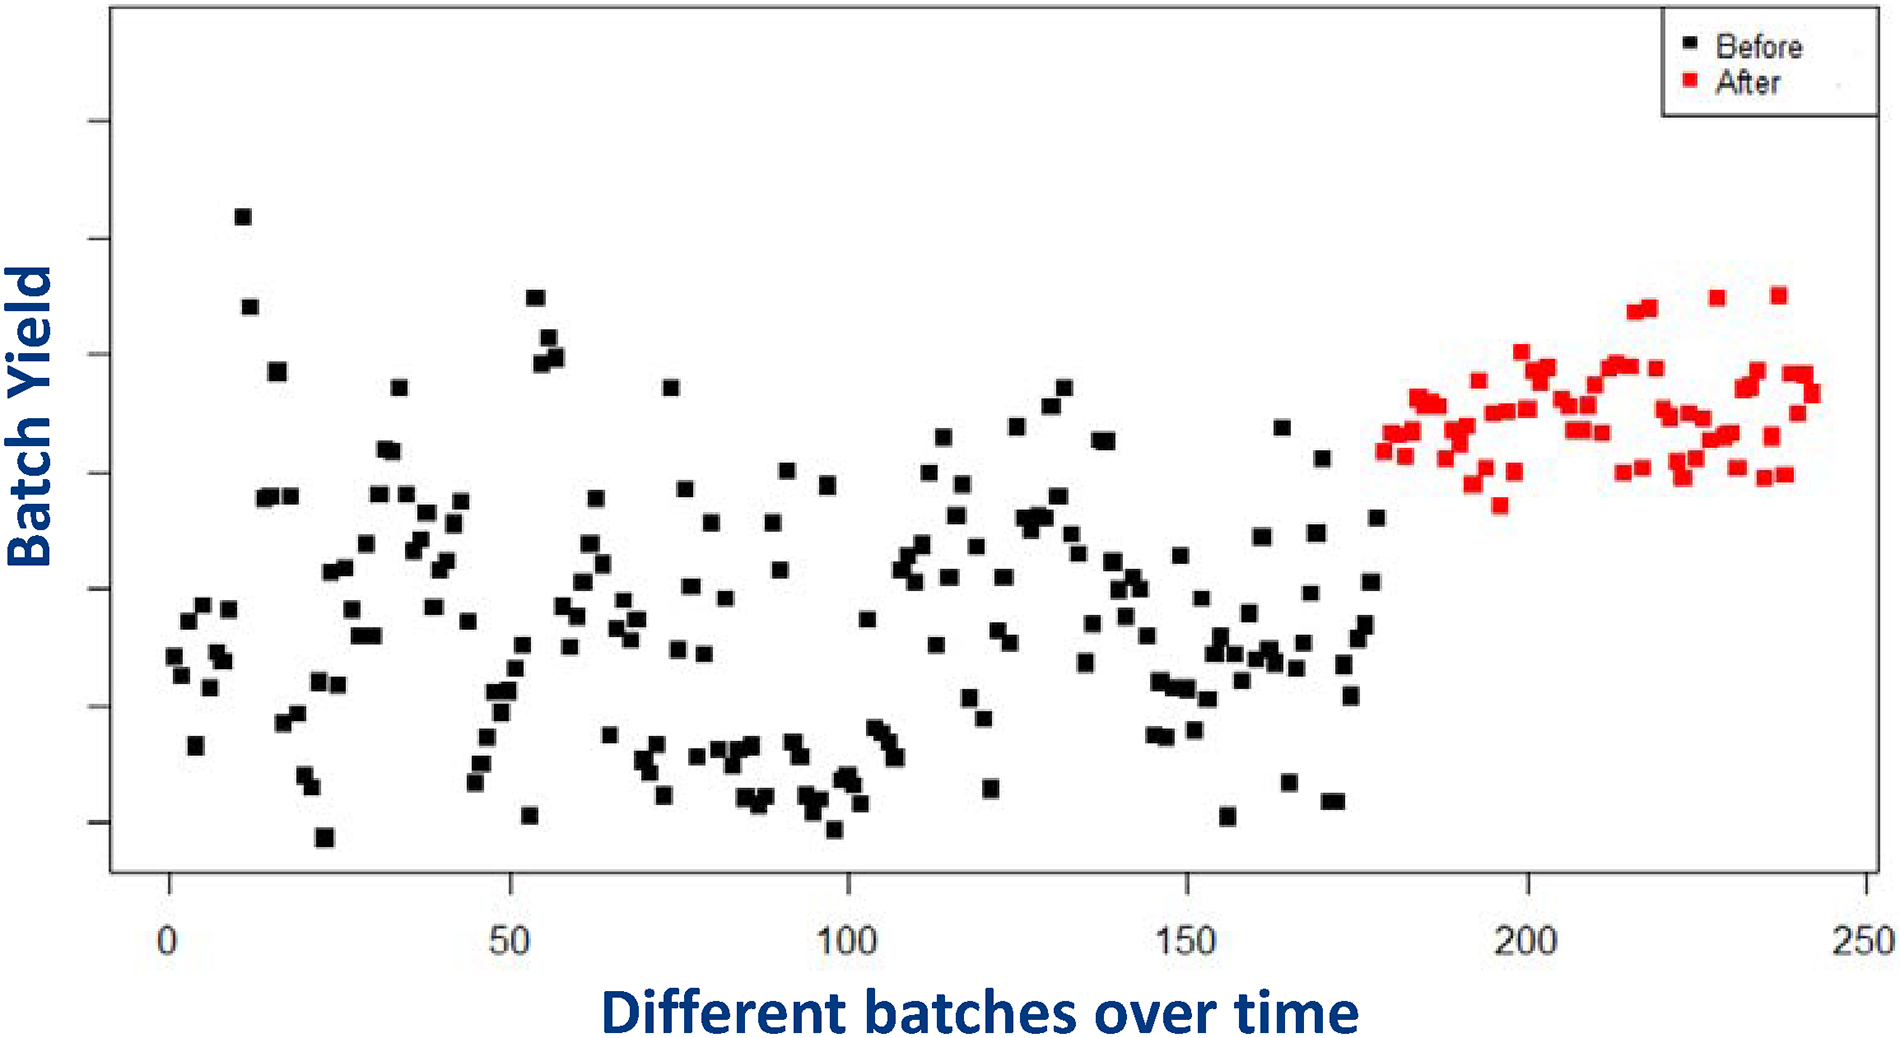
Performance of different batches of the same product produced over time: black dots represent the performance before implementation. Red dots represent the performance after implementation.
Prior to implementation, decisions were made based on domain knowledge and common industry guidelines (e.g., the so-called “common practice” strategy based on fixed thresholds and rules of thumb, as described in Section 5). However, these prior approaches did not systematically exploit any optimization framework. After implementing the OR-based framework, the company was able to make better use of the historical data and dynamically optimize operational decisions.
Recall that Figure 5 illustrates the results obtained for one particular product. We focused on this product due to the availability of a large number of historical data, allowing us to see the benefit gained from the proposed optimization framework when the inherent fermentation uncertainty is more important relative to the model risk. We now present insights based on all products within the scope of the implementation during 2019–2021 (including products with limited data). In this setting, our objective was to quantify the impact of the learning-by-doing framework. For this purpose, we first collected information on the “expected” batch yield (ex-ante) and the “actual” batch yield (ex-post) obtained for each batch produced in 2019–2021. The expected batch yield represents our predicted value of the batch yield under a certain harvesting policy used for that batch; whereas the actual batch yield denotes the realized batch yield at the time of harvest. Then, we calculated the absolute percentage difference (APD) between expected and actual values for each batch (where the denominator captures the expected yield). We defined the measure APD to understand how our prediction capability changed over time as a result of the learning-by-doing framework. For ease of exposition, Figure 6 plots the mean APD values on a monthly basis (i.e., the average of APD values across all batches produced in a certain month). In this figure, the implementation started around January 2019. We see a clear downward trend in Figure 6, indicating that our predictive capability continuously improved after implementing the data-driven decision framework. We quantified the impact in terms of batch yield (rather than financial figures) for confidentiality reasons.
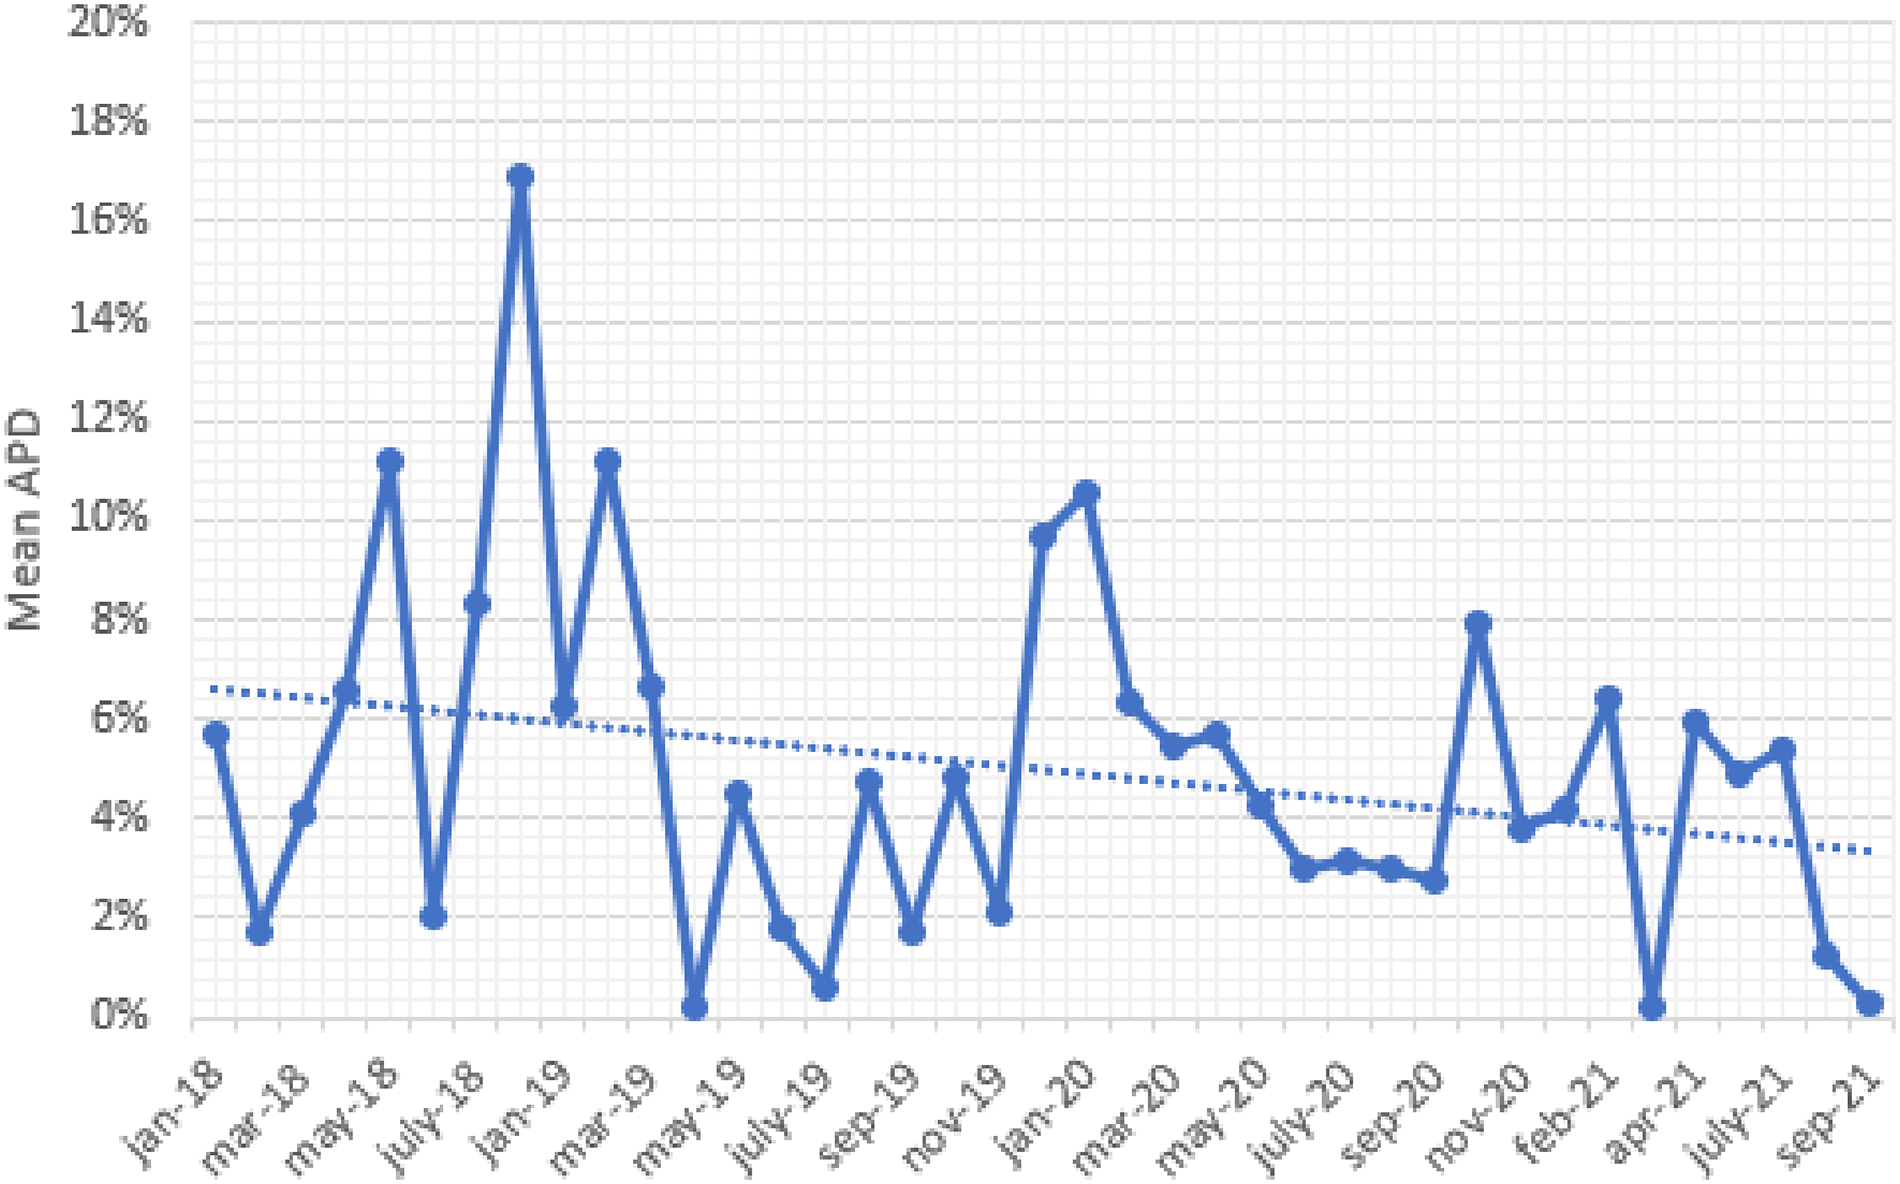
Impact of the learning-by-doing framework across all products considered in the implementation process.
The Team and Project Timeline
The research project has been conducted in close collaboration with a university team and a team of practitioners from MSD in the Netherlands. The university team brought in expertise on operations research, whereas the MSD team provided expertise in life sciences. A multi-disciplinary team from MSD (e.g., bioreactor operators, chemical and biological engineers, and middle/upper management) contributed to the project.
The project went through three major phases: model development, validation, and implementation. The project started in early 2018 with data collection and the development of the optimization framework. Prior to the implementation, the optimization model and the corresponding policies were validated based on (i) discussions with practitioners, and (ii) small-scale test runs. The control-limit structure of optimal policies facilitated these discussions, as these policies were “explainable” and their intuition aligned with the current practice. Following these discussions, small-scale test runs were performed. The results obtained from both computational experiments and real-world test runs established a foundation for industry-scale implementation.
Scope and Aspects Related to Data
The implementation focused on industry-scale production orders with limited historical process data. As a common characteristic, these products were typically high-mix, low-volume batches produced only a few times a year. Moreover, we encountered challenges with limited data when new equipment or raw materials were used. Available data typically involved around
Implementation Challenges
The major challenge in this project was related to data collection. In some cases, data was not available in a digital format. We also encountered a few special cases with no historical data. One of the strengths of the project is its multi-disciplinary approach which combines life sciences and operations research. However, multi-disciplinary projects have their own challenges. For example, the concept of Markov decision processes may be difficult for scientists who have no background in operations research. Similarly, developing a thorough understanding of the fermentation processes was challenging for the university team (with no background in biological and chemical engineering). Therefore, both the university and MSD teams had regular meetings to learn from each other and co-design the model.
It is also important to facilitate the knowledge transfer to other facilities. When the scope of the implementation expands to other facilities in the future, it can be challenging to identify the right products (and facilities) that would obtain the highest benefit from the optimization framework. For this purpose, MSD developed a dashboard that collects information from all batches produced globally. This dashboard reports the APD values of selected batches (as illustrated in Figure 6) from their global network, thereby identifying opportunities for future implementations.
Conclusions
Limitations in historical process data (model risk) are often perceived as a common industry challenge in biomanufacturing. Yet the implications of model risk on optimal costs and harvesting decisions have not been fully understood. Our work provides one of the first attempts at modeling and optimization of fermentation systems under model risk (caused by limited historical data) and inherent stochasticity (caused by the uncertain nature of biological systems).
We developed an MDP model to guide fermentation harvesting decisions under a learning-by-doing framework. In particular, we used a Bayesian approach where the decision-maker sequentially collects real-world data on fermentation dynamics and updates the beliefs on state transitions. As a salient feature, the MDP model combines the knowledge from life sciences and operations research, and is equipped to capture the complex dynamics of fermentation processes under limited data. We studied the analytical properties of the optimal policy and the myopic policy, and characterized the impact of model risk on biomanufacturing harvesting decisions. To illustrate the use of the optimization model, we present a case study from MSD Animal Health. The implementation at MSD has shown that linking operations research with life sciences drives substantial productivity improvements. We hope that our results will inspire the global biomanufacturing industry and stimulate new research at the intersection of operations research and life sciences.
The developed optimization framework is generic and addresses common industry challenges. Therefore, it can be easily implemented at other production lines and facilities. The long-term vision is to encourage the worldwide use of such optimization models at other facilities. Moreover, it will be interesting to explore the potential applications in other industries. For example, the food and agriculture industries face similar challenges and can benefit from the developed optimization model. In addition, future research could explore optimal sampling decisions based on the costs and marginal benefits of additional data collection efforts. Another research direction could extend our framework to continuous-time models to support real-time fermentation decisions.
Supplemental Material
sj-pdf-1-pao-10.1177_10591478241270130 - Supplemental material for Biomanufacturing Harvest Optimization With Small Data
Supplemental material, sj-pdf-1-pao-10.1177_10591478241270130 for Biomanufacturing Harvest Optimization With Small Data by Bo Wang, Wei Xie, Tugce Martagan, Alp Akcay and Bram van Ravenstein in Production and Operations Management
Footnotes
Acknowledgments
This research was funded by the Dutch Science Foundation (NWO-VENI Scheme) and the National Institute of Standards and Technology (Grant nos. 70NANB17H002 and 70NANB21H086). We would like to thank the Master’s students Thijs Diessen and Len Hermsen for their assistance during the project.
Declaration of Conflicting Interests
The author(s) declared no potential conflicts of interest with respect to the research, authorship, and/or publication of this article.
Funding
The author(s) received no financial support for the research, authorship and/or publication of this article.
Notes
How to cite this article
Wang B, Xie W, Martagan T, Akcay A and Ravenstein Bv (2024) Biomanufacturing Harvest Optimization With Small Data. Production and Operations Management 33(12): 2381–2400.
References
Supplementary Material
Please find the following supplemental material available below.
For Open Access articles published under a Creative Commons License, all supplemental material carries the same license as the article it is associated with.
For non-Open Access articles published, all supplemental material carries a non-exclusive license, and permission requests for re-use of supplemental material or any part of supplemental material shall be sent directly to the copyright owner as specified in the copyright notice associated with the article.