It is a common practice that business and economy compartments share the seating capacity of a short or medium-haul European flight, with the middle seats in the business compartment kept vacant to enhance comfort and privacy for business passengers. The two compartments are separated by a movable curtain whose position determines the capacity allocated to each compartment. By postponing the decision on curtain position until departure, airlines gain extra flexibility in their capacity allocation. We formulate an airline’s problem of dynamically determining the curtain position and the subset of fare products to offer in each compartment to maximize the combined revenue from business and economy passengers. We show that the airline should offer a business (resp., economy) fare product if and only if its fare exceeds a business (resp., economy) threshold or bid price. We then establish monotonicity properties which are useful in expediting the computation of the optimal policy. An extended model where the airline has the option to offer a free upgrade (from economy to business class) to a new arriving economy passenger is presented, and a necessary condition on when to offer upgrades is provided. Using a large-scale and real-life case study based on a proprietary dataset, we demonstrate significant revenue improvements from postponing the decision on curtain position, compared to the current practice of fixing it at the beginning of the booking horizon. Furthermore, we provide guidance for the implementation of our policy, taking into account passengers’ seat selection and substitution towards lower fare classes. We also discuss the implications of our work in practice.
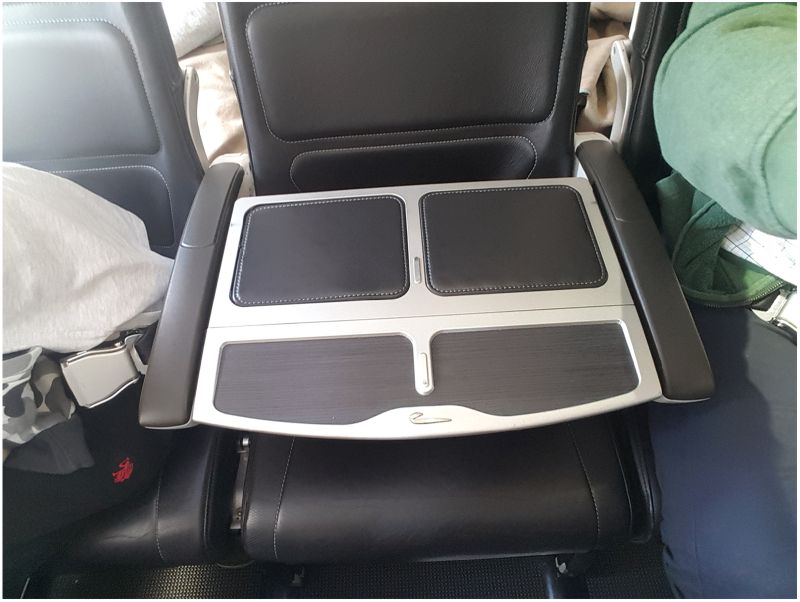
A distinguishing feature of business airfare from economy airfare on short or medium-haul flights of major European airlines (e.g., British Airways, Air France, and Lufthansa) is the guaranteed empty middle seat between aisle and window seats, offering business passengers an enhanced level of comfort and privacy. In addition, these airlines offer superior amenities to business passengers, such as enhanced food and drink options, increased baggage allowances, and priority check-in and boarding. It should duly be noted that there is no inherent physical difference between individual business and economy class seats. That is, all seats have the same comfort level regardless of the class designated for them. What elevates the comfort level of business class seating above that of economy class seating is the additional space provided by the absence of middle-seat passengers. Such seating provides extra room for working and relaxing, plus a guaranteed window or aisle seat. Figure 1 shows the seats in British Airways European business class (i.e., Club Europe), where each middle seat is blocked out with a tray table. A movable curtain partitions business and economy classes.1 The movable curtain is attached to the aircraft ceiling and overhead bins such that it can slide back and forth with ease.
Blocked middle seat in the business class of an Istanbul–London flight.
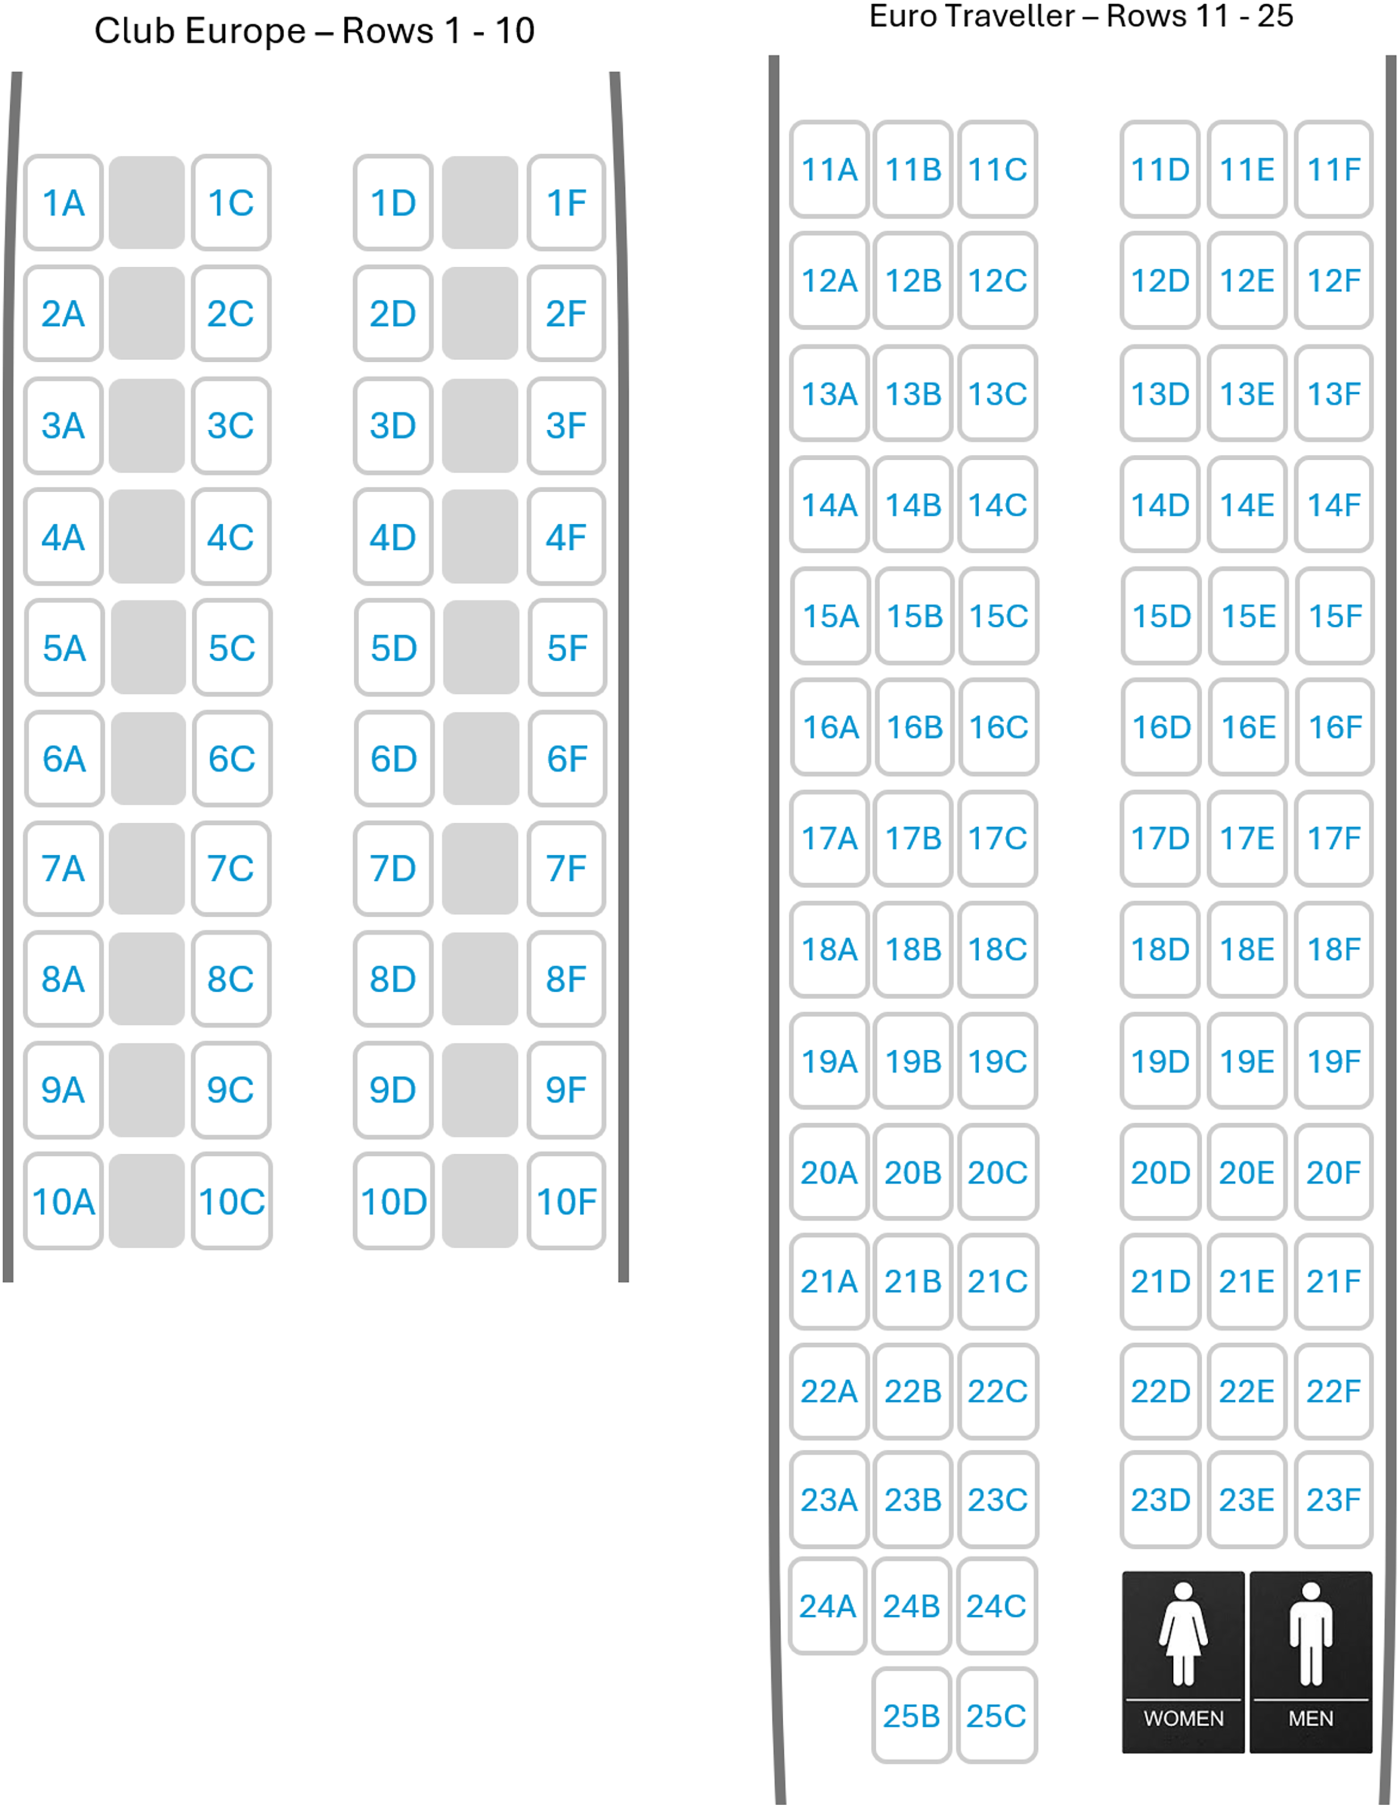
The seat configuration of a British Airways aircraft deployed for short or medium-haul routes is depicted in Figure 2. The middle seats in the business class from row 1 to row 10 are indicated to be empty. Therefore, each row can sit six economy passengers and only four business passengers. The movable curtain is to be placed right behind row 10 and its position determines the seating capacity of business and economy classes. Seats in row 11 are currently economy seats but they can be easily converted to business seats. Such a conversion involves two simple steps of installing tray tables to block middle seats in row 11 and sliding the movable curtain back by one row. These conversion steps and their reversed counterparts (i.e., to convert business seats to economy seats) require no special tools and can be performed quickly by the flight crew, in particular immediately before boarding.
Seat configuration of British Airways Airbus A319.
To avoid confusion in the sequel, we reserve the term class for fare classes and use the term business and economy compartments for the rows respectively accommodating business and economy seats. A compartment of each flight caters to multiple fare classes differentiated by prices and conditions (e.g., refundability or baggage allowance), and airlines dynamically determine the subset of fare classes to offer in each compartment. In practice, there can be hundreds of fare classes available to offer in each compartment.
Traditionally, the curtain position is fixed at the beginning of the booking horizon and remains unaltered throughout the horizon. We refer to this as a fixed-curtain implementation under which the capacity of each compartment is determined before any seats are sold. Unlike the fixed-curtain implementation, the movable-curtain position can be determined at the end of the booking horizon based on the realized business and economy sales. Postponing the decision on curtain position until boarding provides extra flexibility for airlines in their capacity allocation throughout the booking horizon. As such, the capacity of a flight is shared by the business and economy compartments, and seats can be allocated to each compartment as needed. This movable-curtain implementation only requires (un)installing tray tables and sliding the movable curtain back and forth before boarding.
We consider an airline selling multiple fare products in business and economy compartments that share the capacity of a flight. The airline dynamically determines the subset of fare products to offer in each compartment to maximize the combined revenue from both. If any seat in a row is allocated to the business (resp., economy) compartment, then the entire row will be allocated to that compartment. That is, the seating capacity is allocated to the two compartments by rows. We call a row allocated to the business (resp., economy) compartment a business (resp., an economy) row. In practice, business and economy rows are located at the front and back of the aircraft, respectively. We refer to the number of seats remaining in business (resp., economy) rows as the business capacity (resp., economy capacity) and the number of empty rows remaining as the shared capacity.
We now provide an overview of our analysis. The first step is to formulate a dynamic program (DP) to obtain the optimal policy for the airline to maximize the expected revenue from both business and economy passengers (Section 2.1). We show that the optimal policy is a bid price control (Section 2.2): there exists a business (resp., economy) bid price such that a business (resp., economy) fare class is offered for sale if and only if its fare exceeds the business (resp., economy) bid price. We also analyze the monotonicity properties of the optimal policy. Next, we consider an extended model in which the airline has the option to offer a free upgrade (to business class) to an arriving economy customer and provide a necessary condition on when to offer upgrades (Section 3). Section 4 provides guidance for the implementation of our policy in practice and Section 5 discusses more applications of flexible capacity management. In Section 6, we quantify the benefits of the flexibility in capacity allocation obtained from postponing the decision on curtain position and upgrading with a case study involving a large-scale and real-life dataset from an airline. In Section 7, we conclude our work and discuss the implications to practice.
Our Contributions: To our knowledge, our work is the first to introduce the movable-curtain setting and to study a single-leg flight’s dynamic seat-allocation and upgrading problem in which the flight capacity is shared by business and economy compartments. This problem involves the determination of fare classes to offer to business and economy passengers. We derive an optimal solution to this practical and important problem and analyze structural properties of the optimal policy. We show that it is optimal to offer more economy (resp., business) fare classes when there is more business (resp., economy) or shared capacity remaining. We also show that upgrades can be optimal to offer only when the economy row has no vacancy. These properties are useful in expediting the computation of the optimal policy. Furthermore, unlike the classic result in a single-compartment model (Talluri and Van Ryzin, 2004), we find that the number of fare classes to offer in each compartment is not monotone with respect to the remaining capacity in that compartment or the remaining time.
We address two challenges faced by airlines in the implementation of our policy in practice. First, we provide a guidance for the implementation of our policy while taking into account the seat selection service offered by airlines. Second, we illustrate that substitutable demand, where customers buy down to the lowest available class, can be incorporated into our model by applying a fare transformation known as marginal revenue transformation.
We use a real-life case study and a proprietary dataset to demonstrate the benefit of the flexibility in capacity allocation. Compared to the fixed curtain implementation, movable curtain strategy increases the expected revenue by on average and in some cases; these figures are considered substantial improvements in the airline industry. Finally, we explain how our proposed policy can be integrated into the existing revenue management (RM) systems deployed at airlines and discuss the implications of our work to practitioners.
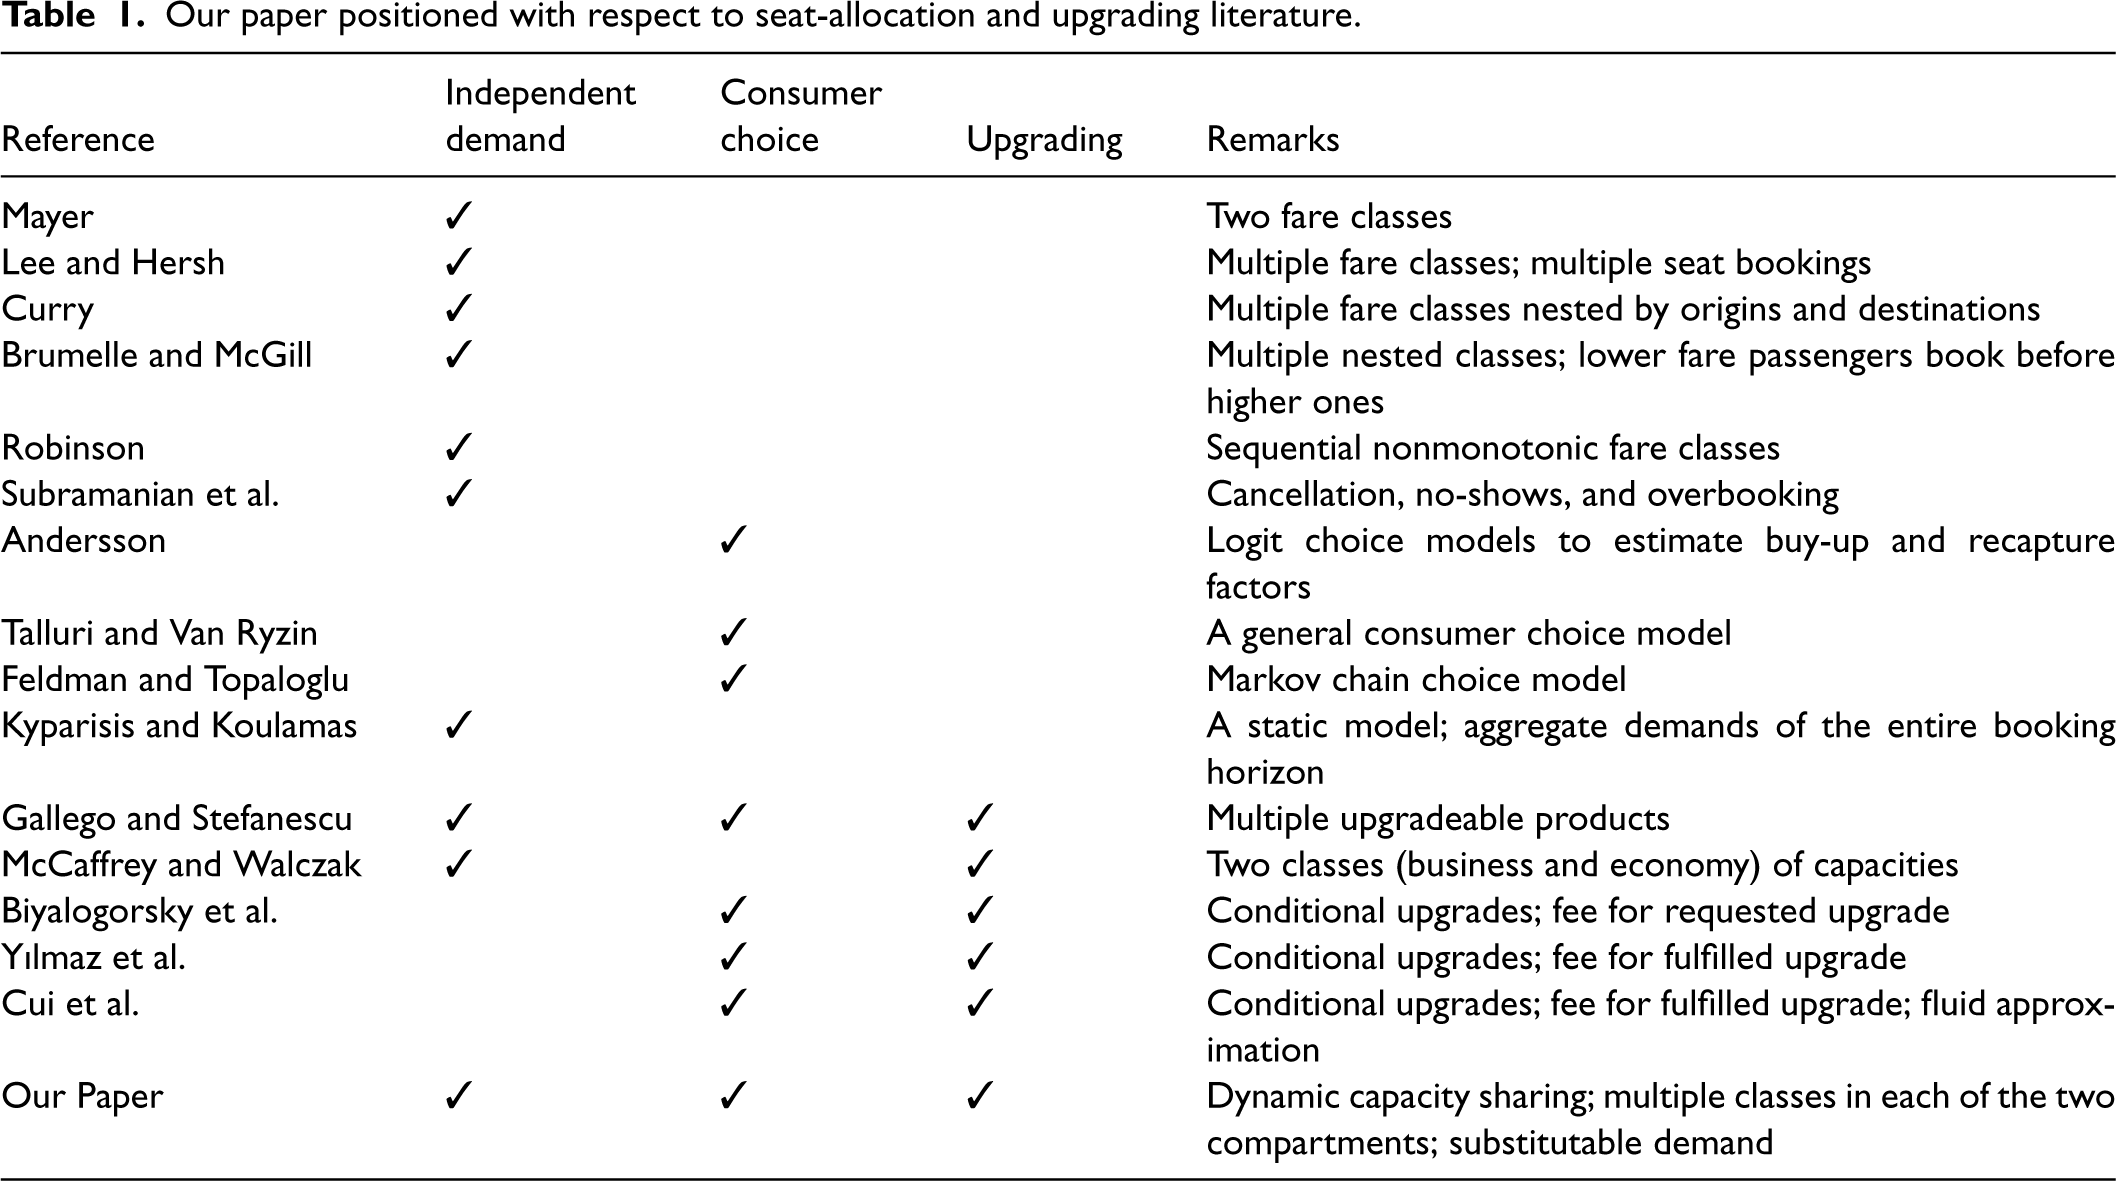
Literature Review: This article falls within the vast literature on RM. We refer the reader to Bitran and Caldentey (2003), Talluri and Van Ryzin (2004), and Chen and Chen (2015) for a comprehensive review. In particular, our work is closely related to the dynamic seat-allocation problem for a single-leg flight. We briefly summarize a few representative papers in this literature. Mayer (1976) studied a dynamic-programming model for setting booking limits for two fare classes. Lee and Hersh (1993) considered a multi-class dynamic seat-allocation model assuming independent demands across fare classes. They show that the optimal policy is a threshold policy; that is, a fare class is offered if and only if its fare price is no less than the marginal revenue of a seat. For further work on single-leg allocation problems with independent demand, see Curry (1990), Wollmer (1992), Brumelle and McGill (1993), Robinson (1995), and Subramanian et al. (1999). Andersson (1998), Talluri and Van Ryzin (2004), and Feldman and Topaloglu (2017) analyzed the single-leg RM problem in which they explicitly model consumers’ choice behavior. Kyparisis and Koulamas (2018) considered a two-cabin problem in which there is a flexible partition of the business and economy cabins. However, they consider a static model where the cabin partition and fare prices are determined at the beginning of the booking horizon and fixed throughout the horizon. Instead, we dynamically determine the fare classes to offer to each cabin, and the cabin partition is determined at the end of the booking horizon based on realized demands. Table 1 distinguishes our work from that of the extant literature that studies seat-allocation policies. To our knowledge, ours is the first study to derive an optimal seat-allocation policy for a flight where its capacity is dynamically shared by two compartments.
Our paper positioned with respect to seat-allocation and upgrading literature.
Conditional upgrades; fee for fulfilled upgrade; fluid approximation
Our Paper
Dynamic capacity sharing; multiple classes in each of the two compartments; substitutable demand
Our work incorporates an upgrade option for economy passengers and thus is naturally related to the literature on upgrading in RM. Gallego and Stefanescu (2009) studied both free and paid upgrades based on a fluid model. McCaffrey and Walczak (2016) investigated a free upgrading problem in a flight with two classes (business and economy) of capacities. Çakanyıldırım et al. (2023) studied the problem of dynamic pricing and timing of upgrades between booking and check-in times. They show that the optimal policy is of a pulsing type, that is, the firm should either offer upgrades up to the maximum capacity or not offer upgrades at all. In the presence of strategic customers, Biyalogorsky et al. (2005), Yılmaz et al. (2017), and Cui et al. (2018) studied the conditional upgrades which are offered at the booking time and fulfilled at check-in if higher-quality or premium products are still available at an upgrade fee. Our work contributes to this literature by studying upgrades in a capacity sharing context. Table 1 positions our paper within the upgrading literature.
Several papers in the upgrading literature evaluate the value of capacity flexibility obtained from upgrades (e.g., McCaffrey and Walczak, 2016; Yılmaz et al., 2017; Cui et al., 2018). For instance, Yılmaz et al. (2017) examined the benefit of offering conditional upgrades under different conditions. They show that conditional upgrades can be used for price discrimination when consumers are myopic, and the benefit of conditional upgrades is significantly diminished when consumers are strategic. Cui et al. (2018) find that conditional upgrades create value by improving the demand-supply matching. Firms can use conditional upgrades to flexibly manage capacity allocations and improve demand segmentation by inducing more consumers to prefer premium products. The implementation of upgrades creates capacity flexibility, as the premium capacity can be used to relieve the pressure on the capacity of standard products. In contrast, within the context of our movable curtain strategy, the capacity is shared by business and economy compartments. This shared capacity can cater to the demand of both compartments, thereby offering additional flexibility in capacity allocation beyond that provided by upgrades.
Base Model of Movable-Curtain Context
We introduce the base model in which an airline dynamically determines the set of fare classes to offer during the booking season and then accordingly selects the curtain position shortly before the departure. In Section 2.1, we formulate the DP to characterize the optimal policy for determining the fare classes to offer in real time. In Section 2.2, we derive the structure of the optimal policy and examine the associated monotonicity properties.
Dynamic Programming Formulation
Consider an airline that sells both business and economy products (seats) on a single-leg flight over a finite booking horizon. There are business fare classes and economy fare classes. We assume that all fare-class demands are mutually independent. Note that in Section 4.2, we will consider consumer choice behavior.
A booking horizon consists of discrete time periods, where the length of a period is sufficiently small so that at most one customer arrives in one time period. This Bernoulli arrival process with at most one customer arrival per period is widely used in airlines’ RM practice (Talluri and Van Ryzin, 2004), which is related to merging/splitting and discretizing Poisson processes. If we consider the customer arrival process as a (continuous-time) Poisson process, then the Bernoulli process can be viewed as the discrete time version of the Poisson process. When the number of periods in a fixed and finite booking horizon approaches infinity, the Bernoulli process converges to the Poisson process (Barbour and Hall, 1984; Ruzankin, 2004). Let denote the period of a season. Let and denote the price of a business class- ticket and the price of an economy class- ticket in period , respectively. Without loss of generality, we assume and .2 In period , a business class- customer arrives with probability , and an economy class- customer arrives with probability . When a business class- (resp., economy class-) customer arrives in period , if this fare class is available, then the customer pays the corresponding fare (resp., ) and reserves a seat of that class. Otherwise, the customer leaves without a purchase. At the end of the booking horizon, a movable curtain is installed according to the realized business and economy sales. Therefore, each row of seats can only be allocated to one of the two (business and economy) compartments. We assume that the front rows are allocated to the business compartment and the back rows are allocated to the economy compartment. Note that there must be an empty seat next to each business passenger. Therefore, a “business” row offers fewer available seats for sale than an “economy” row. Let and denote the number of available seats in a business row and an economy row, respectively, where . Let denote the total number of rows.
The state in a period is the remaining capacity of the flight at the beginning of that period. Let denote the number of remaining empty rows (i.e., not assigned to any compartment) in period . In each period, there is at most one row designated to accommodate business reservations. Therefore, a business row is uniquely identifiable, if it exists, in each period. Similarly, an economy row is uniquely identifiable in each period. Let and denote the number of remaining seats in the business row and economy row in period , respectively. Then the state in period is the vector , and the state in period is . We refer to (resp., ) as the business (resp., economy) capacity in the sense that these seats can only be allocated to business (resp., economy) customers and as the shared capacity. Given state in each period , the airline determines the set of fare classes to offer in that period to maximize its expected revenue over the periods. Example 1 below illustrates the problem and our model set up.
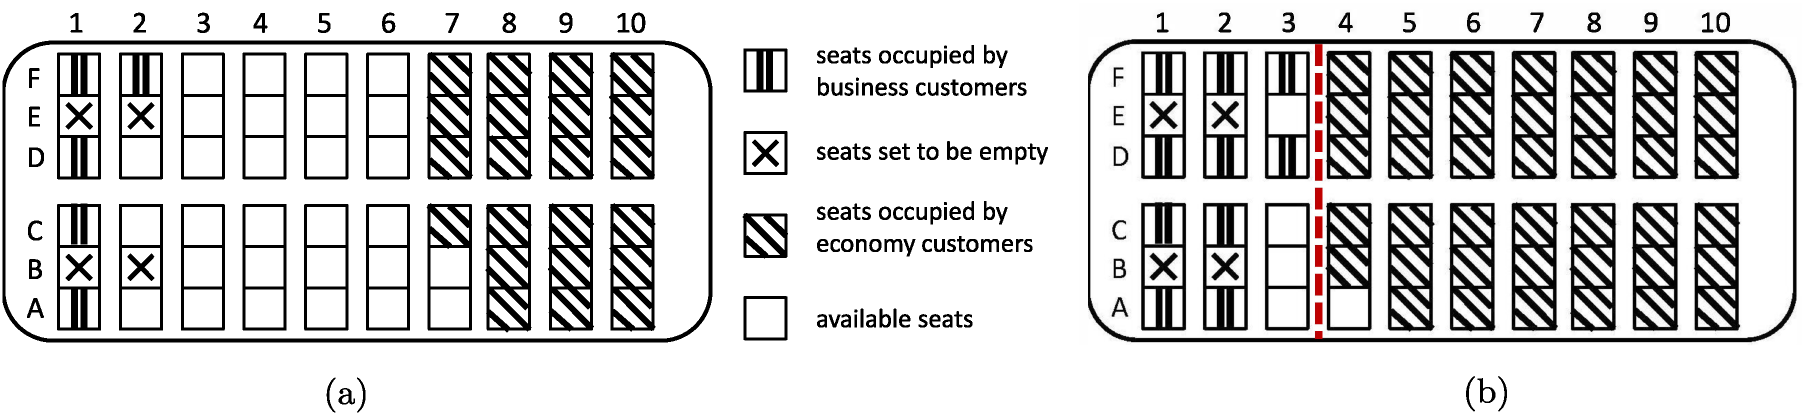
The seating layout of a flight is shown in Figure 3(a). There are 10 rows in the flight, that is, . Each row has six seats, and thus, . If a row is allocated to the business compartment, then the middle seats are set to be empty, and thus, .
Remaining capacity at two time epochs. Curtain position indicated by the dashed vertical line between rows 3 and 4 is fixed at the end of the booking horizon: (a) at the beginning of period ; (b) at the end of the booking horizon.
Figure 3(a) shows the remaining capacity of the flight in period . Note that there are four empty rows (not assigned to any compartment) remaining, three seats remaining in business rows, and two seats remaining in economy rows. Thus, the state in period is . Given this state, the airline determines the set of fare classes to offer to maximize its expected revenue. Note that in each period, there are possible subsets of fare classes to offer. Figure 3(b) shows the remaining capacity of the flight at the end of the booking horizon. Thus, a movable curtain for separating the business and economy compartments is installed between rows 3 and 4.
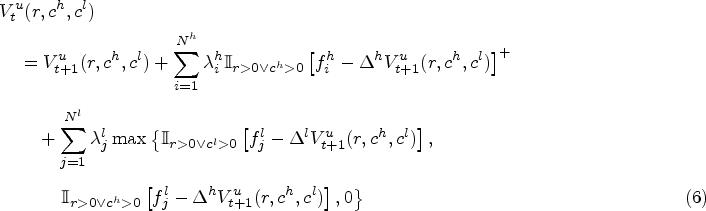
We now formulate the airline’s revenue maximization problem as a dynamic program (DP). In the sequel, we will drop the time index when there is no ambiguity in doing so. Let denote the optimal revenue-to-go function of the DP in state and period . Let the state space be
where is a binary variable taking the value of 1 only when is true. Then, for and , satisfies the following recursion:
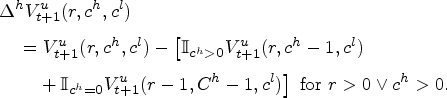
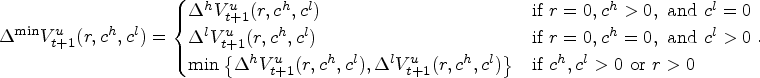
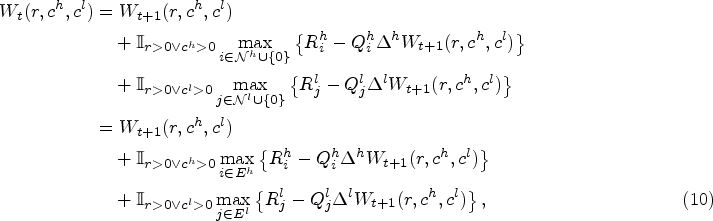
where is the logical OR symbol. is true if and only if or (or both) are true. For , . Note that when and in period , then a new arriving business customer will be allocated to a seat in a new row if her preferred fare class is offered, and that row will be assigned to the business compartment. Thus, the state in period is . Similarly, for and , if a new arriving economy customer is allocated to a seat in period , then the state in period is . Let the marginal values of a business seat and an economy seat be
respectively. Next, we derive the optimal policy for dynamically determining the set of fare classes to offer.
Optimal Policy Structure
For and , equation (1) can be equivalently written as
Thus, it is optimal to offer a business fare class (resp., an economy fare class ) if and only if (resp., ). In other words, the optimal control policy is a bid price control: there exists a threshold (bid) price (depending on the remaining time and capacity) for each compartment such that a fare class is offered for sale if and only if its price exceeds the threshold price. Recall that and . Let and denote the maximum indexes of the business and economy classes to offer, respectively. Then, we have
and
where (resp., ) means no business (resp., economy) class is offered. The proofs of the technical results are in the E-companion.
It is optimal to offer business classes and economy classes 3 in period . In addition, decreases in and decreases in .
Note that and are also the numbers of business classes and economy classes to offer, respectively. Next, we establish the monotonicity of the marginal value of a business (resp., economy) seat (resp., ) with respect to the economy (resp., business) capacity (resp., ) and the shared capacity in Lemmas 1 and 2. These properties lead to the structural property of the optimal policy in Proposition 2. With a minor abuse of notation, we let and . That is, having seats in a business row implies that the row is unoccupied and can be allocated to either of the two compartments. Thus, the number of empty rows is and business capacity is . Similarly, corresponds to state .
is submodular in and , i.e., for in period ,
Lemma 1 implies that and . That is, the marginal value of a business (resp., economy) seat is decreasing in the remaining economy (resp., business) capacity. If we keep increasing (resp., ) in (resp., ), then we obtain the next result on decreasing marginal value of a seat in the shared capacity.
For in period , we have and .
Recall from Proposition 1 that the optimal set of business classes to offer is , and the optimal set of economy classes to offer is . Proposition 1 and Lemmas 1 and 2 together imply the following result.
In any period , increases in the shared capacity and the economy capacity , and increases in the shared capacity and the business capacity .
Proposition 2 characterizes the impact of the remaining capacity on the optimal policy. For a fixed business capacity, when there is more economy capacity or shared capacity which can be used to meet the economy demand, it is more likely that we will have more capacity remaining to meet the business demand. Therefore, it is optimal to open more business classes. Similarly, when there is more business capacity or shared capacity, it is optimal to open more economy classes.
Next, we examine how (resp., ) changes with the remaining time and the business capacity (resp., economy capacity). In the canonical single-compartment setting with no capacity sharing, the number of fare classes offered is increasing in the remaining capacity and decreasing in the remaining time since the marginal value of a seat decreases in the remaining capacity and increases in the remaining time. However, when capacity sharing is allowed, as in our model, Example 2 below illustrates that the marginal value of a business (resp., economy) seat is not monotone with respect to the remaining business (resp., economy) capacity or the remaining time. Hence, it is not always optimal to offer more business (resp., economy) classes when there is more remaining business (economy) capacity or less remaining time. This is because the “row” constraint—once a seat in a row is assigned to the business (or economy) compartment, then all the seats in that row are assigned to that compartment—creates a combinatorial (bin-packing) phenomenon in allocating capacity.
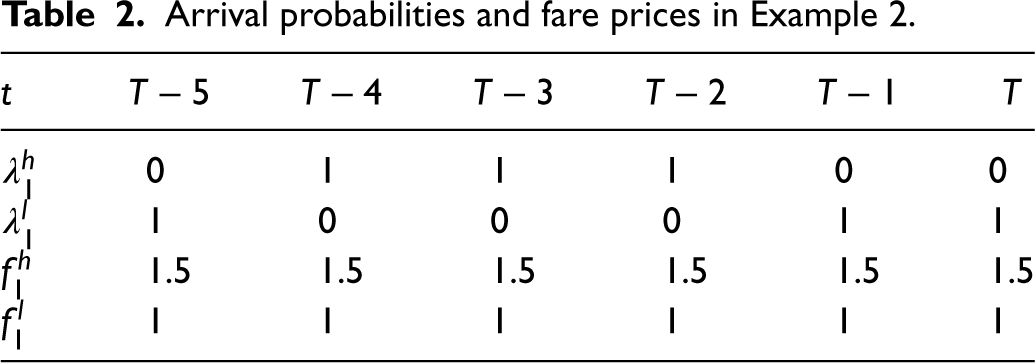
Suppose the layout of a flight is as in Example 1. There are one business class and one economy class whose arrival probabilities and fare prices from period to period are shown in Table 2.
Arrival probabilities and fare prices in Example 2.
0
1
1
1
0
0
1
0
0
0
1
1
1.5
1.5
1.5
1.5
1.5
1.5
1
1
1
1
1
1
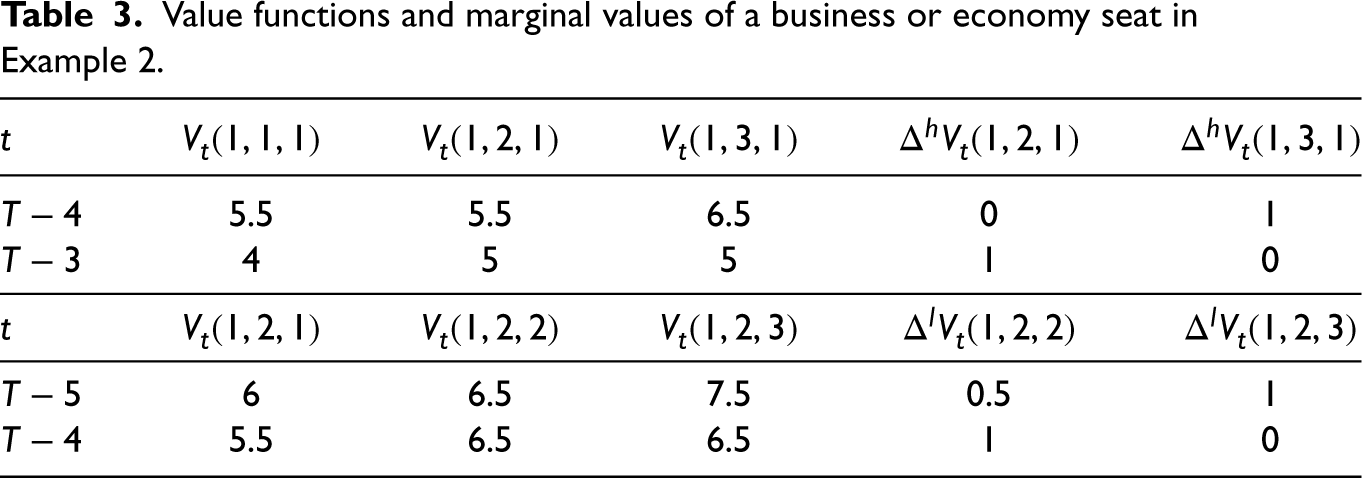
Value functions and marginal values of a business or economy seat in Example 2.
5.5
5.5
6.5
0
1
4
5
5
1
0
6
6.5
7.5
0.5
1
5.5
6.5
6.5
1
0
Table 3 shows the value functions for relevant time periods and remaining capacities. Notice that and . Therefore, the marginal value of a business seat is not monotone with respect to the remaining business capacity. Moreover, and together imply that the marginal value of a business seat is not monotone with respect to the remaining time. Similarly, the marginal value of an economy seat is not monotone with respect to the remaining economy capacity or the remaining time, since , , , and .
For efficiency purposes, a two-dimensional DP can be derived based on the number of accepted bookings in business and economy compartments, as opposed to the three-dimensional DPs of this and forthcoming sections. Such a two-dimensional DP will provide the solution for optimal classes to offer and the location of movable curtain. This DP is based on the observation (formalized in Appendix B of the E-companion) that for any given number of bookings in the two compartments, we can find the unique corresponding three-dimensional remaining capacity. The three-dimensional DP can be solved fast and also is more amenable for explicitly stating and discussing results above. That is why, we have chosen to present the three-dimensional DP.
Extension of Base Model to Incorporate Upgrading
In this section, we consider an extension of the base model in Section 2. In this extension, the airline can offer a free upgrade (from economy to business class) to each new arriving economy customer. Therefore, the airline needs to dynamically determine the set of fare classes to offer as well as whether to offer an upgrade to each new arriving economy customer. Let denote the optimal revenue-to-go in state and period when upgrades can be offered to economy customers. Then, the value function satisfies
where for and
The marginal value of an economy class seat is defined analogously and omitted for brevity. It is easy to verify that the bid price control policy continues to be optimal when upgrades can be offered. Let and denote the maximum indexes of the business and economy classes offered to customers, respectively, when upgrades are available. The business class index is obtained as of Section 2 by replacing in (3) with . The economy class index structurally differs from of Section 2 as it involves a newly derived marginal value . In particular
where
Next, we characterize the optimal policy for upgrading when at least one economy class is offered. If , then a new arriving economy customer can only sit in a business seat; thus, upgrades are offered to all economy classes. Otherwise, upgrades are offered if and only if .
Arrival probabilities and fare prices in Example 3.
0
0
1
1
1
0.5
0
0
0
0
1
1
0
0
0
0.5
1
1
1
1
6
6
6
6
6
6
6
6
6
6
5
5
1.5
1.5
1.5
1.5
1.5
1.5
1.5
1.5
Value functions and marginal values of a business or economy seat in Example 3.
33.25
34.75
34.75
37
1.5
2.25
1.5
2.25
For in period , the following statements hold:
It is optimal to offer business classes and economy classes , where decreases in and decreases in and .
If at least one economy class is offered, that is, , then it is optimal to offer upgrades if and only if (i) or (ii) .
Proposition 3 shows that an upgrade should be offered only if there is no economy or shared capacity remaining, or the marginal value of an economy seat is higher than the marginal value of a business seat.
Lemma 3 below is used to derive a necessary condition on the optimality of upgrades.
For , we have .
It is intuitive that an extra business seat is more valuable than an extra economy seat for since business seats provide more flexibility in the sense that business seats can be used to serve both business and economy customers (through upgrading). However, when , an extra economy seat might be more valuable since it will add a full row to the shared capacity, which can be used to meet both business and economy demands. Lemma 3 implies that for all , that is, the marginal value of a business seat is always higher than that of an economy seat if . Proposition 3 and Lemma 3 together imply that it is never optimal to offer upgrades for . Equivalently, we have
An upgrade can be optimal only if there is no economy capacity, that is, .
Recall that in the base model, it is optimal to offer more business (resp., economy) classes when there is more economy (resp., business) capacity remaining. However, when upgrades can be offered, the business capacity can be used to meet both business and economy demands. Example 3 illustrates that the marginal value of a business (resp., economy) seat is not always decreasing in the remaining economy (resp., business) capacity. Therefore, it may not be optimal to offer more business (resp., economy) classes when there is more economy (resp., business) capacity.
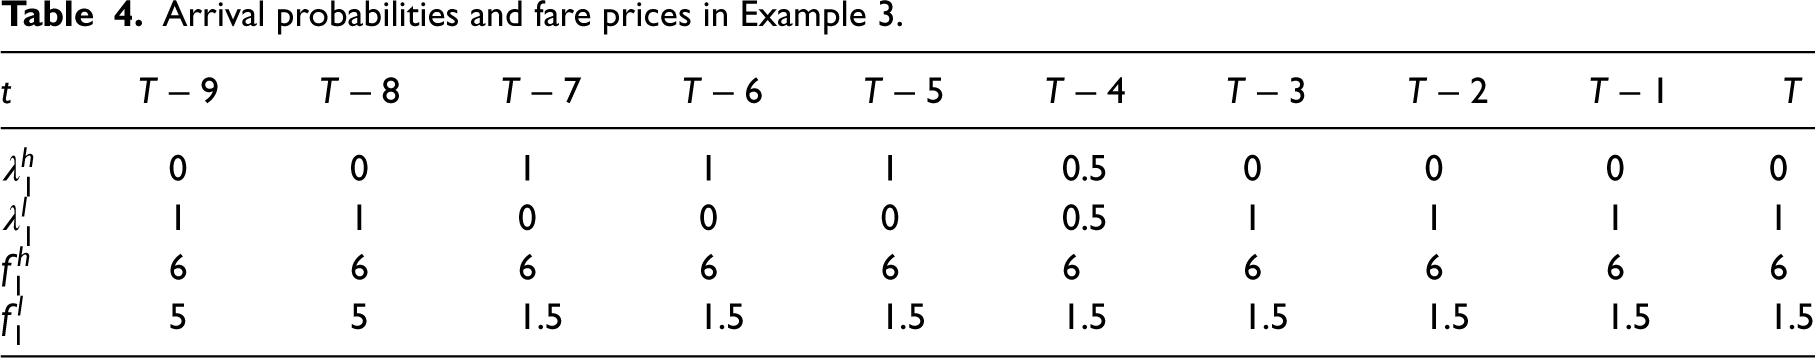
Consider a flight whose layout is the same as in Example 1. There are one business class and one economy class whose arrival probabilities and fare prices from period to period are shown in Table 4. Table 5 shows that and . Therefore, the marginal value of business (economy) capacity is not monotonically decreasing in the remaining economy (business) capacity.
Implementation of Our Policy in Practice
In this section, we address two challenges for our solution to be implemented in practice.
Seat Selection
We assume that a customer does not select a specific seat and only chooses a particular fare product in Sections 2 and 3. However, airlines sometimes allow customers to select their preferred seats within their compartment. We now explain how to implement our solution considering seat selection.
We note that the movable curtain may only be installed in a restricted range of rows in practice. The curtain is typically installed on rails that run along the roof of the cabin and can be moved back and forth along the rails. The movement of the curtain is limited by the rails. The rails start at a relatively front row of the aircraft and extend toward the rear, typically spanning several rows. This means that the curtains can only be moved within the range defined by the length of the rails. Suppose the rails start at the rear of row and end at the rear of row . Therefore, at least (resp., ) and at most (resp., ) rows are allocated to the business (resp., economy) compartment.
The airline can dynamically determine the subset of seats from which each customer selects. At the beginning of the booking horizon, business passengers can select seats in the first rows (i.e., seats), and economy passengers can select seats in rows to (i.e., seats). Then the airline can dynamically open new seats for selection based on realized demands. For instance, once the first rows are exhausted, the airline can open seats in row to newly arrived business passengers. Similarly, once the rows at the rear of the aircraft are exhausted, seats in row will be opened to newly arrived economy passengers. Recall that in the model of Sections 2 and 3, the initial state is . When accounting for seat selection, the only adjustment is that the initial state becomes , where is the number of rows that can be flexibly allocated to either the business or economy compartments, is the number of seats already designated to the business compartment, and is the number of seats already designated to the economy compartment. Then, all our results in Sections 2 and 3 continue to hold. We numerically show in Section 6.3 that the implementation of seat selection results in a negligible reduction in revenue, allowing airlines to retain most of the benefits associated with the flexibility of postponing the decision on curtain position.
Substitutable Demand and Marginal Revenue Transformation
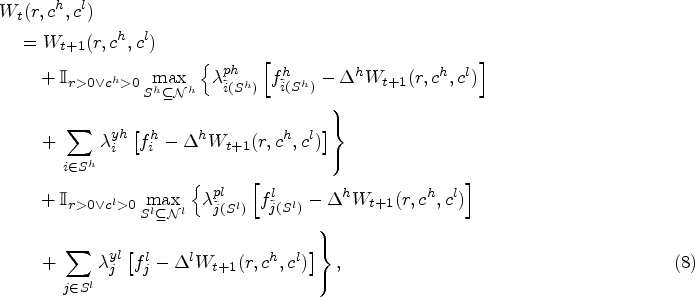
In the base model of Section 2, demands across fare classes are mutually independent. In this section, we provide guidance on how to incorporate consumer choice behavior into our base model by applying a fare transformation, also known as marginal revenue transformation, to convert the substitutable demand model into an equivalent independent demand model (Fiig et al., 2010). In particular, we will consider customers’ buy-down behavior; that is, customers will choose the lowest available fare. The model associated with this behavior is referred to as the “buy-down” model. The main idea is to convert the original buy-down model with given fares and demands to a transformed independent demand (base) model with modified fares and demands such that the optimal profit of the original buy-down model is the same as that of the transformed independent demand model. Next, we describe the original buy-down model and apply the marginal revenue transformation to obtain the transformed independent demand model. The main result of this section shows the equivalence of optimal profits and optimal offer sets of the original (buy-down) and transformed (independent demand) models when they are calculated with the same state and in the same period.
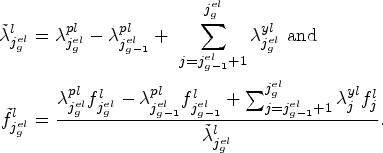
The original buy-down model caters to a hybrid setting, consisting of both flexible customers with buy-down behavior and yieldable customers who will only purchase the fare class they prefer. Let (resp., ) denote the arrival probability of a yieldable business class (resp., economy class ) customer. Let (resp., ) denote the arrival probability of a flexible business (resp., economy) customer when class (resp., ) is the lowest available business (resp., economy) fare. By this definition and buy-down behavior, (resp., ). Let and denote the subset of business fare classes and the subset of economy fare classes offered by the airline in period , respectively. In the sequel, we will drop the subscript in and when there is no ambiguity in doing so. Let (resp., ) denote the lowest fare class in the business offer set (resp., economy offer set ). Note that when (resp., ), we let (resp., ). Let . Then the value function satisfies
where for and
The marginal value of an economy class seat is defined analogously and omitted for brevity.
Next, we simplify the optimization problem in (8) using the concepts of complete and efficient offer sets. A business (resp., economy) offer set is called complete if it is of the form for (resp., ). Let . Then, and are the collections of all complete business and economy offer sets, respectively. Let (resp., ) denote the lowest business (resp., economy) fare class that is optimal to offer in state and period . Then, Lemma 4 below implies that an optimal business offer set is and an optimal economy offer set is .
There exists an optimal business (resp., economy) offer set in (resp., ).
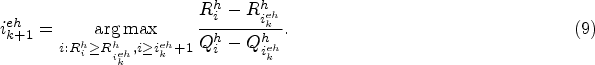
To define efficient business or economy sets, let , , , , and . Note that and . By Proposition 2 in Talluri and Van Ryzin (2004), an optimal business (resp., economy) offer set must be an efficient set, that is, (resp., ) must be an optimal solution to (resp., ) for some (relative weight) value . Next, we show how to identify all efficient business and economy sets using the “largest marginal revenue” procedure in Section 3.3 of Talluri and Van Ryzin (2004). First, let . Then, successive efficient business sets can be found by the following recursion: Let denote the efficient business set and denote the lowest fare class in , that is, . The efficient business set is obtained by checking the sets for the one that maximizes the marginal revenue ratio , that is, , where
A class is called efficient if and only if set is efficient. Let denote the total number of efficient business classes. Then is the set of all efficient business classes, where . Following a similar procedure, we can obtain the set of all efficient economy classes , where is the total number of efficient economy classes and . Let , , and . Then, (8) can be equivalently written as
where the first equality holds by Lemma 4 and the second equality holds by Proposition 2 in Talluri and Van Ryzin (2004). Note that specifies an optimal solution to (10).
We now apply the marginal revenue transformation to obtain the transformed independent demand model. Let (resp., ) denote the modified arrival probability and (resp., ) denote the modified fare price of business class (resp., economy class ) in the independent demand model. We choose , , , and such that all demands are allocated to efficient classes (i.e., the modified arrival probabilities for inefficient classes are zero) and for and , , , , and .
For and efficient business class , let
For inefficient business class , let and .
For and efficient economy class , let
For inefficient economy class , let and .
For inefficient business class and inefficient economy class , let .
Let denote the value function of the transformed independent demand model, which is the base model in Section 2 under the modified fare prices (i.e., and ) and arrival probabilities (i.e., and ). For in period , let and denote the lowest business and economy fare classes that are optimal to offer in the transformed independent demand model. Recall that in the original buy-down model, an optimal business offer set is and an optimal economy offer set is .
For and , and .
Proposition 5 implies that an optimal solution to the original buy-down model can be obtained by solving the transformed independent demand model. Hence, the appropriately transformed base model and the results in Section 2 can be used to find the optimal policy for a buy-down model.
We also show that any discrete consumer choice model can be converted into an equivalent independent demand model through the marginal revenue transformation as long as it has the nested-by-fare-order property introduced in Definition 3 of Talluri and Van Ryzin (2004). We refer the reader to Appendix E for more details.
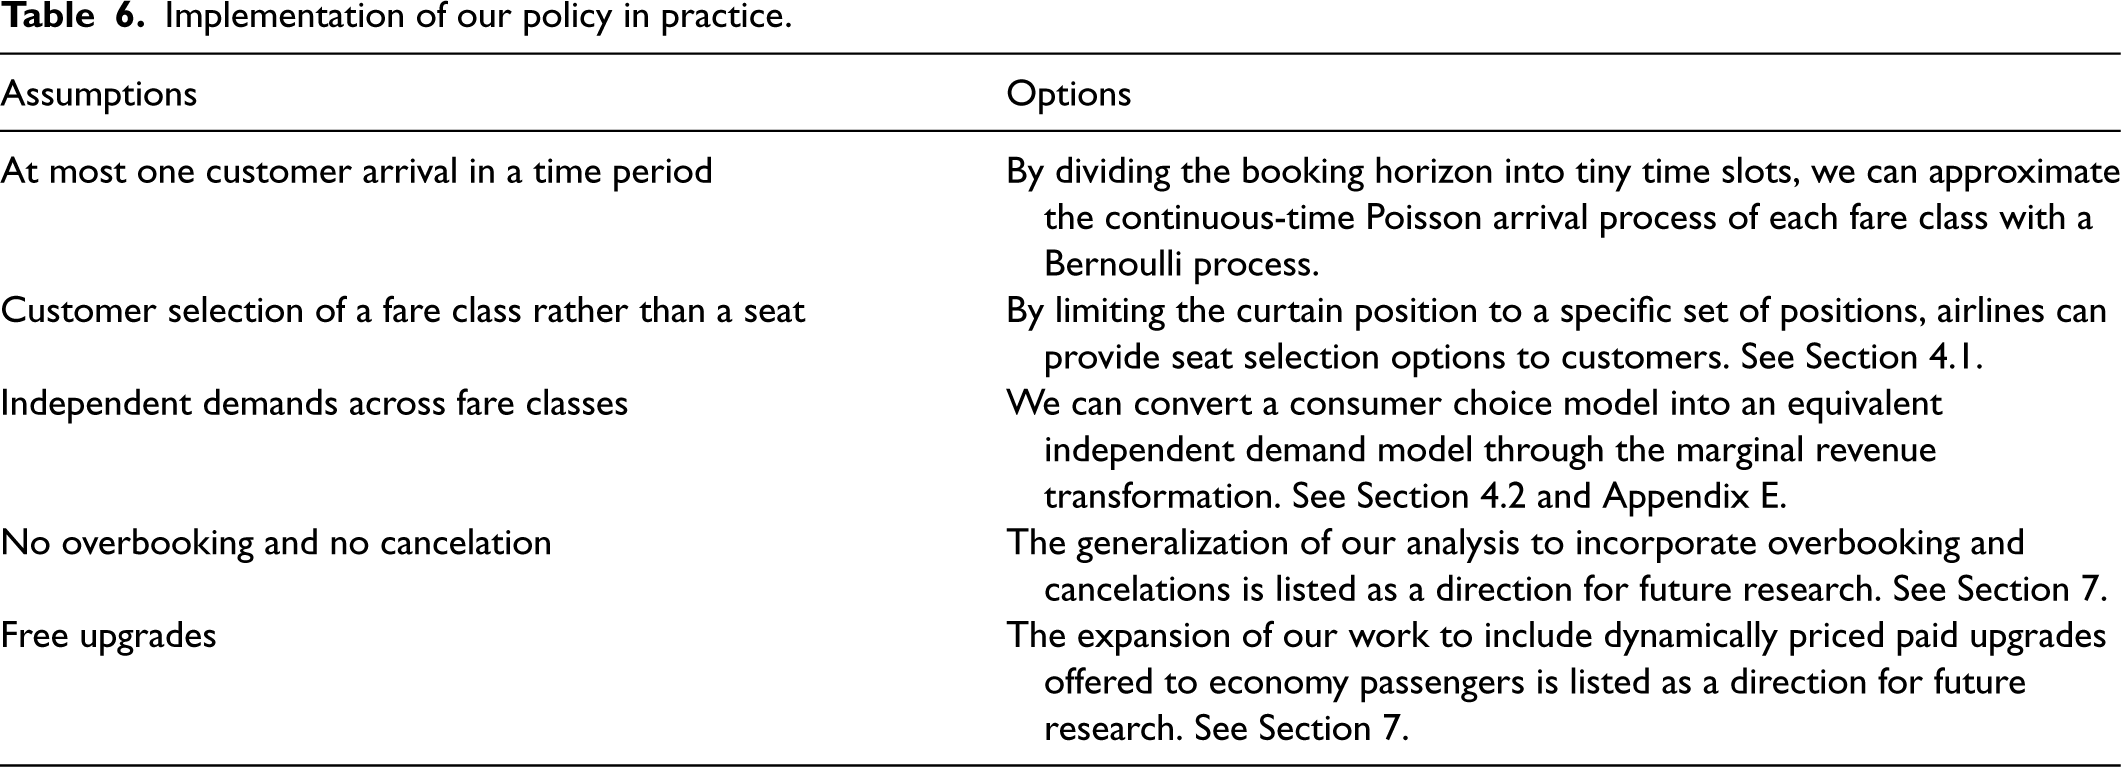
While concluding our implementability discussion, we list our modeling assumptions and more importantly include options to address these assumptions or identify future research directions associated with them in Table 6.
Implementation of our policy in practice.
Assumptions
Options
At most one customer arrival in a time period
By dividing the booking horizon into tiny time slots, we can approximate the continuous-time Poisson arrival process of each fare class with a Bernoulli process.
Customer selection of a fare class rather than a seat
By limiting the curtain position to a specific set of positions, airlines can provide seat selection options to customers. See Section 4.1.
Independent demands across fare classes
We can convert a consumer choice model into an equivalent independent demand model through the marginal revenue transformation. See Section 4.2 and Appendix E.
No overbooking and no cancelation
The generalization of our analysis to incorporate overbooking and cancelations is listed as a direction for future research. See Section 7.
Free upgrades
The expansion of our work to include dynamically priced paid upgrades offered to economy passengers is listed as a direction for future research. See Section 7.
More Applications of Flexible Capacity Allocation
In this section, we provide more applications related to flexible capacity management and modify our model of Section 2 to accommodate them. Recall that in the airline application of Example 1, each row of seats can accommodate four business passengers or six economy passengers. In other words, airlines sell two different products (i.e., business and economy tickets) that share the capacity of a flight. This is not uncommon in other industries. Here are three examples: (1) hotels or Airbnb hosts can sell a set of rooms as separate individual units or combine several rooms to sell them as a large suite. (2) Retailers or manufacturers can sell the same product in different package sizes at different prices and postpone product packaging until customers place their orders (Van Hoek, 2001). For example, “AmazonBasics AA High-Capacity Rechargeable Batteries” are sold in two different package sizes: a 4-pack at $10.88 and an 8-pack at $17.49. The batteries are packaged once customers choose the package size and place their orders. (3) For products that are prepackaged (i.e., no packaging postponement), packages can be combined and sold together at a lower unit price, known as quantity-based price discount. For example, Whole Foods offers quantity discounts for their fresh produce in weekly deals.
Recall that the base model in Section 2 has a row constraint: once a seat in a row is assigned to the business (or economy) compartment, then all the seats in that row are assigned to that compartment. In contrast, there is no row constraint if we consider the problem in the three examples above. Consider a firm that can sell the same product in different package sizes , and the price of size package is . In each period, a customer requesting a package of size arrives with probability , and the company determines the subset of quantities to offer given the remaining capacity . Let denote the optimal revenue-to-go function in period when the remaining capacity in that period is . Then, for and , satisfies the following recursion:
where for and for .
The formulation above also applies to a single-compartment model for airlines with group arrivals, where a group request of size is a single request for units of capacity (e.g., a family of people traveling together), and the group ticket is sold at price . Talluri and Van Ryzin (2004) briefly describe this setting with no detailed formulation. From (11), the optimal policy for group arrivals is also a bid price control: a group request of should be accepted if and only if its revenue exceeds the threshold price , that is, . Talluri and Van Ryzin (2004) claimed that the value function may not be concave in the remaining capacity (by failing ). In contrast, when there are only two possible group sizes, i.e., , then similar to Lemma 1, we essentially show below for , , and . Hence, the nuanced discrete structure of the problem renders concavity properties delicate.
For and , we have .
Lemma 5 implies that a class of size is more likely to be offered when the remaining capacity increases by for . This is because an increase in results in more available capacity to accommodate a group request of size , thereby increasing the chance of having excess capacity that can be used to meet a group request of size .
Case Study for Evaluating Movable-Curtain Strategy
This section numerically demonstrates the advantages of flexible capacity allocation via a movable-curtain implementation with and without upgrading, using real-life proprietary fare and demand data of a flight. In Section 6.1, we compute the expected revenues under various settings and quantify the revenue improvements from flexible capacity allocation. In Section 6.2, we examine the impact of the initial capacity, demand intensities, and fare prices on the revenue improvements achieved through flexible capacity allocation. In Section 6.3, we examine the effect of offering seat selection options to passengers on the benefits of flexible capacity allocation. We start our discussion of the case study with a description of our test bed and the current solution adopted by airlines as a benchmark.
Test Bed: Our test bed is based on the data of an actual flight. The dataset contains the arrival probabilities and fare prices of all business and economy classes in each time period. The airline has a demand forecast for each data collection period (DCP). Then each DCP is divided into smaller time slots so that we can approximate the continuous-time Poisson arrival process of each fare class with a discrete Bernoulli process. There are 22 DCPs and each DCP contains more than 900 time slots. Therefore, there are around 20,000 periods in the booking horizon. We obtain the arrival probability of each fare class in a period by dividing the demand forecast for that fare class by the number of time slots in the DCP including that period. There are more than 100 business fare classes and more than 400 economy fare classes. The large numbers of fare classes stem from various itinerary, priority and restriction combinations deployed in practice. Tens of thousands of periods and hundreds of fare classes lead to a large-scale case study. The total expected business demand and total expected economy demand over the entire booking horizon are 14 and 108, respectively. Each row of seats can seat four business customers (i.e., ) or six economy customers (i.e., ). Therefore, we need rows to serve expected business passengers and rows to serve expected economy passengers. We assume that the aircraft has 22 rows of seats so that the flight has enough capacity to meet the expected demand. We consider the above setting as the base instance.
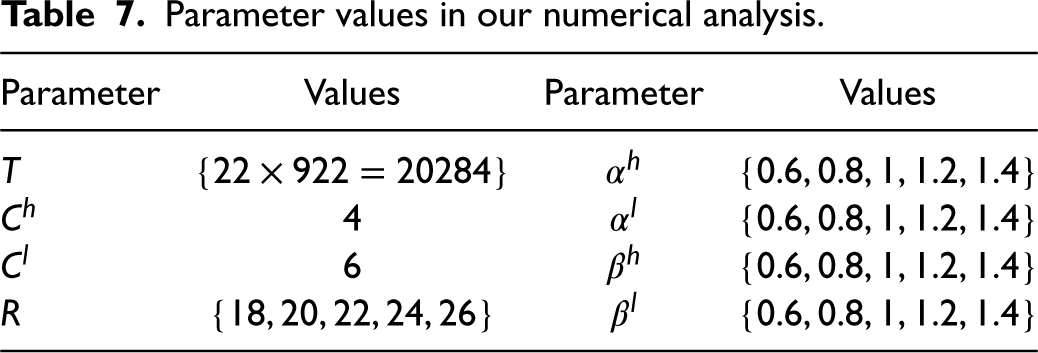
We vary the initial capacity, arrival probabilities of business and economy passengers, and business and economy fare prices to generate different problem instances. We vary the total number of rows from 18 to 26, in increments of 2. We vary the business arrival probabilities by multiplying each by a scale factor and vary the economy arrival probabilities by multiplying each by a scale factor . We vary the business fare prices by multiplying each by a scale factor and vary the economy fare prices by multiplying each by a scale factor . All the parameter values4 are summarized in Table 7.
Parameter values in our numerical analysis.
Parameter
Values
Parameter
Values
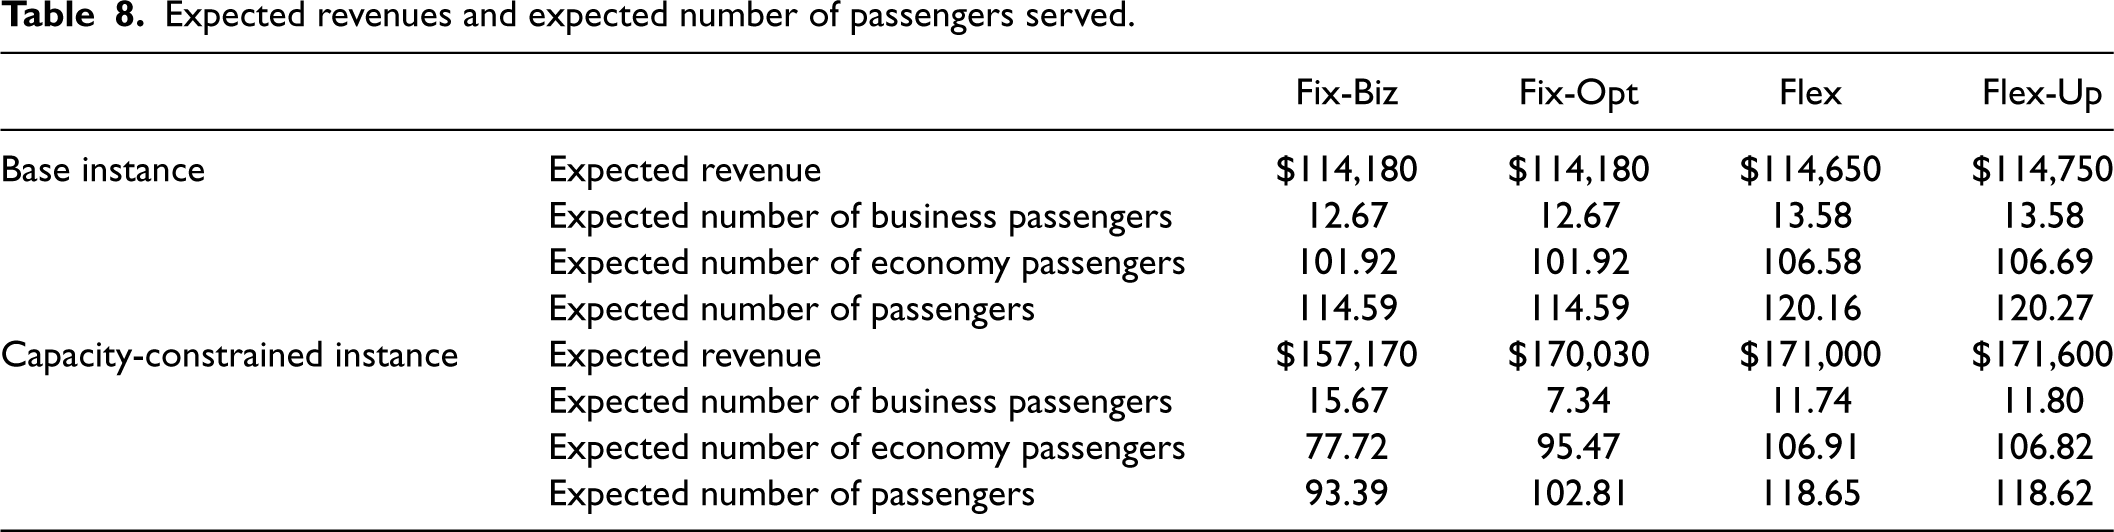
Expected revenues and expected number of passengers served.
Fix-Biz
Fix-Opt
Flex
Flex-Up
Base instance
Expected revenue
$114,180
$114,180
$114,650
$114,750
Expected number of business passengers
12.67
12.67
13.58
13.58
Expected number of economy passengers
101.92
101.92
106.58
106.69
Expected number of passengers
114.59
114.59
120.16
120.27
Capacity-constrained instance
Expected revenue
$157,170
$170,030
$171,000
$171,600
Expected number of business passengers
15.67
7.34
11.74
11.80
Expected number of economy passengers
77.72
95.47
106.91
106.82
Expected number of passengers
93.39
102.81
118.65
118.62
Benchmark: We first explain the current solution approaches adopted by airlines. The curtain position is fixed at the beginning of the booking horizon, which determines the initial business and economy capacities. Suppose the curtain is installed at row . Then the initial business capacity is , and the initial economy capacity is . Let (resp., ) denote the optimal revenue-to-go obtainable from business (resp., economy) customers when there are business (resp., economy) seats remaining in period . Then the expected total revenue is , which can be obtained recursively. For , let . For , we have
In the current practice, airlines fix the curtain position based on the expected business demand; we refer to this solution as Fix-Biz. With the expected total business demand , Fix-Biz places the curtain at row such that the capacity allocated to the business compartment is no less than the expected business demand. This is plausible as airlines prioritize accommodating business demand considering the higher profit margins and perceived longer-term loyalty of business passengers.
An intuitive way to improve the current practice is to optimize the fixed curtain position to maximize the total revenue from business and economy demands. We refer to this solution as Fix-Opt in which the optimal curtain position is
Benefit of the Flexibility
We now numerically illustrate the benefits of postponing the decision on curtain position until the end of the booking horizon and utilizing the upgrade options. We refer to the solution with movable-curtain implementation but no upgrading (Section 2) as Flex and the solution with both movable-curtain implementation and upgrading (Section 3) as Flex-Up. We compare the expected revenues under the four solutions—Fix-Biz, Fix-Opt, Flex, and Flex-Up—and quantify the benefits of flexibility in capacity allocation. Table 8 shows the expected revenues and the expected number of passengers served under the four solutions in the base instance and a capacity-constrained instance with , , , , and . In the base instance, the curtain position is at row 4 under both Fix-Biz and Fix-Opt. Compared to Fix-Biz or Fix-Opt, the expected number of total passengers increases by (resp., ) under Flex (resp., Flex-Up), and the expected revenue increases by (resp., ) under Flex (resp., Flex-Up). In the capacity-constrained instance, the curtain is at row 5 under Fix-Biz and at row 2 under Fix-Opt. Compared to Fix-Biz, the expected number of total passengers increases by , , and under Fix-Opt, Flex, and Flex-Up, respectively. The expected revenue increases by , , and under Fix-Opt, Flex, and Flex-Up, respectively.
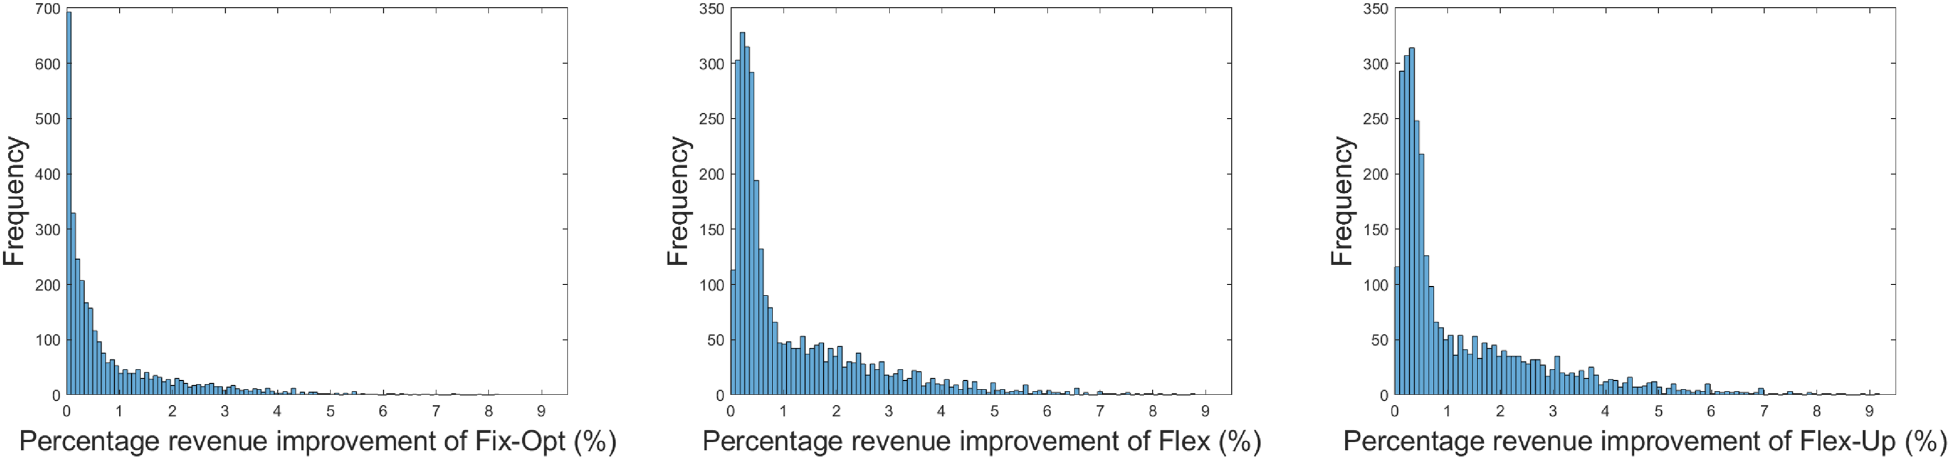
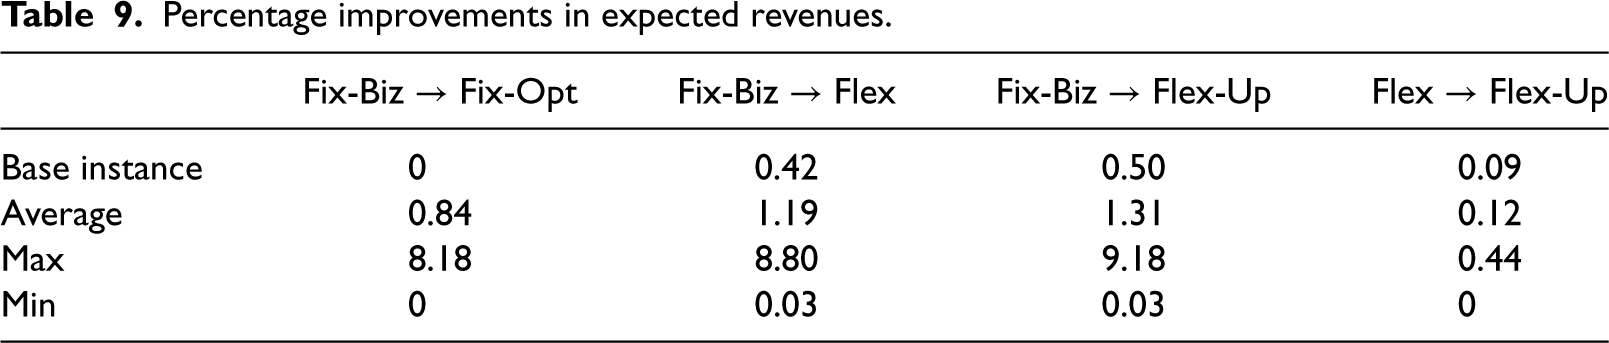
Figure 4 presents histograms that illustrate the percentage improvements in expected revenues of Fix-Opt, Flex, and Flex-Up relative to Fix-Biz across the 3,125 instances. Table 9 provides a summary of the statistical measures, such as average, maximum, and minimum, of the percentage revenue enhancements. On average, the expected revenue under Fix-Opt improves by compared to Fix-Biz by optimizing the curtain position. The expected revenue further increases with a movable-curtain implementation and upgrading. Compared to Fix-Biz, the expected revenue under Flex increases by and that under Flex-Up increases by on average; these are considered substantial improvements in the airline industry. For the capacity-constrained instances with high demand and low capacity, Flex and Flex-Up generate significant revenue improvements (e.g., and , respectively) over Fix-Biz. The expected revenue improvement from utilizing upgrades on top of the movable-curtain implementation is on average , which is much smaller than the revenue improvement from the movable-curtain implementation alone. Therefore, although the incorporation of upgrading does bring in modest supplementary revenue, the adoption of a flexible curtain position yields far more substantial revenue improvement.
Histograms of the percentage revenue improvements of Fix-Opt, Flex, and Flex-Up relative to Fix-Biz.
Percentage improvements in expected revenues.
Fix-Biz Fix-Opt
Fix-Biz Flex
Fix-Biz Flex-Up
Flex Flex-Up
Base instance
0
0.42
0.50
0.09
Average
0.84
1.19
1.31
0.12
Max
8.18
8.80
9.18
0.44
Min
0
0.03
0.03
0
Complexity and Running Time: We now examine the time and space complexity, as well as the running time of Fix-Biz, Fix-Opt, Flex, and Flex-Up. Note that, under Fix-Biz and Fix-Opt, the state space in each period is . Thus, both the time and space complexity of Fix-Biz and Fix-Opt is . In contrast, under Flex and Flex-Up, the state space in each period is . Thus, both the time and space complexity of Flex and Flex-Up is . The average running times of Fix-Biz, Fix-Opt, Flex, and Flex-Up across the 3,125 instances are 0.57, 0.83, 4.10, and 7.90 s, respectively. We ran our code via MATLAB on Amazon Web Services, specifically utilizing the c5.4xlarge machine, which is equipped with 16 vCPUs (Intel Xeon Platinum 8124M) and 32 GiB of memory. With respective runtimes of 4.10 and 7.90 s, Flex and Flex-Up are implementable by airlines in RM practice.
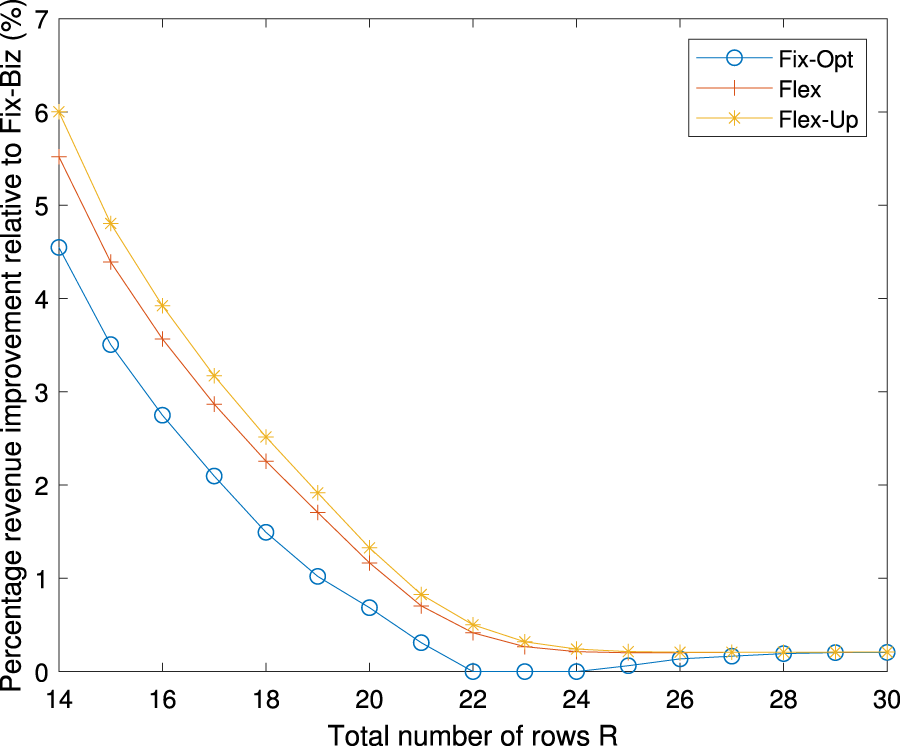
Impact of the initial capacity on the expected revenue.
Impact of Flight Contexts on the Benefit of the Flexibility
We now examine the impact of the initial capacity, demand intensities, and fare prices on the revenue improvements from the flexible capacity allocation and identify the scenarios under which the capacity allocation flexibility is more valuable to airlines. We use the parameter values in the base case and only vary the initial capacity, demand intensities, and fare prices to examine their impact.
Impact of demand intensities on the expected revenue.
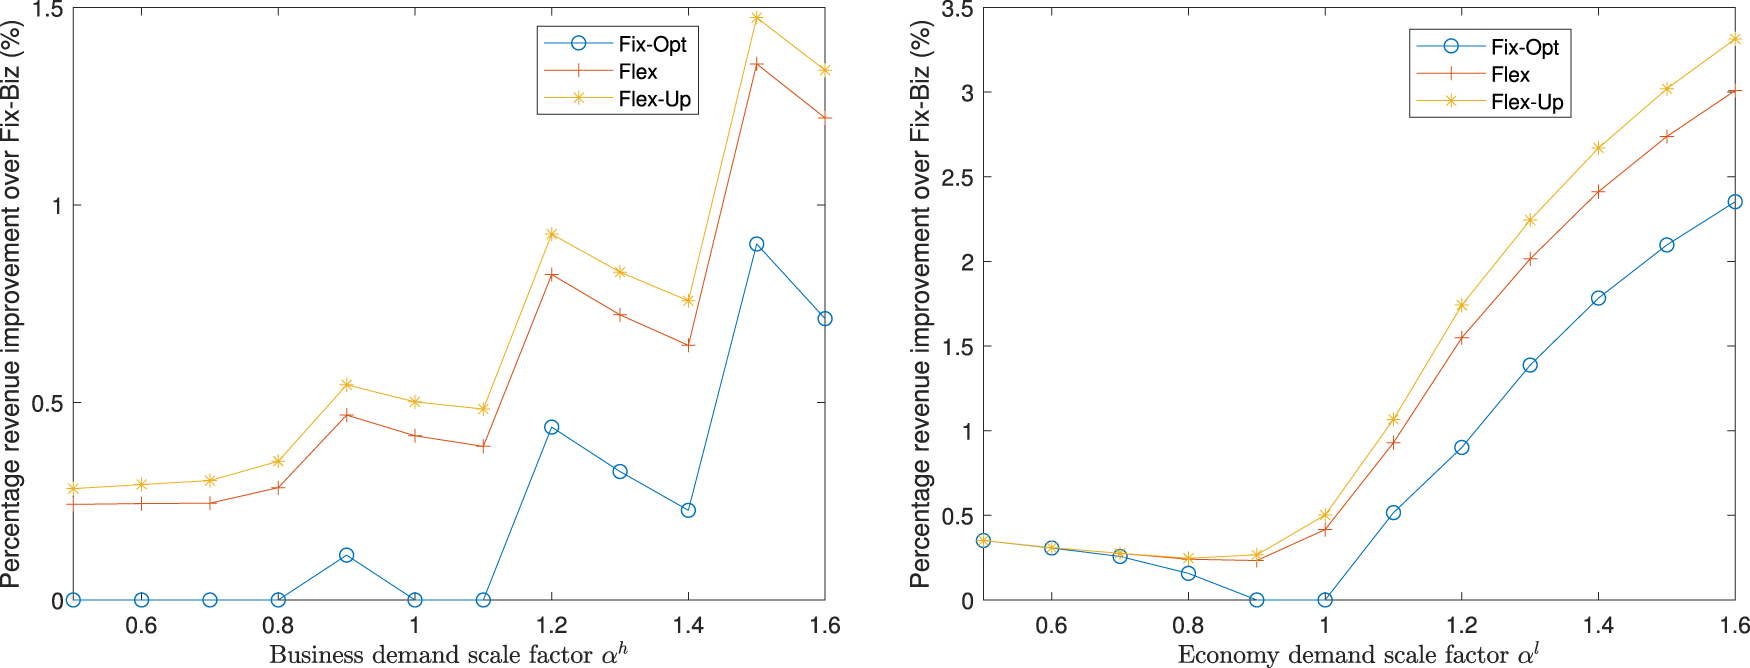
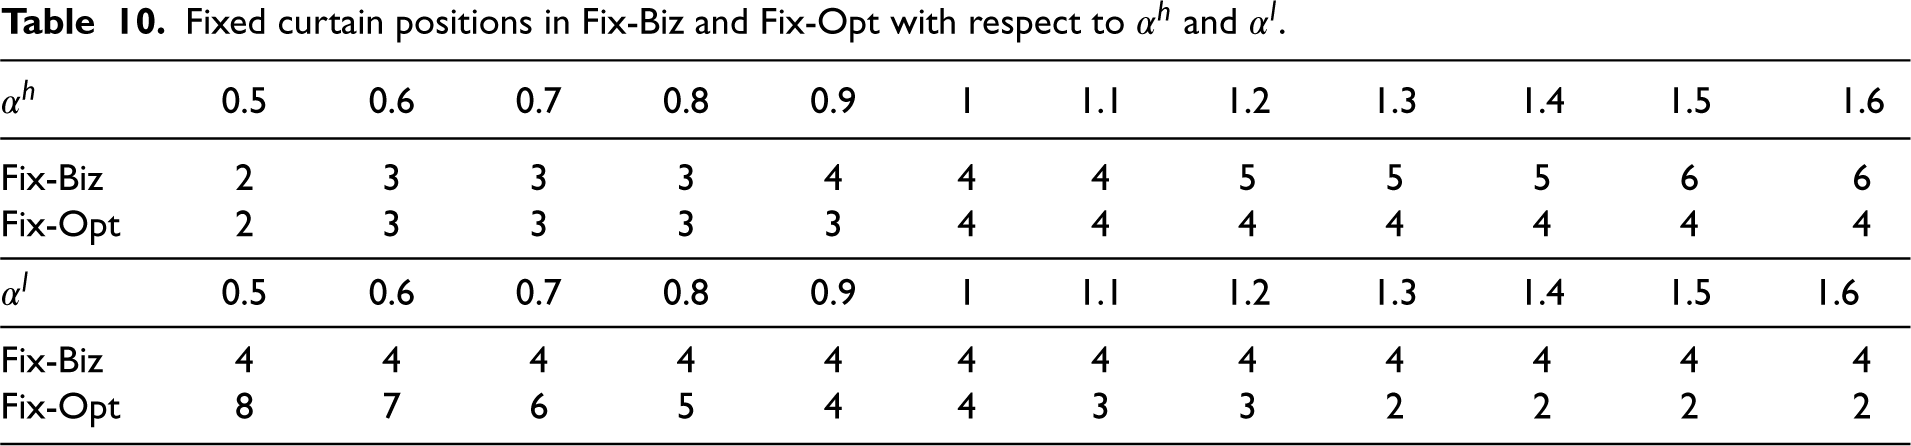
Fixed curtain positions in Fix-Biz and Fix-Opt with respect to and .
0.5
0.6
0.7
0.8
0.9
1
1.1
1.2
1.3
1.4
1.5
1.6
Fix-Biz
2
3
3
3
4
4
4
5
5
5
6
6
Fix-Opt
2
3
3
3
3
4
4
4
4
4
4
4
0.5
0.6
0.7
0.8
0.9
1
1.1
1.2
1.3
1.4
1.5
1.6
Fix-Biz
4
4
4
4
4
4
4
4
4
4
4
4
Fix-Opt
8
7
6
5
4
4
3
3
2
2
2
2
Impact of the Initial Capacity
We increase the total number of rows from to . Figure 5 shows that the percentage revenue improvements of Fix-Opt, Flex and Flex-Up relative to Fix-Biz are significant when the initial capacity is significantly lower than the expected demand. This is because Fix-Biz allocates too much capacity to the business compartment when the capacity is lower than the expected demand. For example, Fix-Biz keeps allocating 4 rows to the business compartment as the number of rows increases from 14 to 30. However, the optimal fixed-curtain position under Fix-Opt is 2 for , 3 for , 4 for , 5 for , 6 for , and 7 for .
When the available capacity exceeds the expected demand, the value of the flexibility in capacity allocation, obtained from postponing the curtain position decision and upgrading, diminishes. This is because it becomes easier to fulfill all customer requirements, leading to a decrease in the value of the flexibility. Conversely, when the capacity is insufficient to meet the expected customer arrivals, the importance of this flexibility escalates. For example, when , the expected total numbers of passengers served under Flex and Flex-Up increase by more than compared to Fix-Biz. When the capacity is insufficient to meet the expected demand, Fix-Biz can accommodate slightly more business passengers, but significantly fewer economy passengers than Flex and Flex-Up. Detailed comparisons of the number of passengers served with different initial capacities under Fix-Biz, Fix-Opt, Flex, and Flex-Up can be found in Appendix G.
Impact of Demand Intensities
We vary the business demand scale factor from to and the economy demand scale factor from to , both in increments of . Figure 6 shows significant revenue improvements of Fix-Opt, Flex, and Flex-Up relative to Fix-Biz when the expected business or economy demand is high. When the expected (business or economy) demand is high, Table 10 shows that the fixed curtain position under Fix-Biz deviates from the optimal one under Fix-Opt as Fix-Biz allocates too much capacity to the business compartment. Therefore, Fix-Opt achieves a significant revenue improvement relative to Fix-Biz. When the expected demand for economy class is very low, the fixed curtain position under Fix-Biz is far away from the optimal one under Fix-Opt. However, given that the demand is considerably lower than the capacity, meeting all customer requirements becomes straightforward. Consequently, the revenue improvement of Fix-Opt in comparison to Fix-Biz is less significant.
When the expected business or economy demand is extremely high, to the extent that the capacity cannot meet the demand, the flexibility gained from postponing the curtain position decision and upgrading becomes crucial. This flexibility facilitates the accommodation of more demands with the same supply, leading to significant revenue improvements under Flex and Flex-Up. For example, when or , the expected total numbers of passengers served under Flex and Flex-Up increase by more than compared to Fix-Biz. Detailed comparisons of the number of passengers served with different demand scale factors under Fix-Biz, Fix-Opt, Flex, and Flex-Up can be found in Appendix G.
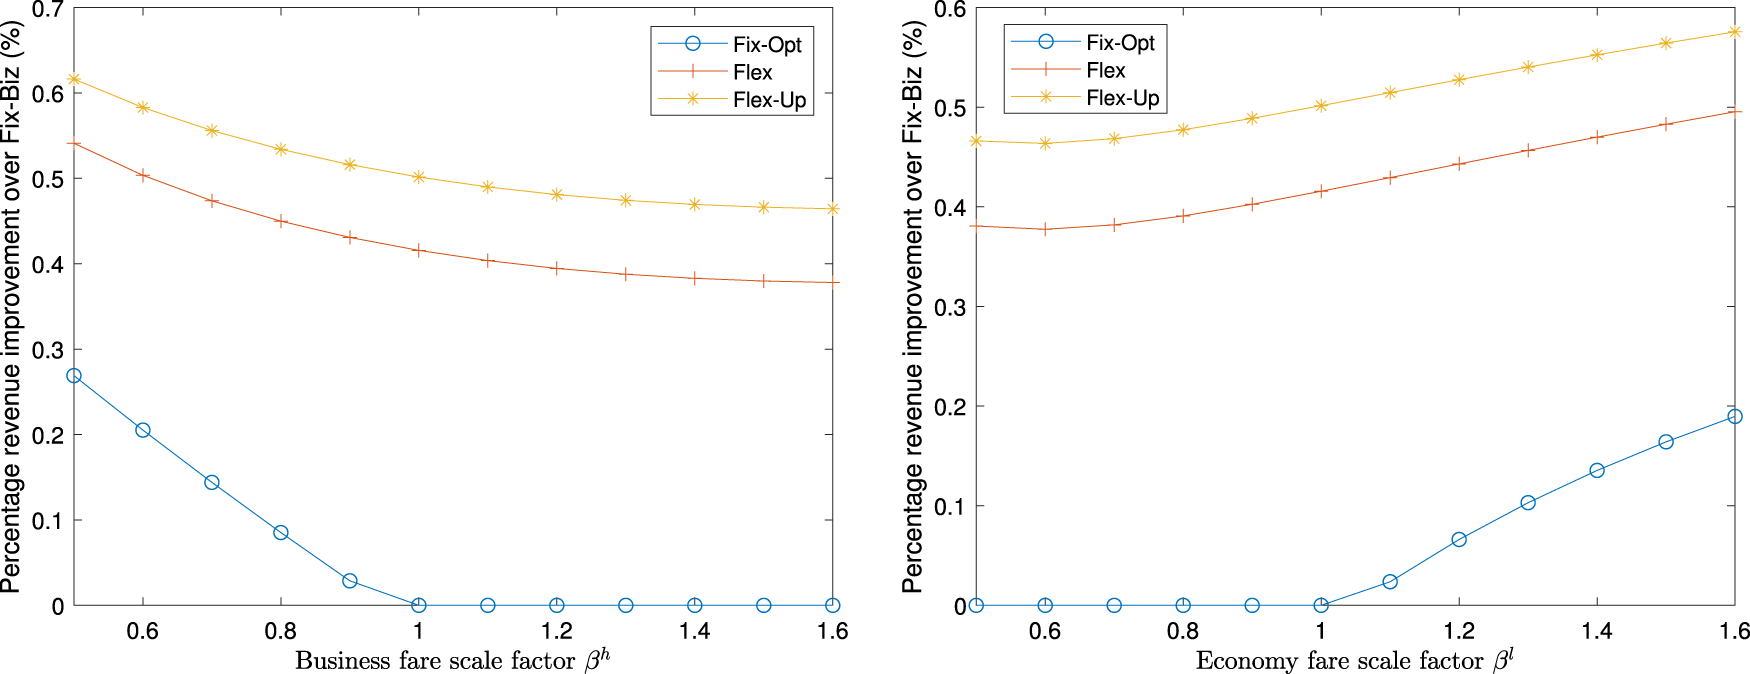
Impact of Fare Prices
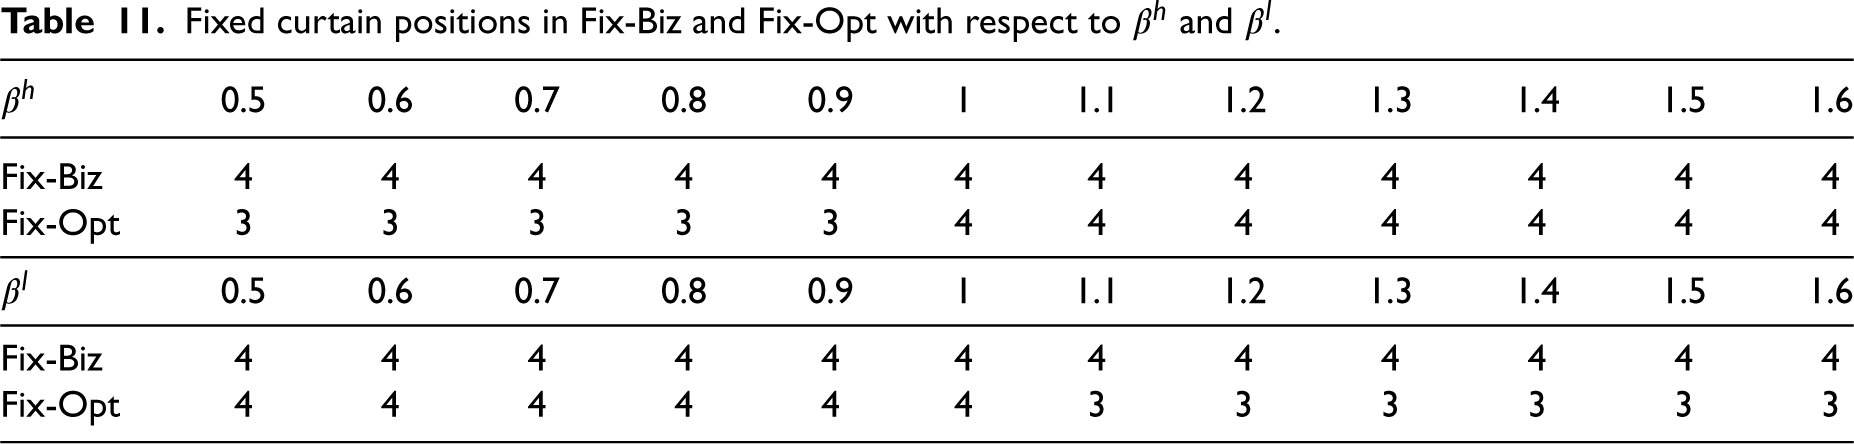
We vary the business fare scale factor from to and the economy fare scale factor from to , both in increments of . Figure 7 shows that the revenue improvements of Fix-Opt, Flex, and Flex-Up, in comparison to Fix-Biz, decrease in business fare prices and increase in economy fare prices. When business fares are high or economy fares are low, it is reasonable to prioritize business demands as in Fix-Biz. Therefore, Fix-Biz performs reasonably well. However, when business fares are low or economy fares are high, Table 11 shows that the fixed curtain position under Fix-Biz deviates from the optimal one under Fix-Opt. This discrepancy creates an opportunity for potential revenue improvements.
Impact of fare prices.
Fixed curtain positions in Fix-Biz and Fix-Opt with respect to and .
0.5
0.6
0.7
0.8
0.9
1
1.1
1.2
1.3
1.4
1.5
1.6
Fix-Biz
4
4
4
4
4
4
4
4
4
4
4
4
Fix-Opt
3
3
3
3
3
4
4
4
4
4
4
4
0.5
0.6
0.7
0.8
0.9
1
1.1
1.2
1.3
1.4
1.5
1.6
Fix-Biz
4
4
4
4
4
4
4
4
4
4
4
4
Fix-Opt
4
4
4
4
4
4
3
3
3
3
3
3
The above numerical results indicate that the benefits of flexible capacity allocation are significant when (i) the initial capacity is low, (ii) the business demand is high, (iii) the economy demand is high, (iv) the business fare prices are low, or (v) the economy fare prices are high. When the capacity is limited or the expected demand is substantial, the flexibility derived from postponing the curtain position decision and upgrading becomes essential for matching supply with demand. Moreover, when business fare prices are low or economy fare prices are high, the revenue from economy passengers becomes more significant, and utilizing the flexibility in capacity allocation becomes increasingly important.
Impact of Seat Selection
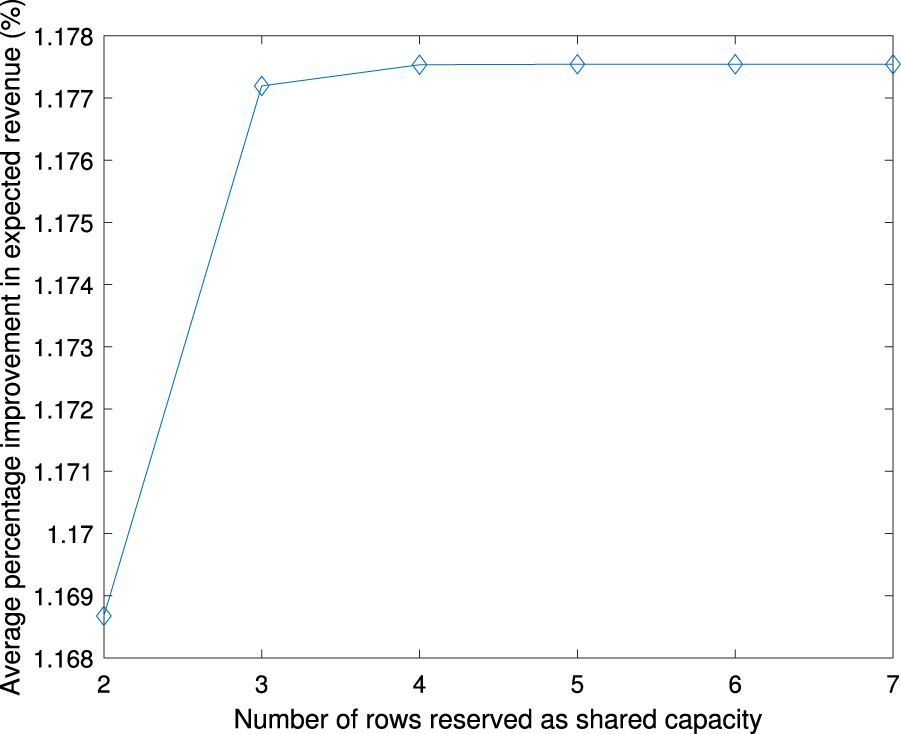
In this section, we examine the revenue loss caused by the seat selection restriction introduced in Section 4.1. Recall that, at the beginning of the booking horizon, business passengers can select seats from the first rows, and economy passengers can select seats from rows to . Therefore, the seats from rows to are reserved as shared capacity. Then the airline dynamically opens new seats based on realized demands. Now suppose the airline obtains the optimal fixed curtain position in Fix-Opt and reserves the rows around as shared capacity. In particular, we set and vary from to . Thus, the number of rows reserved as shared capacity at the beginning of the booking horizon increases from 2 to 7. For instance, when and as in the base instance, . If we let such that two rows are reserved as shared capacity, then the first three rows (resp., the last 17 rows) are open to business (resp., economy) passengers for seat selection at the beginning of the booking horizon. Figure 8 shows the average percentage revenue improvements of Flex compared to Fix-Biz when the number of rows reserved as shared capacity increases from 2 to 7.
Average percentage revenue improvements of Flex relative to Fix-Biz.
It can be observed that the revenue improvement increases as more rows are reserved as shared capacity, which provides more flexibility in capacity allocation. Specifically, with only two rows reserved as shared capacity, the expected revenue under Flex increases by an average of approximately compared to Fix-Biz. With three rows reserved as shared capacity, the average percentage improvement increases to nearly . Recall from Table 9 that when seat selection is not permitted, the average expected revenue under Flex increases by compared to Fix-Biz. Therefore, we expect that the implementation of seat selection would result in a negligible reduction in revenue in typical airline settings, thereby enabling airlines to retain most of the benefits associated with the flexibility of postponing the decision on curtain position.
Conclusions and Implications of Our Work to Practice
Our work extends the canonical single-compartment model to study a dynamic seat-allocation problem for a flight where the capacity of the flight is flexibly shared by business and economy compartments separated by a movable curtain. We show that the optimal policy is a bid price control and examine the associated monotonicity properties. We find that it is optimal to offer more economy (resp., business) fare products when there is more business (resp., economy) or shared capacity remaining. However, the monotonicity property held in a single-compartment model fails in our model: the number of fare products to offer in each compartment is not monotone with respect to the remaining capacity of that compartment or the remaining time. Next, we consider an extension in which free upgrades can be offered to economy passengers and derive a necessary condition on when to offer upgrades. We also incorporate customers’ buy-down behavior using a revenue transformation scheme. Finally, we demonstrate a significant revenue improvement from a movable-curtain implementation through a case study. We believe that our study is realistic and relevant to the airline industry and it does have implications in practice.
In current practices within the airline industry, several carriers such as Lufthansa and KLM Royal Dutch Airlines have installed movable curtains in their intracontinental European aircrafts. Nonetheless, movable curtain’s full potential benefit in capacity allocation remains underexploited. These airlines operate with a fixed-curtain implementation, wherein the curtain location, once determined at the beginning of the booking horizon, remains unchanged throughout. Given the fixed curtain position, the seating capacity allocated to each compartment is preordained. Therefore, airlines solve two separate DPs during the booking process for a flight—one catering to business compartment and the other to economy compartment. What we propose is to leverage the flexibility of the movable curtain by postponing the decision on curtain position until the end of the booking horizon. This allows us to model the two compartments jointly and solve a single DP to determine the fare classes to offer in both compartments, and in turn realize the full benefit of a movable curtain.
With the aid of numerical experiments in the context of an airline case study, we show that shifting from a fixed curtain implementation based on anticipated business demand to a movable curtain implementation yields an average increase in expected revenue of . This increase in expected revenue gained by postponing the decision on curtain position perseveres even after the optimization of the fixed curtain position, resulting in an average increase in expected revenues of . The use of the upgrade option further boosts the expected revenue by an average of . It should be noted that even relatively minor revenue increases in the order of a fraction of a percent (e.g., ) are considered substantial in the notoriously low-margin airline industry (Lutz and Lubin, 2012). The International Air Transport Association (IATA) forecasts a net profit of billion in 2024 for the airline industry, equating to a net profit margin, with total revenue expected to reach billion.5 Consequently, even a increase in revenue equates to an additional billion. Given the negligible cost of implementing the movable curtain, the average increase in expected revenue from our movable curtain implementation signifies a substantial increase in the profit margin.
We shared our research findings among professionals in both the airline industry and related software and technology providers. The response has been encouraging: Professionals not only perceived substantial value in our proposed solution and its considerable revenue improvement, but also commended the notion of utilizing flexibility in capacity allocation through techniques such as postponement strategies and upgrade offerings. While the complexity of the algorithms used may vary among different airlines, industry leaders show keen interest in the latest methodologies and concepts and find our approach intriguing. We believe that our prior discussions with several airlines have prompted them to experiment with new strategies for efficient capacity utilization. A notable instance of this is the neighbor-free seat concept where passengers have the option to directly purchase or bid for the seats next to them to keep them empty. This concept, closely related to the topic discussed in our work here, was first introduced by Etihad Airways6 in 2017, followed by Malaysia Airlines7 and Philippine Airlines.8
We have provided guidance on how to implement our solution taking into account the seat selection service offered by many airlines and how to incorporate consumer buy-down behavior. Furthermore, our solution can be integrated easily with the existing RM systems deployed at airlines. First, our proposed solution, while designed for a single-leg flight model, can be extended to manage capacities within a flight network framework, where a product is characterized as an Origin-Destination Itinerary Fare (ODIF) class combination. The majority, if not all, RM systems are equipped with a functionality dedicated to the management of flight-leg capacities. The primary role of capacity management lies in determining the appropriate virtual capacities within each individual leg of a flight that satisfy specific business goals such as meeting necessary payload weight restrictions. In essence, even when the RM algorithm engages in the collective forecasting and optimization of booking policies across the entire network, the virtual capacity accessible for bookings is primarily managed on an individual flight basis. As a result, our model seamlessly integrates with the traditional network RM optimization framework. In this context, an itinerary fare proration step (Chapter 3 of Talluri and Van Ryzin, 2004), which takes place prior to the leg optimization, serves as a compensatory measure for network control. The basic idea is to decompose the network control problem into a collection of single-resource problems, each of which may incorporate some network information but is solved essentially independently. This paves the way for the extension of our single-leg model so that it can be applied to a flight network potentially comprising multi-leg flight itineraries. This technique is well-tested and popular in airline RM practice.
Secondly, our solution does not require any significant hardware changes, as it essentially offers an improved optimization method. The implementation of our solution simply requires the ongoing tracking of the remaining time and capacity throughout the booking horizon. The implementation can also be performed with a two-dimensional DP tracking the number of accepted bookings in business and economy classes. It should be noted that even though airlines today mainly employ one-dimensional DP, the real-time tracking of booking levels on all resources in RM systems makes it relatively straightforward to implement the two-dimensional DP. Our solution’s runtime, tested on a laptop using prototype MATLAB code and real-world airline data, was within seconds per flight. This is comparable to the computational effort needed for the widely used heuristics in the industry today. Arguably, our solution’s natural adaptability to a network of flights and manageable computational requirement, along with the incorporation of factors such as seat selection and customer buy-down behavior, allow our model to be employed in fairly generalized settings, which are sufficient for most airline applications. This makes our model well suited for improving current RM practices within the airline industry.
There are many possible extensions of this work, including the generalization of our analysis to incorporate overbooking and cancellations into the model. Another interesting direction would be the generalization of our work to paid upgrades where the upgrades can be dynamically offered to economy passengers. We believe that our analysis in this paper can serve as a stepping stone for future research.
Supplemental Material
sj-pdf-1-pao-10.1177_10591478241270123 - Supplemental material for Dynamic and Flexible Capacity Management for Flight Compartments and Beyond
Supplemental material, sj-pdf-1-pao-10.1177_10591478241270123 for Dynamic and Flexible Capacity Management for Flight Compartments and Beyond by Zhichao Feng, Ang Li, Darius Walczak and Metin Çakanyıldırım in Production and Operations Management
Footnotes
Declaration of Conflicting Interests
The author(s) declared no potential conflicts of interest with respect to the research, authorship, and/or publication of this article.
Funding
The author(s) disclosed receipt of the following financial support for the research, authorship, and/or publication of this article: Zhichao Feng received support from the National Natural Science Foundation of China [Grant 72201256].
ORCID iD
Metin Çakanyıldırım
Supplemental Material
Supplemental material for this article is available online (doi: ).
Notes
How to cite this article
Feng Z, Li A, Walczak D and Çakanyıldırım M (2024) Dynamic and Flexible Capacity Management for Flight Compartments and Beyond. Production and Operations Management 33(12): 2401–2420.
References
1.
AnderssonSE (1998) Passenger choice analysis for seat capacity control: A pilot project in scandinavian airlines. International Transactions in Operational Research5(6): 471–486.
2.
BarbourADHallP (1984) On the rate of Poisson convergence. Mathematical Proceedings of the Cambridge Philosophical Society95: 473–480. (Cambridge University Press).
3.
BitranGCaldenteyR (2003) An overview of pricing models for revenue management. Manufacturing & Service Operations Management5(3): 203–229.
4.
BiyalogorskyEGerstnerEWeissDXieJ (2005) The economics of service upgrades. Journal of Service Research7(3): 234–244.
5.
BrumelleSLMcGillJI (1993) Airline seat allocation with multiple nested fare classes. Operations Research41(1): 127–137.
6.
ÇakanyıldırımMÖzerÖZhangX (2023) Dynamic pricing and timing of upgrades. Available at SSRN 3056060.
7.
ChenMChenZL (2015) Recent developments in dynamic pricing research: Multiple products, competition, and limited demand information. Production and Operations Management24(5): 704–731.
8.
CuiYDuenyasISahinO (2018) Pricing of conditional upgrades in the presence of strategic consumers. Management Science64(7): 3208–3226.
9.
CurryRE (1990) Optimal airline seat allocation with fare classes nested by origins and destinations. Transportation Science24(3): 193–204.
10.
FeldmanJBTopalogluH (2017) Revenue management under the Markov chain choice model. Operations Research65(5): 1322–1342.
11.
FiigTIslerKHopperstadCBelobabaP (2010) Optimization of mixed fare structures: Theory and applications. Journal of Revenue and Pricing Management9: 152–170.
12.
GallegoGStefanescuC (2009) Upgrades, upsells and pricing in revenue management. Available at SSRN 1334341.
13.
KyparisisGJKoulamasC (2018) Optimal pricing and seat allocation for a two-cabin airline revenue management problem. International Journal of Production Economics201: 18–25.
14.
LeeTCHershM (1993) A model for dynamic airline seat inventory control with multiple seat bookings. Transportation Science27(3): 252–265.
MayerM (1976) Seat allocation, or a simple model of seat allocation via sophisticated ones. AGIFORS Symposium Proceedings16: 339–362.
17.
McCaffreyDWalczakD (2016) Optimal dynamic upgrading in revenue management. Production and Operations Management25(11): 1855–1865.
18.
RobinsonLW (1995) Optimal and approximate control policies for airline booking with sequential nonmonotonic fare classes. Operations Research43(2): 252–263.
19.
RuzankinP (2004) On the rate of Poisson process approximation to a Bernoulli process. Journal of Applied Probability41(1): 271–276.
20.
SubramanianJStidhamS JrLautenbacherCJ (1999) Airline yield management with overbooking, cancellations, and no-shows. Transportation Science33(2): 147–167.
21.
TalluriKVan RyzinG (2004) Revenue management under a general discrete choice model of consumer behavior. Management Science50(1): 15–33.
22.
TalluriKTVan RyzinG (2004) The Theory and Practice of Revenue Management. vol. 1. New York, NY: Springer.
23.
Van HoekRI (2001) The rediscovery of postponement a literature review and directions for research. Journal of Operations Management19(2): 161–184.
24.
WollmerRD (1992) An airline seat management model for a single leg route when lower fare classes book first. Operations Research40(1): 26–37.
25.
YılmazÖPekgünPFergusonM (2017) Would you like to upgrade to a premium room? Evaluating the benefit of offering standby upgrades. Manufacturing & Service Operations Management19(1): 1–18.
Supplementary Material
Please find the following supplemental material available below.
For Open Access articles published under a Creative Commons License, all supplemental material carries the same license as the article it is associated with.
For non-Open Access articles published, all supplemental material carries a non-exclusive license, and permission requests for re-use of supplemental material or any part of supplemental material shall be sent directly to the copyright owner as specified in the copyright notice associated with the article.