
Abstract
Fuel is an essential commodity in society with an amplified role during disasters. Disasters often cause a spike in demand for fuel and impose physical and operational constraints on fuel distribution. Accordingly, public and private sector stakeholders seek disaster preparedness and response interventions to ensure an adequate supply of fuel for emergency activities. We develop models to quantify downstream operational flow capacity, i.e., the volume of fuel that can be distributed from bulk storage terminals to retail gas stations via tanker trucks. We do this for both steady state conditions and nonsteady state conditions during disasters. The operational flow capacity measures can serve as inputs to optimal relief distribution and resource allocation problems, as well as enable a cost-benefit assessment of interventions aimed at increasing system capacity. We identify the best interventions for each type of bulk storage terminal structure and determine how to prioritize bulk storage terminals for each type of intervention when resources are limited. As the downstream fuel distribution system from bulk storage terminals to retail gas stations is similar across regions, our methodology and insights are generalizable not only within the US but also in countries with comparable distribution systems. To demonstrate impact on practice, we present a case study drawn from the application of our methodology to support US federal disaster preparedness. More generally, we contribute to system level understanding of multiserver tandem cyclic queues with time-limited customers found in relief distribution systems, which is often overlooked in the disaster management literature.
Keywords
Introduction
Natural disasters, man-made disasters, and accidents stress supply chains that are optimized to support material flows under a reasonable range of assumptions regarding supply, demand, and operating conditions. Post-disaster surges and shifts in demand combined with unexpected constraints in supply and operating conditions inhibit distribution systems such that goods may not reach people with vital needs. Facing such threats, leaders in the public, nonprofit, and private sectors seek life-saving interventions to restore and often enhance the flow of essential goods. Identifying appropriate humanitarian action requires a scientific understanding of complex supply chain systems to assess the impact of crisis interventions on flow capacity (National Academies of Sciences, Engineering, and Medicine, 2020; Spearman and Hopp, 2021). Our research seeks such understanding by modeling a key distribution system, namely that for fuel.
To motivate the problem, we provide details on the primary components of fuel distribution and describe disaster impacts on the system. Fuel distribution systems are often decoupled into upstream and downstream systems, with inventory at bulk storage terminals. The upstream fuel distribution system begins with crude oil, which may be extracted domestically or imported from abroad and is then refined into usable fuel. After refining, fuel is transferred to bulk storage terminals via different modes of transportation, including tanker ships, barges, and pipelines. The configuration of the upstream system varies by region.
In contrast, the downstream fuel distribution system is generalizable across regions. In the downstream system, bulk storage terminals (referred to as terminals) supply wholesale fuel to retail gas stations (referred to as stations), which then sell to consumers. The terminals are usually managed by petroleum companies or retail fuel chains, whereas the majority of stations are run by individual operators. Fuel is transported by carriers that employ hazardous material (HAZMAT) certified drivers operating tanker trucks (referred to as trucks). Contractual agreements determine which drivers (term used interchangeably with trucks, since one driver per truck is common in practice) can pick up fuel from which terminals and deliver it to which stations. An overview of the crude oil and gasoline distribution in the US is shown in Figure 1 (US Energy Information Administration, 2023).
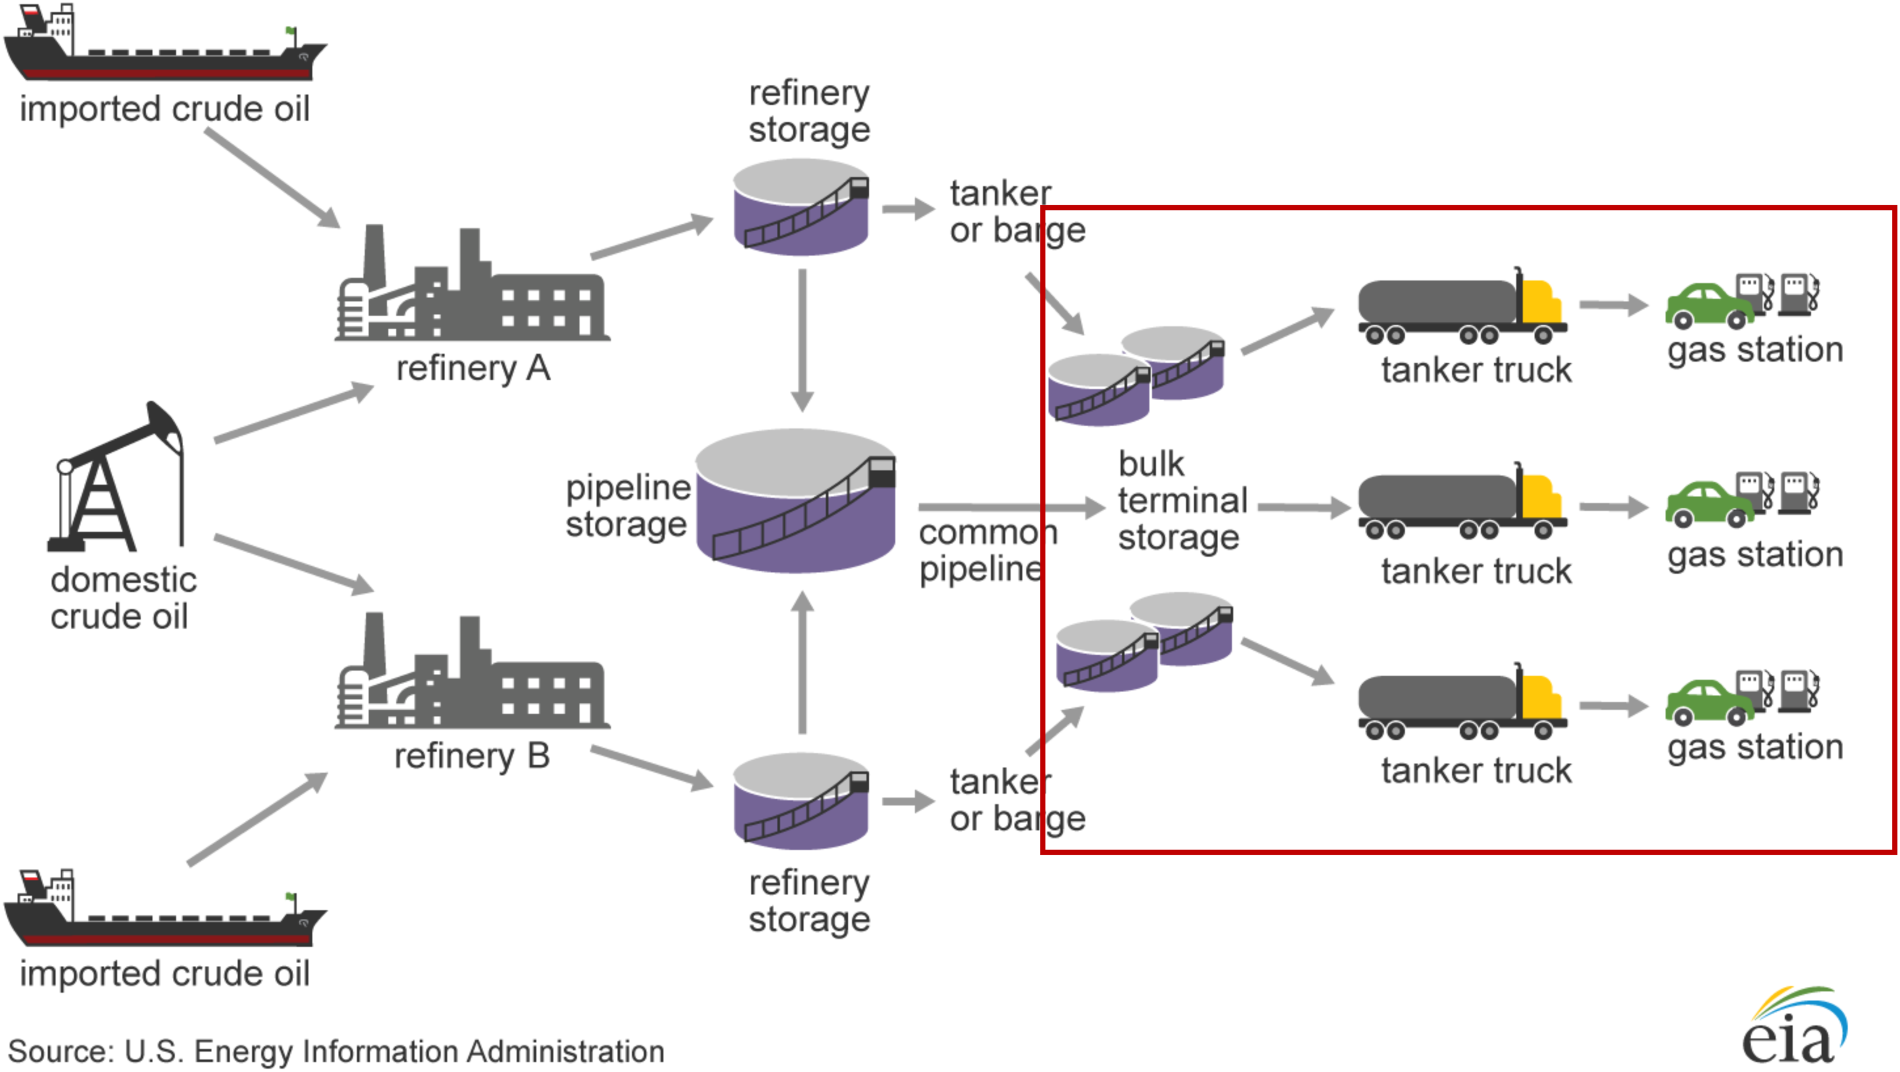
Crude oil and gasoline distribution system with the downstream components shown inside the red box.
When trucks visit terminals to pick up fuel, they must first check in at one of potentially multiple gates before entering the property and obtaining fuel at one of often multiple fueling bays. After filling up with fuel, the trucks deliver the fuel to a designated station and then return to the same or sometimes a different terminal to repeat the process until the daily hours of service limit has been reached. From an operational perspective, the downstream fuel distribution system is composed of a tandem multiserver queue with two primary components: (1) the terminal gate queues, and (2) the corresponding bay queues. Additionally, the trucks, which are time-limited terminal customers, perform multiple single-stop cycles in the system. We define operational flow capacity (OFC) of the described multiserver tandem cyclic queuing system with time-limited customers for downstream fuel distribution as the volume of fuel that can be distributed from terminals to stations by trucks in one day.
During disasters, fuel demand increases since humanitarian operations such as running generators, moving emergency response crews, and hauling relief goods increase fuel consumption. Moreover, news of impending natural disasters and extreme weather often increases consumer demand for fuel due to evacuation activities and hoarding in anticipation of future shortages. For example, during Hurricane Irma in September 2017, Florida witnessed the largest evacuation in its history. Fuel terminals experienced a
Unfortunately, increased fuel demand is often compounded by physical and operational capacity constraints in the upstream fuel distribution system. For example, during Hurricane Sandy in October 2012, flooding and power outages in the New York Harbor area closed down refineries and terminals (US Department of Energy, 2013). Similarly, during Hurricane Irma, port closures hindered fuel imports to Florida (Florida Department of Transportation, 2018). More recently, during Hurricane Ian in September 2022, the Central Florida Pipeline was shut down due to severe flooding in Orlando (S&P Global Commodity Insights, 2022). Likewise, a recent fire, at a natural gas liquefaction plant in Texas, in June 2022, caused the facility to be shut down completely for several months (US Energy Information Administration, 2022). It is not only physical damage of infrastructure by natural disasters or accidents that results in capacity constraints. During the cyberattack on the Colonial Pipeline, sections of the pipeline had to be shut down for security reasons (Colonial Pipeline, 2021).
Operational capabilities of terminals and transportation infrastructure can also create bottlenecks in the downstream system during disasters. Slow process times at terminals can be caused by a lack of employees (as they may be unable to work due to the disaster), drivers accessing unfamiliar facilities, power outages, and damaged equipment. For example, during Hurricane Irma some terminals had 2–4 hour long queues. Damaged roadways and evacuations can also cause traffic jams that slow down trucks. Additionally, the lack of HAZMAT or terminal-safety-certified drivers can reduce replenishment capacity for stations. Power outages and the lack of generator fuel can cause stations to shut down. Finally, the distribution system is not designed to fulfill the surges in demand that often follow disasters. During Hurricane Irma,
As disasters constrain fuel distribution, public and private sector intervention is often required to meet the surge in fuel demand. For example, driver hours of service rules, truck weight restrictions, and fuel blend restrictions have often been waived during previous disasters. The highway patrol has been used to quickly escort trucks through evacuation traffic and checkpoints. In addition to providing operational support, government policies for managing demand spikes have also been administered. For example, during Hurricane Sandy, rationing of supplies based on consumers’ odd or even license plate numbers was put in place to discourage daily hoarding (US Department of Energy, 2013; Florida Department of Transportation, 2018; Colonial Pipeline, 2021)
Studying previous disasters, we identify that the primary limiting factors associated with retail fuel availability were the terminal and transportation operations and not the fuel inventory in terminal storage tanks. For example, in Florida, terminals have 11–16 days of demand in inventory (DeCorla-Souza, 2018; Florida Department of Transportation, 2018). Thus, we study downstream fuel distribution systems and address the following research questions as part of ongoing support for the Federal Emergency Management Agency (FEMA) preparedness efforts:
The remainder of the paper is organized as follows, Section 2 reviews the relevant literature on disaster management and fuel distribution, with a focus on the knowledge gaps that we address. In Section 3, we describe the models used to measure the steady and nonsteady state OFC in multifacility downstream fuel distribution systems. Next, we discuss various disaster preparedness and response interventions available to stakeholders in Section 4. We analyze the effects of individual interventions on OFC for individual terminal facilities in Section 5. Then, we demonstrate the model’s applicability in a real life case study of the multifacility downstream gasoline distribution system in the state of Florida in Section 6. Finally, our research contributions and potential directions for future extensions are summarized in Section 7.
Building system-level understanding of supply chain dynamics as a foundation for effective decision support has been recommended by National Academies of Sciences, Engineering, and Medicine (2020). Gupta et al. (2016) additionally suggest finding research problems in the chaos of disaster (we identified this problem while supporting FEMA during Hurricane Irma), emphasize capacity recovery and restoration, and conclude that the underlying thread for effective disaster management is understanding integrated systems. They highlight unified models for transport, storage, and distribution, a theme highlighted again by Besiou et al. (2021). More importantly, they suggest that research must convince administrators that proposed models actually contribute to solving the problem. Our research, which played a central role in recent FEMA studies, confirms that models measuring system capacity can achieve this goal. Our work contributes to two primary areas of the literature: disaster management (Section 2.1) and fuel distribution (Section 2.2).
Disaster Management
Relief distribution and resource allocation during disasters have been extensively studied and reviewed (e.g., Anaya-Arenas et al., 2014; Baxter et al., 2020). The majority of this research develops optimization models for problems like facility and asset location, flow assignment and scheduling, vehicle routing, and fleet management (e.g., Salmerón and Apte, 2010; Doan and Shaw, 2019; Pedraza-Martinez et al., 2020). However, we must first accurately measure distribution capacity constraints, to better understand and evaluate decisions for complex and dynamic systems.
With that intent, simulation models have been applied to humanitarian logistics (Pareja Yale et al., 2020). Problems such as distribution facility layout and operations evaluation, asset and funds management, fleet mix, purchase, sales, and scheduling, and collaboration strategies evaluation for the distribution of relief goods have been modeled (e.g., Besiou et al., 2014; Stauffer et al., 2018; Gu et al., 2021). These studies either do not model facilities, or consider just one supply facility, or do not model multiple cycles of distribution vehicles. In contrast, we model multicycle operations for multiple facilities.
Some disaster research explores scheduling of multicycle fleet and workers’ movements in steady state conditions in air force operated and charity run storehouses (Mattila et al., 2008; Urrea et al., 2019). They use simulation methods, since existing queueing theory literature does not have frameworks for multiserver tandem cyclic queues with time-limited customers, only single-server tandem cyclic queues (e.g., Campbell, 1991; Boxma and Daduna, 2014) or multiserver tandem queues (e.g., Kock et al., 2008; Baumann and Sandmann, 2017). Following the call for more humanitarian study validated with simulation (Kovacs and Moshtari, 2019), we extend this body of literature and apply queueing theory for steady state approximation and discrete event simulation for nonsteady state OFC measurement of multiserver tandem cyclic systems with time-limited customers.
Furthermore, previous resource allocation problems examine retrofitting, physical expansion, and repair of distribution facilities and transportation infrastructure (e.g., Salmerón and Apte, 2010; Duque et al., 2016; Sun and Zhang, 2020). Few studies model the effects of process time or fleet size interventions (Mattila et al., 2008). Our focus on interventions that increase OFC without building infrastructure is inspired by the coronavirus disease 2019 (COVID-19) pandemic experiences where production and transportation systems increased volume quickly by using existing resources more fully and leveraging convertible capability (Ergun et al., 2022; Li et al., 2022). Utilizing dynamic interventions to improve complex adaptive systems has not yet been fully explored in disaster literature (Polater, 2021).
We contribute to the theoretical understanding of multicycle operations in multifacility disaster relief or downstream fuel distribution systems, which is often overlooked. Descriptive and quantitative research to build scientific knowledge (Spearman and Hopp, 2021) is central to our approach. By explicitly modeling the OFC (He et al., 2021) we fill the highlighted gaps in literature. Although our models are motivated by downstream fuel distribution, our framework can be applied to several other last-mile relief distribution problems for commodities such as water, food, and medical supplies as well as facility operations with multiple cycles of picking, packing, loading, and off-loading. Moreover, we analyze resource allocation in terms of interventions that improve terminal process times, transportation speed, fleet size, and hours of service for individual terminal facilities. We also present a real life case study of multifacility downstream fuel distribution system.
Fuel Distribution
Many researchers have studied fuel distribution systems using optimization methods in steady state conditions (Lima et al., 2016; Cunha de Bittencourt et al., 2021). However, there is limited research on optimal flow assignment and scheduling, infrastructure repair and resilience resource allocation, and system analysis using simulation methods for fuel distribution systems during disasters.
Existing studies focus on upstream distribution (Sabuncuoglu and Hatip, 2005; Cafaro et al., 2010), a single terminal facility (Reis et al., 2017), outlining system vulnerabilities (Costa et al., 2019), or infrastructure improvement (DeCorla-Souza, 2018). Only a few of them analyze the effects of improving terminal bay processes and fleet size on the distribution system’s performance (e.g., Reis et al., 2017; DeCorla-Souza, 2018). Additionally, none of them consider the cyclic movement of trucks in the system. We contribute to this body of literature by modeling the cyclic movement of trucks in the entire downstream distribution system and evaluating a suite of disaster interventions that improve terminal gate and bay times, transportation speed, fleet size, and hours of service.
Modeling OFC
In this section, we develop an analytical queueing model and a discrete event simulation model to measure the steady state (Section 3.1) and nonsteady state (Section 3.2) OFC, respectively, of multifacility downstream fuel distribution systems. We model multicycle movement of trucks, i.e., from terminals to stations and back, in a multifacility setting, i.e., multiple terminals within multiple terminal groups. We measure OFC in terms of millions of gallons of fuel per day (MMgal/day), as is relevant in practice.
Let
Trucks assigned to terminal group
After the check-in process, the trucks proceed to one of the multiple filling bays to load fuel in
After filling fuel at a bay, the trucks travel distance
Drivers can be operational for a maximum of
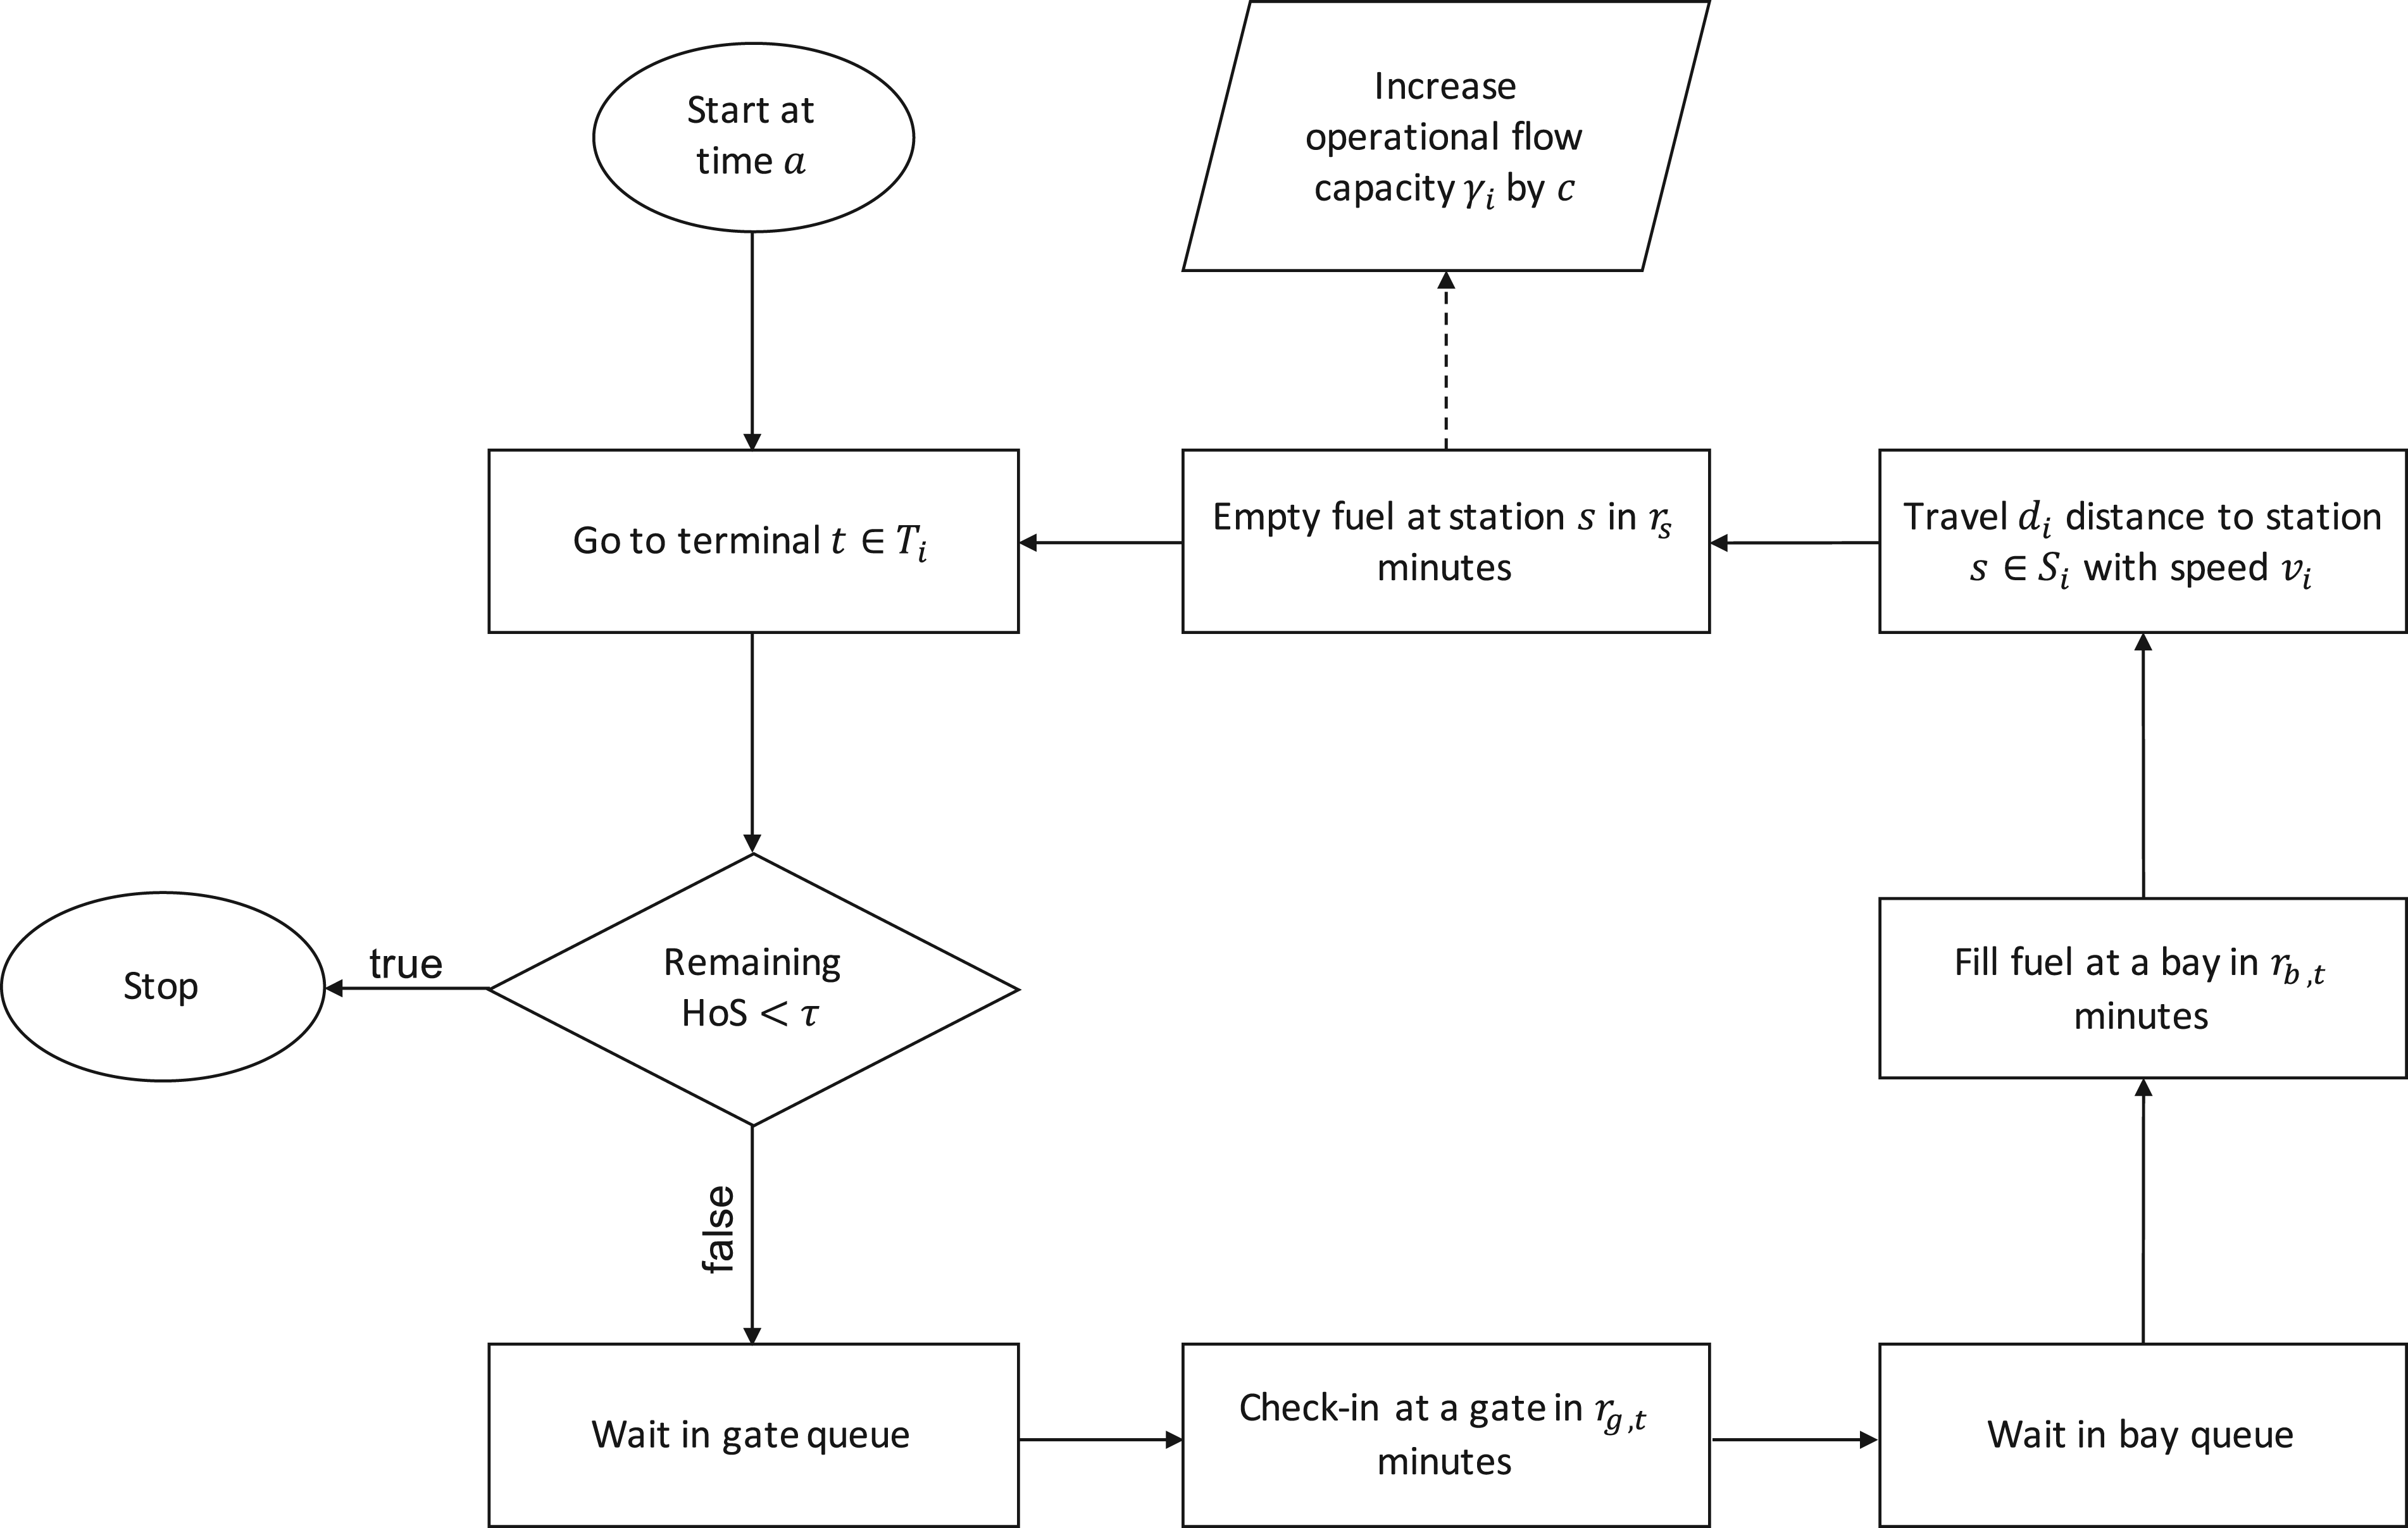
Flow chart of the process cycle of a truck serving terminal group
First, we introduce an analytical queueing model to approximate the average steady state OFC,
We measure the throughput from the point of view of a single terminal


Next, we simulate the nonsteady state movement of trucks for
During disasters, processes can slow down and infrastructures can shut-down suddenly, and a new steady state can take a long time to set in. Using steady state OFC will therefore overestimate the system’s capability under disaster conditions. Thus, we simulate individual
All terminals
In the next section, we discuss disaster preparedness and response interventions that can improve the described system’s parameters and consequently increase OFC.
Disaster Interventions
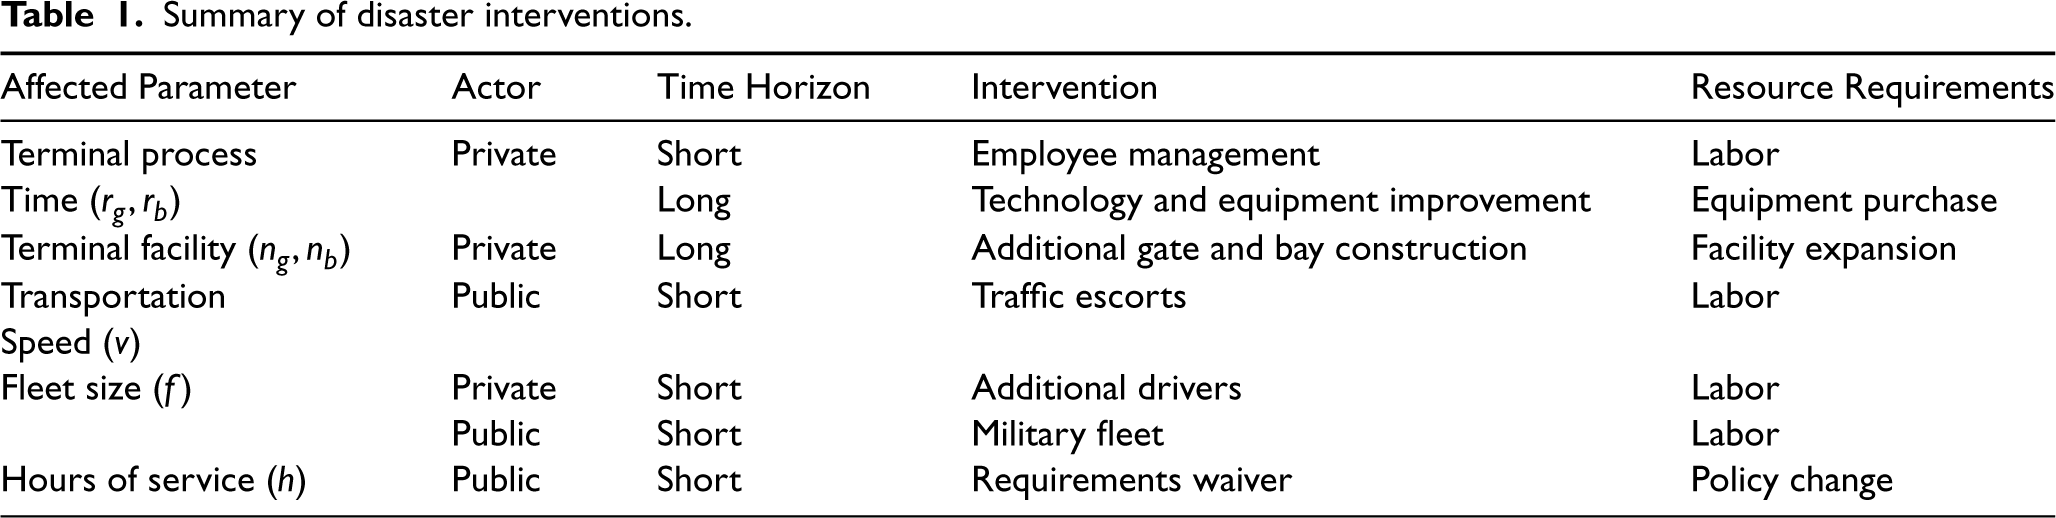
In this section, we describe disaster interventions that can directly improve terminal gate and bay times, transportation speed, fleet size, and hours of service, thus contributing to an increase in OFC. Table 1 summarizes these interventions by the parameters they influence, the actor responsible for implementing (private or public), the time horizon (short or long-term), and the resource requirements for implementation.
Summary of disaster interventions.
Summary of disaster interventions.
First, we consider terminal process time interventions that directly reduce gate time,
Terminal operators can incrementally invest in equipment like larger pipes or extra loading arms at the bays to decrease
To directly improve the transportation speed,
In Section EC.1 of the e-companion, we discuss these interventions in further detail, including the implementation considerations. Such information provides a foundation to further develop implementation cost scenarios as part of a rich cost-benefit analysis for public and private sector intervention. We also mention some additional policy, infrastructure, and operational interventions that do not directly affect model parameters, but remove barriers to improvement.
In the following sections we quantify the benefits of the discussed interventions, in terms of increase in OFC, for individual terminal facilities and a real life case study of multifacility downstream distribution system.
In this section, we quantify the increase in OFC by improving terminal gate and bay times, transportation speed, fleet size, and hours of service for individual terminal facilities. We consider different levels of improvement by changing corresponding parameter values and identify which type of intervention is most beneficial for which terminal structure. Although it is difficult to collect precise proprietary data, we recognize the call for research using field data, with all its “noise, dirt, and missing elements” by Besiou and Van Wassenhove (2020). Similar to Biller et al. (2019) and Costa et al. (2019) we rely on public sources, industry insights, visits to terminals in the US, and validation from industry practitioners to identify parameter values.
Individual Interventions
We model a single terminal group that has a single terminal with different number of gates,
In the nonsteady state model we simulate a set of stations to be served by the terminal group,
We fix the start time of truck objects in the simulation by sampling
Next, we set the baseline values for the intervention parameters. The time to check in at terminal gates is assumed to be
We study the relationship between the average nonsteady state OFC,
Baseline parameter values for individual terminals.
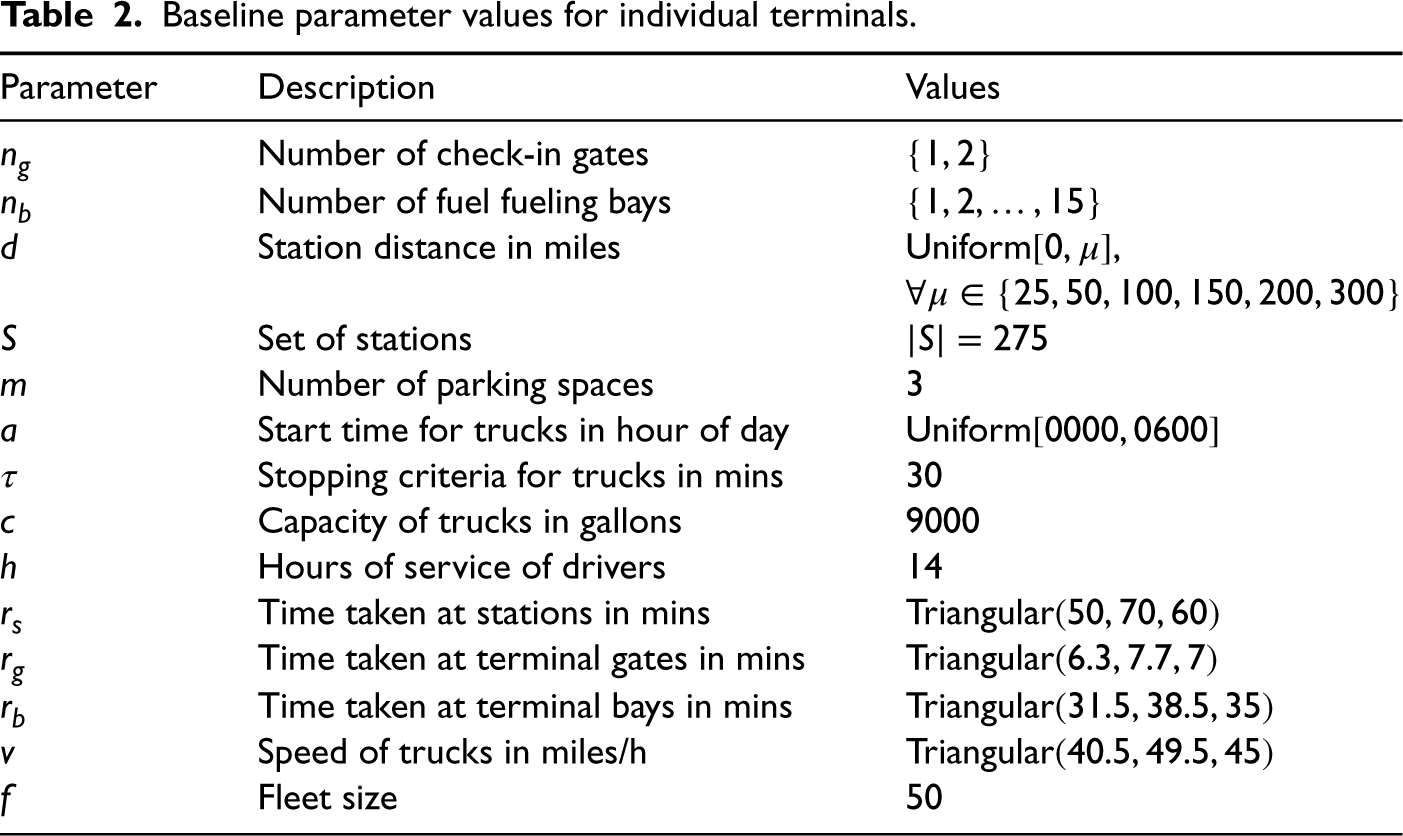
Baseline parameter values for individual terminals.
In addition, we use Welch’s 1-tail
First, we explore terminal gate time interventions by modeling
The results for common terminal structures are shown in Figure 3, and additional terminal structures in Section EC.2 of the e-companion. We also plot the improvement threshold of
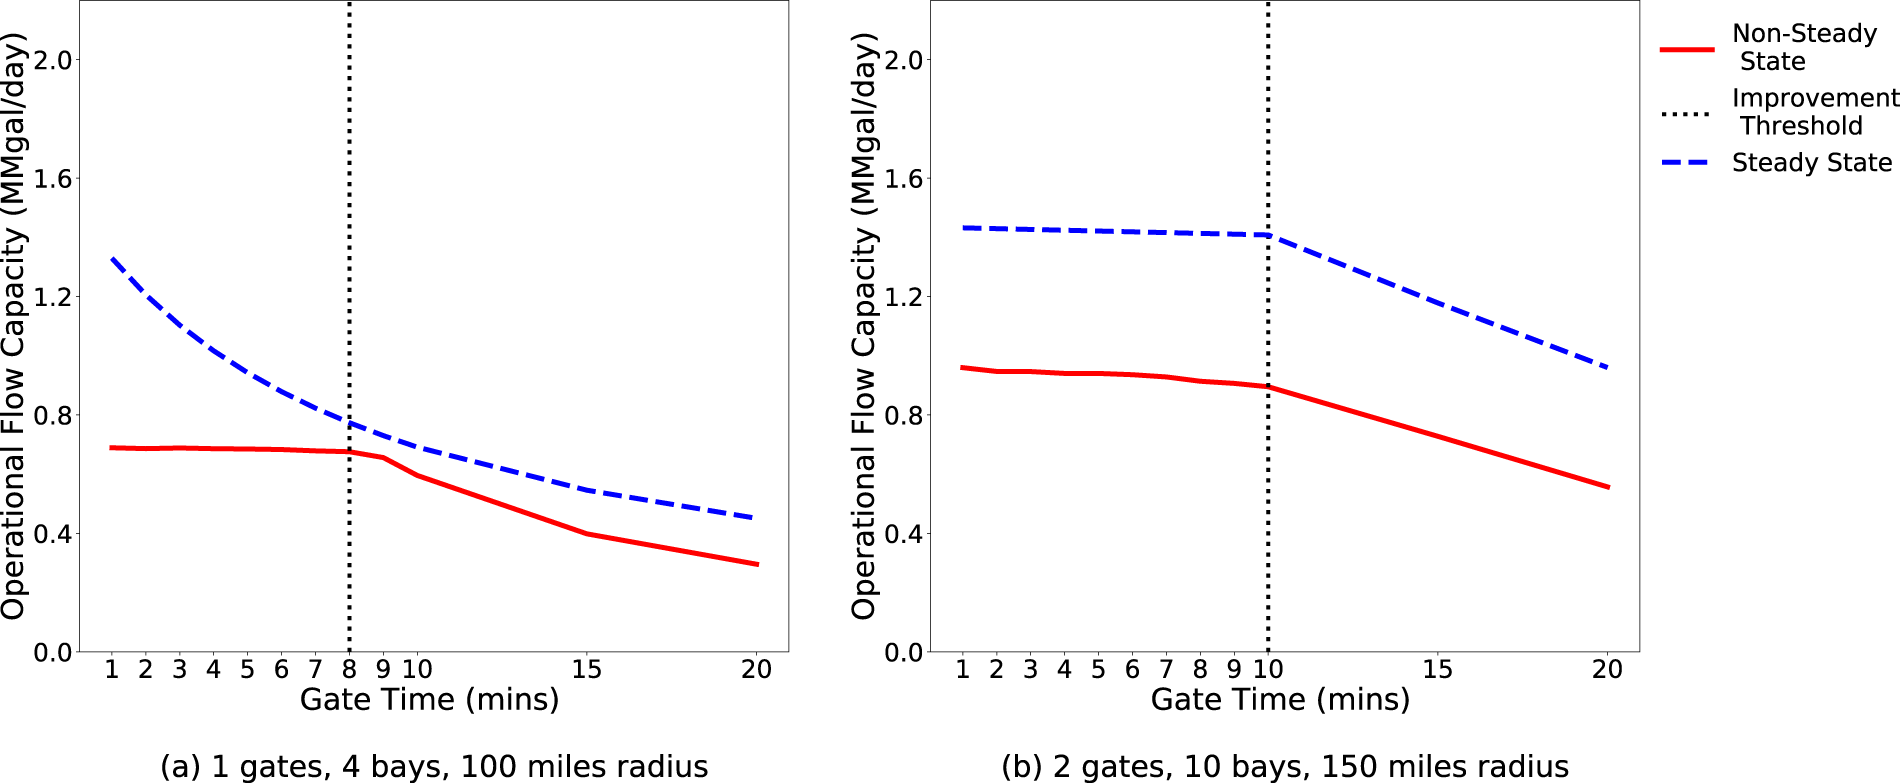
Operational flow capacity (OFC) vs terminal gate time,
We expect OFC to increase with decrease in
Similarly, we examine the effects of bay time interventions and simulate
The results for common terminal structures are shown in Figure 4, and additional terminal structures in Section EC.2 of the e-companion. We also plot the improvement threshold of
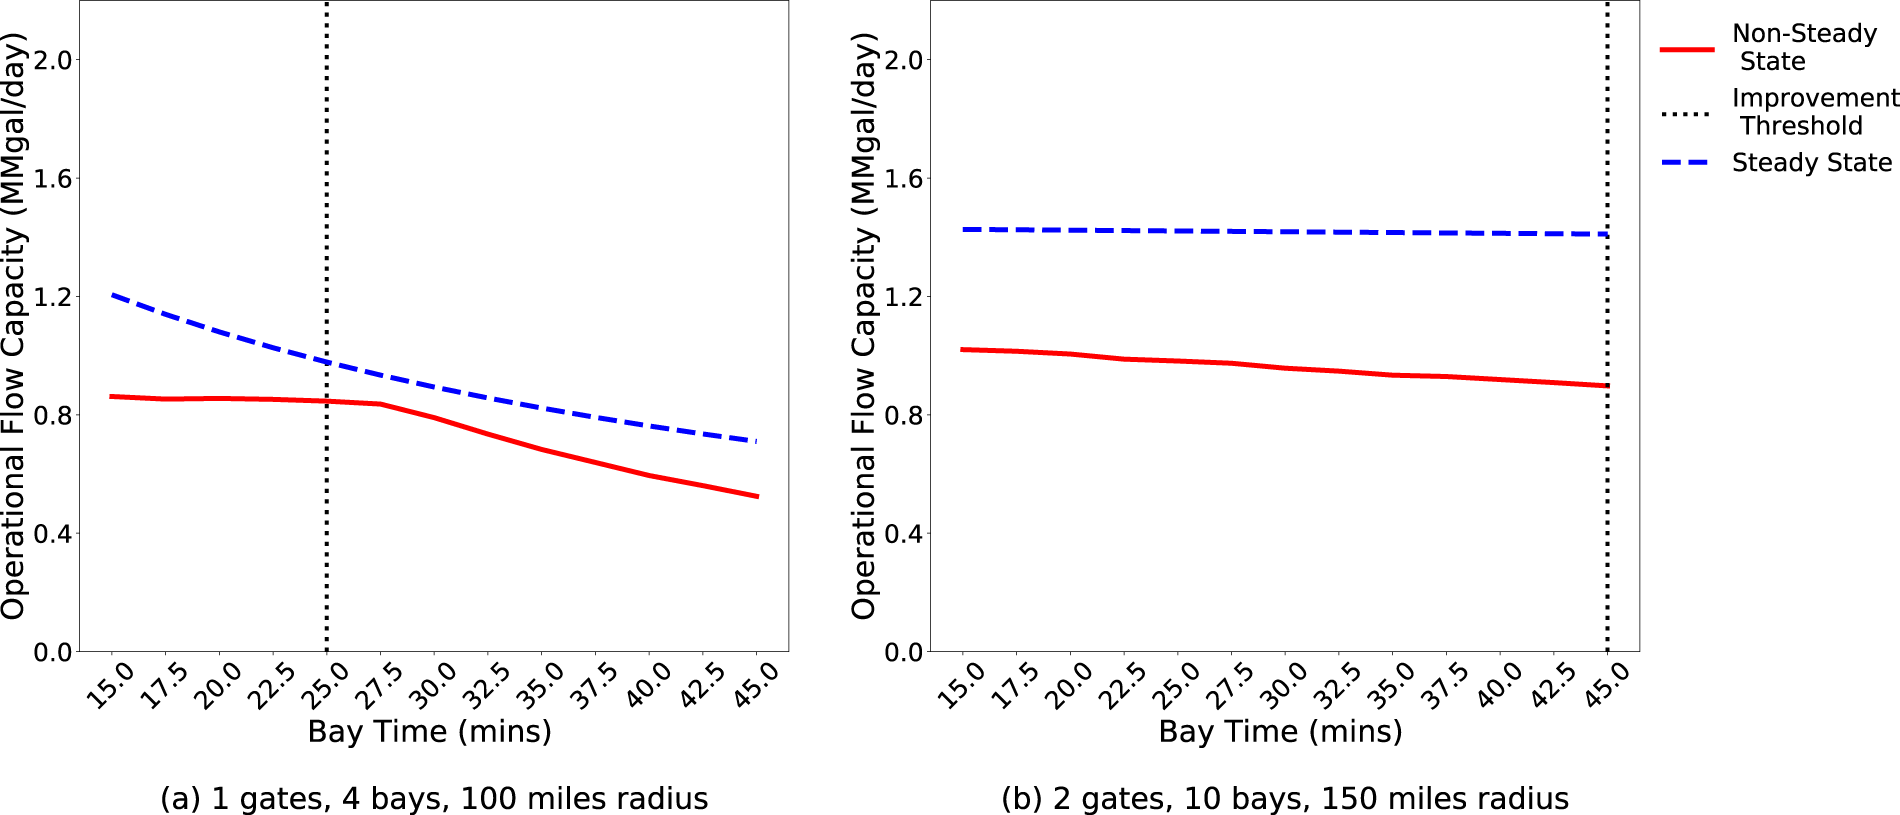
Operational flow capacity (OFC) vs terminal bay time,
Similar to
Next, we consider transportation speed interventions. We simulate
The results for common terminal structures are shown in Figure 5, and additional terminal structures in Section EC.2 of the e-companion. We also plot the improvement threshold of
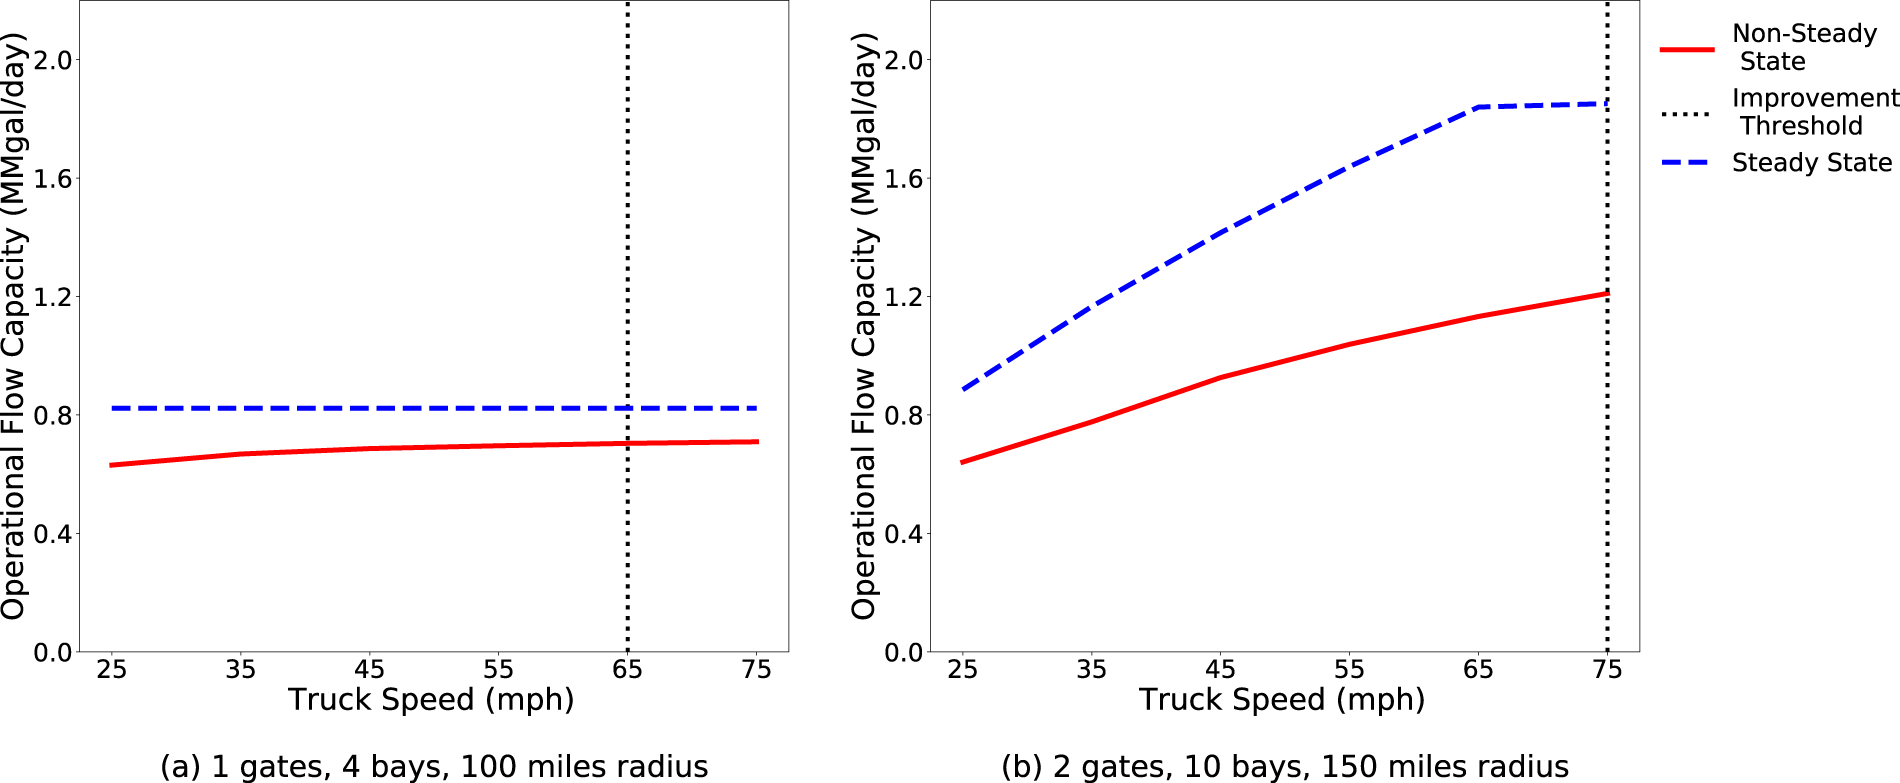
Operational flow capacity (OFC) vs transportation speed,
As
We then study the effect of fleet size interventions on OFC and simulate
The results for common terminal structures are shown in Figure 6, and additional terminal structures in Section EC.2 of the e-companion. We also plot the improvement threshold of
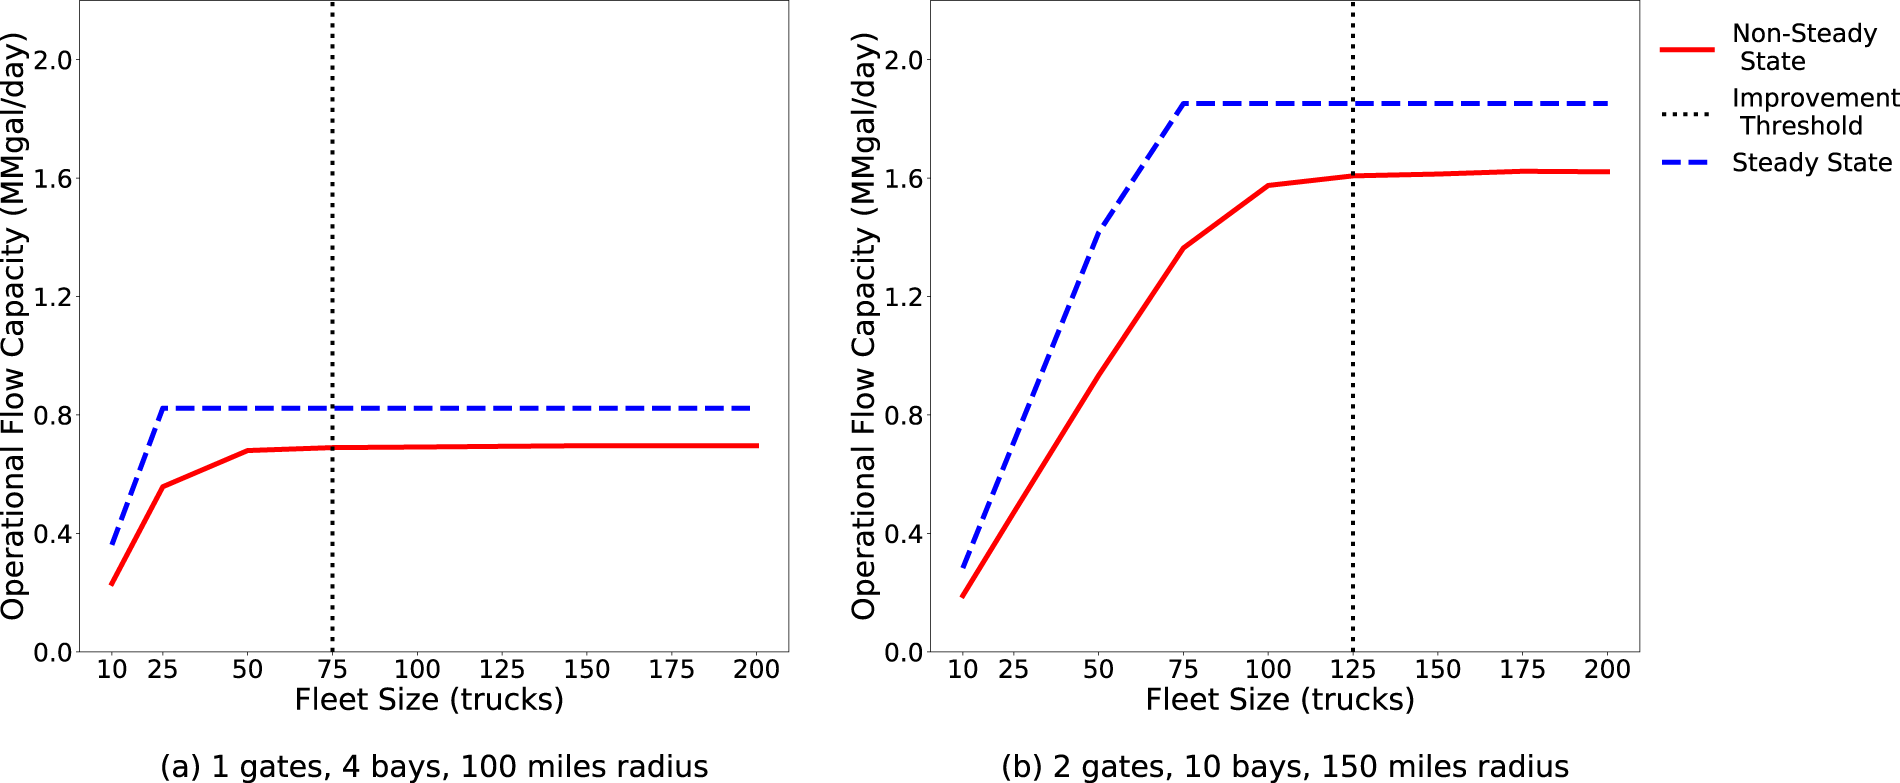
Operational flow capacity (OFC) vs fleet size,
We expect
Finally, we evaluate the relationship between OFC and
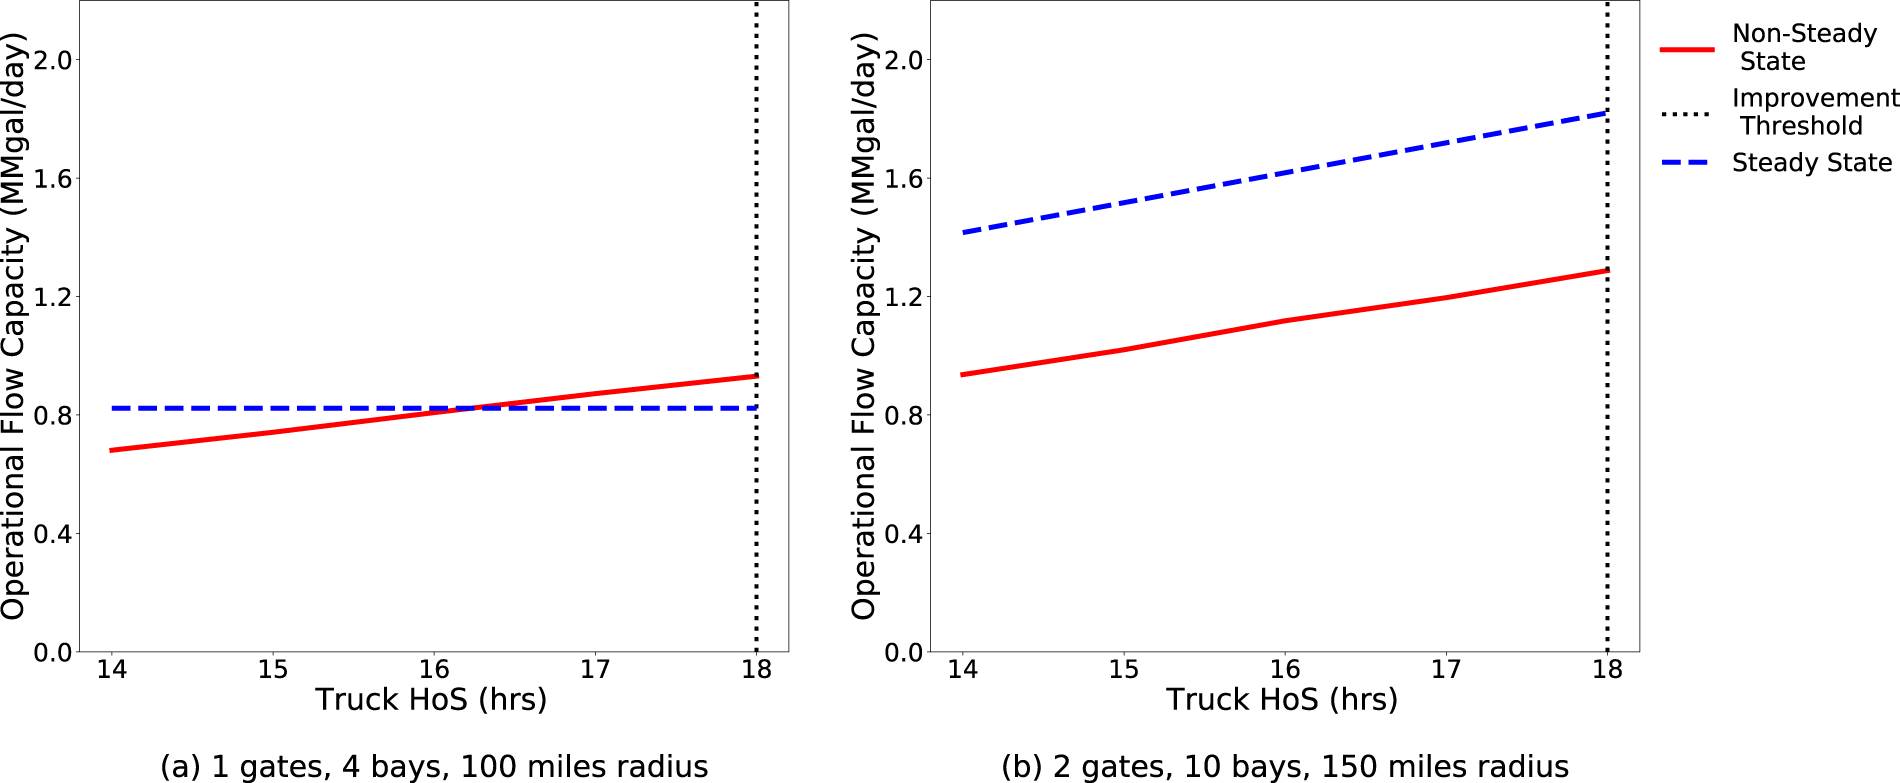
Operational flow capacity (OFC) vs hours of service,
For all combinations of structural parameters, the
We make an important note that the analytical approximation of steady state OFC overestimates the capabilities of the terminals during nonsteady state of disasters and different levels of all interventions. Thus, we propose using nonsteady state OFC, that considers multicycle operations, as a tighter constraint as opposed to steady state OFC for optimal fuel or relief distribution problems. Moreover, if there are limited resources to implement a particular intervention, then policymakers can use sensitivity analysis results, in Section EC.2 of the e-companion, to prioritize terminals which will have the largest increase in OFC. We note that these results also quantify benefits for long-term infrastructure investment, like adding an extra check-in gate or a fueling bay, since we include a wide range of
Apart from sensitivity analysis on intervention parameters to measure effects on OFC, we also conduct sensitivity analysis on the rest of the fixed parameters in Section EC.2 of the e-companion. We observe that changing number of parking spaces,
Various interventions might independently (and significantly) increase OFC for different terminal structures. If stakeholders have limited resources, then they will likely prioritize the intervention that increases OFC by the largest magnitude for terminals present under their jurisdiction. Thus, we summarize for each terminal structure which intervention leads to the highest OFC at the improvement threshold in Figure 8. The shape of the marker indicates the intervention that increases OFC the most; the text next to the marker indicates the improvement threshold value of the corresponding intervention parameter; and the shade in gray-scale indicates the magnitude of OFC at the improvement threshold. We ignore hours of service in this analysis since it statistically significantly increases OFC for all terminal structures for all values, and it does not have direct costs attached to it that would be considered in implementation budgets.
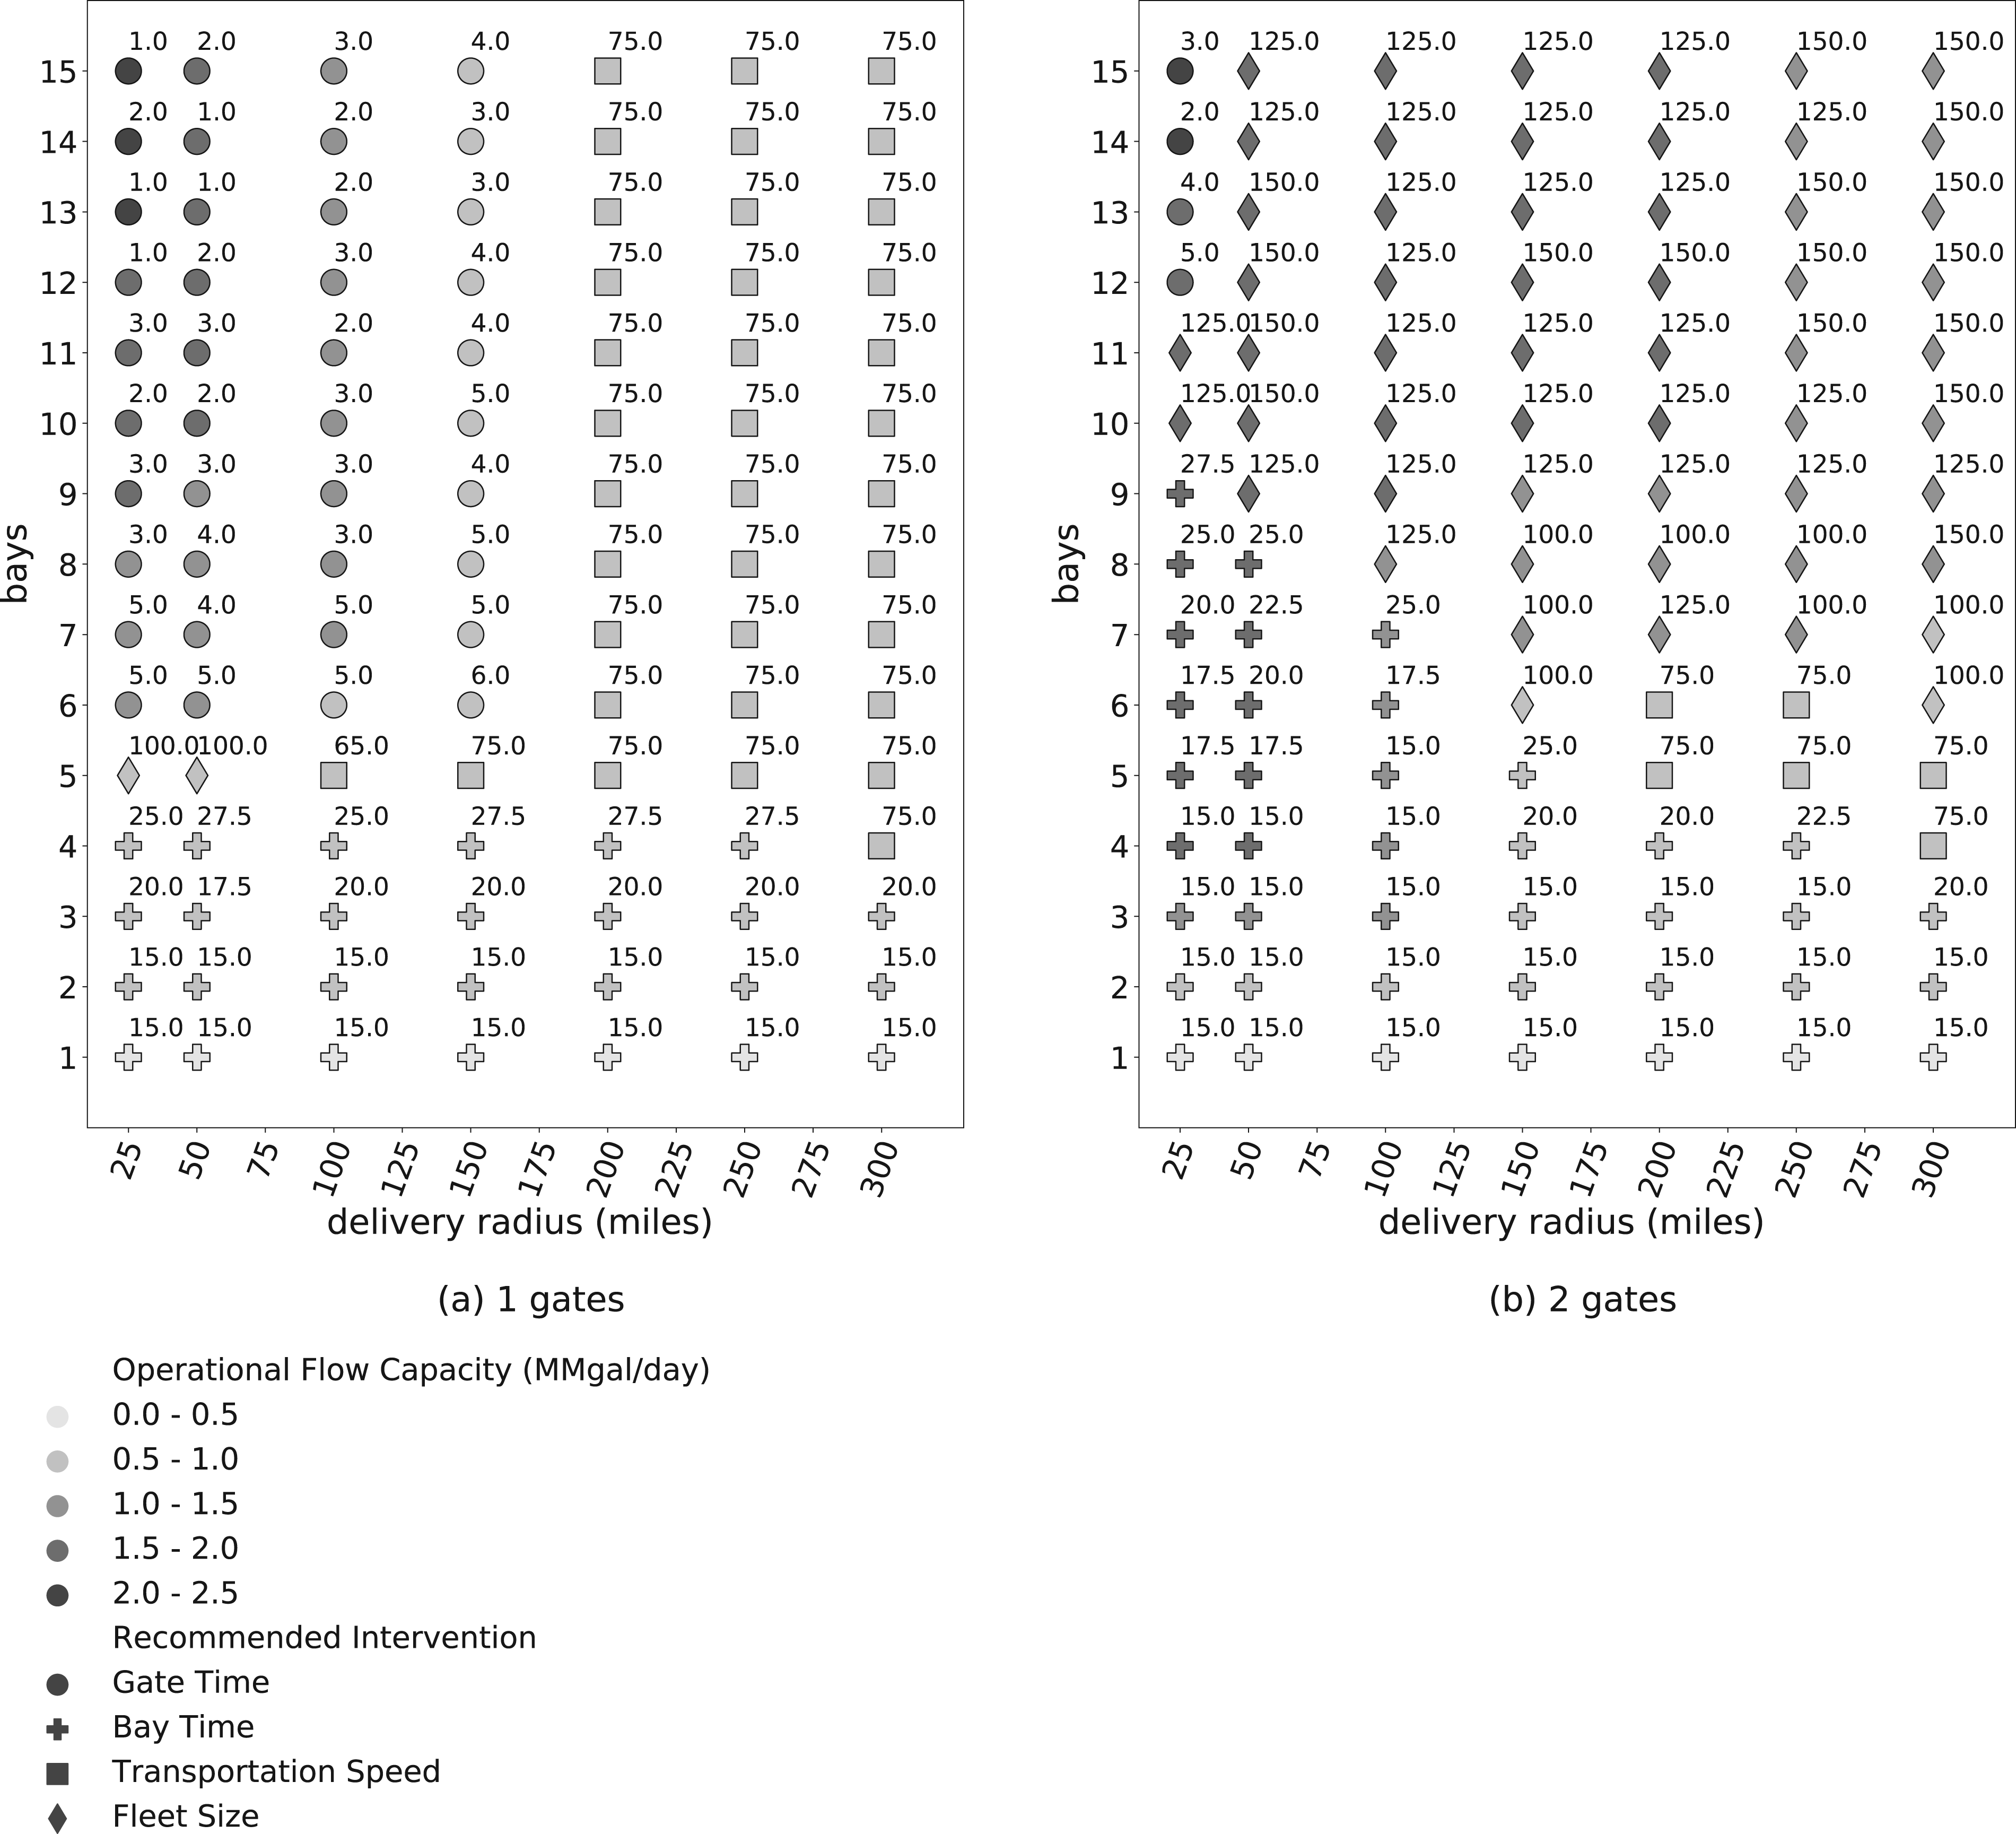
Recommended interventions to prioritize for each terminal with different number of gates,
In general, terminal gate time interventions should be targeted at terminals with a single gate, a large number of bays, and short station distances. Terminal bay time interventions should be targeted at terminals with a small number of bays. Transportation speed improvement increases OFC the most when terminals have long station distances. Increasing fleet size is more beneficial when terminals have multiple gates, a larger number of bays, or serve longer station distances.
Implementing multiple interventions can increase OFC even further. Thus, we study multiple interventions and apply the generalized insights discussed above to the real-life case study of the multifacility downstream gasoline distribution in Florida in the following section.
In this section we examine the real-life case study of the multifacility downstream fuel distribution system in the state of Florida. Florida experiences tropical storms and hurricanes with high frequency (National Oceanic and Atmospheric Administration, 2023b). In the last two decades, six major hurricanes (category 3-5 on Saffir-Simpson Hurricane Wind Scale) have made landfall in Florida (National Oceanic and Atmospheric Administration, 2023a). Moreover, most of the terminals in Florida are located near the coast, making the downstream gasoline distribution system highly vulnerable to operational and infrastructure capacity constraints in addition to demand surges during hurricanes. Thus, it is especially important to be prepared for extreme disaster scenarios for regions like Florida.
We use data from Internal Revenue Service (2022), Oil Price Information Service (OPIS), and IHS Markit company, as part of our ongoing collaboration with FEMA to support preparedness efforts. The downstream gasoline distribution network of Florida consists of
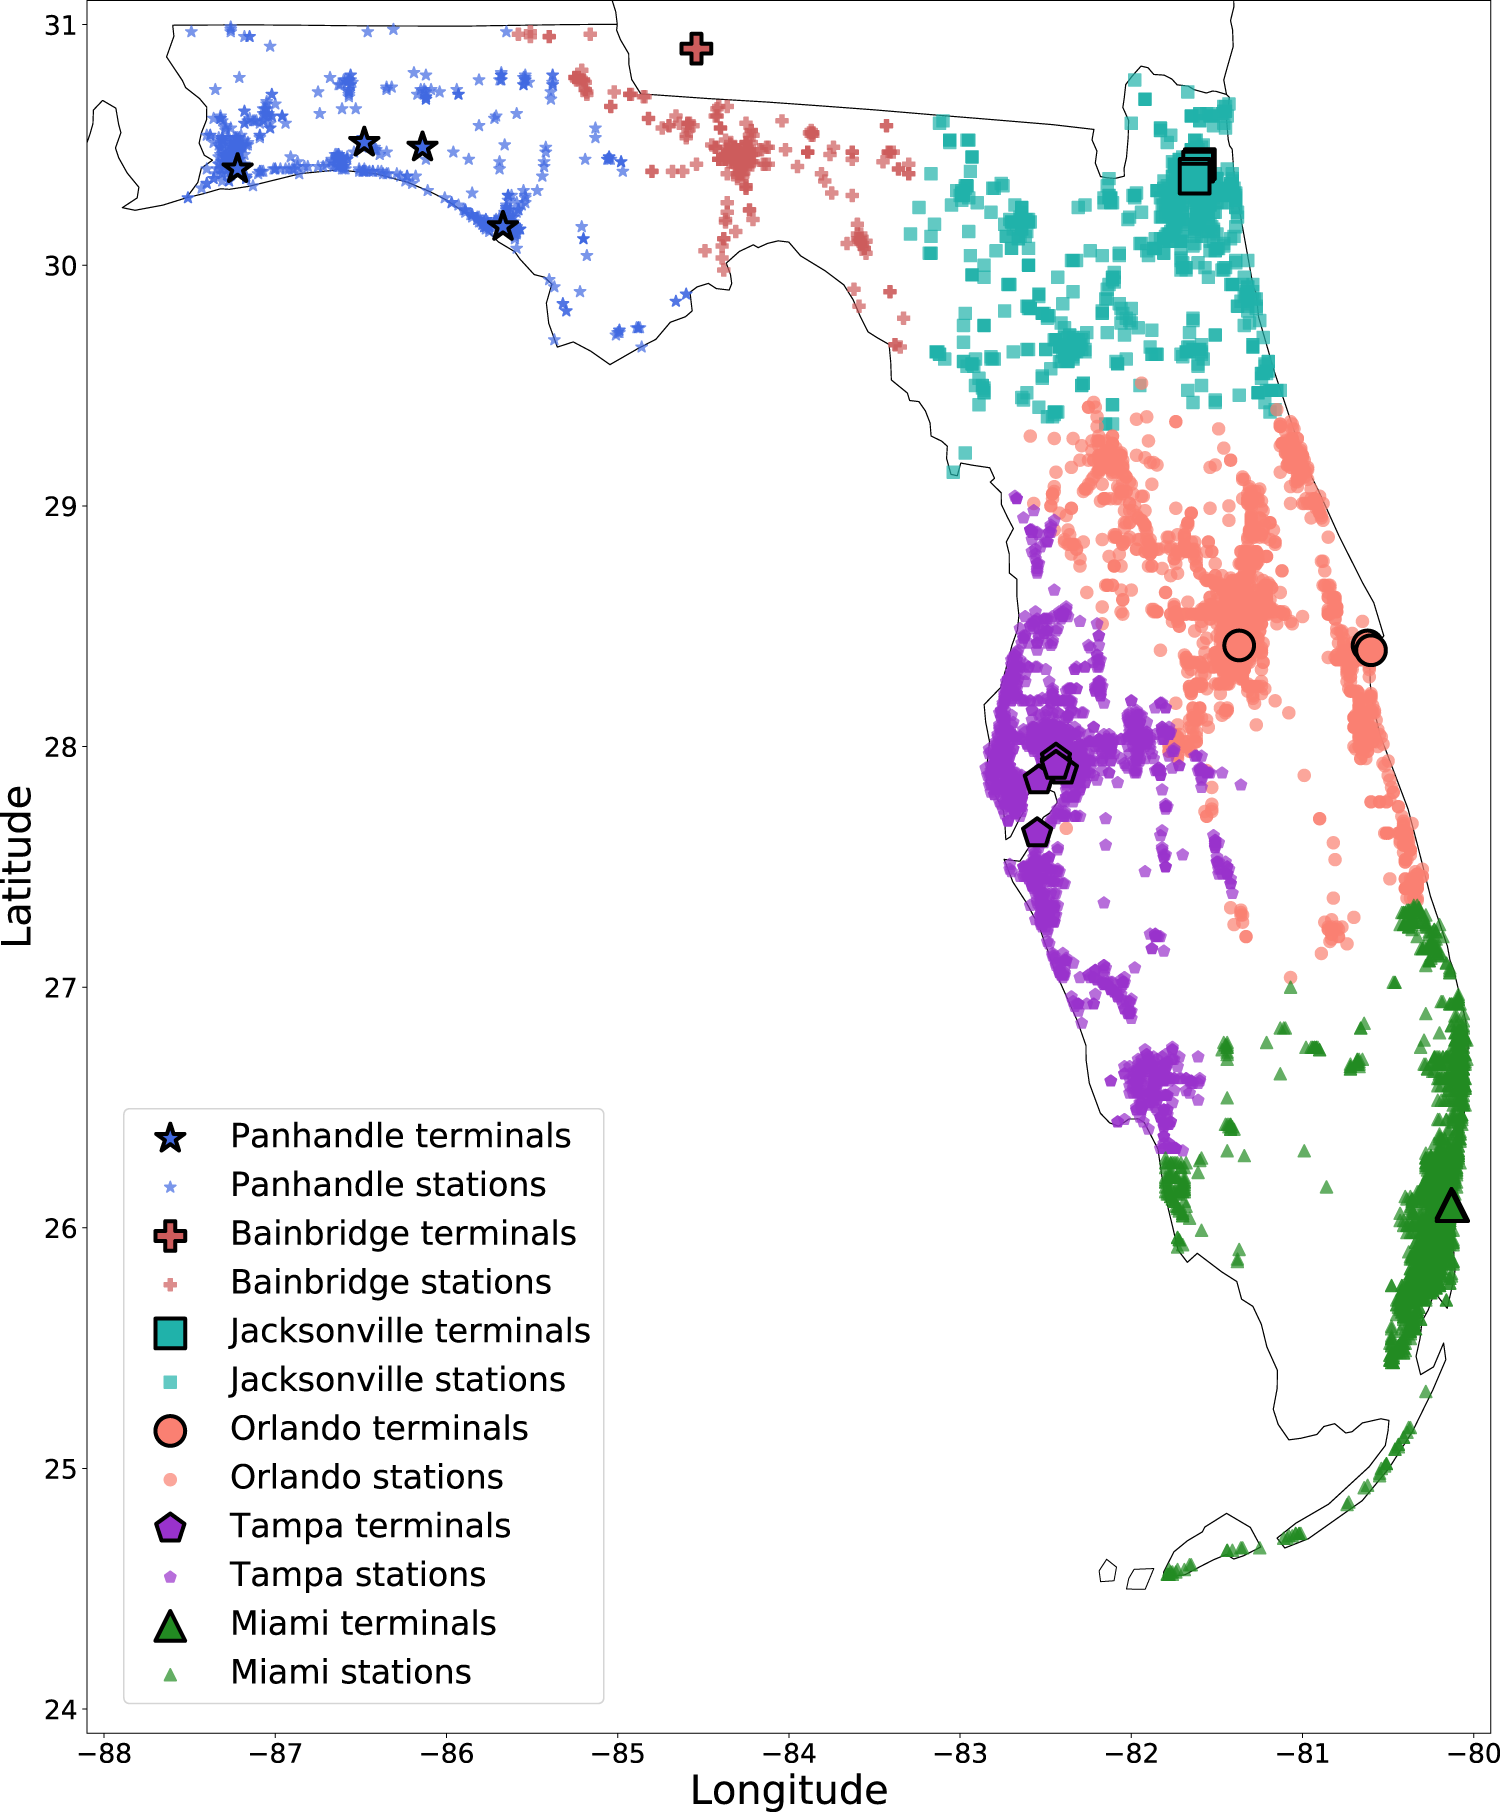
Map of gasoline terminals and stations by terminal group in and around Florida.
We note that OPIS assign stations to terminal groups based on pricing and do not consider OFC. The station distances, 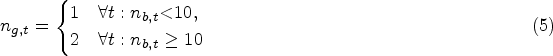

Details of gasoline terminal groups in and around Florida.
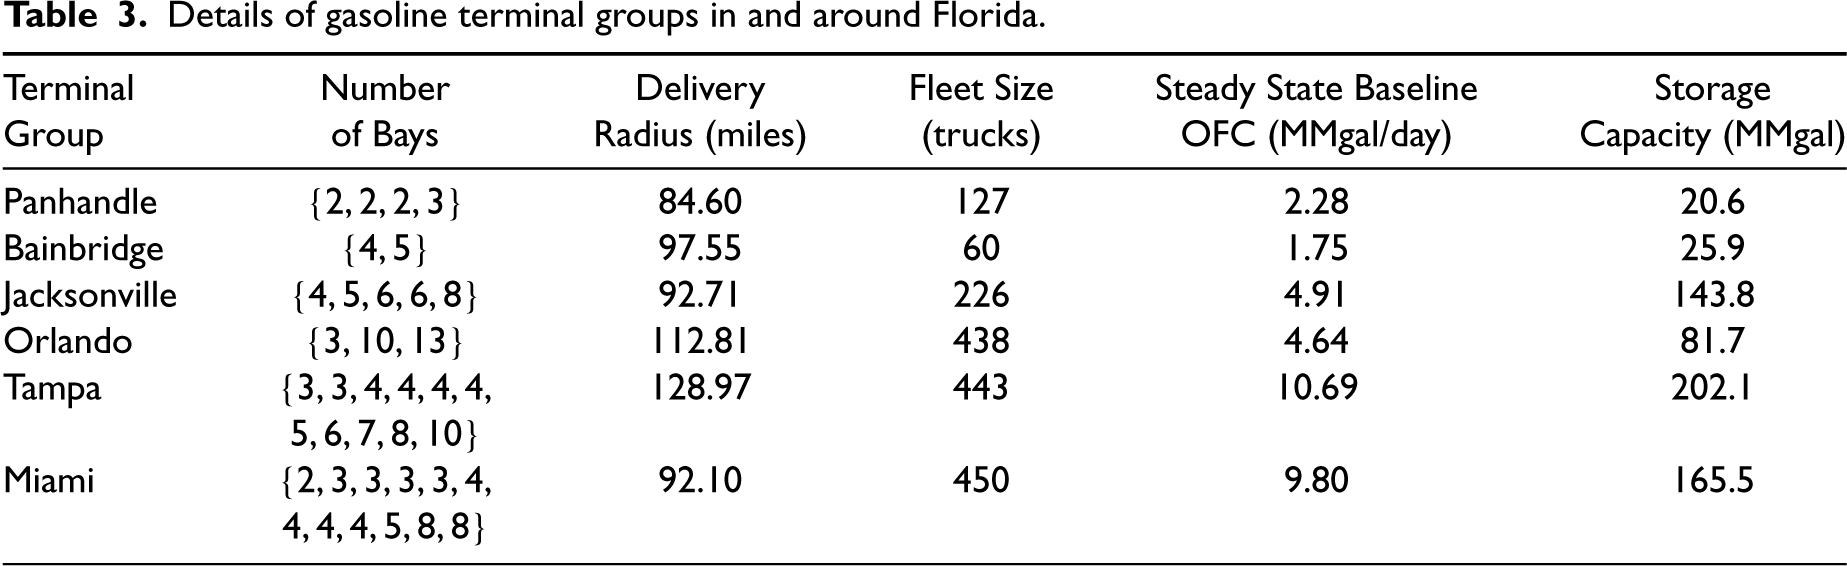
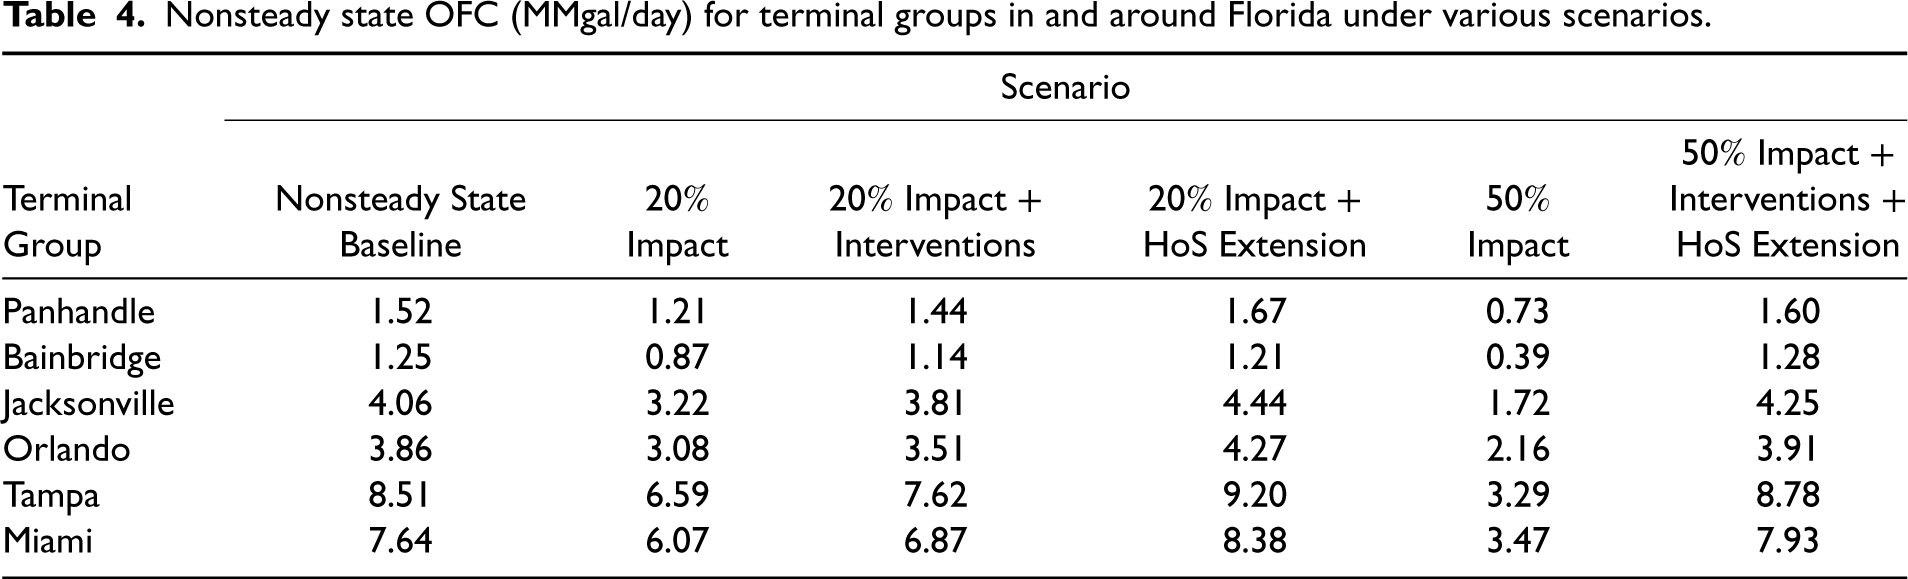
We then measure the average nonsteady state OFC,
Nonsteady state OFC (MMgal/day) for terminal groups in and around Florida under various scenarios.
OFC = operational flow capacity; HoS = hours of service.
Similar to the results in Section 5, we find that for terminal groups in Florida, baseline
Next, we consider a “
Then, we look at the “
In Panhandle, the largest terminal has
However, when there is
Similarly, we also model a “
Then, we model the “
In the case of Bainbridge, we exceed baseline
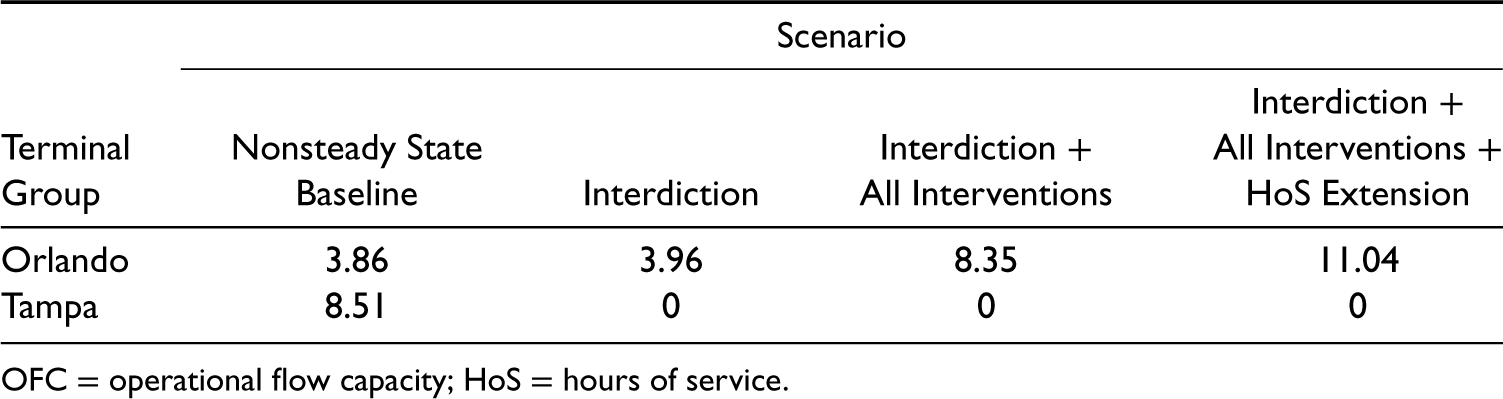
Next, we consider the “Interdiction Scenario” where we assume that under catastrophic conditions all of Tampa’s terminals are shut down, possibly due to power outages or irreparable damages by hurricanes. For example, the Port of Tampa Bay was shut down for five days during Hurricane Irma in September 2017 (Kolpakov et al., 2022) and for four days during Hurricane Ian in September 2022 (NOAA Office of Response and Restoration, 2023). From the OPIS data, we know that
We model the “Interdiction + All Interventions Scenario” where we apply gate and bay time interventions to all of Orlando’s terminals such that
In addition, if we also extend HoS such that
In the above scenarios, we assume that the intervention terminal gate and bay times are achievable, all trucks move with increased speed, all trucks utilize the extended operational hours, and additional trucks are available to be added to the fleet. Thus, these results show an upper bound of OFC that can be achieved. We additionally study the case of the multifacility downstream gasoline distribution in Utah, in Section EC.3 of the e-companion, to demonstrate the applicability of our methodology across geographies.
The case study employs insights from the numerical analysis to identify the best interventions for each terminal group. We observe that singular interventions are sufficient to achieve an adequate increase in OFC under lower disaster impact scenarios. However, in the case of more severe disasters, multiple interventions become essential. We find that restoration of transportation speed is a crucial intervention across all scenarios. More obviously, terminal groups with a larger number of terminals and/or terminals with a larger number of bays require more interventions. It is also noteworthy that in catastrophic scenarios such as the interdiction of a terminal group, implementing all interventions for the entire secondary terminal group may still fall short in fully restoring lost capacity, as the secondary group might not be sizable enough. In such instances, sourcing from an additional terminal group may be more beneficial than enhancing the existing backup terminal group. Thus, demand allocation to multiple terminal groups and optimal intervention allocation should additionally be modeled to prepare for catastrophic disasters.
Natural and man-made disasters often cause a spike in demand for fuel as well as impose physical and operational constraints on fuel distribution. The literature on fuel distribution lacks models to rigorously assess the flow to retail gas stations following disaster. Thus, we develop models to measure the downstream fuel OFC, i.e., the volume that can be distributed from bulk storage terminals to retail gas stations by tanker trucks in one day, for steady and nonsteady states. Results contribute to a system level understanding of fuel distribution that continually faces bottlenecks during disaster response. Moreover, this work contributes more generally to scientific understanding of multiserver tandem cyclic queues with time-limited customers found in relief distribution systems, which is often overlooked in disaster management literature. Although we focus on fuel, the approach can be applied to evaluate OFC for distribution of water, food, healthcare supplies, and other humanitarian supplies from staging areas where fleet drivers must perform multiple cycles to meet demand. We additionally make the case of utilizing OFC as a tighter constraint for resource allocation problems in distribution systems, especially during the nonsteady state of disasters.
Policymakers seek evidence regarding the impact of specific preparedness and response interventions when developing plans to improve fuel availability following disaster. In response, we assess the benefits of various operational improvement interventions, as opposed to infrastructure resilience that is common is existing literature. We identify the best interventions for each type of bulk storage terminal structure. We also prioritize bulk storage terminals for each type of intervention when resources are limited. To further demonstrate practical impact, we present a case study drawn from application of our methodology to support US federal disaster preparedness. As the downstream fuel distribution system from bulk storage terminals to retail gas stations is similar across regions, our methodology and insights are generalizable to improve fuel management during disasters not only within the US but also internationally in countries with comparable distribution systems. In addition, we discuss resource requirements and implementation details for each intervention.
We note a few limitations in our research. First, we do not explicitly consider financial costs of interventions in our analysis. Obtaining proprietary data from the private sector or empirical data to precisely estimate financial and political costs for the public sector has not been possible. To avoid providing potentially inaccurate and misleading analyses, we do not assign explicit values to these costs. However, we hope that our extensive exploration and quantification of the benefits of interventions, in terms of increase in OFC, is the foundation to encourage cost-benefit analysis. Second, inability to obtain data also leads us to make approximations based on conversations with industry practitioners for baseline values and distributions of system parameters. Third, we assume all retail gas stations to be equal as we first focus on measuring the upper limit of the OFC. Lastly, we conduct scenario planning in our case study but do not consider the probability of the scenarios.
This study suggests further research opportunities. Since the private sector owns and operates most fuel infrastructure, intervention requires engagement between private and public sector to build trust and a basic understanding of each other’s context. Public-private partnership to facilitate data sharing, parameter validation, articulation of intervention costs (financial and political), and mutual cost-benefit analysis would strengthen evidence to justify early action. An important extension is to leverage realistic nonsteady state OFC in further optimizing interventions across bulk storage terminals based on disaster conditions and demand surge probability. Routing decisions for tanker trucks based on disaster scenario and consequent retail gas station demand should be considered as well. Finally, application of the modeling approach to food, water, and other essential goods would not only improve humanitarian outcomes but also further scientific understanding of distribution systems during disasters.
Supplemental Material
sj-pdf-1-pao-10.1177_10591478241231876 - Supplemental material for Modeling Operational Flow Capacity and Evaluating Disaster Interventions for Fuel Distribution
Supplemental material, sj-pdf-1-pao-10.1177_10591478241231876 for Modeling Operational Flow Capacity and Evaluating Disaster Interventions for Fuel Distribution by Shraddha Rana, Timothy Russell, Justin J Boutilier and Jarrod Goentzel in Production and Operations Management
Footnotes
Acknowledgment
The authors would like to thank Connor Makowski at the MIT Computational Analytics, Visualization & Education (CAVE) Lab for his efforts in developing the discrete event simulation tool used in our analysis, and Lauren Finegan at the MIT Humanitarian Supply Chain Lab for her work in compiling the list of interventions discussed in this paper.
Declaration of Conflicting Interests
The authors declared no potential conflicts of interest with respect to the research, authorship, and/or publication of this article.
Funding
The authors received the following financial support for the research, authorship and/or publication of this article: This work was supported by the US Department of Homeland Security, Federal Emergency Management Agency [grant number 70FB8018D0000037].
How to cite this article
Rana S, Russell T, Boutilier JJ and Goentzel J (2024) Modeling OFC and Evaluating Disaster Interventions for Fuel Distribution. Production and Operations Management 33(3): 682–700.
References
Supplementary Material
Please find the following supplemental material available below.
For Open Access articles published under a Creative Commons License, all supplemental material carries the same license as the article it is associated with.
For non-Open Access articles published, all supplemental material carries a non-exclusive license, and permission requests for re-use of supplemental material or any part of supplemental material shall be sent directly to the copyright owner as specified in the copyright notice associated with the article.