
Abstract
This study aims to extend the existing climate-change-induced flood mitigation research. We introduce an at-risk network to evaluate optimal cost–benefit strategies for creating dikes and levees to mitigate flood hazard over multiple years. Our proposed model includes the expected flood costs, estimated using possible climate-change-induced sea-level states throughout the planning horizon, and the investment costs for developing dikes and levees via land elevations across the at-risk network. Further, given the limitations on infrastructure investment, our model incorporates a budget constraint. The problem is modeled as a multistage stochastic program with recourse that minimizes overall expected costs over the planning horizon. Exploiting open-source and freely accessible data sets, the flood risk mitigation model elaborated here can be applied to most urban coastal situations due to its general nature. Using Boston as a case study, our proposed method resulted in a cost reduction of as much as 92.2%, with an average of 63.2%, compared to a “do nothing” strategy in a simulation-based experiment. Under a high sea-level rise scenario, the average cost savings observed by implementing the solution suggested by our model could be even 15% higher. This proposed approach offers decision-makers a tool to frequently assess the costs and risks faced by their cities enabling them to effectively mitigate the potential flooding risks.
Keywords
Introduction
Flooding accounts for nearly half of all natural disasters globally (Sodhi and Tang, 2014). Economic losses from floods between 2009 and 2018 are estimated to exceed $356 trillion, according to The International Disaster Database (EM-DAT, 2020). This positions flooding as one of the most catastrophic forms of natural disasters, on par with earthquakes. Making matters worse, projections show a worsening flood hazard trend caused by climate change effects. For instance, by 2050, Boston is projected to experience an annual occurrence of what is currently a one in 10-year winter storm flood, across all emissions scenarios (Douglas and Kirshen, 2022). Furthermore, others report that by 2100, the equivalent of today’s one in 100-year flood event will probably become an annual disaster in Boston (Baranes et al., 2020; Thompson et al., 2019).
Higher groundwater elevations significantly affect flooding conditions, especially in coastal areas as sea-level rises (SLRs) (Douglas and Kirshen, 2022). There are many low-lying islands and coastal regions around the world, housing millions of people, that face increased flooding and potential inundation year-round due to rising sea levels (Martyr-Koller et al., 2021; Nicholls et al., 2007). Thus, it is unsurprising that the total estimated value of potential flooding damages from SLR is in the trillions of dollars (Abadie, 2018). The recurring theme for SLR-related coastal flooding is the lack of existing infrastructure to protect coastal areas that can significantly mitigate the hazard (Chakravarty, 2018). Considering the efficacy of storm barricades in mitigating coastal flooding risks, our goal is to create a decision support system for optimizing investments in constructing a flood protection system in the form of dikes and levees.
This study is motivated by a pressing concern for Boston, a coastal city facing the potential risk of increased flooding due to its rapid SLR. In the last two decades, the city has undergone an average SLR rate of 5.4 mm/year, significantly outpacing the global average and twice the rate of Boston’s SLR during the previous century (Douglas and Kirshen, 2022). Projections for SLR in Boston Harbor vary based on potential future emissions. As highlighted by multiple sources, when compared to the year 2000’s baseline, SLR by 2100 ranges from 35 to 78 cm in the most optimistic scenario, while it could surpass 2 m in the worst-case scenario (Oppenheimer et al., 2019; Douglas and Kirshen, 2022). This SLR underscores a substantial risk of flooding in coastal areas (Sweet et al., 2017). Even without anticipated SLR, Boston has more than 3,000 properties facing substantial damage from flooding, so it can expect flood costs over $35M each year (Abel, 2021).
The city’s management focuses on eleven strategic initiatives to address the expanded effects of climate change (Boston, 2016). Among these are five flood-related strategies: monitoring up-to-date climate change projections, creating a coastal flood protection system, updating zoning and building regulations, retrofitting existing buildings, and insuring buildings against flood damage. Striving to keep momentum, as part of the recommended actions in Boston (2016), this coastal protection strategy called for the city to launch a harbor-wide feasibility study within 2 years. The subsequent 2018 Boston Harbor barrier feasibility report recommended forgoing a barrier system while implementing incremental steps and continued monitoring to see how the SLR situation unfolds (Kirshen et al., 2018). The findings recommend using other multilayer adaptation strategies (i.e., protection, accommodation, and retreat), at least for the next few decades, while monitoring actual SLR to better understand the uncertainty of the city’s risks.
It is a positive sign that cities like Boston are working to overcome this inertia of inaction, but the latest Boston report still takes a wait-and-see approach (see Kirshen et al. (2018)). Unfortunately, cities face challenges requiring unprecedented foresight, complex coordination, and heightened urgency. While facing these challenges, multiple stakeholders are clamoring for attention, such as state and federal agencies, developers, landowners, and nonprofit organizations (Wissman-Weber and Levy, 2021). In light of these challenges, there are opportunities to improve acknowledging the risks of SLR-related flooding and develop methods that evaluate differential benefits and costs of public and policymaker (in)action (Mechler et al., 2014; Wissman-Weber and Levy, 2021). In the face of rising seas, policymakers need new decision support tools to better assess potential flood risks and investment costs that their communities face.
This article proposes a cost–benefit analysis model to optimize investment decisions over time for alleviating flood hazards. To conduct a more granular analysis, we focus on flooding caused by SLR and hurricane storm surges along the sea coast. Our research centers on development of a flood protection infrastructure in the form of dikes and levees through modifications to coastal land elevations. We propose a generalized modeling approach to minimize a cost function composed of two components: (1) the estimated cost of constructing an infrastructure of dikes and levees, and (2) the potential SLR-related flood cost. We formulate a multistage stochastic program with recourse to determine the least cost option, considering both permanent and temporary flood damages and flood protection investment costs. This integrated approach offers valuable managerial insights into associated costs for coastal areas, highlighting the advantages of proactive decision-making in preventing damages compared to the alternative of waiting for damages to transpire and subsequently managing the aftermath. We also present a network-based framework for modeling complex flood movement dynamics on land to identify at-risk regions. Our model is more generalized than existing cost–benefit analyses, which are limited to starting from a preexisting infrastructure and enhancing that infrastructure over time. Developing a cost–benefit analysis that simultaneously assesses flood damage costs and flood protection construction expenses while integrating evolving SLR projections empowers policymakers to adhere to the periodic monitoring advised by experts. Another objective of this study is to showcase the feasibility of conducting this complex cost analysis solely with open-source data (USGSA, 2009), thereby expanding the applicability of our approach. To this end and to demonstrate the performance of our proposed model, we discuss a case study of Boston. We consider a grid network representing Boston using open-source land elevation, tax appraisals, tidal gauge data, and published SLR elevations for possible climate change scenarios. We also use Google street view visualization to fill in gaps in the open-source tax data.
Using a simulation-based approach in our Boston case study, we demonstrate that, in comparison to a “do nothing strategy” (DNS), our proposed method results in a cost reduction of up to 92.2% (on $338.4M in damages for DNS), with average cost reductions of 63.2% (on $182.7M in average damages for DNS). Moreover, our model demonstrates similar cost savings in four different scenario-based experiments compared to a DNS. Besides the Boston case study, we replicated the experiments with 50 random networks, demonstrating the generalizability of the methodology and insights beyond the Boston case. Finally, across all experiments, we present an extensive parameter sensitivity analysis, allowing decision-makers to compare the outcomes by incorporating the latest financial data or economic values.
We identify a few key takeaways from a policymaker’s perspective. The first is that a modest investment at a fraction of the cost of expected damages under the “do nothing” strategy results in a meaningful reduction in flood-related and overall costs. SLR is a real threat, so inaction and relying on chance will inevitably position a coastal area for considerably greater expenses throughout the assessed time horizon. Even under a scenario with no SLR featuring only expected annual storm flooding, the model suggests making investments when the build costs of levees are in the low to moderate range. Our model is also a powerful tool that can provide meaningful estimations for the optimal investment amounts required per period, thereby enabling city planners to formulate more informed budgeting decisions in their disaster prevention planning. From our sensitivity analysis, we could identify critical factors (namely, the costs to build the levees, the minimum build height, and the discount rate) that significantly impact the investment amounts and their timing. Planners must carefully consider these parameters to avoid underestimating costs or overestimating risks. Underestimating costs may lead to overspending on infrastructure, costing more than the damages it mitigates. On the other hand, overbuilding for potential SLR could restrict the total protected area due to budget depletion. Finally, our experiments show that there will be areas that are not cost-effective to protect. No matter how much budget is available, the investment costs to protect these areas exceed the potential flood damage mitigation. This allows policymakers to assess areas under their control for a potential retreat rather than trying to protect them at any cost.
Literature Review
The disaster operations management literature has grown substantially in the recent past (Galindo and Batta, 2013b; Besiou and Van Wassenhove, 2020). Nevertheless, much of this attention skews towards crisis response and logistics with little regarding mitigation policies (Akter and Wamba, 2019; Galindo and Batta, 2013b; Gupta et al., 2016; Besiou and Van Wassenhove, 2020). The emphasis on response operations is justified for several reasons, including the substantial deprivation costs during these operations (Eftekhar et al., 2022), media attention, and donors’ sensitivity (Eftekhar et al., 2017). 1 Consequently, most humanitarian assistance donations come with restrictions prioritizing short-term relief operations, thereby limiting opportunities for long-term investment in mitigating potential disasters (Oloruntoba and Gray, 2006), resulting in under-financed mitigation strategies.
Looking at the special issues of 2014 Production and Operations Management, 2016 Journal of Operations Management, and 2018 European Journal of Operational Research, Besiou and Van Wassenhove (2020) found only one paper related to mitigation. Likewise, in their seminal review of papers published between 1957 and 2014 on disaster management, Gupta et al. (2016) identified 50 of 268 (18.7%) papers as being in the administrative function of prevention/mitigation, collectively referring to activities aimed at reducing the severity of a disaster’s impact or ensuring that a man-made/natural event does not result in disaster. Of these, the majority concentrate on terrorism prevention policies following 9/11, with papers such as allocation of resources for airport screening (Bagchi and Paul, 2014), response planning to bioterror attacks in airport terminals (Berman et al., 2012), and strategic terrorism deterrence in two-country frameworks (Roy and Paul, 2013). Within these papers, there is a preponderance of papers not focused on specific disaster types (i.e., they treat disasters as a general problem). These studies tend to evaluate overarching methods or frameworks to apply generally to disasters, with some examples including evaluating disaster severity assessments (Rodríguez et al., 2011), representing perceived tradeoffs between disaster impact and time to recovery to define disaster resilience (Zobel, 2011), and developing a general methodology for inductive rule-building for NGOs involved in responding to natural disasters (Rodríguez et al., 2012). Consequently, Gupta et al. (2016) emphasizes the need for more research in prevention/mitigation.
In digging deeper into the papers labeled as prevention/mitigation, there appear to be scant references centered on planning to mitigate some disaster types, such as flooding, epidemics, and wildfires. In the case of disaster-related research, this includes modeling with specific disaster characteristics to help practitioners develop adequate frameworks for the prevention and mitigation of disasters (Kovacs and Moshtari, 2019). For example, although hurricane disaster management has received significant attention (e.g., Uichanco (2022), Galindo and Batta (2013a), Campbell and Jones (2011), Lodree and Taskin (2008) and Davis et al. (2013)), almost all of these studies focus on the response phases of crisis management. Gupta et al. (2016) found only seven papers related to floods, with only two focusing on prevention/mitigation. Of the two papers with some focus on prevention/mitigation, one was modeling disruption to freight transportation networks (Miller-Hooks et al., 2012) and the other was covering optimal deployment for search and rescue operations during disasters (Chen and Miller-Hooks, 2012).
Constructing a storm barricade system of levees and dikes is an effective technique for mitigating the risk of coastal flooding. Jonkman et al. (2009) employed an economic optimization approach for a risk-based design of levee systems for the New Orleans metropolitan area. Lund et al. (2010) presented an economic decision analysis approach for levee upgrade and repair investments in 34 major islands in California’s Sacramento-San Joaquin Delta. Keegan et al. (2011) discussed issues related to the construction and maintenance of locally operated levees, and provide an overview of federal programs addressing them. Eijgenraam et al. (2017) discussed improving the dike infrastructure in the Netherlands to protect more than 55% of the land area below sea level. Perhaps the closest to the current paper is Chakravarty (2018), which proposes an optimization model integrating multiple decisions pre and postdisaster to determine how investment in constructing levees can be leveraged in procuring relief items during preparation and response phases. Chakravarty (2018) considers a setting where a governmental agency makes a levee capacity decision at the beginning of a multiyear planning horizon, while humanitarian relief agencies make procurement decisions every year. With this integrated model, Chakravarty (2018) analytically shows how increasing the levee capacity creates more social surplus over time. Nevertheless, depending on the severity of storms, the levees can be damaged or destroyed. An example is the 2005 Hurricane Katrina, which shattered the protective barriers and caused the disaster in New Orleans. Sills et al. (2008) investigated the Southeast Louisiana Flood and Hurricane Protection System that was in place at the time of Hurricane Katrina to further highlight the deficiency of knowledge in the technology and expertize needed to develop levee systems. Given the importance of a levee system reliability, revamping these systems is a common practice (Chakravarty, 2018), highlighting the need for continuous investment in flood hazard mitigation from city management. The Climate Ready Boston website (Boston, 2023) includes conceptual plans for protecting the entire coastline of Boston with nature-based approaches. Boston aims to implement adaptation plans in the areas most prone to flooding in the present and near term while addressing major obstacles like environmental permitting and financing. Revising the environmental permitting process could enable building protection strategies potentially extending into the coastal waters near the land. Finally, the work proposed herein is done with a preference for landowner cooperation over eminent domain.
Upon evaluating the literature, there is a surprisingly small number of disaster-related papers focused on what many consider to be a slow-motion disaster in the making, coastal flooding caused by rising sea levels (IPCC, 2014), and there is scant coverage for addressing the SLR in areas where infrastructure is nonexistent today. In light of these limitations, our research aims to contribute to the literature by building a model that supports an adaptive strategic approach to mitigate potential disasters caused by coastal city flooding. This article highlights the need for local and national government investment in infrastructure to lessen the impending risk of climate-change-induced flooding. To our knowledge, this is the first study that uses network-based modeling and linear algebra logic to represent complex water movement dynamics on land for detecting regions at risk of flooding. Moreover, our model is more general than the existing methods because it incorporates both permanent and temporary flood damages along with investment costs, can be used in regions without any preexisting infrastructure, and can be built by using only open-source data. Lastly, another important contribution of this work is the model’s ability to identify areas that are not cost-effective to protect. This capability is particularly relevant in cities like New Orleans, where many parts of the city have elevations below sea level. City planners should be aware of the fact that not actively protecting certain areas from floods may necessitate revising construction codes.
Model, Complexity, and Solution
We model the flood risk mitigation (FRM) problem as a multistage stochastic program with recourse. To present the model, we will define some sets, parameters and variables in this section. A list summarizing all these defined sets, parameters and variables is presented in the electronic companion Section EC.5 of the Supplemental Material. The proposed model incorporates the risk of flooding over time, with
Input Parameters and Assumptions
Sea Level States and their Probabilities
Given that we are only focusing on flooding caused by SLR and hurricane storm surge along the sea coast, we model the state of the sea level during a period (denoted by
Given
Grid-Based Partitioning
To model the SLR and hurricane storm flooding system as a network, we use a grid partitioning that segments a coastal region into hexagonal grids. More precisely, let us denote the coastal area in which we have control to create dikes and levees by elevating the land and we are also responsible for the cost of land elevation and flooding as the “region of interest.”
We only concern ourselves with areas within the region of interest that might get flooded during the planning horizon. Some parts of the region of interest might be adjacent to the sea at the start of the planning horizon (referred to as “time zero”) and might get flooded directly from the sea. Depending on the land formations, other areas of the region of interest that are not adjacent to the sea may also get flooded due to water passing through the surrounding region during future time periods. To account for this possibility, we must also consider the portions of the region surrounding the region of interest that might experience flooding in the future. Figure 1(a) illustrates the sea, the region of interest, and its surrounding region at the beginning of the planning horizon in a simple example.
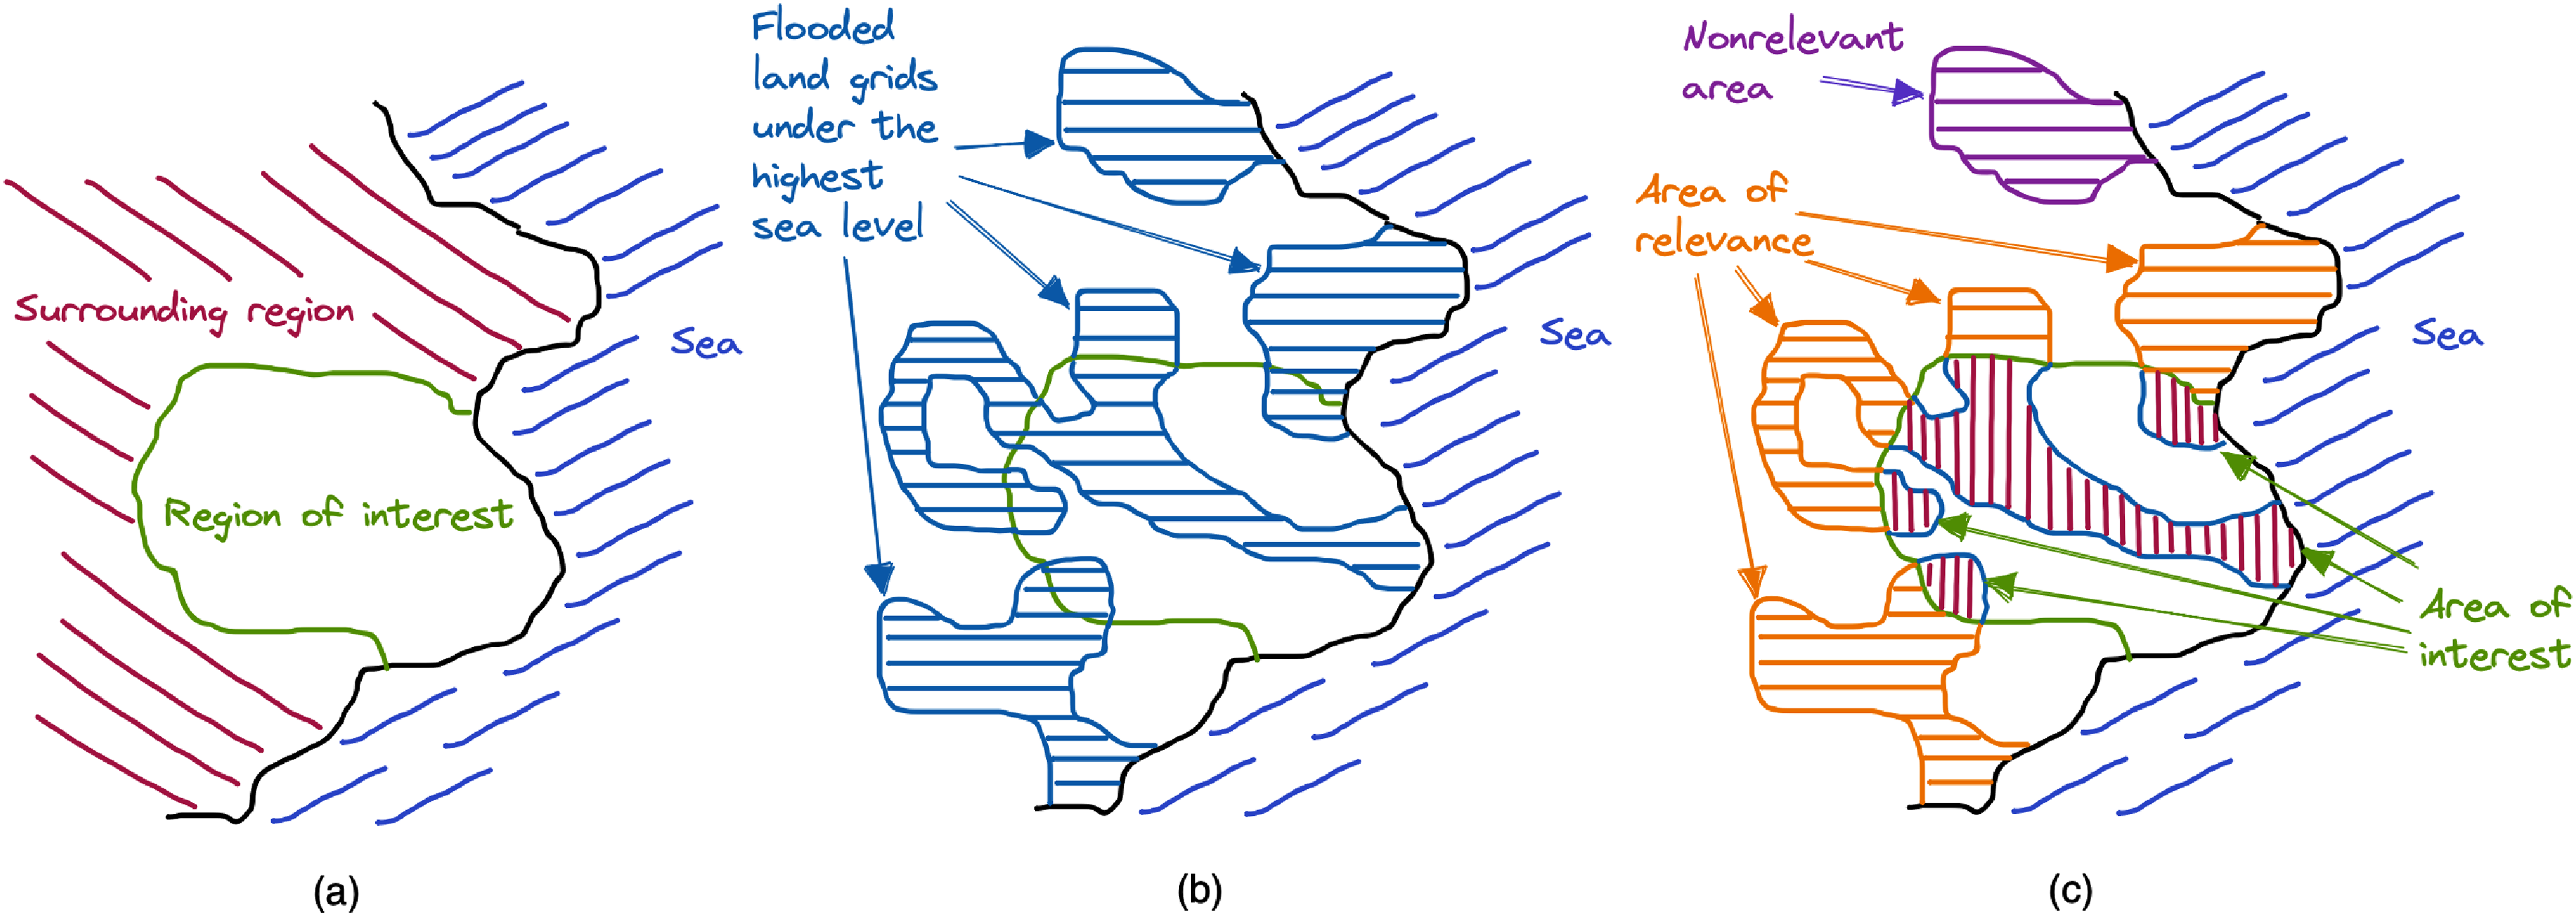
(a) An illustration of the sea, region of interest and its surrounding region at the beginning of the planning horizon. (b) An illustration of the flooded land grids under the highest sea level across all sea level states (i.e.,
To identify parts of the region of interest and the surrounding region that are at risk of flooding during the planning horizon, we first partition the land in these two regions into hexagonal grids. We assume that the elevation of the land on the surface of a grid is uniform and constant, and is equal to the average elevation of all points across the surface of that grid.
We then consider the highest sea level across all sea level states (i.e.,
Land grids
To focus our modeling approach on the land grids subject to flooding during a given period
Let
Let
Figure EC.1 of the Supplemental Material in electronic companion Section EC.1 of the Supplemental Material provides an example of how we model the SLR and hurricane storm flooding system as a network. As illustrated in Figure EC.1 of the Supplemental Material, given a period
There are four inputs required to model the costs associated with the FRM problem. The first parameter is related to the investment cost to elevate grids in set
The next two inputs provide the information needed to determine flood-related damages. The first parameter is the cost
The final input to incorporate realistic costs over time is to apply a discount rate per period, denoted by
Budget
We consider a fixed construction and maintenance budget for each period
Model Development
Decision Variable
The main decision variables for the FRM model are the heights of each grid
It is important to note that elevating grids by building dikes and levees on them cannot be done in small increments across the years. In practice, if the decision maker decides to elevate a grid in
Objective Function
This model’s main objective is to minimize the total cost, with two primary components to address. The first is the expected investment cost for building dikes and levees by increasing the elevation of grids to protect themselves and possibly other grids in the network. The second is the expected flood cost when grids are affected by either permanent inundation or hurricane storm surge flooding.
The cost for investment is evaluated on a per grid basis, and the overall cost for each grid is determined by looking at a grid’s height change throughout the planning horizon. Equation (1) captures the expected investment cost (denoted by
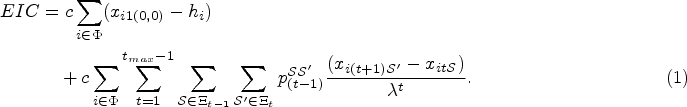
If a grid
As mentioned before, if a grid
If a grid

The full model including all related constraints can be found in electronic companion Section EC.2 of the Supplemental Material. The elevation of a grid
Given a period
With the temporary flooding during a period
Computational Complexity and Solution Approach
Having defined the FRM problem to this point in Section 3, we address its computational complexity in Theorem 1, and establish that the decision version of this problem is indeed NP-complete.
The decision version of the FRM problem is NP-complete.
We present the proof of Theorem 1 in the electronic companion Section EC.3 of the Supplemental Material by reducing the well-known Knapsack problem (Karp, 1972) to a special case of the FRM decision version. Given the intractability of the FRM problem and considering the extremely large number of variables and constraints in Formulation (EC.1)–(EC.23) of the Supplemental Material, solving this problem by classical branch-and-cut algorithms available via commercial solvers is impractical and computationally expensive. In our case study in Section 4, to solve the FRM problem within practical time limits and obtain managerial insights, we employed two different methods: a simulation-based approach and a scenario-based approach. The reader is referred to Sections 4.2 and 4.3 for the details of these proposed methods.
In this section, we employ our proposed model to develop a decision-support system for building levees to protect Boston, using only publicly available data. This research is the fifth paper of a series of articles on climate change adaptation in Boston. Douglas et al. (2012) identified major obstacles and incentives for adaptation based upon representative focus groups, Kuhl et al. (2014) examined in more details some of the challenges and implementation barriers for evacuation in an environmental-justice community, Kirshen et al. (2018) addressed how to involve vulnerable exposed populations in urban adaptation strategy planning and the use of multistakeholder collaborative processes, and Zandvoort et al. (2019) studied how pathway thinking can be used to inform landscape architects to design sustainable and adaptive landscapes.
Data and Experiment Settings
In electronic companion Section EC.1 of the Supplemental Material, Figure EC.2(a) of the Supplemental Material shows a neighborhood in Boston marked within the solid boundary line as the region of interest in our case study. This region presents a large coastal front with a relatively dense population and a variety of building structures. The surrounding region includes the neighboring towns of Winthrop and Revere, as well as Boston Logan Airport owned by MassPort and not under the control of the city (Aloisi, 2017). By following the procedure outlined in Section 3.1.2, we create the network for our model by overlaying the grids as shown in Figure EC.2(b) of the Supplemental Material, and then Figure EC.2(c) of the Supplemental Material shows the identified areas of interest and relevance in our case study. This region has a nonuniform topography with several hilly areas shown by black hexagons in Figure EC.2(c) of the Supplemental Material that overlook the city and are not at risk of flooding because of their higher elevations. In creating the grid attributes (i.e.,
Given that the model’s parameters are estimated based on available open-source data, there might be inaccuracies associated with the estimated values. Therefore, we used a range of possible values for some of the primary parameters as shown in Table 1, and conducted a sensitivity analysis in our experiments to show the behavior of the optimal objective as the values for these parameters change. We justify the range of values chosen for each one of these primary parameters as follows. In evaluating flooding of coastal mega-cities, Aerts et al. (2014) provided multiple sources and a range of discount rates (
Parameter values used to conduct sensitivity analysis.
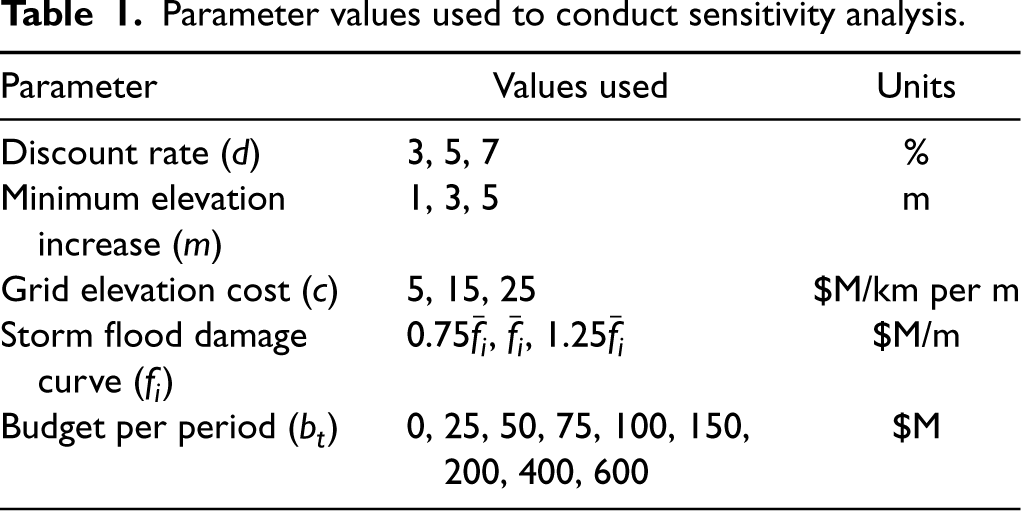
Parameter values used to conduct sensitivity analysis.
As discussed in Section 3.3, given the intractability and impracticality of solving the FRM model, we employ two different approaches, namely a simulation-based approach and a scenario-based approach to handle this challenge. In both methods, we built the related models using Python 3.8.5 and used Gurobi version 9.5.2 as the commercial solver. The experiments were conducted on Amazon Web Services EC2 c5n.4xlarge instances (AWS, 2023). Given more than 100K individual optimization runs for the case study, we set the termination condition for each optimization run as either one percent optimality gap or one hour running time limit, whichever is observed first. Most (98.5%) of the runs completed by reaching the one percent optimality gap. In the remainder of this article, we refer to the best solution found before reaching the termination condition in each optimization run as the “optimal” solution. We discuss the details of our simulation- and scenario-based methods next.
The first approach is a simulation-based approach in which we solve the FRM formulation (EC.1)–(EC.23) of the Supplemental Material for each possible combination of chosen values for the model’s parameters on simulated sea level states sample paths each composed of a collection of possible sea level states over the next five decades. In this approach, each run of the model is done on a single simulated sea level states path (i.e., we assume
To sample sea level states paths over the next five decades in our simulation, we use a collection of four greenhouse gas emission pathways (also known as representative concentration pathways or RCPs) (IPCC, 2014), nine probabilistic SLR curves per RCP (Kopp et al., 2017), and four potential hurricane storm surge levels (NOAA, 2018). The sampling is done by first randomly selecting one of the four RCPs, followed by a random selection of one of the nine possible SLR curves associated with the chosen RCP (results in components
Assuming that the distribution of all possible simulated sea level states paths is given by Table EC.4 of the Supplemental Material, we solve the FRM formulation (EC.1)–(EC.23) of the Supplemental Material for a possible combination of chosen values for the model’s parameters 144 times, each time on a distinct five-period simulated sea level states path, and compute the expected optimal objective for the chosen parameters’ combination in our simulation experiment as
Figure 2 presents three simulation results with expected optimal costs reported for two extreme parameter settings and the mid-point of these settings, as shown in the inset table in this figure. In Figure 2, charts (a) and (b), the parameters selection results in the worst-case combination (i.e., highest overall costs). The “do nothing” (zero budget) expected costs nearly reach $340M. The optimal expected investment is $88.7M with a per-period budget of at least $400M. Notice that $88.7M is an expected value and there might be a sea level states path under which the build cost could be substantially more in a given period, but due to the low probability for such sea level states path, the expected value is much lower. This is the reason that with budgets <$400M, the overall expected costs are higher. It is also important to note that even with budget values of >$400M, there are combined expected storm surge and inundation costs tallying >$70M. This is due to the fact that given the highest build costs (i.e.,
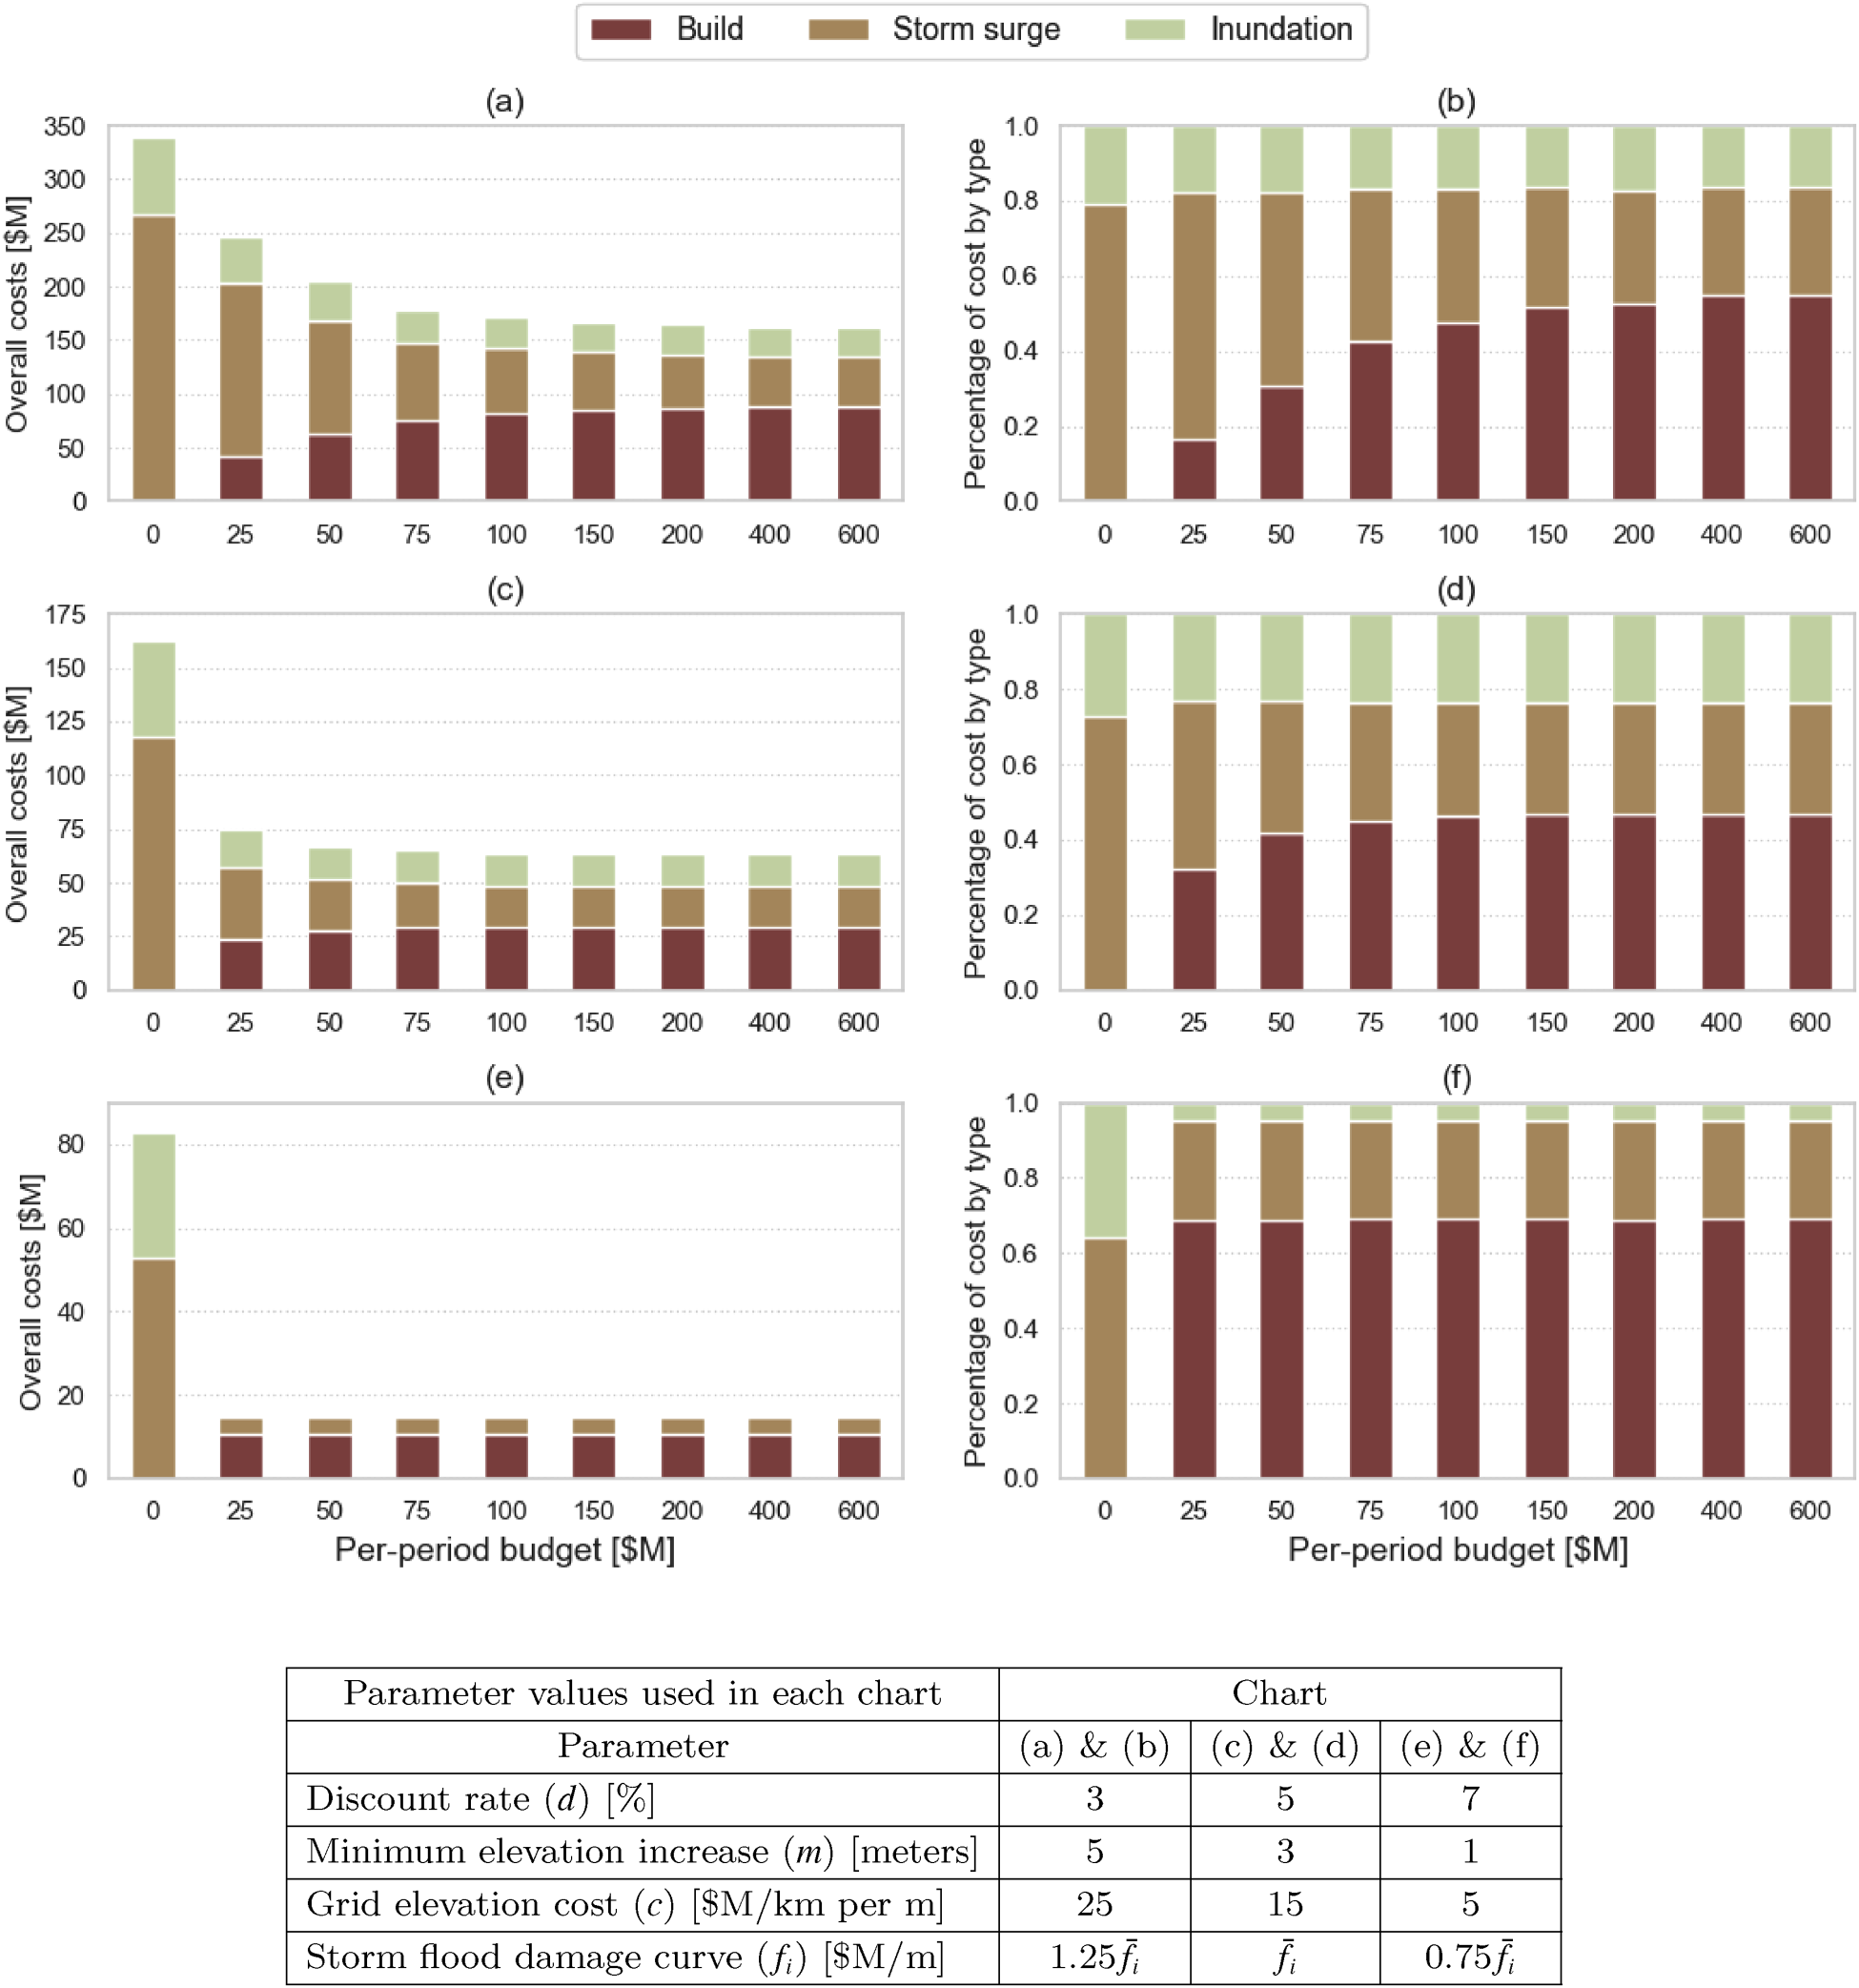
Overall expected optimal costs and their percentage breakdown by per-period budget for worst-case (charts (a) and (b)), mid-case (charts (c) and (d)), and best-case (charts (e) and (f)) parameter settings across full 144 simulated sea level states paths.
In Figure 3, we show overall expected costs across per-period budgets with combinations of minimum levee heights (
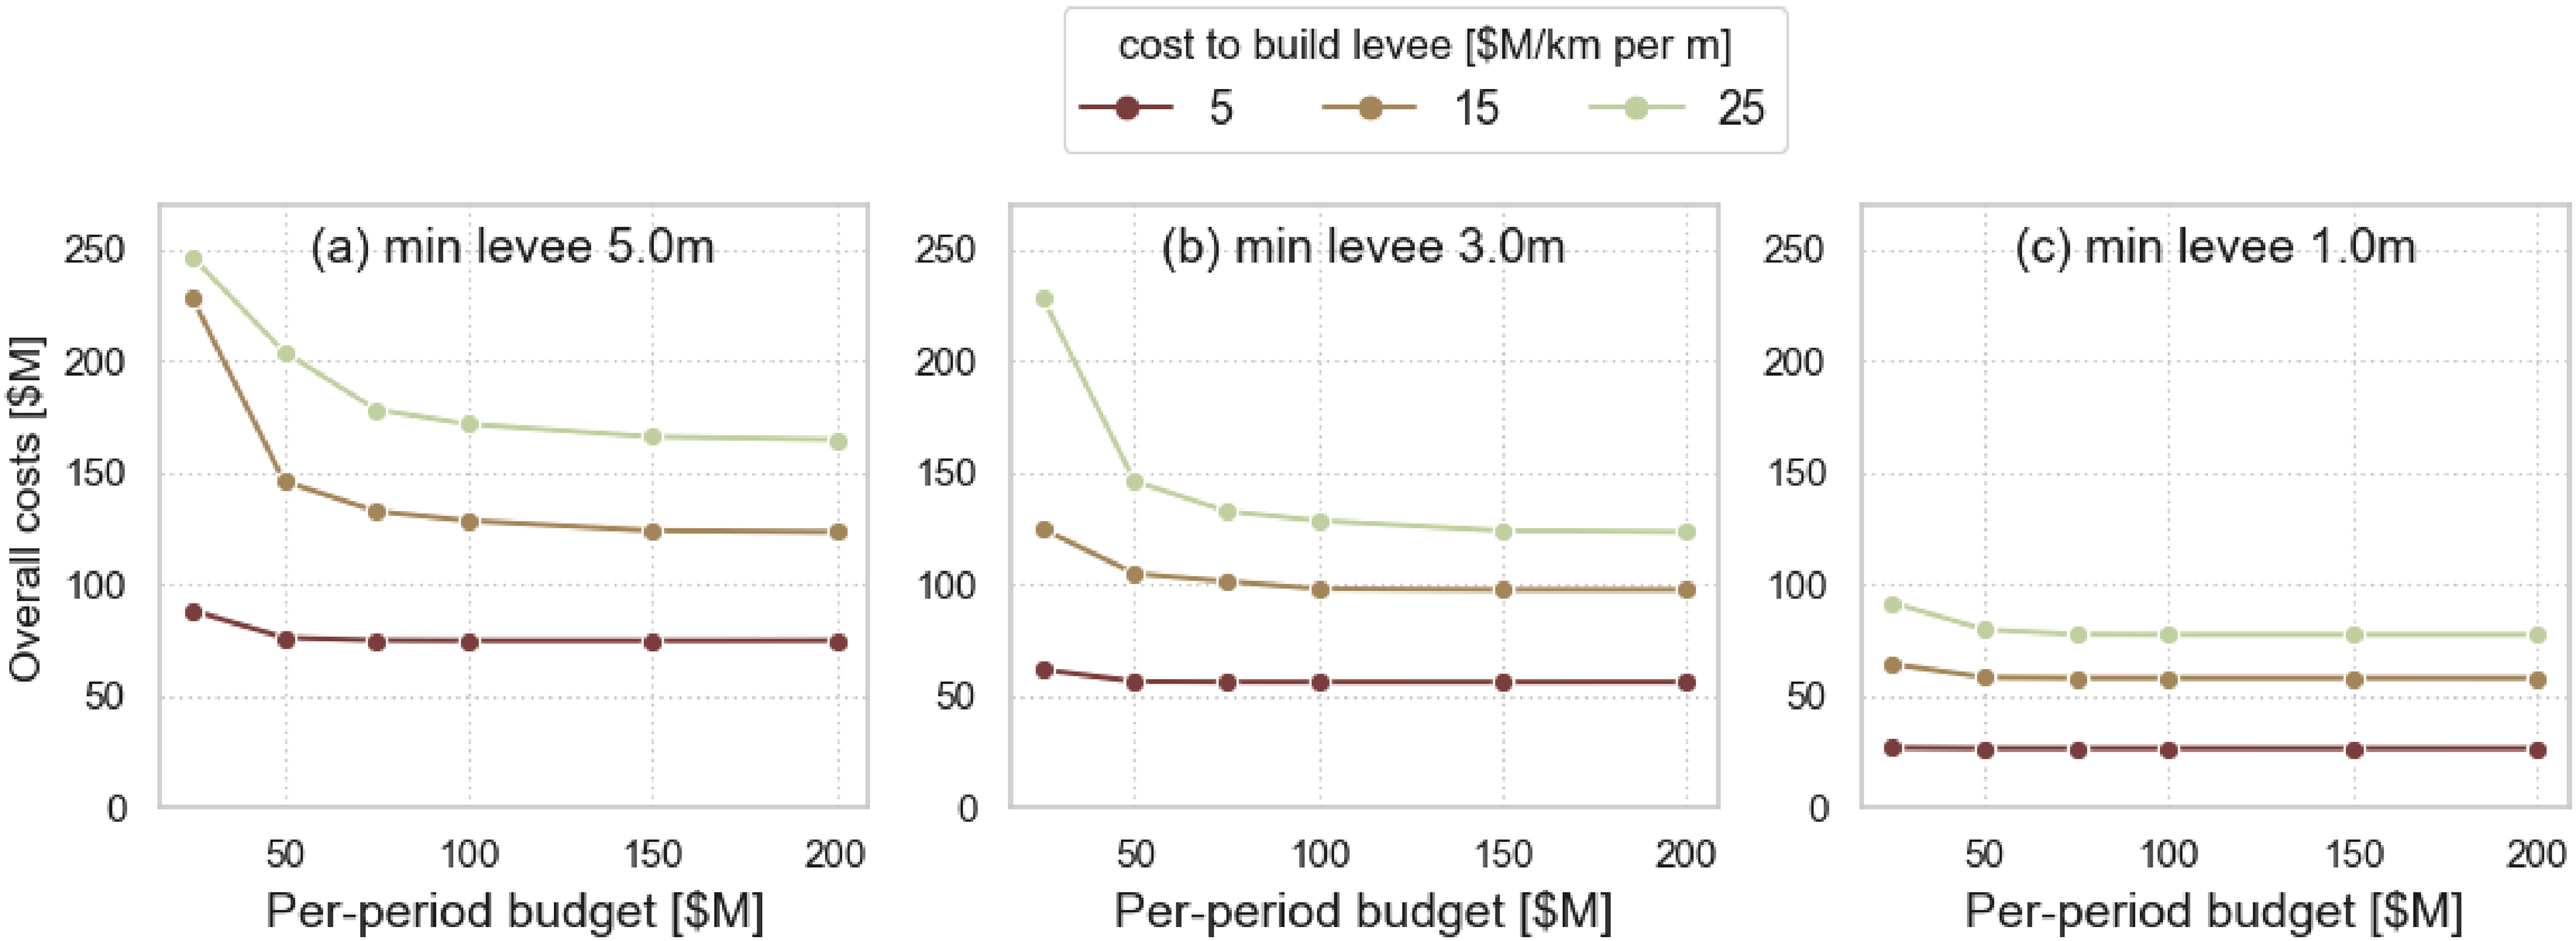
Effects of varying minimum levee heights (
In Figure 3(c), with
Figure 4 shows expected overall, build, storm surge, and inundation cost distributions for the three values of each parameter
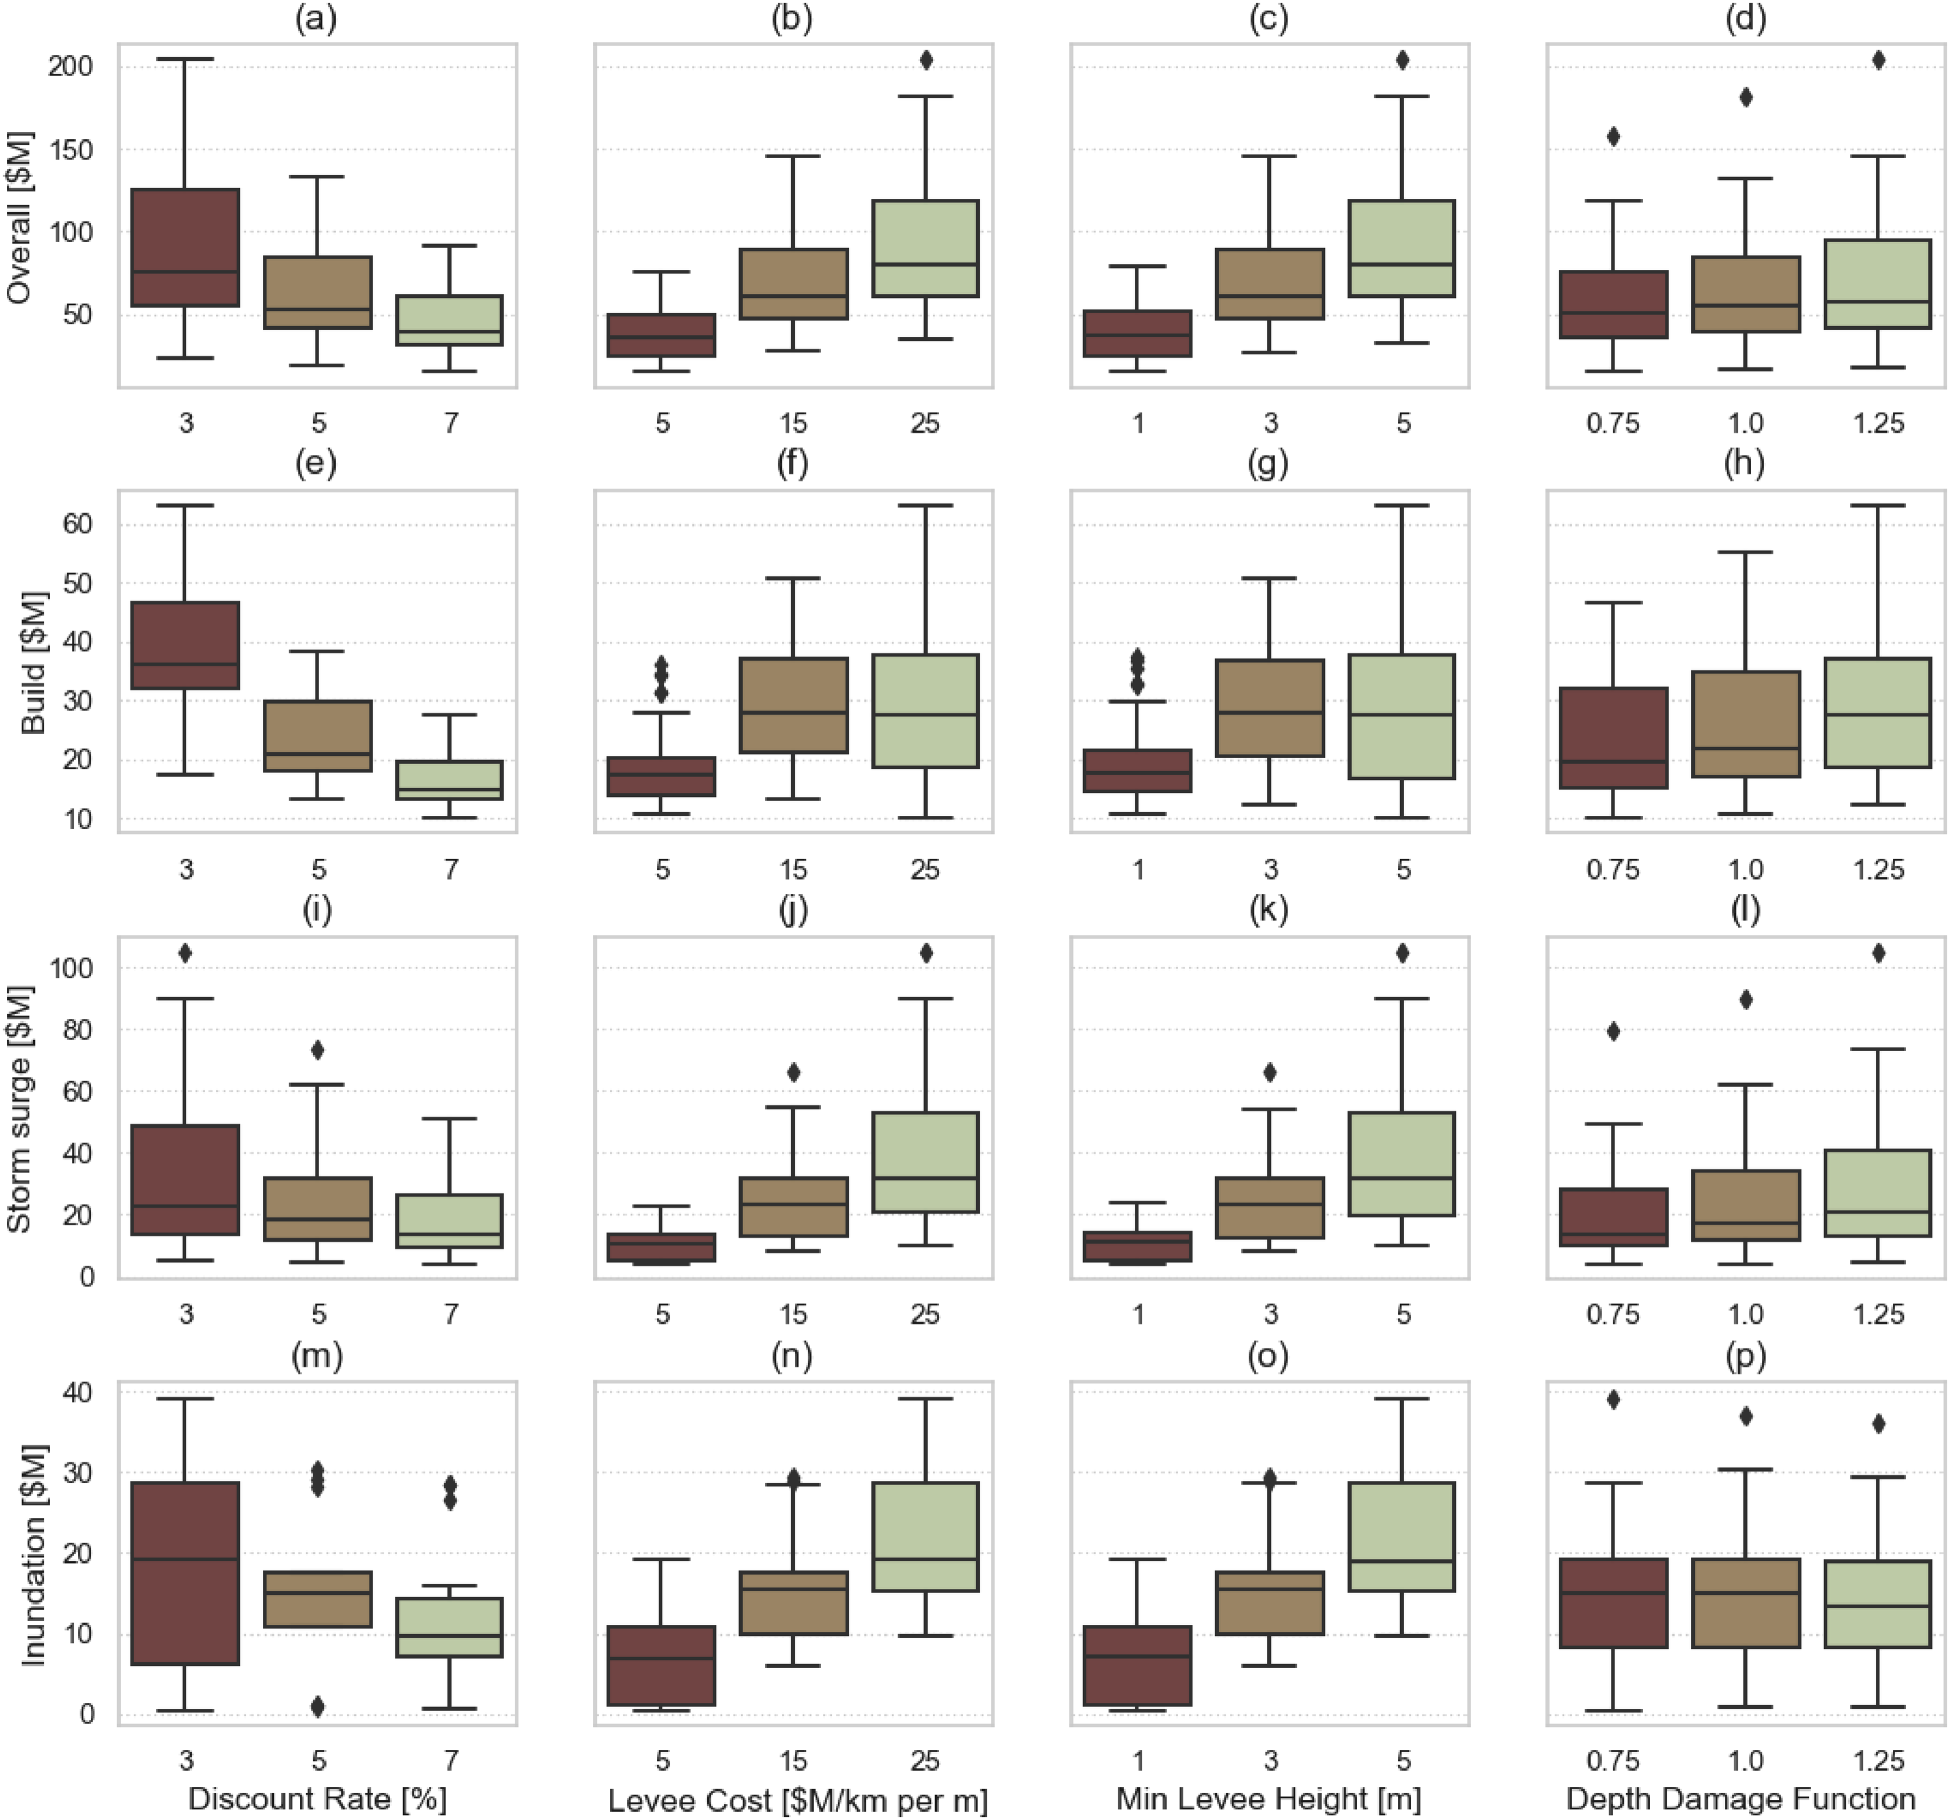
Boxplots showing effects of changing parameters on expected costs for all $50M budget runs.
When evaluating discount rate sensitivity in Figures 4(e) and (m), there are notable observations in the individual build and inundation costs. At the 3% discount rate, the build costs’ boxplot stretches upward, with its lower quartile higher than the upper quartile of the 5% boxplot. Similarly, at 3%, the inundation costs cover a wider range of values, while at 5%, the inundation cost distribution is much smaller, with a handful of outliers. The smaller discount rates cause future storm surge and flood costs to be higher in discounted terms. So, we interpret these observations to mean that the model is inclined to protect against inundation when those costs can be higher due to lower discount rates. The model invests earlier to protect those grids from future damages. However, with the higher discount rate of 5%, the model invests less because the discounted inundation costs are lower in future periods. Essentially, the lower discount rate tends to cause earlier investments due to flooding and inundation costs in future periods having a more considerable effect on costs in discounted terms.
Some key takeaways from the simulation experiment and its sensitivity analysis are:
From Figure 2, potential overall expected costs can be significantly reduced by investing only a small fraction of the “do nothing” flood-related costs independent of parameters’ values. This quantifiably proves the effectiveness of a mitigation policy in dollar values and shows the extent of the loss for following a response-type strategy. From Figure 2, some grids appear too expensive to protect through the network effect (or individually) and incur storm-surge flooding and inundation costs even when a surplus budget is available. Identifying such grids for planning purposes is not a trivial task and our proposed model can be an effective tool for this purpose. These grids form areas in which following a retreat-like policy is preferred. Building codes in these areas also need to be revised to ensure critical facilities are not on the lower levels in these areas. From Figures 2 and 3, our model can be used to find optimal budget per period values that yield the minimum expected overall costs for a given combination of input parameters. We also observed that the levee cost ( From Figure 4, the discount rate (
Given the uncertainty associated with the expected SLR used in the model, policymakers might be interested in adopting a scenario-based approach by investigating individual scenarios ranging from the best- to the worst-case SLR predictions. For example, a policymaker might want to highlight the range of values for investment and flood cost across four different scenarios, namely optimistic, expected-low, expected-high, and high SLR scenarios for the next five periods (50 years). This scenario-based approach provides policymakers with meaningful insights to make decisions based on their judgment on anticipated future sea levels. To this aim, in this section, we focus on solving the FRM formulation (EC.1)–(EC.23) of the Supplemental Material on four scenarios (i.e., optimistic, expected-low, expected-high, and high SLR scenarios) chosen from the 144 simulated sea level states paths mentioned in Section 4.2. The chosen scenarios are paths numbered 114 (high), 130 (expected-high), 85 (expected-low) and 64 (optimistic) in Table EC.4 of Section EC.4.1 of the Supplemental Material, respectively. The optimistic and high scenario values represent points near the extremes of the 144 simulated sea level states paths, while the expected-high and expected-low scenarios represent points near the middle. Similar to the case of the simulation-based method, we use the same ranges of values for the model’s parameters to conduct a sensitivity analysis for each of the four scenarios considered. Figure 5 shows the results for these four chosen scenarios using the same worst-, mid-, and best-case parameter settings as in Section 4.2.
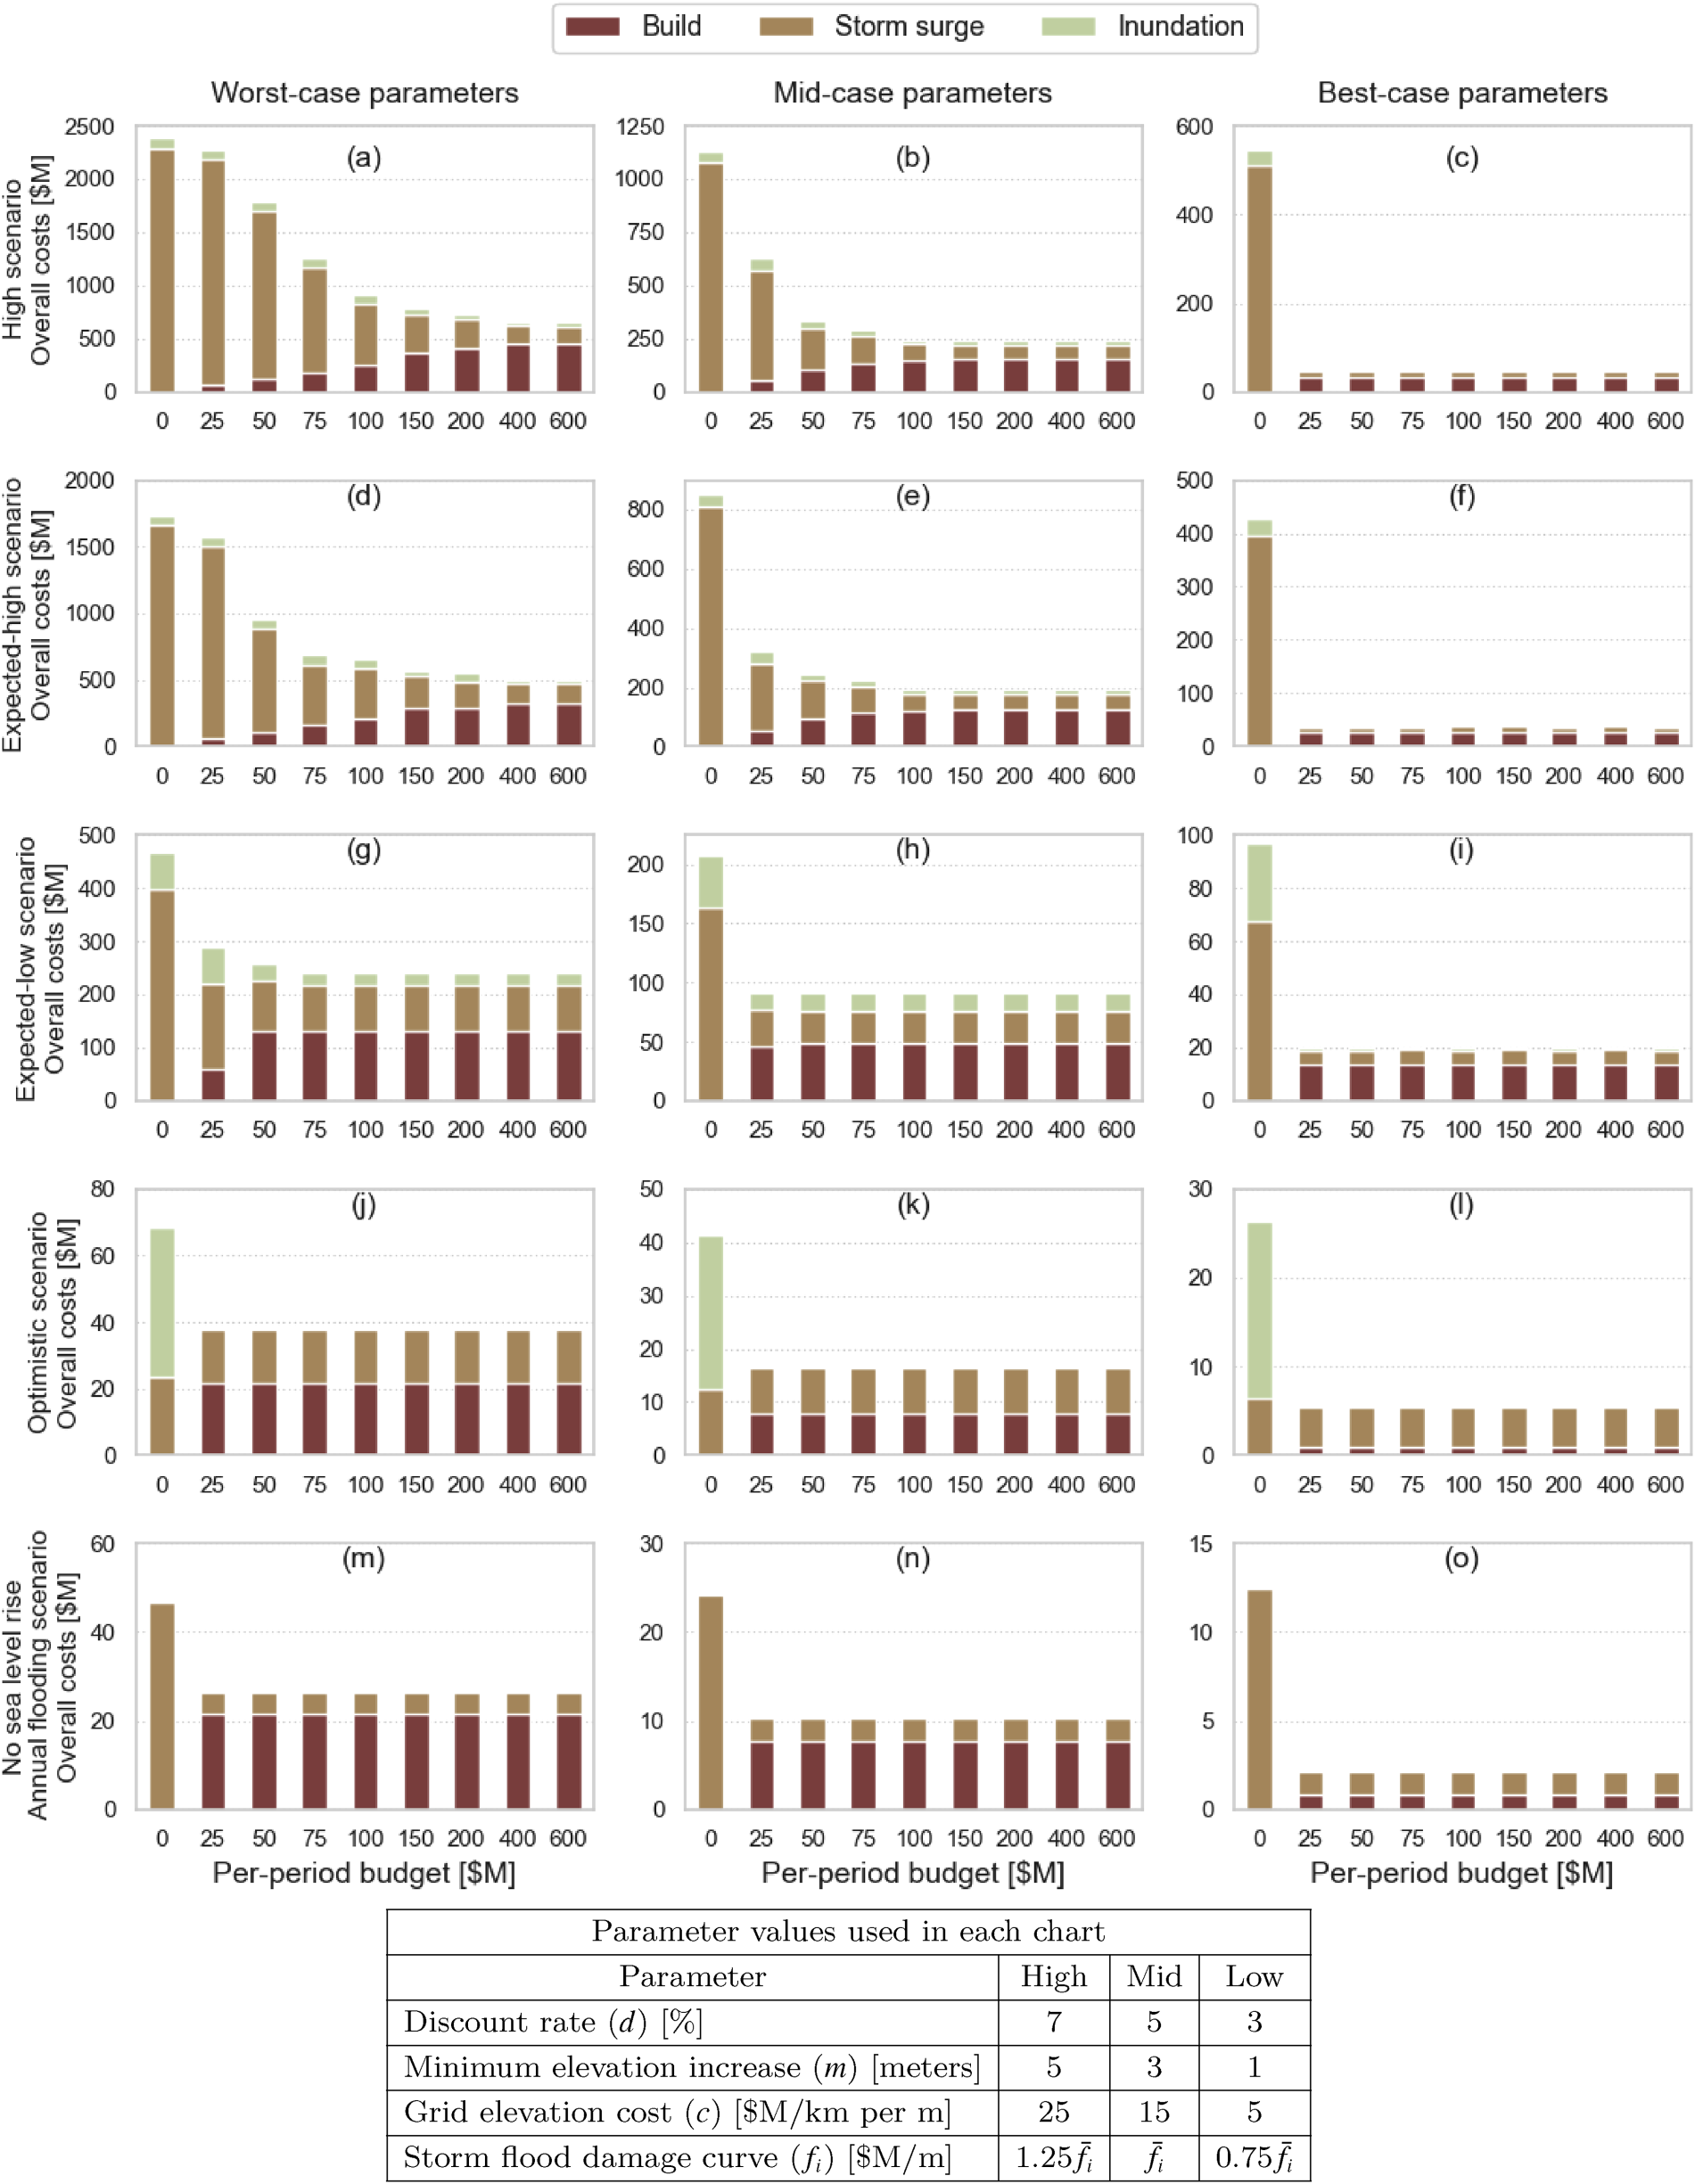
Overall optimal costs by per-period budget for worst-case, mid-case, and best-case parameter settings for no SLR with annual flooding, optimistic, expected-low, expected-high, and high sea level rise scenarios.
We see similar patterns in Figure 5 compared to Figure 2. In the best-case parameters column, all four scenarios show minimal change in total costs across all non-zero budgets. Therefore, the model mitigates the “do nothing” damages with funding available in the $25M per-period budget. For example, in the optimistic scenario (Figure 5(l)), when faced with $26.4M of “do nothing” costs, investing only 3.5% of that $26.4M results in a total overall cost reduction of 79.6%. We see similar effects across the other scenarios where an investment of a small percentage of the “do nothing” costs results in substantial overall cost reductions. Specifically, in the expected-low scenario (Figure 5(i)), investing 14.1% of $96.6M leads to a 79.2% overall reduction; in the expected-high scenario (Figure 5(f)), investing 6.2% of $426.7M results in a 91.1% overall reduction; and in the high scenario (Figure 5(c)), investing 6.1% of $545.5M leads to a 91.3% overall reduction. Contrasting that with the worst-case parameters column, we observe that the overall costs increase significantly due to (1) higher investment required due to higher and more expensive levees and (2) more costly damages due to a lower discount rate and steeper depth damage function. In the high scenario and under the worst-case parameters, the overall costs of a “do nothing” policy nearly reach $2.4B over 50 years. A substantial investment of $454.8M is only 19.1% of the “do nothing” total costs but reduces overall costs by 72.4%. Section EC.6 of the Supplemental Material shows the full breakdown of costs and percentages observed for all possible parameter combinations for each of the four SLR scenarios. In all four scenarios, investing in flood protection infrastructure at a fraction of the potential flood-related damages results in a meaningful reduction in overall costs.
While evaluating the costs under the four scenarios, we observed consistent sensitivity analysis behavior to that seen previously in Figure 4. The main difference in the scenario-based analysis is the extensive range of investment costs and flood damages. This wide range of sea level states causes substantial variation across the four scenarios, with the “do nothing” overall costs in the high scenario being 27.3 times larger than in the optimistic scenario when averaged across the different parameter settings. Investigating this range for an individual scenario and across different parameter settings also reveals interesting facts. In the optimistic scenario, when given the best-case parameters, the investment required is $0.9M to handle the addressable risk, while in the worst-case parameters, the investment required is $21.7M. This presents a reasonably manageable range for a policymaker trying to address the sensitivity of the optimal investment costs to the parameters’ estimation accuracy while protecting Boston from the optimistic flooding. Contrast that with the challenge posed under the high scenario when these numbers go to $33.0M and $454.8M, respectively. This presents an extremely risk-averse policymaker with potentially hard trade-offs, and the policymaker must ensure sufficient diligence in estimation of parameters to defend their coastal areas adequately.
In addition to the four SLR scenarios discussed above, we also include a no SLR (only hurricane storm) flooding scenario in Figure 5(m)–(o). Comparing this scenario with the other four potential SLR scenarios further emphasizes the magnitude of additional flooding costs caused by SLR, and calls for more attention to this potential threat. We see investments made in Figure 5 where the costs are balanced in the case of only-storm flooding. However, there are several combinations of parameters for which the model forgoes any investment regardless of the budget amount (see Figure EC.12 in Section EC.6 of the Supplemental Material). This happens when investment costs are high due to higher minimum levee heights and construction costs and future flood costs are low due to higher discount rates. For a policymaker believing that sea levels do not rise, given the proper cost structure and levee scope, there is still considerable financial benefit to building such protection infrastructure. Section EC.6 of the Supplemental Material shows the full breakdown of costs observed for all possible parameter combinations for no SLR (only-storm) flooding scenario.
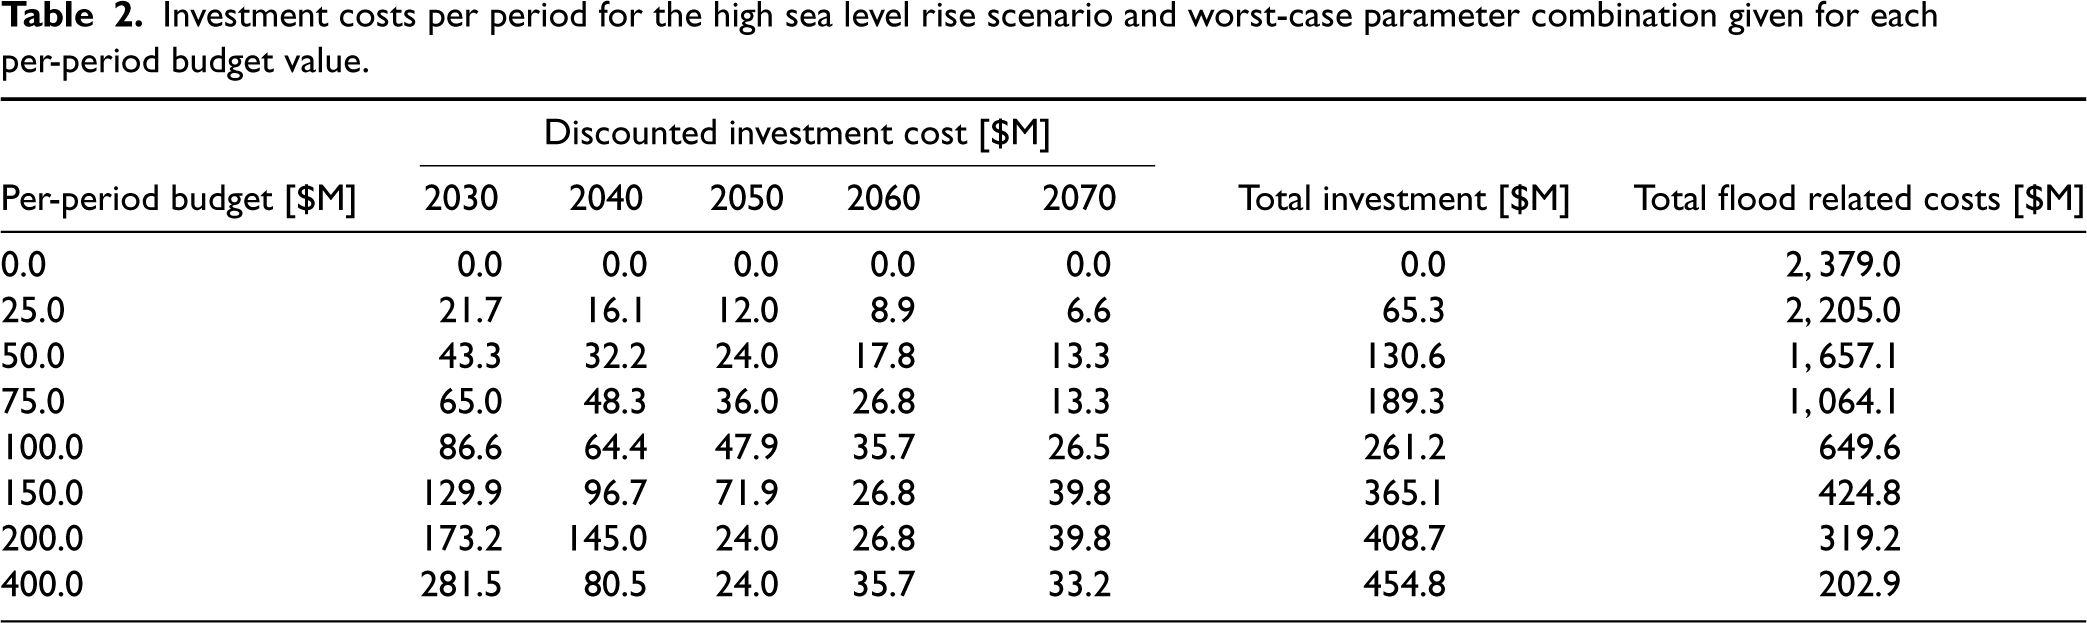
Table 2 shows the per-period spend for the scenario and parameter combination shown in Figure 5(a). In this table, we include per-period budget data only up to $400M, because both the $600M and unlimited budget runs had the same optimal solutions as the $400M case. The investment costs per decade shown in the $400M row are essentially the actual amounts required in each period to reach the optimal solution, because even with the higher per-period budgets ($600M and unlimited cases), the model will only spend up to these levels, and then spends no more. As the per-period budget decreases, however, the budget constraints start enforcing limits on per-period spend. We see that with reduced spending in 2030, the model shifts development costs into future periods to mitigate as much damage as possible. This effect results in total investment decreasing as the per-period budget decreases, while the total flood-related damages proliferate with each reduction in per-period budget. Of note, if possible, investment costs are pushed to future periods at the discounted rate. For instance, in both the $150M and $200M budgets, one can see reduced spending in 2060 compared to 2070. One key takeaway from Table 2 when looking at the $400M row is that an initial influx of cash in the first period can reduce future cash needs while significantly reducing overall total costs experienced throughout the planning horizon.
Investment costs per period for the high sea level rise scenario and worst-case parameter combination given for each per-period budget value.
In summary, the following are the key takeaways from our scenario-based experiment.
From Figure 5, similar to the simulation results, all four scenarios show opportunities to significantly reduce potential overall costs with levels of investment that are a fraction of “do nothing” flood-related costs. This again demonstrates how rewarding a mitigation approach could be compared to a wait-and-see response-type policy. From Figure 5, the wide range of potential investment and flood costs shows the importance of adequately assessing the potential risks and estimating the relevant parameters for making an investment decision. The more risk-averse the decision maker is, the more accurate their estimation of the model’s parameters need to be. From Figure 5, SLR threat is real, and can potentially increase the storm-only flood damages by several orders of magnitude. Even if policymakers do not believe sea levels are rising, there is still value to invest in protecting against annual storm flooding if the anticipated cost structures and discount rate support building a levee. From Table 2, policymakers get a view into the actual funding required per decade to mitigate flood-related damages, allocating only as much money as needed to address risks over time. This again proves the value of our model when used for budgeting and financial planning purposes.
Before concluding the case study section, we find it necessary to investigate the generalizability of the takeaways from our Boston case study to other coastal areas with different at-risk network structures. To this aim, we conducted the same simulation-based and scenario-based experiments on 50 randomly generated at-risk networks. After comparing the results from the 50 random network experiments with the Boston case study, we conclude that the key takeaways highlighted in Sections 4.2 and 4.3 are generalizable to any other coastal area. Full details of random network creation and experiment outputs are available in electronic companion Section EC.7 of the Supplemental Material.
In this study, we employ networks to model the movement of temporary (storm-related) and permanent SLR floods on land and propose a multistage stochastic program with recourse for cost–benefit analysis of creating dikes and levees in a coastal city to mitigate climate-change-induced flood damages. According to the experiments in Section 4, our model enables an improved understanding of the costs associated with protecting an urban coastal neighborhood from rising sea levels. A “do nothing” strategy of zero flood protection infrastructure investment incurs significant flooding costs. When evaluating the full range of scenarios, modest investment in the creation of dikes and levees enhances protection significantly, causing a precipitous drop in overall long-term costs. Our model is also a powerful tool for identifying areas where the development of dikes and levees is not financially justified. In this case, decision-makers should consider a retreat-like policy and revise construction codes, taking into account the possibility of flooding in lower levels of buildings in these areas.
Our model provides planners with a powerful budgeting and financial planning tool by including a constrained budget. If faced with limited funding, decision-makers can conduct what-if analysis to evaluate potential flood-related damages. We observed that the cost of levee per meter elevation and the minimum threshold for levee height are the two most important construction factors affecting the optimal budget allocations. Moreover, our model effectively identifies critical parameters that necessitate precise estimation to prevent substantial costs resulting from poor assumptions. Based on our experiments, the discount rate is one of the parameters that require very accurate estimation as it has the largest effect on overall expected costs.
We observed an extreme range for investment and flooding costs across different SLR scenarios and parameters’ values in our experiments. Going from an optimistic SLR scenario with low-cost parameters estimation to a high SLR scenario with high-cost parameters estimation, the optimal costs increase more than $650M, while the “do nothing” costs increase more than $2,350M. This further emphasizes the importance of accurate SLR forecasts and precise estimations of cost parameters. Looking more closely at each SLR scenario, the average cost savings between the model’s optimal outcomes versus the “do-nothing strategy” can be substantial. Specifically, in the optimistic scenario (best-case), we see a cost reduction of as much as 85.0% (on $58.9M in damages for DNS) and average cost reductions of 60.2% (on $44.5M in average damages for DNS). These same maximum and average cost reductions are 92.5% (on $465.9M for DNS) and 59.2% (on $237.3M for DNS) for the expected-low scenario, 96.5% (on $1,730.1M for DNS) and 78.3% (on $936.6M for DNS) in the expected-high scenario, and 96.5% (on $2,379.3M for DNS) and 78.9% (on $1,255.4M for DNS) in the high (worst-case) scenario. Another interesting conclusion is that even if decision-makers do not believe that sea levels are rising, our experiments prove that investing in the creation of dikes and levees to only protect against annual storm flooding is still financially justified.
Our model’s multistage structure and recourse feature enable prospective community leaders to adapt their measures to the unfolding SLR situation, as recommended by Kirshen et al. (2018). The model also allows quickly incorporating the latest thinking in SLR probabilities, thereby interpreting and applying potential probabilities for a broader range of SLR as found in studies by Kopp et al. (2017) and Sweet et al. (2017). The agile nature of our proposed method also enables quick solution adaptation when facing infrastructure changes in built-up areas, new risks in specific locations, and changes in flood protection design and costs.
In pursuing this research, we aimed to build a model that applies to any coastal area using readily available open-source data. Using a collection of 50 randomly generated networks, we showed that our model and the insights from our Boston case are generalizable to any other coastal area with the same data availability. For example, low-lying cities like Miami and New Orleans have publicly available elevation data (through the NOAA Data Access Viewer (NOAA, 2021)) and appraised tax data (through local municipal Open Data Hubs (USGSA, 2009)). In practice, these cities could similarly use this methodology to evaluate their city’s changing situation.
As potential directions for future studies, researchers may focus on potential impacts of hurricane storm and SLR flooding on other infrastructure such as roads and transportation networks. Moreover, future research may help mitigate the nonfinancial impacts of flooding associated with disrupted communities, lost lives, and displacement of people, particularly those from socially or economically marginalized communities. Though we do not currently capture these nonmonetary parameters, there is an opportunity to incorporate these considerations in the future development of our proposed model.
Supplemental Material
sj-pdf-1-pao-10.1177_10591478231224945 - Supplemental material for Which Is More Rewarding in Managing Sea-Level Rise and Hurricane Storm Surge Flooding: Mitigation or Response?
Supplemental material, sj-pdf-1-pao-10.1177_10591478231224945 for Which Is More Rewarding in Managing Sea-Level Rise and Hurricane Storm Surge Flooding: Mitigation or Response? by Donald John Jenkins, Foad Mahdavi Pajouh, Paul H. Kirshen and Mahyar Eftekhar in Production and Operations Management
Footnotes
Declaration of Conflicting Interests
The author(s) declared no potential conflicts of interest with respect to the research, authorship, and/or publication of this article.
Funding
The author(s) received no financial support for the research, authorship and/or publication of this article.
Notes
How to cite this article
Donald JJ, Foad MP, Paul HK, and Mahyar E (2024) Which Is More Rewarding in Managing Sea Level Rise and Hurricane Storm Surge Flooding: Mitigation or Response? Production and Operations Management 33(1): 364–382.
References
Supplementary Material
Please find the following supplemental material available below.
For Open Access articles published under a Creative Commons License, all supplemental material carries the same license as the article it is associated with.
For non-Open Access articles published, all supplemental material carries a non-exclusive license, and permission requests for re-use of supplemental material or any part of supplemental material shall be sent directly to the copyright owner as specified in the copyright notice associated with the article.