
Abstract
Using factory-level data from a large multinational manufacturer, we examine the effects of both organizational experience and knowledge transfer on an increasingly critical environmental performance measure, the consumption of water required for manufacturing. We estimate the direct effects on water consumption from in-factory cumulative production experience and the vicarious learning from peer factories in the same product category. We consider vicarious learning from three potential sources: observation of peer factories’ cumulative production experience; and benchmarking of water consumption performance with the best and worst performing peer factories. For each learning channel, we test for the moderating effects of water scarcity and geographic proximity. We find that factories learn to reduce their water consumption from their own experience but at a greater rate in water-scarce locations. Although we find that factories learn significantly from observing the cumulative production experience of peer factories, this effect does not hold in water-scarce locations or across geographic regions. We document that learning effects from observing others’ experience are quite distinct from learning effects by benchmarking others’ performance. We find vicarious learning effects from benchmarking the best-performing peer factories result in significant reductions in water consumption, and this effect is greater when the factory is in a water-scarce location, and when benchmarking other regions rather than within the same region. Finally, we find less significant vicarious learning from observing the worst-performing factories.
Keywords
Introduction
Industrial water consumption is an environmental and societal issue of increasingly critical importance but it has not been well-studied (Cole et al., 2023; McCall et al., 2021). Although historically not highly prioritized by many managers because of its availability and low cost, water is now often the source of conflicts due to the competing needs between businesses and society for this finite resource. The growing challenge of global water conflicts and scarcity is highlighted by the decision of the UN General Assembly to launch the Water Action Decade 2018–2028 to focus on sustainable development and management of water resources (UN, 2017). Goal 6.4 of the UN Sustainable Development Goal specifically advocates for increased water-use efficiency across all sectors (UN, 2022). Reducing industrial water consumption has become a societal, and increasingly corporate, priority. Despite this, the academic literature on reducing industrial water consumption is scarce, particularly from an operations management perspective. Since operations managers are responsible for the efficiency of process inputs, including water, this lack of attention in the literature is surprising.
The key to reducing industrial water consumption is improvement in efficiency, using less water per unit of production. Given that organizational learning is a key means to improving efficiency (e.g., Yeung et al., 2007), it should enable reductions in water consumption. Further, learning results primarily from either experience (i.e., learning by doing) or from observation (i.e., learning from others) (Levitt and March, 1988). Accordingly, we consider the impact of both types of learning on improving water efficiency. Experiential learning accrues from the direct experience of the organization. Observational learning (a.k.a. vicarious learning) is a result of observation of others’ experience, behavior, or performance.
In this paper, we use a panel data set from a large multinational manufacturer in the consumer packaged goods (CPG) industry to examine the relationship between organizational learning and reductions in water consumption per unit of production at the factory level. This manufacturer (hereafter referred to as large manufacturing company (LMC) to preserve their anonymity) owns and operates over 250 factories around the globe. The data set is ideal for our research purposes because all the factories share common monitoring equipment and reporting requirements, ensuring measurement equivalence across the sample. The factories also share the same corporate culture, mandates, hierarchy, and history, obviating the need to control for the effects of those potentially influential constructs.
Although all manufacturing organizations gain experience from cumulative production, and they all have opportunities to observe the experience and performance of others, not all organizations effectively learn from those experiences and observations (Argote et al., 2021). If they did, all organizations would improve their water conservation performance commensurately, and there would be no need to focus on industrial water conservation. Further, organizational learning is not automatic and requires active management to translate experiences and observations into performance improvement (e.g., Lapré and Nembhard, 2010). LMC actively pursues several industrial water conservation strategies including the deployment of an extensive water usage monitoring system at each factory, coupled with regular reporting, data sharing, and ranking across factories. We use this unique data set to consider whether LMC's actions effectively leverage the factory's experiential learning (their cumulative production experience) to improve its water efficiency. We also consider the factories’ vicarious learning by three observing the: (a) cumulative production experience of related factories; (b) water efficiency performance of the best performing (or benchmark) factories; and (c) water efficiency performance of the worst performing factories.
For each of the aforementioned learning channels, we consider the potential moderating effects of water scarcity. Recent and future growth in demand, coupled with increasing supply variability due to climate change, are combining to increase the scarcity and value of water. It is estimated that at least one-quarter of the global population is subject to water scarcity (Hofste et al., 2019). At factories in water-scarce locations, workers and managers might be more motivated to learn how to reduce water consumption. It is unclear whether such motivation effects apply equally to all learning channels. For vicarious learning, we also consider the potential moderating effects of geographic differences by examining the learning effects from related factories in the same geographic region, and from related factories in other geographic regions.
Our work contributes to the extant literature in several ways. First, it is among the few operations management studies to focus on water as a critical process input for manufacturing, despite calls for work on emerging environmental issues (Plambeck and Toktay, 2013; Van Wassenhove, 2019). An exception is Muthulingam et al. (2022) who study the impact of water scarcity on the volume of toxic releases by manufacturing firms. Rothenberg et al. (2001) consider water consumption in their study of US and Japanese automakers, finding that lean firms use less water and that water consumption is negatively correlated with its price. To our knowledge, this study is one of the few to focus on water conservation in manufacturing from the standpoint of organizational learning. In so doing, we hope to bring more research attention to water as an increasingly important measure of environmental performance.
Second, by considering whether factories concurrently learn from multiple learning channels, we gain insights into organizational learning theory on the relative merits of experiential versus vicarious learning. To the best of our knowledge, all of these learning channels have not been investigated collectively in a cohesive manner within a sustainability setting, or otherwise. By doing so, we can learn both the absolute and relative contributions of different learning channels on water efficiency improvement. We hope to provide managers and researchers with a better understanding of the important role that organizational learning plays in the conservation of this critical resource. From such awareness, managers might be able to devise more effective schemes for their firms to reduce water consumption.
Third, we add to the vicarious learning literature by examining whether the learning effects from observing other's experience is different from observing other's performance. Specifically, we compare the effects of vicarious learning from observing other's strong performance or success (i.e., learning what to do), versus learning from observing other's poor performance or failure (i.e., learning what not to do).
Fourth, we consider the important role of water scarcity as a moderator of both experiential and vicarious learning effects. As stated by Muthulingam et al. (2022, p. 2784): “… hardly any research explores whether resource scarcity affects manufacturing activity …” Our inclusion of water scarcity adds to the emerging research stream on the effects of natural resource scarcity. We study water scarcity effects by comparing whether factories in water-scarce locations learn at different rates than factories in non-water-scarce locations. Although one might expect increased learning rates in locations subject to scarcity, we find this is not always the case, highlighting the need for considering resource scarcity in learning.
Last, we examine the potential moderating role of geographic differences on vicarious learning from observing others. It is unsettled in the literature as to whether geographically proximate units learn better from each other than geographically distant units. We examine this by comparing whether factories learn from observing related factories within their geographic region, or from observing related factories in other regions. In examining the implications of geographic proximity across different types of vicarious learning, we provide additional empirical evidence for its role in organizational learning theory and give managers insights into the effectiveness of location strategies and organizational communication. We now briefly develop our hypotheses.
Literature Review and Hypothesis Development
Experiential Learning
Learning by doing is the concept that organizations can realize performance improvement from increased direct experience. In manufacturing contexts, it is common in the literature to employ cumulative production to measure organizational experience. As factories produce more of the same product, the unit cost of production generally decreases at a decreasing rate. This pattern that relates cumulative production experience with unit production cost is known as a learning curve in the case of individuals and is sometimes known as an experience curve in the case of organizations. The literature on learning curves is extensive. See Argote (2012) and Argote et al. (2021) for a brief history of this research dating back to the 1930s, and Glock et al. (2019) for a review of this literature in the context of operations management.
The mechanisms by which cumulative experience translates into improved performance are varied. As explained by Levitt and March (1988), most organizational learning from direct cumulative experience results from improvement in skills. Argote (2012) expands that to describe three main causes that lead to such improvements: (1) increases in the efficiency of individual employees; (2) advancement in organizational structures and routines; and (3) modifications in technology. These can be due to specific factors, including enhanced proficiency in labor, management, and engineering; improvements in material flows; specialization and a better division of labor; streamlined layouts; etc. (Epple et al., 1991).
Researchers have empirically studied the relationship between cumulative experience and other operational outcomes across several domains including software development productivity (Boh et al., 2007; Narayanan et al., 2009), banking (Staats and Gino, 2012), customer dissatisfaction (Lapré and Tsikriktsis, 2006), quality performance (Lapré et al. 2000), and healthcare (e.g., KC and Staats, 2012; Pisano et al. 2001). All of these studies find that organizations can acquire knowledge from direct experience and employ that knowledge to improve their operational performance. Within operations management, Glock et al. (2019) find the most common applications of learning curves are for machine scheduling. They note that studies of learning curves in sustainable operations are largely missing from the literature.
One study that applies experience curves with environmental performance as the outcome is by Chen and Chang (2010). In this paper, the authors study organizational learning within the Taiwan EPA with regard to the reduction of municipal solid waste using 11 annual data points. We build upon this work by applying experience curves to a much larger data set with an alternate measure of environmental performance, the reduction of industrial water consumption. It is important to study experiential learning within this realm for the following theoretical reasons.
Prior studies suggest that experiential learning is not automatic. Argote et al. (2021) explain that if learning curves were automatic, the performance of both poor-performing units and good-performing units would converge as they gain experience. Instead, learning rates vary widely across organizations (Lapré and Nembhard, 2010). Active management is needed to enable the organization to learn from its experience. Such actions can include: Hiring and retaining appropriate personnel; providing proper incentives; advocating employee empowerment; improving access to expert resources; conducting on-the-job and/or formal training; developing and updating standard operating procedures; acquiring better equipment; etc. Conversely, managers can also impede learning with their actions/inactions. Lapré et al. (2000) identify issues such as dynamic complexity, ambiguity, misperceptions, and poor reasoning that can disrupt learning. Accordingly, this study examines experiential learning in the context of factory water consumption to determine whether management actions are sufficient to enable such learning.
Overall, combining the link between learning and improvement in environmental performance in the literature, and the accepted role of direct cumulative experience in learning, we expect that learning curves are good descriptors of the relationship between cumulative experience and environmental performance, assuming that management actions are sufficient to enable learning. Therefore, we posit:
The Role of Water Scarcity in Experiential Learning
Recent and projected future growth in demand due to increasing population and industrialization, coupled with increasing supply variability due to climate change, are combining to increase both the value and scarcity of water. Cole et al. (2023) provide a literature review of the operational and contextual risks that water scarcity is imposing on businesses.
Of course, scarcity is not a condition unique to water or more generally, natural resources. Instead, it can occur in any input or commodity whenever resources are low relative to needs (Shah et al., 2015). Since environmental performance measures are mostly outputs (e.g., greenhouse gases, toxic emissions), they are typically not subject to scarcity. However, water is an input subject to scarcity, making it somewhat unique amongst environmental performance measures. Shah et al. (2012) note that scarcity captures the attention of those affected, creating a “scarcity mindset” where people focus on meeting their short-term needs relative to the scarcity, sometimes even at the expense of longer-term issues. When faced with scarcity, individuals tend to focus internally and discount external information (Shah et al., 2015).
Scarcity has been considered in the context of natural resources required for manufacturing (e.g., Bell et al., 2012; Kalaitzi et al., 2018) but little research has been done in the context of water scarcity in manufacturing. An exception is Muthulingam et al. (2022) who study the relationship between water scarcity and toxic emissions in Texas factories. They find that many factories undertake technical and input modifications to their manufacturing processes when faced with water scarcity. They also find that only those factories most exposed to drought conditions are likely to reduce their toxic emissions to water.
Thus, it is likely that when factories are located in water-scarce locations, the scarcity captures their attention and focuses their efforts on water conservation. Since scarcity often leads to an internal focus, it is to be expected that factories will focus more on their internal operations and cumulative experience, enhancing the learning effects of cumulative experience. Therefore, we posit:
Vicarious Learning from Others’ Experience
Beyond direct learning from production, we consider vicarious learning. It is important for experiential and vicarious learning to be examined together as Bresman (2010) finds that learning from the experience of others is only effective for those who can first learn from their own experience. Vicarious learning is akin to absorptive capacity, the ability to recognize, evaluate, assimilate, apply, and exploit external information (Cohen and Levinthal, 1990). The two underlying principles of absorptive capacity are that learning is cumulative, and learning is enhanced if the topic is related to what is already known.
In discussing vicarious learning, Argote (2012) notes that organizations not only learn from their own direct experience, but also learn from the experience of others. The mechanisms for transferring knowledge between organizational units include training, communications, information and document sharing, and personnel transfers. Similarities in people, technology, and structure enhance the effectiveness of such knowledge transfers. Those similarities are likely greater between units of the same parent organization. This aligns with the arguments of Tushman (1977) that the boundaries separating the subdivisions within a single organization are fewer than those between independent organizations, facilitating knowledge transfer. As evidence, Darr et al. (1995) find that units learn from the cumulative experience of other units owned by the same entity but not from the cumulative experience of related units owned by others.
Beyond similarities in people, technology, and structure, the salience of outcomes is an important factor for knowledge transfer. In their study of inter-organizational imitation, Haunschild and Miner (1997) argue that outcome salience will increase imitation of outcomes. Similarly, Boh et al. (2007) find that experience in related systems results in significant learning gains, whereas experience in unrelated systems has no significant effect. Schilling et al. (2003) also find that learning from related tasks is highly beneficial compared to learning from unrelated tasks. These effects are likely stronger in an organizational context. More specifically, in a manufacturing context, the most salient outcomes to factories should be those of other factories producing similar products by employing similar processes.
Transferring knowledge from one group to another is not easy or automatic and can be difficult, even within an organization. Such difficulty in transferring information is labeled as “stickiness” by Von Hippel (1994). It can be exacerbated by: The lack of absorptive capacity in the recipient of the knowledge; causal ambiguity in the success of the practice to be imitated; and a distant relationship between the sender and receiver of the knowledge (Szulanski, 1996). We expect those exacerbating factors should be minimal for similar units within the same organization. In the context of LMC, corporate management promotes cross-factory learning by hosting periodic cross-factory meetings, and encouraging cross-factory peer visits. In addition to common corporate resources, many LMC factories share common suppliers and consultants.
Overall, extant literature supports that learning from the experience of others is enhanced by the relatedness of the tasks to be learned, and shared corporate relationships. Therefore, we posit:
The Role of Water Scarcity in Vicarious Learning
As noted in Section 2.2, Bresman (2010) finds that experiential learning enables vicarious learning. Drawing from our prior argument that factories in water-scarce locations learn more from their cumulative experience than factories in non-water-scarce locations, it is also likely that these same factories can also learn more vicariously from other factories. This is consistent with the principles of absorptive capacity which posits that firms with greater absorptive capacity better leverage external knowledge (Cohen and Levinthal, 1990).
It is also likely that external vicarious learning helps teams improve their routines (Bresman, 2013). These routines are more likely to be institutionalized since factories in water-scarce locations are likely not able to change the nature of their water availability. Accordingly, when these factories learn from other counterparts, they may also deploy this knowledge better through routinization. Therefore, we hypothesize:
The Role of Geographic Proximity in Vicarious Learning
A factor potentially moderating the effectiveness of vicarious learning is the geographic proximity of other facilities. As Darr et al. (1995) note, geographically proximate units are more likely to have personal ties and more frequent meetings, relative to units that are geographically distant. Staats (2012) demonstrates that team familiarity gained by working in the same location is more impactful than that gained by team collaborating in different locations. Myles-Shaver and Flyer (2000) explain that geographically proximate firms can benefit from the positive externalities that come from the clustering of like firms. These include easier access to technology, training, human capital, and common suppliers. Cluster theorists posit that knowledge sharing is enhanced by both formal and informal mechanisms that are more commonly found amongst firms that are geographically close (Enright, 1995). Myles-Shaver and Flyer (2000) also note that in competitive situations, quicker knowledge transfer can potentially disadvantage leading firms by enabling the improvement of follower firms. Conversely, if the goal is to speed up the dissemination of knowledge, as it would be for units in a superordinate relationship, geographic proximity should aid in that effort. Edmonson et al. (2003) find that if knowledge is tacit, interpersonal interatction are necessary for knowledge transfer, and these are more common when learners are geographically proximate.
However, other researchers suggest that the role of geographic proximity might be overstated. As Malmberg (1997) explains, globalization is eroding the advantages of previously localized factors of production. Lublinski (2003) considers whether physical distance is still relevant in today's globalized world where knowledge can travel quickly and freely. In studying German aerospace firms, he finds that the advantages of proximity on knowledge transfer are weak at best. Similarly, Ganesan et al. (2005) find that inter-firm new product development activity is more a function of relational ties than shared geographic location. Darr and Kurtzberg (2000) find that the similarity of strategy is more significant to knowledge transfer than the similarity in location. However, Cramton (2001) finds that the completeness and accuracy of knowledge transfer are hampered by distance despite the availability of electronic communications.
Although the balance of the literature seems to predict a negative effect of geographic separation on knowledge transfer, the results remain unsettled. Thus, to consider whether geographic proximity significantly affects the knowledge transfer between units, we posit:
Vicarious Learning from Best Performers
Haunschild and Miner (1997) explain that a major form of interorganizational imitation is outcome-based; i.e. organizations imitate practices of other organizations that appear to have good outcomes. As Levitt and March (1988) and Huber (1991) explain, vicarious learning (learning from others) follows the framework of institutional theory (DiMaggio and Powell, 1983) with coercive, mimetic, and normative pressures to learn. For a given organizational unit, coercion to learn from others might stem from upper management expectations to adopt best practices from peer units either within or outside the corporate organization. Mimetic pressure to learn from others could result from the unit leadership's observation of other units successfully achieving goals. When leaders discover that their organization has inferior performance relative to peer organizations, they are motivated to seek out the higher-performing organizations and adopt their best practices. Mimicking the practices of more successful units is a common method to improve one's own performance. Normative pressures, which are driven by professional standards or networks, might result from industry or corporate gatherings where best practices are observed.
Availability of information regarding others’ good outcomes has been shown to improve self-performance. Netessine and Yakubovich (2012) provide three conditions for performance information to be effective for learning; it must: (1) Provide specific information on productivity levels; (2) identify top performers who in turn share their best practices; and (3) account for fluctuations over time by reporting at regular frequencies. Song et al. (2018) find that public disclosure of other workers’ performance helps to boost the productivity of individual coworkers. The mechanism they propose is that public disclosure of performance permits others to observe and identify the top-performing worker, enabling the identification, validation, and adoption of their best practices. Further, they find that productivity improvement is not instantaneous since it takes time to adapt and modify established work routines. Lount and Wilk (2014) find that performance disclosure can also result in improved group-level performance.
In the sustainable operations literature, Mani and Muthulingam (2019) argue that organizational units can improve their environmental performance by observing the success of others’ environmental inspection performance, both inter-firm and intra-firm. They define success as confirmation from inspectors that the organizational unit is complying with environmental regulations.
The literature suggests that organizations can learn from observing the performance of others, particularly from successful performance. As with learning from observing the experience of others (see discussion for H2a above), learning from observing the performance of others should be enhanced by task similarity, common corporate structures, and outcome salience, all of which are common among factory peers. To determine whether water scarcity and the proximity of geographic location between factories moderate learning from others’ superior performance, we offer the following set of hypotheses:
Vicarious Learning from Worst Performers
The learning from others’ performance that we have discussed thus far is based on imitating the best performing factory peer, or success of others; i.e. learning what to do. But the literature suggests it might be as valuable, or perhaps even more so, to learn from others’ inferior performance or failures; i.e. learning what not to do (Argote et al., 2021). Bresman (2013) refers to such as learning as “imitation by not doing.” Denrell (2003) explains that relying solely on observing others’ successes creates sampling bias toward risky practices. Risky practices tend to pay off with either success or failure. If failures are not sampled, the observer's conclusion might be that the risky practices are related only to success. Thus, Denrell (2003) advocates that observing poor outcomes or failures, in addition to success, will reduce sampling bias.
Madsen and Desai (2010) suggest that vicarious learning from observing others’ failures or poor performance might be more influential than learning from observing others’ success or superior performance. They argue that this is because many organizations have similar knowledge bases; others’ successes thus might confirm the adequacy of the observer's similar knowledge base while others’ failures could raise questions about it. They also suggest that information about failures might be more accessible and less guarded than information about successes, particularly for competing firms.
In a study that provides support for the arguments of Madsen and Desai (2010), Mani and Muthulingam (2019) estimate the learning effects on unconventional natural gas well operators that result from observation of other nearby well operators with environmental inspections by regulators. Processes across well operators are almost identical, and the salience of outcomes (fines for environmental violations) is high. They find that well operators do not learn from successful inspections, but only from failed inspections with detected violations. Further, learning is greater when inspection violations are more severe, resulting in fines and penalties. This suggests that learning from observing poor performers can be more impactful than learning from observing best performers.
Another factor that could motivate learning from observation of poor performance is the phenomenon of “last-place aversion” (Kuziemko et al., 2014). The authors posit that ordinal rank matters differently depending on position; for those near the lowest rank, any potential drops create greater disutility and hence greater incentive to avoid a drop in rank.
To examine whether water scarcity and the proximity of geographic location between factories also enhance learning from others’ inferior performance, we offer the following set of hypotheses:
Sample and Methodology
Sample
Our sample comprises monthly water usage data for the factories of a large manufacturing Fortune 500 company (LMC). LMC has over 250 manufacturing facilities globally. LMC is in the CPG industry; its products are sold worldwide in various retail outlets. LMC's sustainability performance is good; LMC senior managers spend significant time discussing and emphasizing the importance of sustainability. Corporate managers enacted policies to enhance the firm's performance in sustainability generally as well as industrial water conservation. Within LMC's organizational structure, a factory manager is responsible for managing their respective factory site and they report to supervisors in both their geographic region and their specific product category. Consistent with corporate priorities, factory managers are expected to focus not only on understanding their factory's manufacturing performance but also its environmental performance, and improving it.
Our measure of water consumption is generated at the factory site level and indicates the total water consumed on-site. Factory personnel record the metrics and send them monthly to corporate headquarters, where they are stored in a database. A corporate headquarters team is responsible for checking the data, managing the database, and compiling performance reports. The headquarters team performs spot checks to ensure data integrity since the database information generates the firm's balanced scorecard and sustainability reporting. Finally, external auditors examine the database and check it against factory records, bills, and receipts as part of the audit.
Monthly reports are generated from the database and are available to corporate and factory management; these reports compare performance across sites. From the reports, each factory can understand its own performance as well as how that performance compares to other factories.
LMC employs a matrixed managerial structure to organize the factories based on product category and geographic region. Product categories consist of 12 groupings of products that are similar in both product characteristics and processing requirements. All factories within a product category, regardless of region, report primarily to a globally responsible manager. Geographic regions comprise eight areas; all factories within the region also report to a manager responsible for all product categories in a specific region. Thus, in LMC's matrixed structure, factory managers report to both a category manager and a regional manager. As explained in the development of our hypotheses (see Section 2.2), vicarious learning should be strongest between factories producing similar products using similar processes, as would be expected by factories in the same product category. Thus, the management structure of LMC enables vicarious learning within product categories both in the same region and across regions.
The available monthly data begins with the commencement of the LMC corporate water-monitoring program; the data covers nine years (108 months). For our main analyses, we impose an inclusion criterion that factories must be in operation for at least one year, i.e. we exclude factories in operation for a short period. This reduces our sample by 12 factories and a total of 120 factory-month observations. Since factories can experience periodic shutdowns for maintenance and/or changeovers, we also carefully check the data for any factory shutdowns and drop data in months where production was minuscule or zero in the months of a shutdown or close to a shutdown. Next, the data was further constrained to retain only product category-region combinations with at least three factories within a product category and region. This enables comparison of a factory in a region and specific category with at least two other factories in the same region and category. Finally, we perform alternate data exclusion schemes as robustness checks to check the sensitivity of our results. Robustness checks are described in Section 4.2.
The final data set contains 20,066 factory-month observations, and 43 product category-region combinations that have at least three factories. Although there are 96 potential category-region combinations (12 × 8), not every region contains every product category type. There are 248 unique factories within the 43 category-region combinations. The mean (median) number of factories in a specific product category-region combination is 6.1 (5.0), with 14 factories in the largest combination and three factories in the smallest combination. For the 12 product categories in our sample, the mean (median) number of factories is 21.4 (20.5) with 49 factories in the largest product category and three factories in the smallest product category. The average factory has 5.1 peers within its region, and 15.3 peers in other regions.
Variables
Given that learning curves are an exponential relationship between cumulative experience and the variable of interest, we log both the dependent and independent variables to permit linear regression (as in Boh et al., 2007 and Lapré et al., 2000). This permits us to decompose the learning coefficient into components representing the experiential and vicarious learning processes. All cumulative measures begin at t = 0, the first month in our sample, when LMC's water monitoring and reporting commenced. To test our hypotheses, we define our dependent, independent, and control variables as follows:
Dependent Variable
We operationalize the dependent variable Water Consumption
Independent Variables
To test H1a, we define our measure of cumulative production at the focal factory as:
Cumulative production focal factory
H1b, H2b, H3b, and H4b consider the moderating effects of water scarcity on the focal factories’ learning. To test the effects of water scarcity, we obtain factory classification data from LMC. LMC designates each factory site as either water scarce or non-water scarce based upon World Resources Institute (WRI) assessments for the watersheds where each LMC factory is located (https://www.wri.org/aqueduct). Since scarcity is time-invariant, we conduct our analyses by creating a variable labeled as:
Scarcityi: A 0/1 dummy variable designating whether factory i is located in a water-scarce watershed with the value 1, and 0 otherwise. To test our hypotheses, we interact Scarcity with each learning channel.
H2a considers the vicarious learning effects from observing factory peers’ experience. To test this, we define the independent variable:
Cumulative Production All Others (Ln CPki’t): The natural log of the running cumulative total production (in metric tons) of all factories in the focal category k other than focal factory i, in month t.
H2c considers whether geographic proximity moderates the vicarious learning effects from observing others’ experience. We operationalize geographic proximity in a dichotomous manner—whether peer factories are located within the same geographic region or in other geographic regions. We do this to mimic the organizational structure of LMC. Specifically, if we find that same-region effects have a different impact than other-regions effects, it informs regional and corporate managers where to increase or decrease management efforts and initiatives within regions and/or across regions. To test for the moderating effects of geographic proximity, we define two measures to divide others’ cumulative experience by region:
Cumulative Production Within Region
Cumulative Production Other Regions
We note that if we were to sum the above three independent variables (CP_Orkit, CP_SRrki’t, and CP_DRr’kt), the result would be the total global cumulative production for LMC in product category k and month t. We also note that we only consider vicarious learning from factories in the same product category k (both within the same region and in other regions) since we expect vicarious learning to be strongest between factories producing similar products with similar processes since they are comparable.
To test H3a, H3b, and H3c regarding learning effects from observation of the best-performing factory peers, we measure the difference in performance between the focal factory i at month t and its best-performing peer in the immediately preceding month t-1. For robustness, we later consider longer preceding periods (see Section 4.2). H3a considers the vicarious learning effects of observing the focal factory's best-performing factory peer. To test this, we define the independent variable:
Benchmark Deviation (Best) All Others (Ln DEV_Bestkit): The natural log of the performance deviation of the focal factory i at month t from the best-performing factory in all regions in the same product category k, and month t-1.

To test H3c, we again capture the effects both within region and in other geographic regions. We define the following two measures:
Benchmark Deviation (Best) Within Region

Benchmark Deviation (Best) Other Regions

As defined, if focal factory i is outperforming its best-performing peer, the value of these variables will be zero, indicating the focal factory has little to learn from observing the best-performing peers. That is not to say that best performers cannot learn from other sources including experiential learning from their own performance, vicarious learning from observing others’ experience or observing poor performers, or from external knowledge sources. A greater value for these three variables indicates worse performance for the focal factory relative to the best-performing benchmark, and consequently greater learning opportunities from observing the best performers.
H4a, H4b, and H4c consider the learning effects from observation of the focal factory's worst-performing peers. To test this, we measure the difference in performance between the focal factory at month t and its worst-performing peer in the immediately preceding month t-1. H4a considers the vicarious learning effects of observing the focal factory's worst-performing factory peer. To test this, we define the independent variable:
Benchmark Deviation (Worst) All Others (Ln DEV_Worstkit): The natural log of the performance deviation of the focal factory i at month t from the worst performing factory in all regions in the same product category k, and month t-1.

To capture the effects both within and across geographic regions (H4c), we again define two measures, similar to the measures comparing focal factories to the best performers:
Benchmark Deviation (Worst) Within Region

Benchmark Deviation (Worst) Other Regions

As defined, if focal factory i is underperforming its worst-performing peer, the value of these variables will be zero, indicating the focal factory has little to learn from observing other poor performers. A small positive value indicates near-worst performance, providing greater incentive to improve due to last-place aversion. Greater positive values for these two variables indicate better performance relative to the worst-performing benchmark, and consequently less learning from poor-performing peers.
Control Variables
Since vicarious learning from others can be a function of how many other factories there are to observe, we add controls for the number of factories other than focal factory i.
Number of Other Factories Within Region
Number of Factories Other Regions
Given that the magnitudes of reduction in water consumption are likely related to how much water the focal factory consumes (i.e., the largest water users can reduce their consumption the most), we control for each factory's cumulative water consumption.
Cumulative Water Consumption Focal Factory
Similarly, the magnitude of a factory's wastewater discharges is potentially related to the water consumption of the focal factory. Hence, we control for each factory's wastewater discharges:
Wastewater Focal Factory (CODrkit): The total wastewater discharge (in cubic meters) for factory i in region r, product category k, and month t.
As mentioned in our development of H1a (Section 2.1), the deployment of lean philosophy should aid factories in their industrial water conservation efforts. Hussain and Wahab (2018) discuss the important ties between lean manufacturing and water efficiency. LMC instituted a voluntary lean development initiative during our sample frame. About 21% of our sample factories participated, and the average participating factory had 13.4 months of experience. To control for lean influences, we define:
Lean Experience (Leanrkit): The number of months since beginning the voluntary lean development program for factory i in region r, product category k, and month t. Leanrkit = 0 for factories that either did not participate or had not yet begun participation at month t.
To control for temporal effects and to help mitigate against omitted variables, we add dummy variables for both the year of factory production and the month of factory production. In addition, we estimate a factory fixed effects model to account for factory-specific time-invariant factors.
Empirical Strategy
Our data contains both cross-sectional and time series elements. Accordingly, we use a panel regression approach that accounts for both cross-sectional and time series data. Since factory production is known to be serially correlated, we use a fixed-effects estimator to account for factory-specific aspects, the XTREGAR command in STATA 15. This approach is necessitated by the long production time series for several factories in the data. Specifically, out of the 248 unique factories, 179 factories have 100 or more months of data. The fixed-effects estimator approach can accommodate the unbalanced nature of panel data (Baltagi and Wu, 1999). Our empirical specification is of the following form:
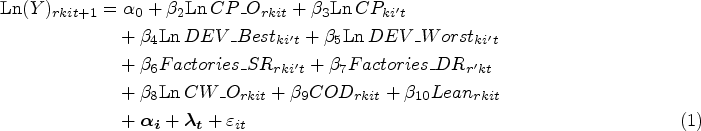

Consistent with our variable notation, the subscript i in (1) and (2) represents the focal factory and the subscript t denotes the time period.
Table 1 provides the correlation matrix and descriptive statistics for our variables. As mentioned, we have an unbalanced panel with up to 20,066 factory-month observations. The average factory has 81 monthly observations. We next present our main results, followed by our robustness checks.
Descriptive statistics for the dependent, independent, and control variables.
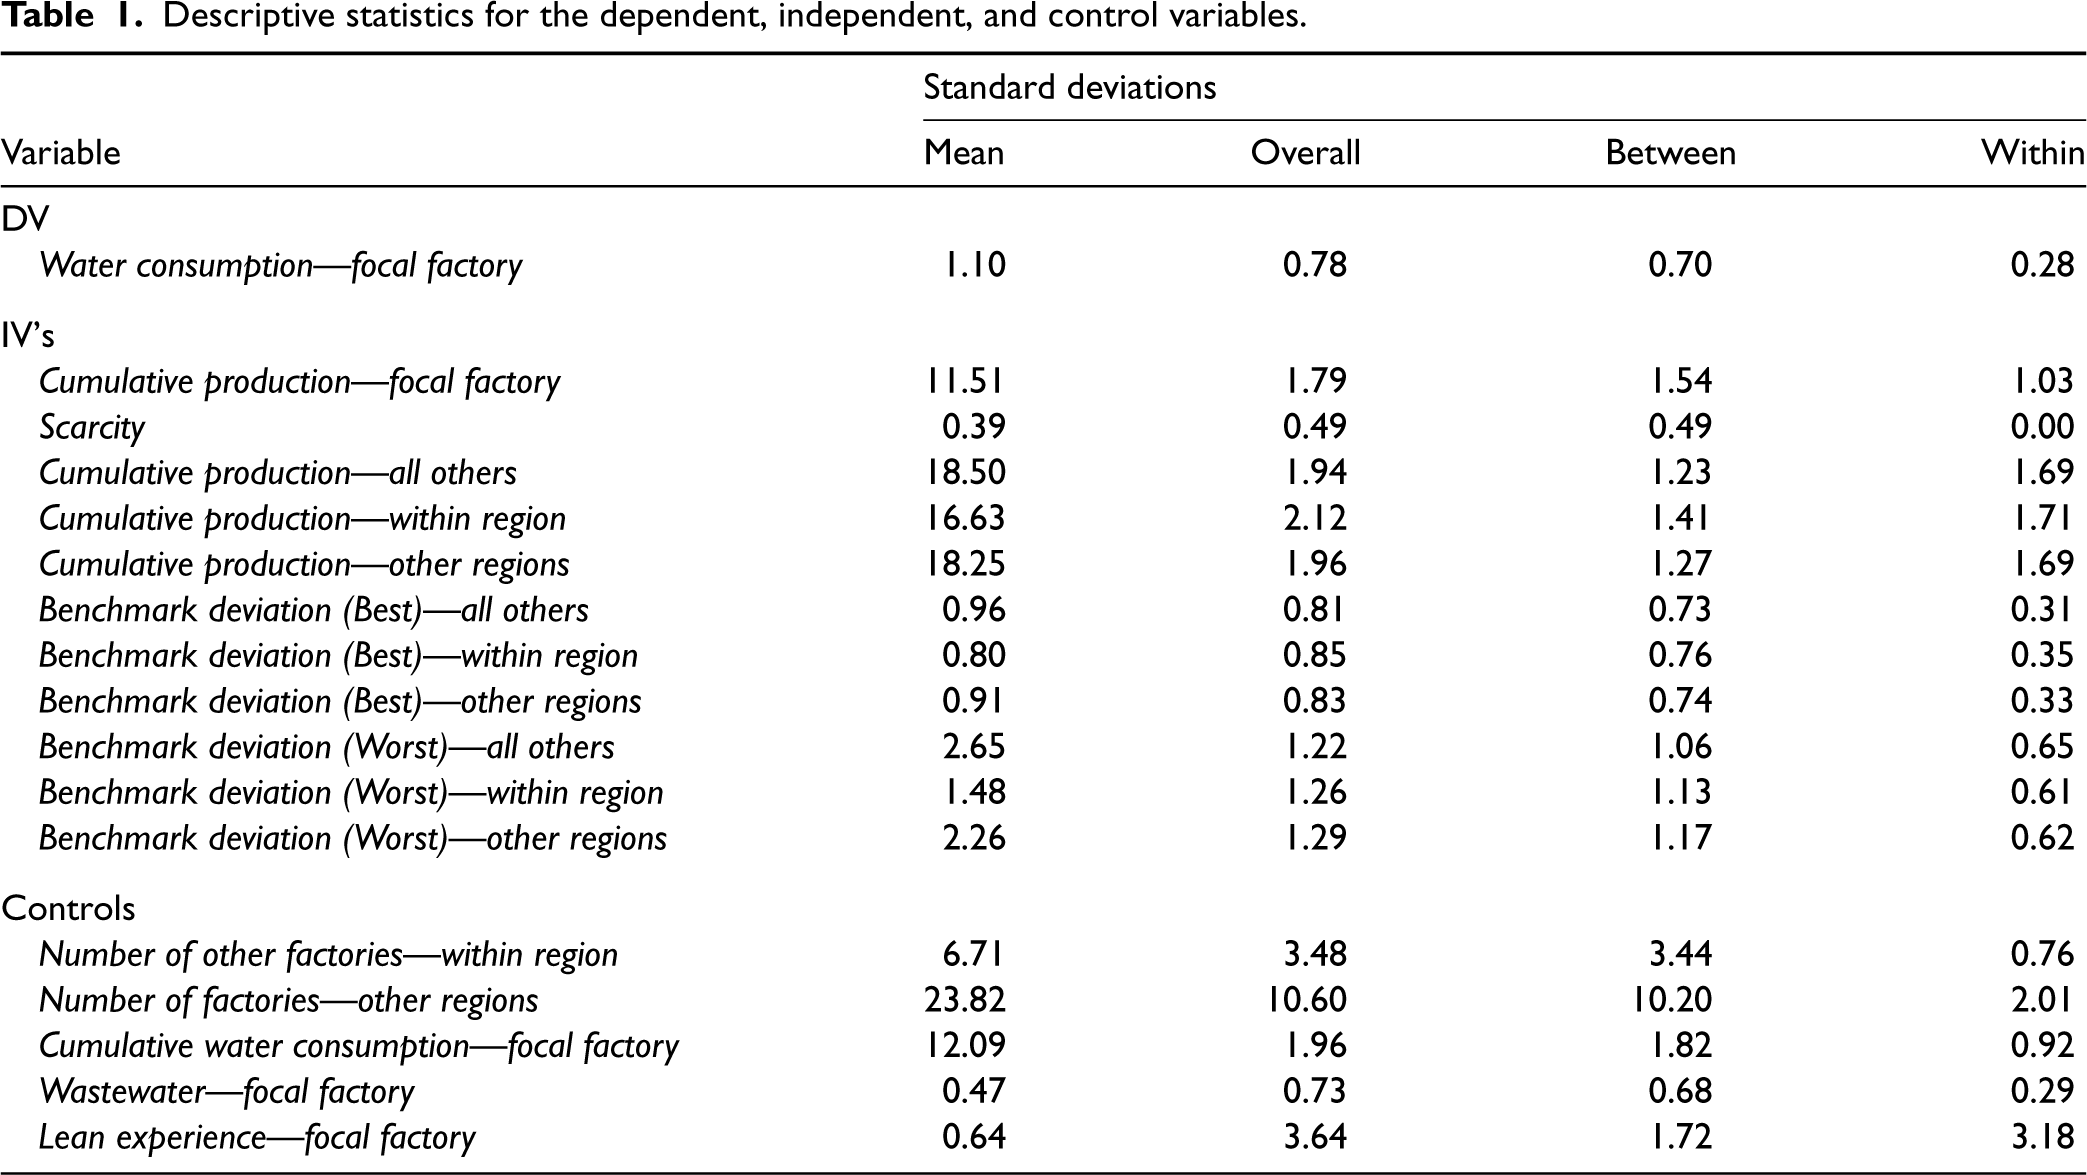
Descriptive statistics for the dependent, independent, and control variables.
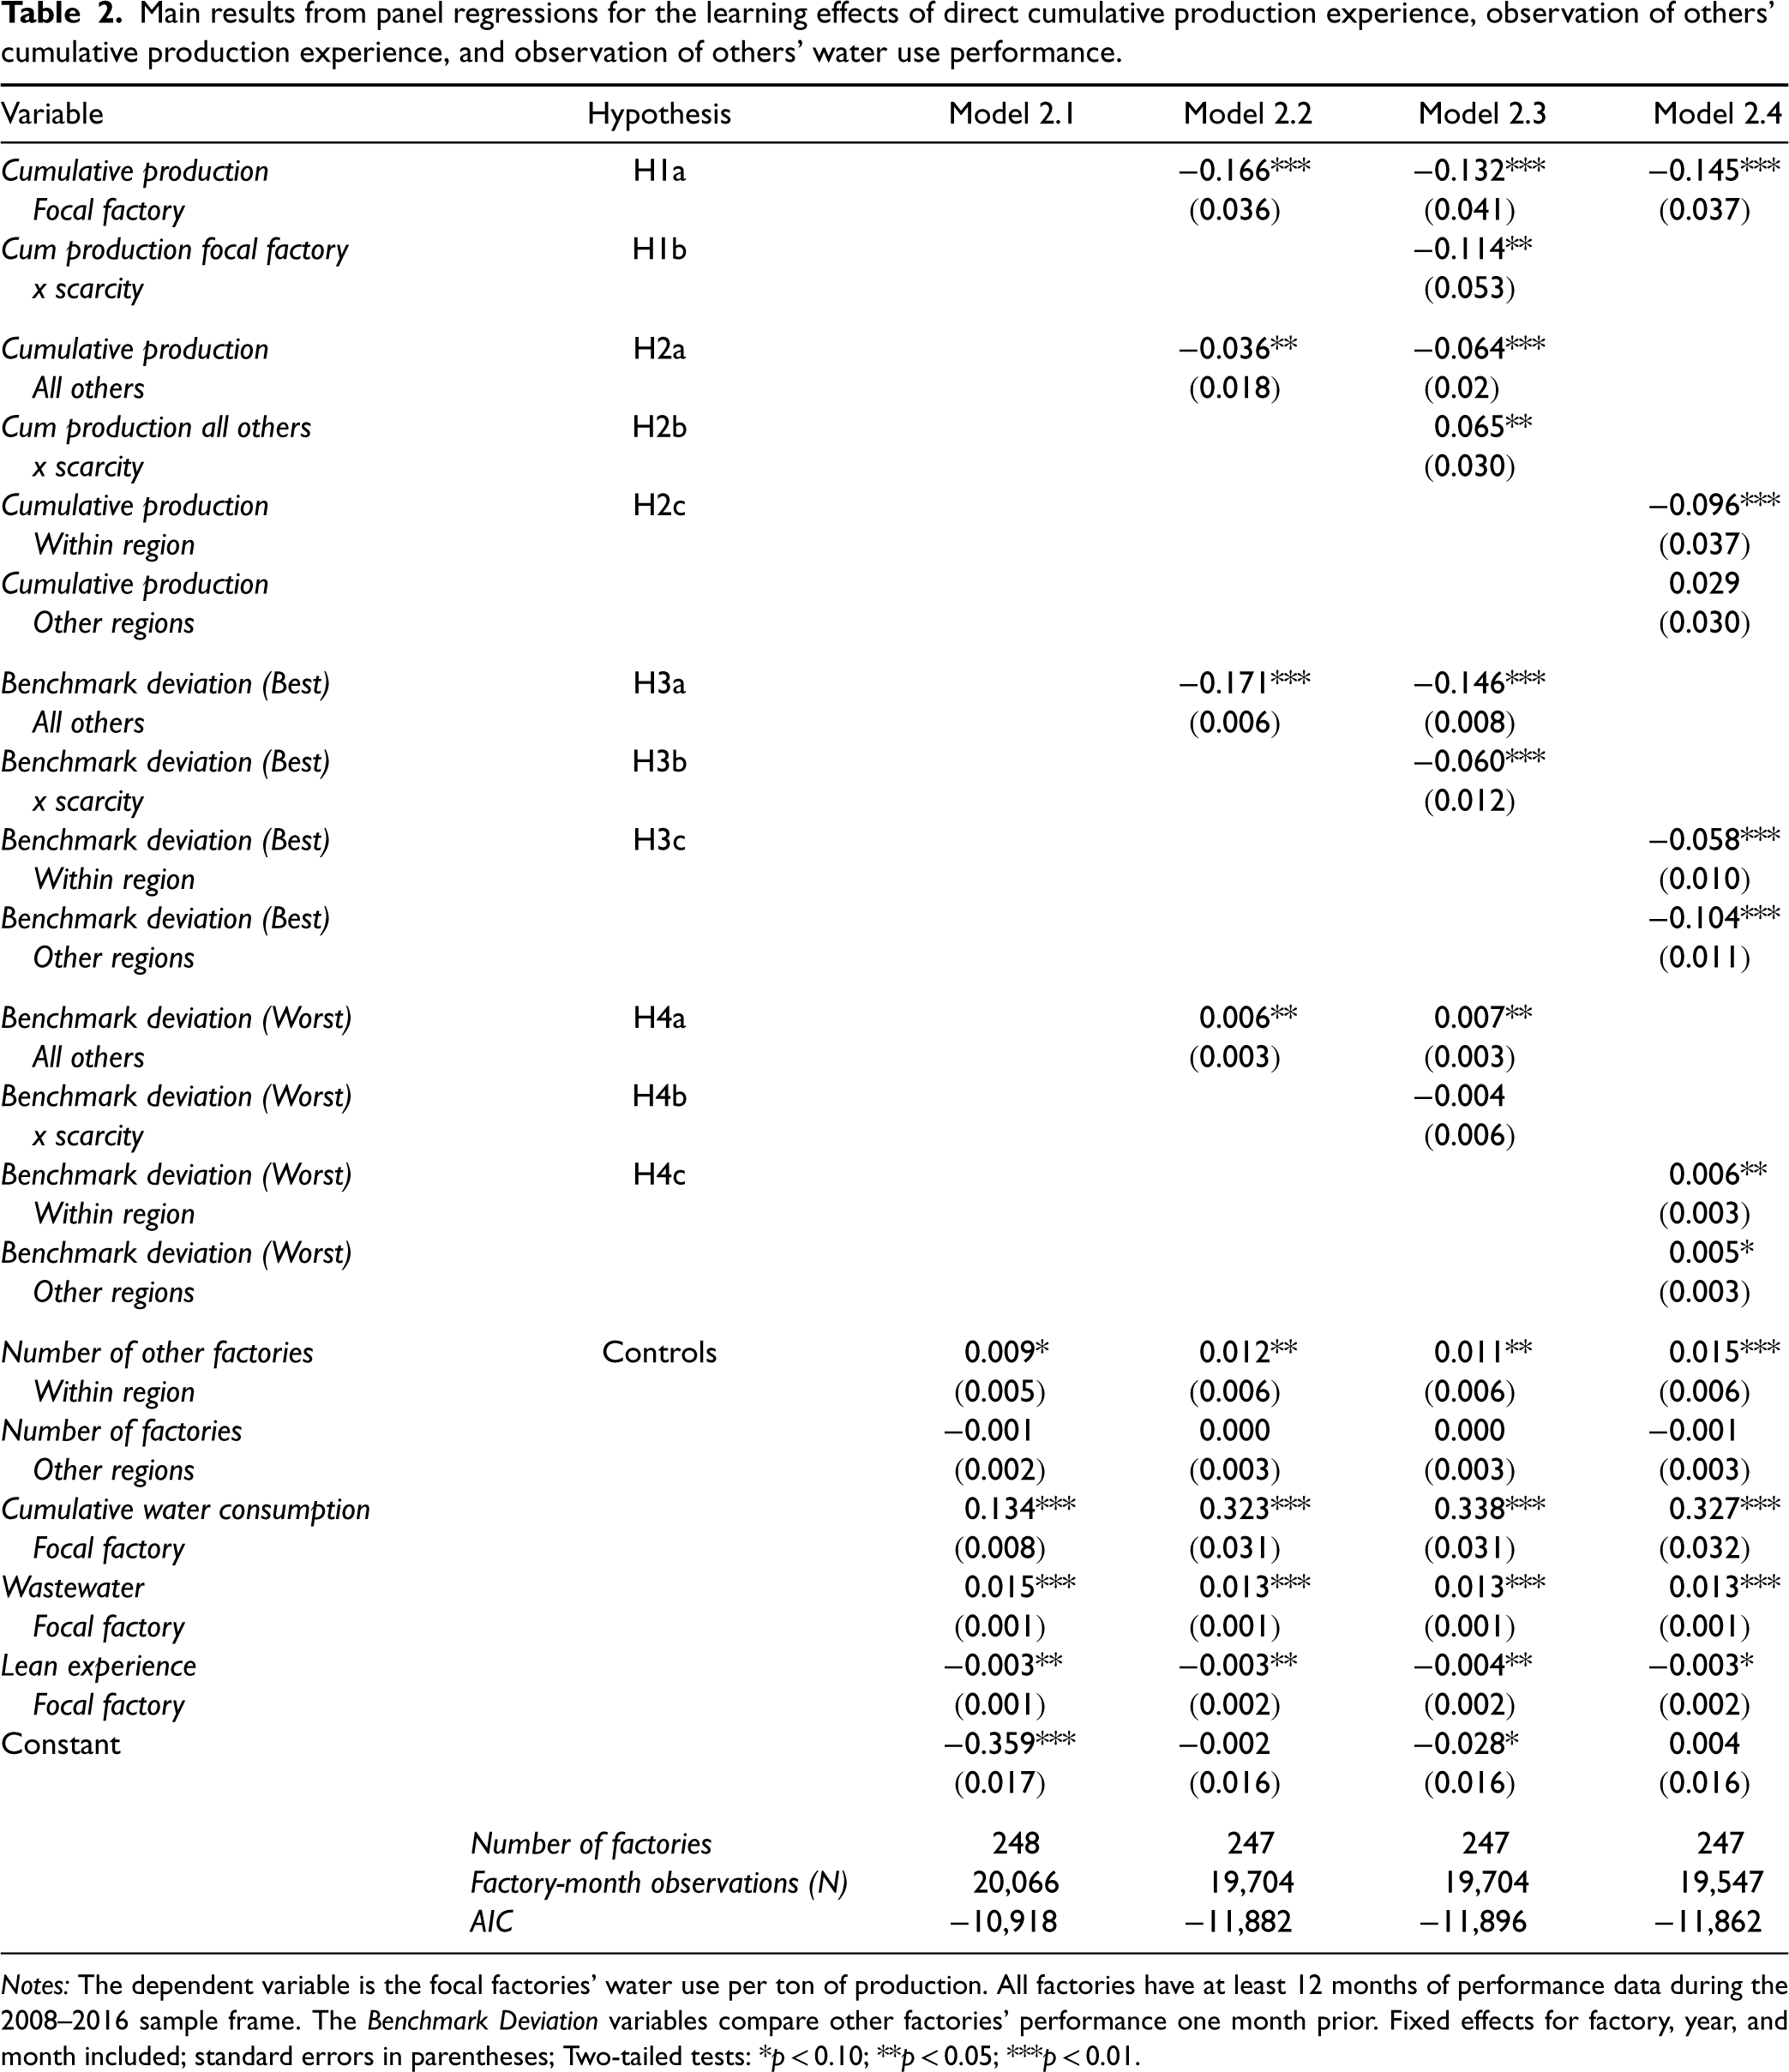
Table 2 provides the results of the regression analyses for four different models. Model 2.1 includes the control variables only. Model 2.2 adds the independent variables Cumulative Production Focal Factory, Cumulative Production All Others, Benchmark Deviation (Best) All Others, and Benchmark Deviation (Worst) All Others as tests of H1a, H2a, H3a, and H4a, respectively. In model 2.3, we add the interactions of Scarcity with each of our independent variables to test H1b, H2b, H3b, and H4b. The main effect of Scarcity cannot be included in our regressions since it is perfectly collinear with time-invariant factory-fixed effects. In model 2.4, we substitute the Within Region and Other Regions measures in lieu of the three All Others measures to test the moderation hypotheses of geographic proximity (H2c, H3c, and H4c).
Main results from panel regressions for the learning effects of direct cumulative production experience, observation of others’ cumulative production experience, and observation of others’ water use performance.
Main results from panel regressions for the learning effects of direct cumulative production experience, observation of others’ cumulative production experience, and observation of others’ water use performance.
Notes: The dependent variable is the focal factories’ water use per ton of production. All factories have at least 12 months of performance data during the 2008–2016 sample frame. The Benchmark Deviation variables compare other factories’ performance one month prior. Fixed effects for factory, year, and month included; standard errors in parentheses; Two-tailed tests: *p < 0.10; **p < 0.05; ***p < 0.01.
We first consider the main effect of each learning channel by examining the results of model 2.2. Our first hypothesis (H1a) states that an increased cumulative productive experience for the focal factory should result in reduced water consumption. As seen in models 2.2, 2.3, and 2.4, the coefficient of Cumulative Production Focal Factory is consistently negative and significant. For model 2.2, β = −0.166 (p < 0.01). This provides strong support for H1a, affirming that water consumption is subject to experiential learning effects as a consequence of LMC's management actions.
In H2a, we posit that vicarious learning from the observation of increased cumulative production of other factories in the same product category will result in reduced focal factory water consumption. For all factory peers, we see in model 2.2 that the coefficient of Cumulative Production All Others is negative and significant (β = −0.036; p < 0.05), providing support for H2a.
H3a argues that vicarious learning from observing differences in water consumption between a factory and its best-performing factory peer will result in reduced water consumption for the focal factory. For all factory peers, we see in model 2.2 that the coefficient of Benchmark Deviation (Best) All Others is negative and significant (β = −0.171; p < 0.01), providing support for H3a.
H4a predicts that vicarious learning from the differences in water consumption between a factory and its worst-performing factory peer will reduce factory water consumption. We note that, unlike our other independent variables, an increasing value for the three Benchmark Deviation (Worst) variables indicates less opportunity for learning. Thus, positive coefficients indicate less learning for better performers (greater values of Benchmark Deviation (Worst)) and greater learning for worse performers (lesser values of Benchmark Deviation (Worst)). We see in model 2.2 that the coefficient of Benchmark Deviation (Worst) All Others is positive and significant (β = 0.006; p < 0.05), providing support for H4a.
Next, we consider the moderating effects of water scarcity on our results by examining the results of model 2.3 in Table 2. For the moderating effect of water scarcity on experiential learning (H1b), we see that the main effect of Cumulative Production Focal Factory remains significantly negative and the interaction coefficient is also negative and significant (β = −0.114; p < 0.05), indicating that although the average LMC factory learns from its experience (supporting H1a), factories in water-scarce locations learn from their experience at a faster rate than factories in non-water-scarce locations. This empirical evidence of a significant moderating effect supports H1b.
Examining the moderating effect of water scarcity on vicarious learning from observing others’ experience (H2b), the main effect of Cumulative Production All Others in model 2.3 remains significantly negative but the interaction coefficient is positive and significant (β = 0.065; p < 0.05). Although the moderation is significant, it is in an unexpected direction, suggesting that factories in water-scarce locations learn from observing others’ experiences at a slower rate than factories in non-water-scarce locations.
H3b posits that water scarcity moderates the vicarious learning from observing differences in water consumption between a factory and its best-performing factory peer. We see in model 2.3 that the main effect of Benchmark Deviation (Best) All Others remains significantly negative, and the interaction coefficient is also significantly negative (β = −0.060; p < 0.01), indicating that factories in water-scarce locations learn from observing others’ best performance at a faster rate than factories in non-water scarce locations. This provides support for H3b.
For the moderating effect of water scarcity on vicarious learning from observing differences in water consumption between a factory and its worst-performing peer (H4b), model 2.3 results show that although the main effect of Benchmark Deviation (Worst) All Others remains significant and positive, the interaction coefficient is insignificant. The empirical evidence fails to support H4b.
Last, we consider the moderating effects of geographic proximity (H2c, H3c, and H4c). For learning from observing the experience of factory peers in the same region, we see in model 2.4 that the coefficient of Cumulative Production Within Region is negative and significant (β = −0.096; p < 0.01). For factory peers in other regions, we do not see a significant effect for Cumulative Production Other Regions in model 2.3. We also conduct a Wald test to examine the difference in coefficients between Within Region and Other Regions. Results suggest a significant difference across these coefficients (F = 3.920; p < 0.05), confirming that focal factories learn from observing the experience of similar peers within a region but not in other regions. This provides support for H2c, affirming that geographic proximity moderates the vicarious learning effects from observing others’ experience on the focal factory's water consumption, and that the learning rate is faster when observing others’ experience within the same region.
For Benchmark Deviation (Best) Within Region, we see in model 2.4 that for factory peers in the same region, the coefficient is significantly negative (β = −0.058; p < 0.01). The negative coefficient is interpreted as decreasing water consumption in the increasing gap between the focal factory and its best-performing factory peer in the same region. For best-performing factory peers in other regions, we also see a significantly negative coefficient for Benchmark Deviation (Best) Other Regions in model 2.4 (β = −0.104; p < 0.01). We conduct a Wald test to examine whether Benchmark Deviation (Best) Within Region is significantly different from Benchmark Deviation (Best) Other Regions. The coefficients are significantly different (F = 5.080; p < 0.05), suggesting that factories improve significantly more when benchmarking against factories in other regions rather than benchmarking within the region. Although both the Within Region and Other Regions coefficients are significantly negative, the significant difference in their magnitudes provides evidence of moderation by geographic region, supporting H3b.
Considering Benchmark Deviation (Worst) Within Region in model 2.4, the coefficient for factory peers within the same region is significantly positive (β = 0.006, p < 0.05). The results are similar for factory peers in other regions; the coefficient for Benchmark Deviation (Worst) Other Regions in model 2.4 is also significantly positive (β = 0.005, p < 0.10). A Wald test of the difference between the coefficients is insignificant (F = 0.040, p > 0.10). The similarity of these two results (Within Region and Other Regions) fails to support H4b. Together with the main effects observed in model 2.2, these results suggest that vicarious learning from observing worst performers is not as impactful as benchmarking best performers.
Regarding the control variables, the impacts of Cumulative Water Consumption Focal Factory, Number of Other Factories Within Region, Wastewater Focal Factory, and Lean Experience Focal Factory are significant across all the regression models, confirming the importance of controlling for these effects when estimating reductions in water consumption. Number of Factories Other Regions does not have a significant effect on the dependent variable.
Although endogeneity is a concern in any empirical study, several features of our dataset and measures taken by us help address it in our research context. First, measurement error can result from imprecise variables and/or sample selection bias. Using secondary data that is audited by LMC alleviates measurement concerns, and our inclusion of the entire population of LMC factories with sufficient data alleviates sample selection bias. Second, we mitigate against endogeneity from omitted variables by including appropriate control variables, and fixed effects for factories, years, and months. Our sample factories are also restricted to one corporation with a common culture, management structure, procedures, strategies, etc. Although omitted variables can never be ruled out in analyses such as ours, we believe they are not a serious concern in this analysis. Third, the potential for simultaneity or reverse causality is minimal due to the well-known directional relationship between cumulative experience and operating performance, not vice-versa. Further, we are assured by LMC management that production allocation decisions are not influenced by industrial water conservation performance, but rather by market demand forecasts. Finally, there is a temporal lag that is established within the context of learning that also alleviates concerns due to simultaneity, as in other recent studies that document learning effects (e.g., Staats and Gino, 2012).
We perform several robustness checks. For brevity, we only briefly describe the checks and results in this section. Full descriptions and results are available in an online appendix. As our first robustness check, rather than a single period lag to compute performance differences (Benchmark Deviation (Best) and Benchmark Deviation (Worst)), we examine a window of best and worst performance in the three months prior to the focal month for both the same region and different regions. Table A1 presents the results of these regressions. The coefficients for Benchmark Deviation (Best) remain significantly negative. However, the coefficients for Benchmark Deviation (Worst) are no longer significant. It seems that the relatively weak results we found for Benchmark Deviation (Worst) in our main analyses are not persistent.
As our next robustness check, we drop all factories that are not in operation for the full nine years of the sample frame. This results in a semi-balanced panel with a substantially reduced number of observations As seen in Table A2, the results are similar to the main results presented in Table 2, with no changes in the directionality of the independent variables.
Finally, we use the full data of all factories, adding factories that were in operation even for short periods of time (less than the minimum 12-month requirement for our main analyses). This results in an unbalanced panel with a greater number of observations. These results are documented in Table A3. Again, the results are substantively similar to the main results presented in Table 2, with no changes in the directionality of the independent variables.
We also reran our analyses with an alternate control variable, Number of Other Factories All Others as a substitute for Number of Other Factories Within Region and Number of Other Factories Other Regions. The results are substantively similar to our main results. Overall, these checks suggest that our results are stable and robust to substantial changes in the operationalization of the Benchmark Deviation (Best) and Benchmark Deviation (Worst) variables, and to alternate constructions of the sample frame.
Discussion and Implications
In this section, we discuss our results in the context of theory and the extant literature.
Experiential Learning
The strong results we find in all models and robustness checks for the direct effect of Cumulative Production Focal Factory support H1a and confirm the important role that experiential learning can play in improving environmental performance. The significant effect of learning by doing at the factory level is good news for those interested in promoting sustainable operations, but it is important to note that learning does not automatically follow from cumulative experience. It is likely that organizations with extensive production process experience have water consumption levels that are stagnant or even increasing.
To provide evidence of the relative rarity of improvements in water consumption, we analyze data for all firms in the CPG industry within the TruCost database during our sample frame of 2008 through 2016. As our dependent variable, we use the firm-level data item “Water Direct plus Purchased (cubic meters)” from TruCost. For our independent variable, we use the firm-level cumulative Cost of Goods Sold (COGS) as a proxy for cumulative production. We obtain COGS data from the Compustat North America and Compustat Global databases. Since COGS is reported in currency, we inflation-adjust the figures by country-year using the OECD Producer Price Index where 2015 has an index of 100. To estimate the exponential relationship of the typical learning curve, we use a log-log transformation as in equation (1).
For LMC, the focal company in our manuscript, the log-log regression model is highly significant (F = 71.32, Adjusted R2 = 0.898). The coefficient for cumulative COGS is also highly significant and negative (β = –0.169, p < 0.001). As further support for our finding that LMC factories experienced significant learning curves 2008–2016 subsequent to the initiation of their factory water monitoring and conservation program, this confirms that LMC (in aggregate) also experienced a significant learning curve.
Within the TruCost data, there are 411 other manufacturers within the GICS segments Consumer Discretionary and Consumer Staples (excluding manufacturers of durable goods) with at least three years of data 2008–2016. We perform log-log regressions on each of the 411 firms. For these firms, we find that the coefficients for cumulative COGS are: (a) positive and significant (p < 0.05): 96 firms (23.4%); (b) Positive but insignificant: 128 firms (31.1%); (c) Negative but insignificant: 127 firms (30.9%); and (d) Negative and significant (p < 0.05): 60 firms (14.6%). This means that about 62% of CPG firms experienced no significant change in water consumption and over 23% of firms actually experienced increased water consumption during our sample frame. Less than 15% can claim significant reductions. This is despite all firms gaining cumulative production experience during this time period. The relative rarity of significant reductions in water consumption adds credence to our claim that LMC's management action of instituting a water monitoring and conservation program was the significant causal factor. Our work provides evidence that not only should learning curves apply, but that they do apply at LMC. The documented learning effects that we find in LMC's factories suggest internal practices promote organizational learning with respect to environmental performance. Such learning is availed provided managers put sufficient measures in place to promote experiential learning, as in LMC.
Vicarious Learning
Our study not only documents learning by doing but also focuses on learning from others. Few studies within the sustainability learning literature have considered vicarious learning, and fewer still have considered both experiential learning and vicarious learning together in the same context. In this regard, we first considered whether factories could learn from observing the cumulative experience of other factories.
For Cumulative Production All Others, we find the effect is significantly negative (H2a). As discussed in hypothesis development, transferring knowledge between organizational units requires training, communications, information sharing, and personnel transfers. Similarities between the organization units enhance the effectiveness of knowledge transfers. Further, the similarity and significance of the coefficients for Cumulative Production Focal Factory and Cumulative Production All Others suggest that experiential learning and vicarious learning are complements in improving environmental performance.
In addition to examining vicarious learning from observing others’ experience, we also consider the learning effects of observing others’ performance. In documenting the learning from observing the environmental performance of others, our study contributes to recent learning papers in sustainability such as Mani and Muthulingam (2019). Since vicarious learning benefits can come both from successes and failures (Denrell, 2003, Madsen and Desai, 2010), we also consider directionality as in Mani and Muthulingam (2019). In our setting, vicarious learning can come from observing other entities, in particular the best performers and worst performers. In H3a, we examine the effects of benchmarking the best performers. The coefficients of Benchmark Deviation (Best) are significantly negative in all models. The negative coefficients indicate that the greater the gap between the focal factory and the best-performing factory, the greater the reduction in water consumption, supporting H3a. One reason this relationship likely holds is the ease with which factories can identify the top performers on a regular basis (Netessine and Yakubovich, 2012). As Song et al. (2018) explain, regular public disclosure of top performers permits others to observe them and identify/adopt their best practices through better performance feedback.
Further, the strongly significant results for Benchmark Deviation (Best) suggest that learning from benchmarking accrues in addition to the other learning processes we consider—experiential learning, and vicarious learning from observing other's experience. Thus, management efforts to promote all three learning processes may increase the overall benefits organizations can gain in environmental performance.
The last category of vicarious learning that we examine is the observation of worst-performing peers. Despite the literature that argues for this effect (e.g., Denrell, 2003, Madsen and Desai, 2010), we only find limited support for its significance. The coefficient of Benchmark Deviation (Worst) All Others is significantly positive in our main results (Table 2), providing some support for H4a, but the coefficients are lesser in magnitude than those for Benchmark Deviation (Best) All Others, and they are not persistent in all the robustness checks. As Kuziemko et al. (2014) explains, last-place aversion should be motivation for near-worst units to improve. Although it is commonly understood that no one enjoys last-place, the disutility associated with it is likely influenced by organizational culture and norms.
The Role of Water Scarcity
We test whether scarcity moderates both experiential learning and vicarious learning. To aid in the interpretation of the interaction between water scarcity and the independent variables that represent the various learning channels, Figure 1 presents interaction plots. We first examine experiential learning. As Table 2 (model 2.3) presents, both the main effect of Cum Production Focal Factory and the interaction effect between Cum Production Focal Factory and Scarcity are significantly negative. As seen in Figure 1(a), water consumption of factories in both water-scarce and non-water-scarce locations is decreasing as their own cumulative experience increases. However, the rate of reduction is steeper for factories in water-scarce locations. This lends support to our arguments for H1b, that water scarcity increases the attention and focus of factories on water conservation, resulting in increased learning from their cumulative experience. We note that in their study of the relationship between water scarcity and toxic emissions, Muthulingam et al. (2022) explain their assumption that water scarcity results in reduced consumption, but they are unable to observe it directly in their data. Our work provides important empirical evidence that water scarcity does indeed reduce industrial water consumption.
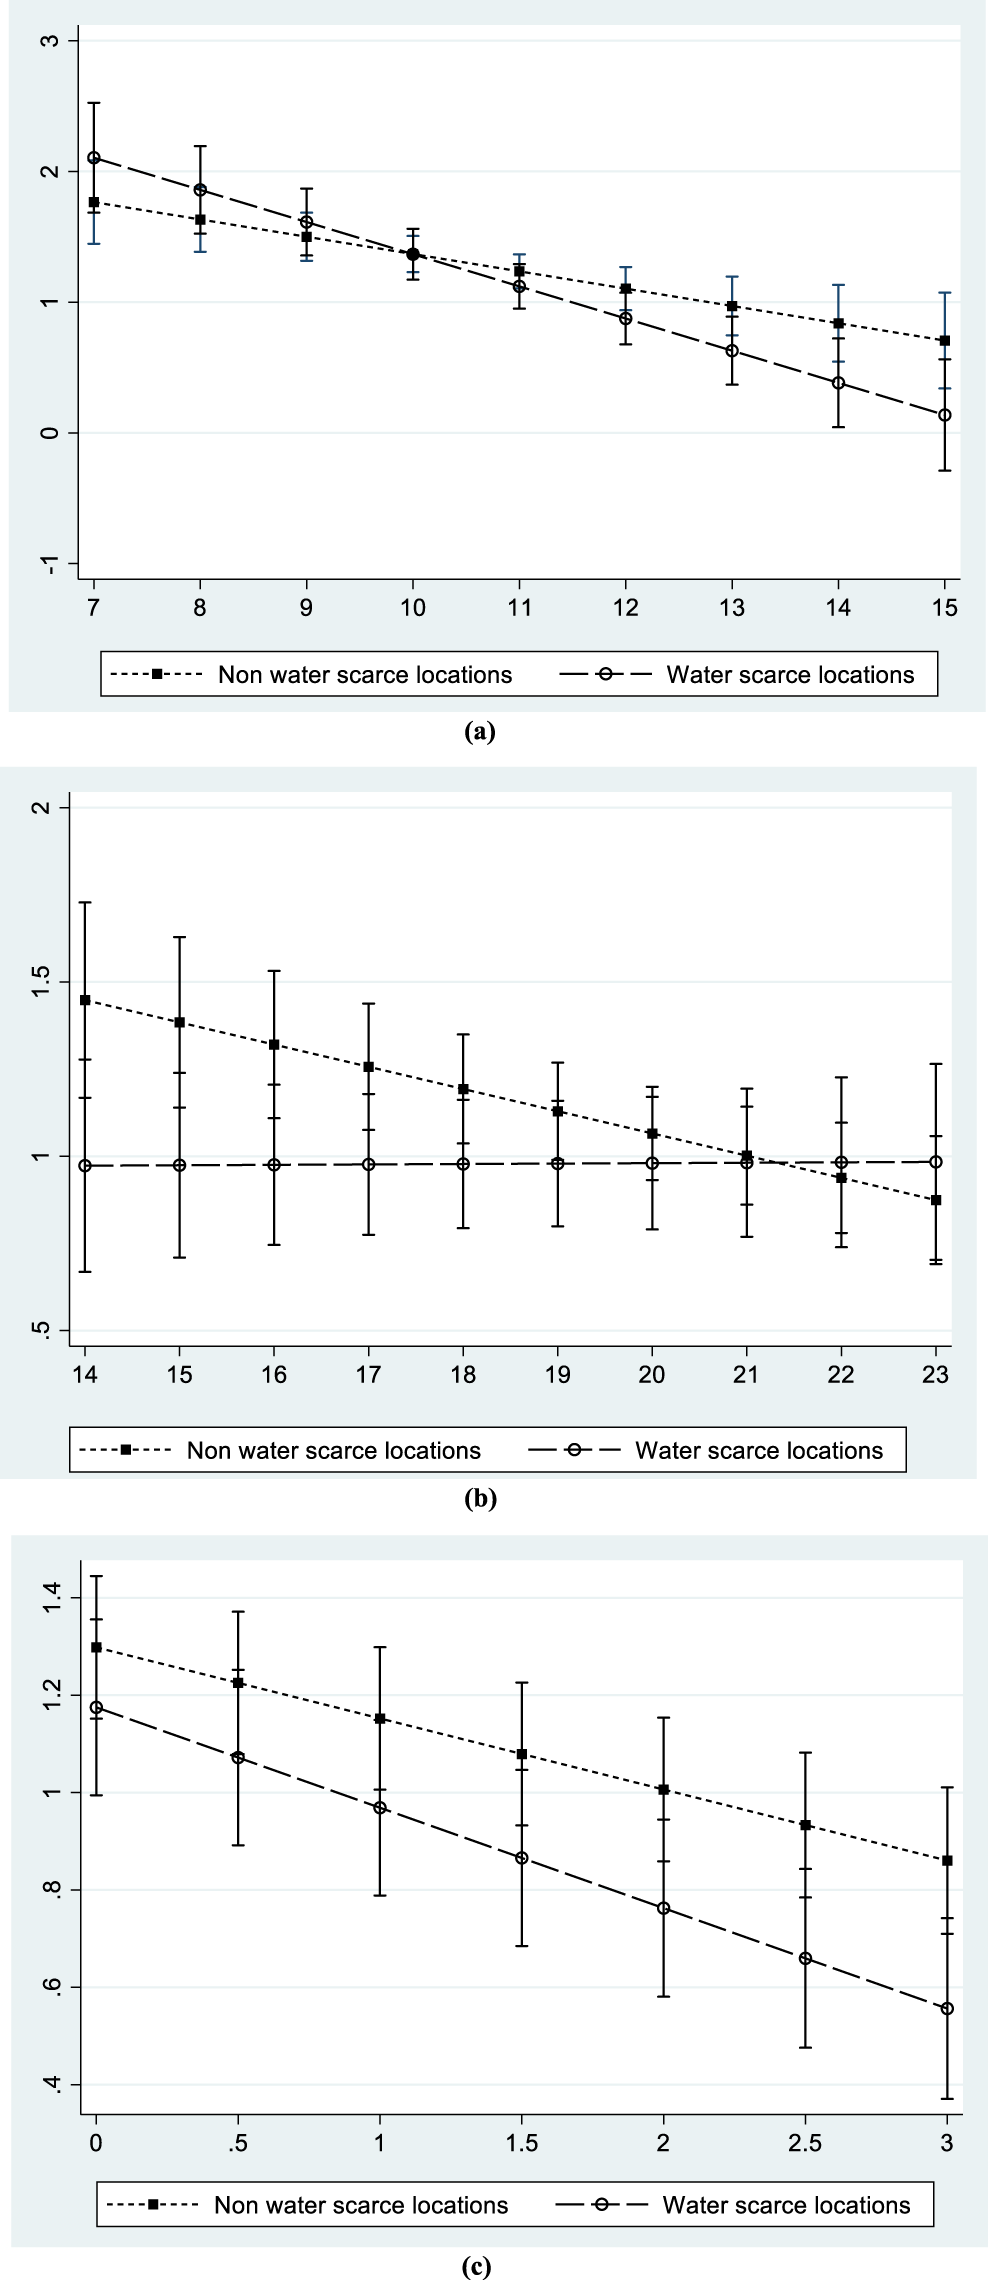
The effects on focal factory water use per ton of production, from the interaction of water scarcity and: (a) cumulative production, focal factory; (b) cumulative production, all others; and (c) benchmark deviation (best), all others. All effects are shown with 95% confidence intervals.
For vicarious learning from observing others’ experience, results from model 2.3 reveal a significantly negative main effect of Cum Production All Others but a significantly positive effect of the interaction between Cum Production All Others and Scarcity. Figure 1(b) depicts a decreasing relationship between water consumption and others’ experience for factories in non-water-scarce locations. However, factories in water-scarce locations appear to gain no learning benefit as others’ experience increases. Although this is a significant moderating effect, the directionality is counter to the expectations outlined in the development of H2b. In Section 2.2.1, we argued that the increases in experiential learning due to water scarcity should spillover into vicarious learning from others’ experience but this does not seem to be the case. Our conjecture is that this is due to the tacit nature of the knowledge embedded in others’ experience. For factories in water-scarce locations, the effort and resources required to transfer this tacit knowledge appear to be beyond the factory's capacity.
Regarding vicarious learning from observing others’ best performance, the results presented in Table 2 (model 2.3) show that both the main effect of Benchmark Deviation (Best) and its interaction effect with Scarcity are significantly negative. As illustrated in Figure 1(c), factories in both water scarce and non water scarce locations demonstrate decreasing water consumption as the distance from the benchmark distance increases, but the rate of reduction is steeper for factories in water-scarce locations. This aligns with our arguments in Section 2.2.1.
An interesting contrast between our results for vicarious learning effects from observing others’ experience versus observing others’ performance is the differing role of water scarcity. For observation of others’ cumulative experience, we find evidence of learning only in non water-scarce locations, not in water-scarce locations. This is likely because learning from others’ cumulative performance can be more challenging to observe since factory production is likely focused on their own output. Learning from others’ experience requires observation of the entire scope of that experience at multiple factories over time. For factories in water-scarce locations, their resources (including management attention), are more likely focused on the immediate problem of water scarcity. The wide scope of other factories’ experience is difficult to codify, limiting its transferability. Further, a great deal of knowledge contained within others’ experience is probably tacit.
Last, we find no significant moderating effects of water scarcity on vicarious learning from observing others’ worst performance, failing to support H4b. Given that the main effect of learning from observing others’ worst performance is marginal and not persistent, the lack of a moderating effect is unsurprising.
A seemingly plausible alternative explanation for the effects of water scarcity is water cost. For most commodities, the cost is increasing in scarcity. If the correlation between scarcity and cost is great, the cost might be the actual moderator rather than scarcity. To examine this possibility, we obtain water cost data from LMC for the factories at the beginning of our sample frame (2008). We note that cost data is only available from LMC for 178 of our 248 sample factories. All local currencies were converted into USD. We find that water scarcity is not correlated with cost in our sample (ρ = 0.031, p > 0.10). The somewhat surprising lack of correlation between water scarcity and cost in our sample is due to water often being subsidized in water-scarce regions both to attract/retain industry and to maintain low water costs for consumers. As Hoekstra (2014) notes, both water and water scarcity remain largely unpriced in many regions. The lack of correlation between scarcity and price is a somewhat unique characteristic of water. This not only increases our confidence that scarcity is a true moderator of industrial water conservation learning effects, but it also highlights the importance of research in the under-studied context of water.
Given the unsettled relationship between geographic proximity and knowledge transfer in the literature, we hypothesize and test whether geographic proximity moderates vicarious learning from observing others’ experience, best performance, and worst performance. We first consider learning from observing others’ experience. As seen in model 2.4, the effects of Cumulative Production Within Region and Cumulative Production Other Regions differ in their significance and magnitude, supporting H2c that geographic proximity moderates the effects of learning from observing others’ experience. The results suggest that vicarious learning from observing others’ experience is strongly influenced by geographic proximity. Our finding of significant vicarious learning effects only within the region lends support to cluster theorists, who argue that knowledge-sharing mechanisms are most commonly found amongst geographically proximate entities (c.f., Darr et al., 1995; Myles-Shaver and Flyer, 2000).
For vicarious learning via observation of best-performing factories, we find that significant learning occurs both within a region and from other regions. This suggests that factories find it easier to exchange benchmark information of others’ performance, rather than others’ cumulative experience. The best performers constitute a small number of factories, perhaps only one within a region or a few across all regions. Limited focal factory resources can thus be focused on a small number of other factories, reducing the effect of geography. Best performance is often attributed to specific best practices, knowledge of which is likely explicit and thus easier to transfer between distant factories. Our findings provide support not only for the importance of identifying and communicating best performers as a means to increase vicarious learning across the organization, but that geographic distance is not a constraint to such learning.
As with water scarcity, an interesting contrast between our results for vicarious learning effects from observing others’ experience versus observing others’ performance is the differing role of geographic proximity. For observation of others’ cumulative experience, we find evidence of learning only within the region, not from other regions. As explained in Section 5.3, this is likely due to the tacit nature of others’ experience. Given limited factory resources, it is likely that observation of experience will be rationed to the most proximate facilities. The directionality and significance for Benchmark Deviation (Worst) Within Region and Benchmark Deviation (Worst) Other Regions are also not consistent across our robustness checks, failing to support the moderating effects of geographic proximity (H4c). Taken together, these results suggest that the factories in our data do not benefit much from observation of worst performers.
In summary, our results imply that: (1) experiential learning is important, provided sufficient management actions are expended to promote it, and it is particularly important for factories in water scarce locations; (2) learning from observing others’ experience is only effective for factories in non water scarce locations, and for geographically proximate units; (3) learning from benchmarking best performers is effective for all factories but especially so for factories in water scarce locations, and when benchmarking best performers in other regions; and (4) learning from observing worst performers has limited beneficial learning effects that are not moderated by either water scarcity nor geographic proximity.
Conclusion
In this paper, we employ a unique propriety data set comprising the monthly production and water consumption of 248 unique factories over nine years. Using panel regression methods, we provide evidence of significant experiential learning and vicarious learning. Our study distinguishes between vicarious learning processes by considering observing others’ experience, benchmarking best performers, and benchmarking worst performers. We find that factories learn from all four learning channels concurrently, although the empirical support for learning from benchmarking worst performers is limited. It is important to note that the different learning effects appear to be complementary and not substitutive. Our results also suggest that vicarious learning is moderated by both water scarcity and the factory's geographic location.
Despite our contributions, our work is not without limitations. The construction of our dataset does not permit us to empirically test specific factory-level mechanisms responsible for heterogenous rates of learning across the factories in our sample. Examining and testing factory-level mechanisms would require significantly different types of data, but would undoubtedly yield interesting results.
Although our data set permits us to measure factory-level performance in a global context and is ideal for our research purposes because the factories share common equipment, reporting, and corporate culture, it is from only one corporation. To the extent that the results are due to the corporation's management structure, culture, mission, or strategy, our results might not be representative of other factories or corporations. It is likely that learning opportunities for factories are more readily available and accessible from their corporate peers, in comparison to factories from other corporations. Replication with a different set of factories would extend the generalizability of our findings. Finally, our focus in this paper is strictly on intra-firm learning. External or inter-firm learning opportunities might also be influential. Future research that combines both intra-firm and inter-firm learning processes can add to the organizational learning literature.
Supplemental Material
sj-docx-1-pao-10.1177_10591478231224929 - Supplemental material for Reducing Industrial Water Consumption: The Impact of Organizational Learning
Supplemental material, sj-docx-1-pao-10.1177_10591478231224929 for Reducing Industrial Water Consumption: The Impact of Organizational Learning by Amrou Awaysheh, Sriram Narayanan and Brian W. Jacobs in Production and Operations Management
Footnotes
Declaration of Conflicting Interests
The authors declared no potential conflicts of interest with respect to the research, authorship, and/or publication of this article.
Funding
The authors received no financial support for the research, authorship, and/or publication of this article.
How to cite this article
Awaysheh A, Narayanan S and Jacobs BW (2024) Reducing Industrial Water Consumption: The Impact of Organizational Learning. Production and Operations Management 33(1): 225–242.
References
Supplementary Material
Please find the following supplemental material available below.
For Open Access articles published under a Creative Commons License, all supplemental material carries the same license as the article it is associated with.
For non-Open Access articles published, all supplemental material carries a non-exclusive license, and permission requests for re-use of supplemental material or any part of supplemental material shall be sent directly to the copyright owner as specified in the copyright notice associated with the article.