
Abstract
Drawing from environmental criminology principles, this article explores the existing literature to assess the utility of remote sensing data in detecting and analysing features in the urban environment that are associated with crime occurrence. A systematic review of the literature in the English language from 2003 until the first half of 2023 from two major databases, Scopus and Science Direct, is carried out. As many as 910 publications were selected, from which 36 publications satisfied the selection criteria. Findings show that neighborhood's design has a quantifiable imprint that is possible to be observed with very high spatial-resolution imagery. Given its high spatial and temporal resolution, remote sensing data can to different degrees support the identification of criminogenic features in urban environments (streets and roads, property boundaries, housing density, characteristics and density of vegetation as well as luminosity levels), but when it is used for the detection of potentially illegal activities, infringement of people's privacy and methods lacking validation still present serious concerns. The article concludes with a discussion of the opportunities and challenges of using remote sensing data in crime analysis.
Keywords
Introduction
Safety is a crucial characteristic for cities striving for sustainability, as emphasized by the UN-Habitat's Safe Cities report in 2019 (UN-Habitat, 2018). The way we monitor and govern cities has an impact on how safe they become for their citizens (Armitage & Monchuk, 2011; Cozens, 2001; Cozens et al., 2002; Hillier, 2004; Poyner, 2005; Poyner & Webb, 1987; Taylor & Harrell, 1996), processes that demand continuous flows of updated data and knowledge. Apart from relying on the course, aggregated secondary conventional statistics, researchers and planners carry out fieldwork inspections and other data collection strategies (surveys, interviews, focus groups) to gather fine-grained spatial data. These strategies are often time-consuming, labor-intensive, costly, and temporal-dependent (e.g., Armitage et al. (2011); Ekblom (2011); Iqbal and Ceccato (2016)). This is particularly problematic in resource-poor urban environments, where conventional data may not be available, making it difficult to study particular criminogenic conditions.
Another less explored alternative to data collection is to employ remote sensing data. Remote sensing is the “acquisition of data about an object without touching it” (Jensen, 2000) through satellite images, aerial photographs, unmanned aircraft systems (UASs/UAVs/drones), micro-satellites. High-resolution images have been used to study patterns of, and changes in, for example, land cover and land uses, building structure, layout of street networks, and levels of economic activity (Herold et al., 2003; Lu & Weng, 2006; Mellander et al., 2015; Slonecker et al., 2001; Weng, 2012). As suggested by Kelly and Kelly (2014) remotely sensed images can detect crimes or effects of crime that are visible from above and for sustained periods of time, but they cannot detect murder, assault, homicide, or robbery as they happen. What can be done is to identify through remote sensing data individual objects or the aggregation of them in the urban fabric that can be associated with the situational conditions of crime (Patino & Duque, 2013) using environmental criminology as a reference.
The aim of this article is to investigate the utility of remote sensing in detecting and analyzing criminogenic conditions in urban environments. This is carried out by means of a systematic review of the literature in the English language focusing on the use of satellite imagery products. The systematic literature overview is conducted from 2003 until the first half of 2023 from two major databases, Scopus and Science Direct, extracting information from journal articles, books, sections of books, theses, and conference proceedings.
This systematic literature review follows and complements the existing compilation of literature by Kelly and Kelly (2014, p. 11115), who investigate the existing literature on the subject of crime detection using remote sensing technologies. The focus of this review was to critically assess how remote sensing has been used to detect crime events that go unreported, and the types of validation protocols used in these studies. The review concludes by discussing the importance of using remote sensing vis-a-vis a wide discussion concerning the impact of advancing geospatial technology within a society undergoing heightened surveillance. The study finishes by proposing “second-order” validation techniques that could add vital context and understanding to remotely sensed images in a law enforcement context. The article is from a decade ago and focuses on potential crime locations only (not on urban features) and at various spatial scales. Since this is an emerging question of increasing relevance, we argue for the need for an updated review of the literature covering the last 9 years of research in this area. This makes this review unique as there has been no other systematic literature review on the relationship between the information on the physical environment extracted from remote sensing data and crime. Finally, this review holds significant relevance for both the realm of criminology and the domain of remote sensing. It acts as a valuable compass for researchers, offering direction for future investigations by spotlighting potential new research questions.
Basic Definitions
In this section, we underscore fundamental concepts as a point of reference for the reader.
Remote sensing—is the process of detecting and monitoring the physical characteristics of an area by measuring its reflected and emitted radiation at a distance, typically from a satellite or aircraft (USGS, 2022). Remotely sensed satellite data (images) come in two basic types, passively collected data and actively collected data.
Urban crime—offences according to the law that takes place in urban areas; such as crimes against property or a person, but may also involve what are known as victimless crimes, such as crimes against nature or wildlife crimes.
Image texture—in the remote sensing context is the spatial arrangement and variation of pixel values within an image. The image texture of the urban environment provides information about the patterns, structures, and heterogeneity present in the image that indicates ways the urban space is organized, such as streets, housing, green areas, and water bodies. The combination of these elements is said to be related to the city's functions (residential, commercial, etc.), people's daily routine activities, and consequently crime location and patterns.
NDVI is a Normalized Difference Vegetation Index and is an index used in remote sensing to assess the health and density of vegetation cover in a specific area based on satellite or aerial imagery. While an NDVI does not itself predict crime, the index is linked to various environmental and socio-economic factors that can influence people's routine activity and consequently, crime patterns in urban areas (Bhatia & Jason, 2023; Ogletree et al., 2022; Wolfe & Mennis, 2012).
Spatial resolution—in remote sensing refers to the level of detail or granularity with which a remote sensing system can capture and represent objects or features on the Earth's surface (how small or fine the individual “pixels” are), for example, 10 by 10 m.
Temporal resolution—refers to the frequency at which data are collected for a specific location on the Earth's surface over time, for instance, every seven days. Satellites like the Landsat series (e.g., Landsat 8) and the European Space Agency's Sentinel-2 provide moderate-resolution imagery with revisit intervals typically ranging from a few days to a couple of weeks, depending on the specific satellite.
Crime prevention—“entails any action designed to reduce the actual level of crime and/or the perceived fear of crime” (Lab, 2010, p. 24).
Safety—in this study, “safety” or “safe” is used to refer to both a non-criminogenic environment and/or the perception of safety by an individual who declares feeling free from the fear of crime.
Theoretical Background and Research Questions
Cities show that the relationship between household composition, physical environment, and crime occurrence is dynamic and complex, both spatially and temporally. Criminologists have long explored the relationship between community crime levels and varying social conditions of the resident population. In their seminal work on Chicago, Shaw and McKay (1942) argued that low economic status, ethnic heterogeneity, and residential instability led to “community disorganization,” which in turn resulted in high rates of delinquency. Social disorganization theorists have linked high crime areas to weak social control (Kornhauser, 1978), and more recently, to poorer collective efficacy (Rosenfeld et al., 2001; Sampson et al., 1997). However, these interpretations of crime dynamics are problematic, because they are often linked to people's places of residence (disregarding people's daily movement patterns), or they disregard the complexities of local situational settings within neighborhoods which are crucial when it comes to explaining why crime happens at particular places and times. It is important to consider that crime is also a function of people's daily routine activity.
Criminal acts require convergence in space and time of a motivated offender, a suitable target, and the absence of capable guardians who can potentially act and prevent crime (Cohen & Felson, 1979). Yet, crimes do not occur uniformly across city environments, even if this convergence may occur because “motivated criminals do not search through a whole city for targets; they look for targets within their more restricted awareness space” (Brantingham (1984), p. 365). This means that particular places for crime are selected by offenders according to their characteristics. Environmental criminology has shown that spatial distribution of crime demonstrates that certain land uses, i.e., the concentration of commercial and residential areas, are associated with crime concentrations (Browning et al., 2010; Kinney et al., 2008). Neighborhoods differ by the types of physical and social environments they contain and these environments can influence the likelihood of crime occurrence (Taylor and Harrell (1996), p. 32).
Decades of research have shown that particular features such as street layouts, lighting, building design, open spaces, and land use can create opportunities for crime or discourage criminal behavior as postulated by principles of situational crime prevention and Crime Prevention Through Environmental Design (CPTED). Thus, urban environments with clear lines of sight and well-maintained spaces promote natural surveillance and potentially less crime (Iqbal & Ceccato, 2016), while visible cues of physical and social disorder in a neighborhood can lead to an increase in crime (Wilson & Kelling, 1982). However, the urban environment does not affect individuals equally. Individuals are mobile and spend time in many environments with differing and variable criminogenic characteristics over time. The influence of area characteristics on individual behavior varies spatially and temporally. For research, the capacity to track these spatial and temporal variations of the environment is fundamental to exploring the relationship between the environment and crime.
In a number of fields, researchers have developed innovative ways to use remotely sensed data to generate useful information about places across time. The current availability of remote sensing data from various sources and sensors freely through programs (such as Copernicus and the European Union's Earth Observation Program), has enabled researchers to access not only data with high spatial resolution (Sentinel-2A, for example, with 10 m resolution) but also temporal resolution (data collection every seven days), and with different sensors that collect a variety of data. Considering the notion that the visual characteristics of urban environments mirror the social dynamics within them, a question arises: Can we identify a measurable signature of these environments when observed remotely? This involves examining whether discernible features can be extracted from remote sensing imagery to capture the essence of these urban spaces.
To answer this question, we carried out a systematic literature review that consists of two parts. The initial section covers a bibliometric analysis providing a snapshot of the width of the research using remote sensing in detecting and analysing criminogenic conditions in urban environments followed by a short thematic section with in-depth analysis of four themes. The main research questions we aim to answer are:
What is the year of publication, affiliated country of the research institutes/universities, and inferred gender of the first authors of the studies using remote sensing data for urban crime analysis between 2003 and 2023? What types of methods are used for the collection of data (e.g., passive versus active sensors, resolution)? What specific remote sensing data collection techniques are most commonly employed in urban crime analysis? What is remote sensing data used for? Is it possible to specify applications of remote sensing data in urban crime analyses highlighting how these applications contribute to solving related challenges? What are the main themes of research in crime? Can we identify the top research themes in criminology where remote sensing data has been instrumental, and provide examples of how this data has been utilized to study urban crime patterns or enhance public safety? What are the potentialities and challenges of using remote sensing data in criminological research? What are the opportunities and obstacles for integrating remote sensing data into criminological studies? Based on current limitations, what specific areas of future research can be advanced?
Methods
We adopted the systematic review protocol of type PRISMA-P 2015 (PRISMA-P Group et al. 2015) to support inclusion based on the following criteria of importance. As described by Moher et al. (2015), “the preparation of a protocol is an essential component of the systematic review process; it ensures that a systematic review is carefully planned and that what is planned is explicitly documented before the review starts, thus promoting consistent conduct by the review team, accountability, research integrity, and transparency of the eventual completed review”. The criteria of selection were:
Studies published between 2003 and 2023 in Scopus and Science Direct. Empirical studies devoted to the analysis of different types of crimes in the urban environment with the use of remote sensed data. Interdisciplinary pieces of research mostly, from Remote Sensing, Criminology, Sociology, Economics, Social-Political Science, and other related fields such as History and Geography. We focused on quantitative/mixed method approaches (e.g., regression analysis based on surveys, correlation) and qualitative studies (e.g., discourse analysis, descriptive analysis of data, ethnographic studies, fieldwork, action research);
We excluded studies that use remote-sensing technology to study violent conflict (see e.g., Avtar et al., 2021; Witmer, 2015), and most studies that use Google Street View (GSV) to detect land use features in urban landscape (see e.g., Hipp et al., 2022; He et al., 2017; Lu, 2019). Studies in other languages and outside the search-window were excluded (e.g., Ceccato, 1994 and Cowen and Jensen, 1998).
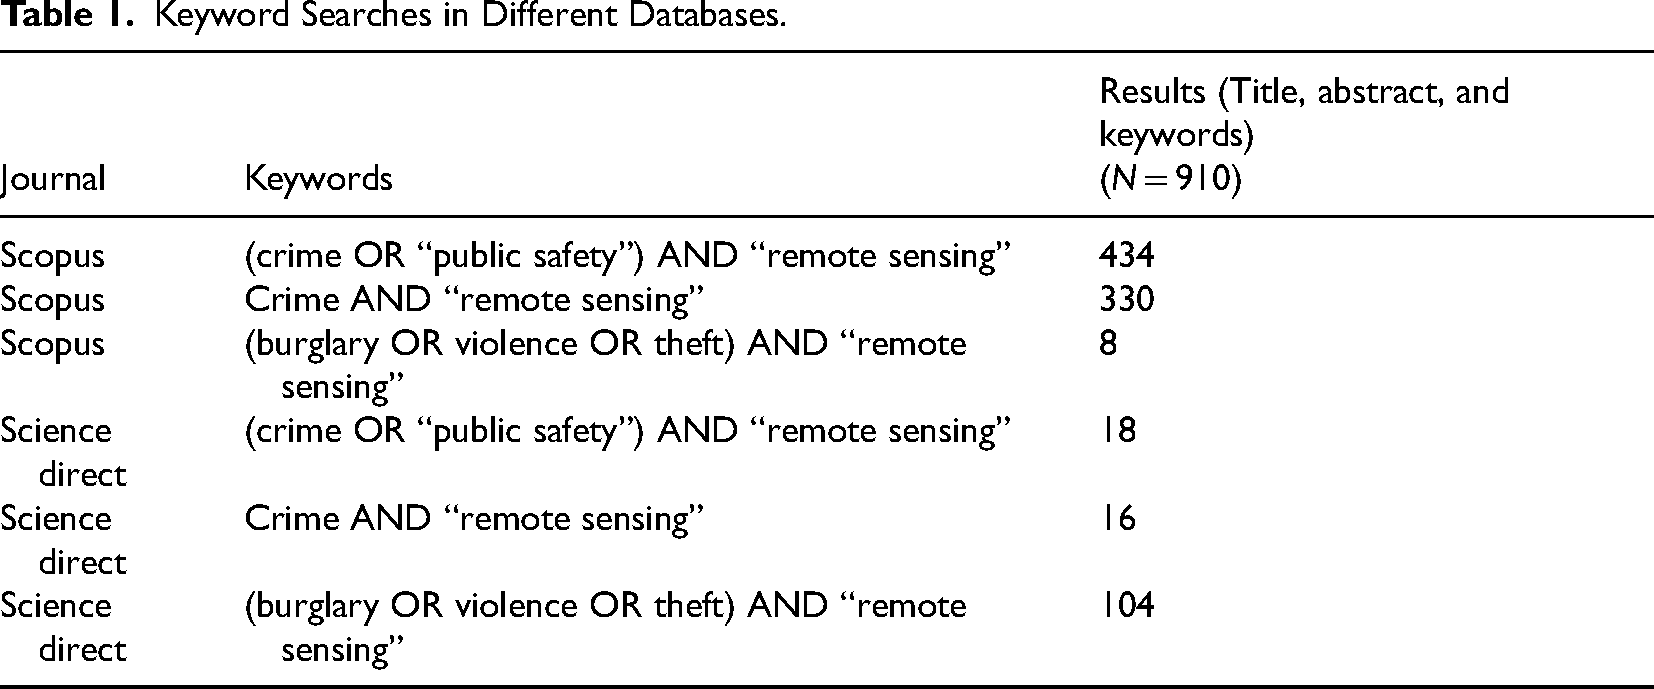
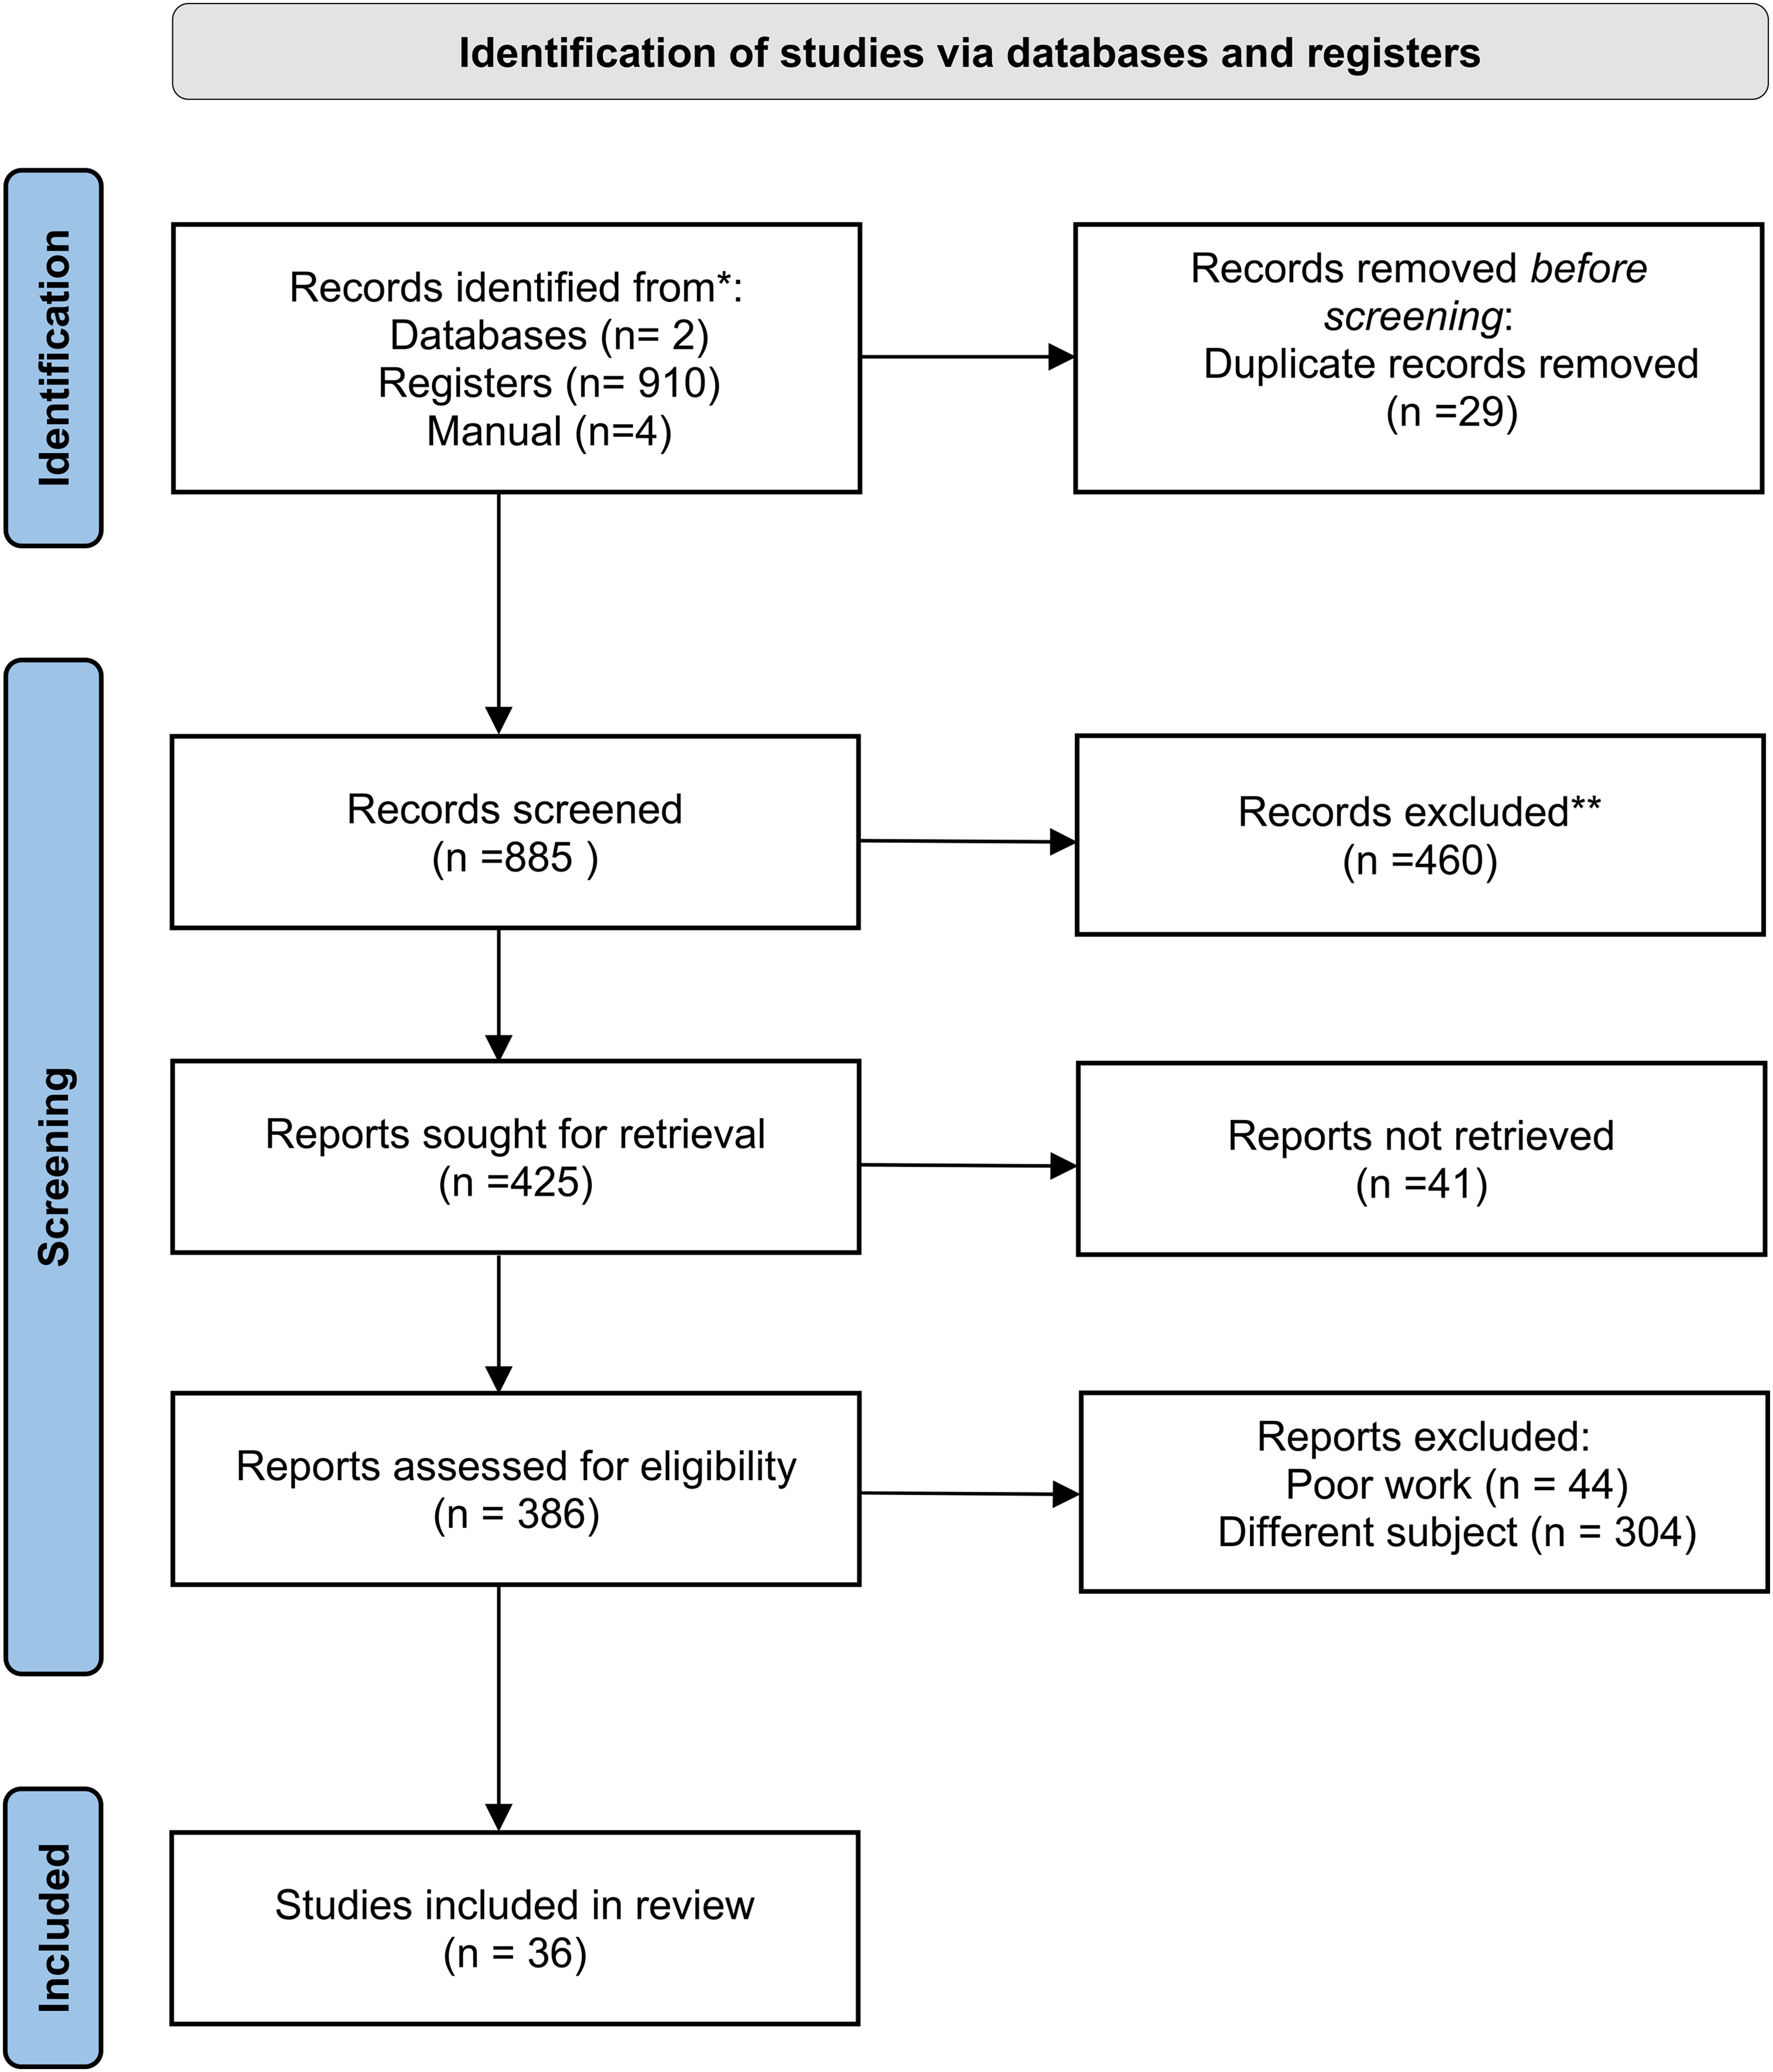
We started by selecting 910 published articles, books, and theses on remote sensing and crime and safety from two databases, Scopus and Science Direct (keywords are illustrated in Table 1). From 910 publications selected by a collection of general keywords, 36 remained. First, 29 duplicates were eliminated, then 460 articles were excluded after screening and being deemed not relevant (they were related to terrestrial remote sensing, forensic criminology, environmental pollution, surveillance). A further 41 articles for which we could not retrieve the manuscript were eliminated and later, a further 44 articles which we evaluated as poor work were excluded. Out of 386 theses, four were selected manually, since we had already evaluated them as significant for our study. Out of the 386 publications, 36 articles were related to criminal offences in the urban environment, such as theft, violence, and burglary. Figure 1 illustrates the process of identification, screening and inclusion.
Keyword Searches in Different Databases.
The methodological steps to perform the literature search are based on the selection criteria adapted from Moher et al. (2009). Source: Authors.
Results
Bibliometric Results
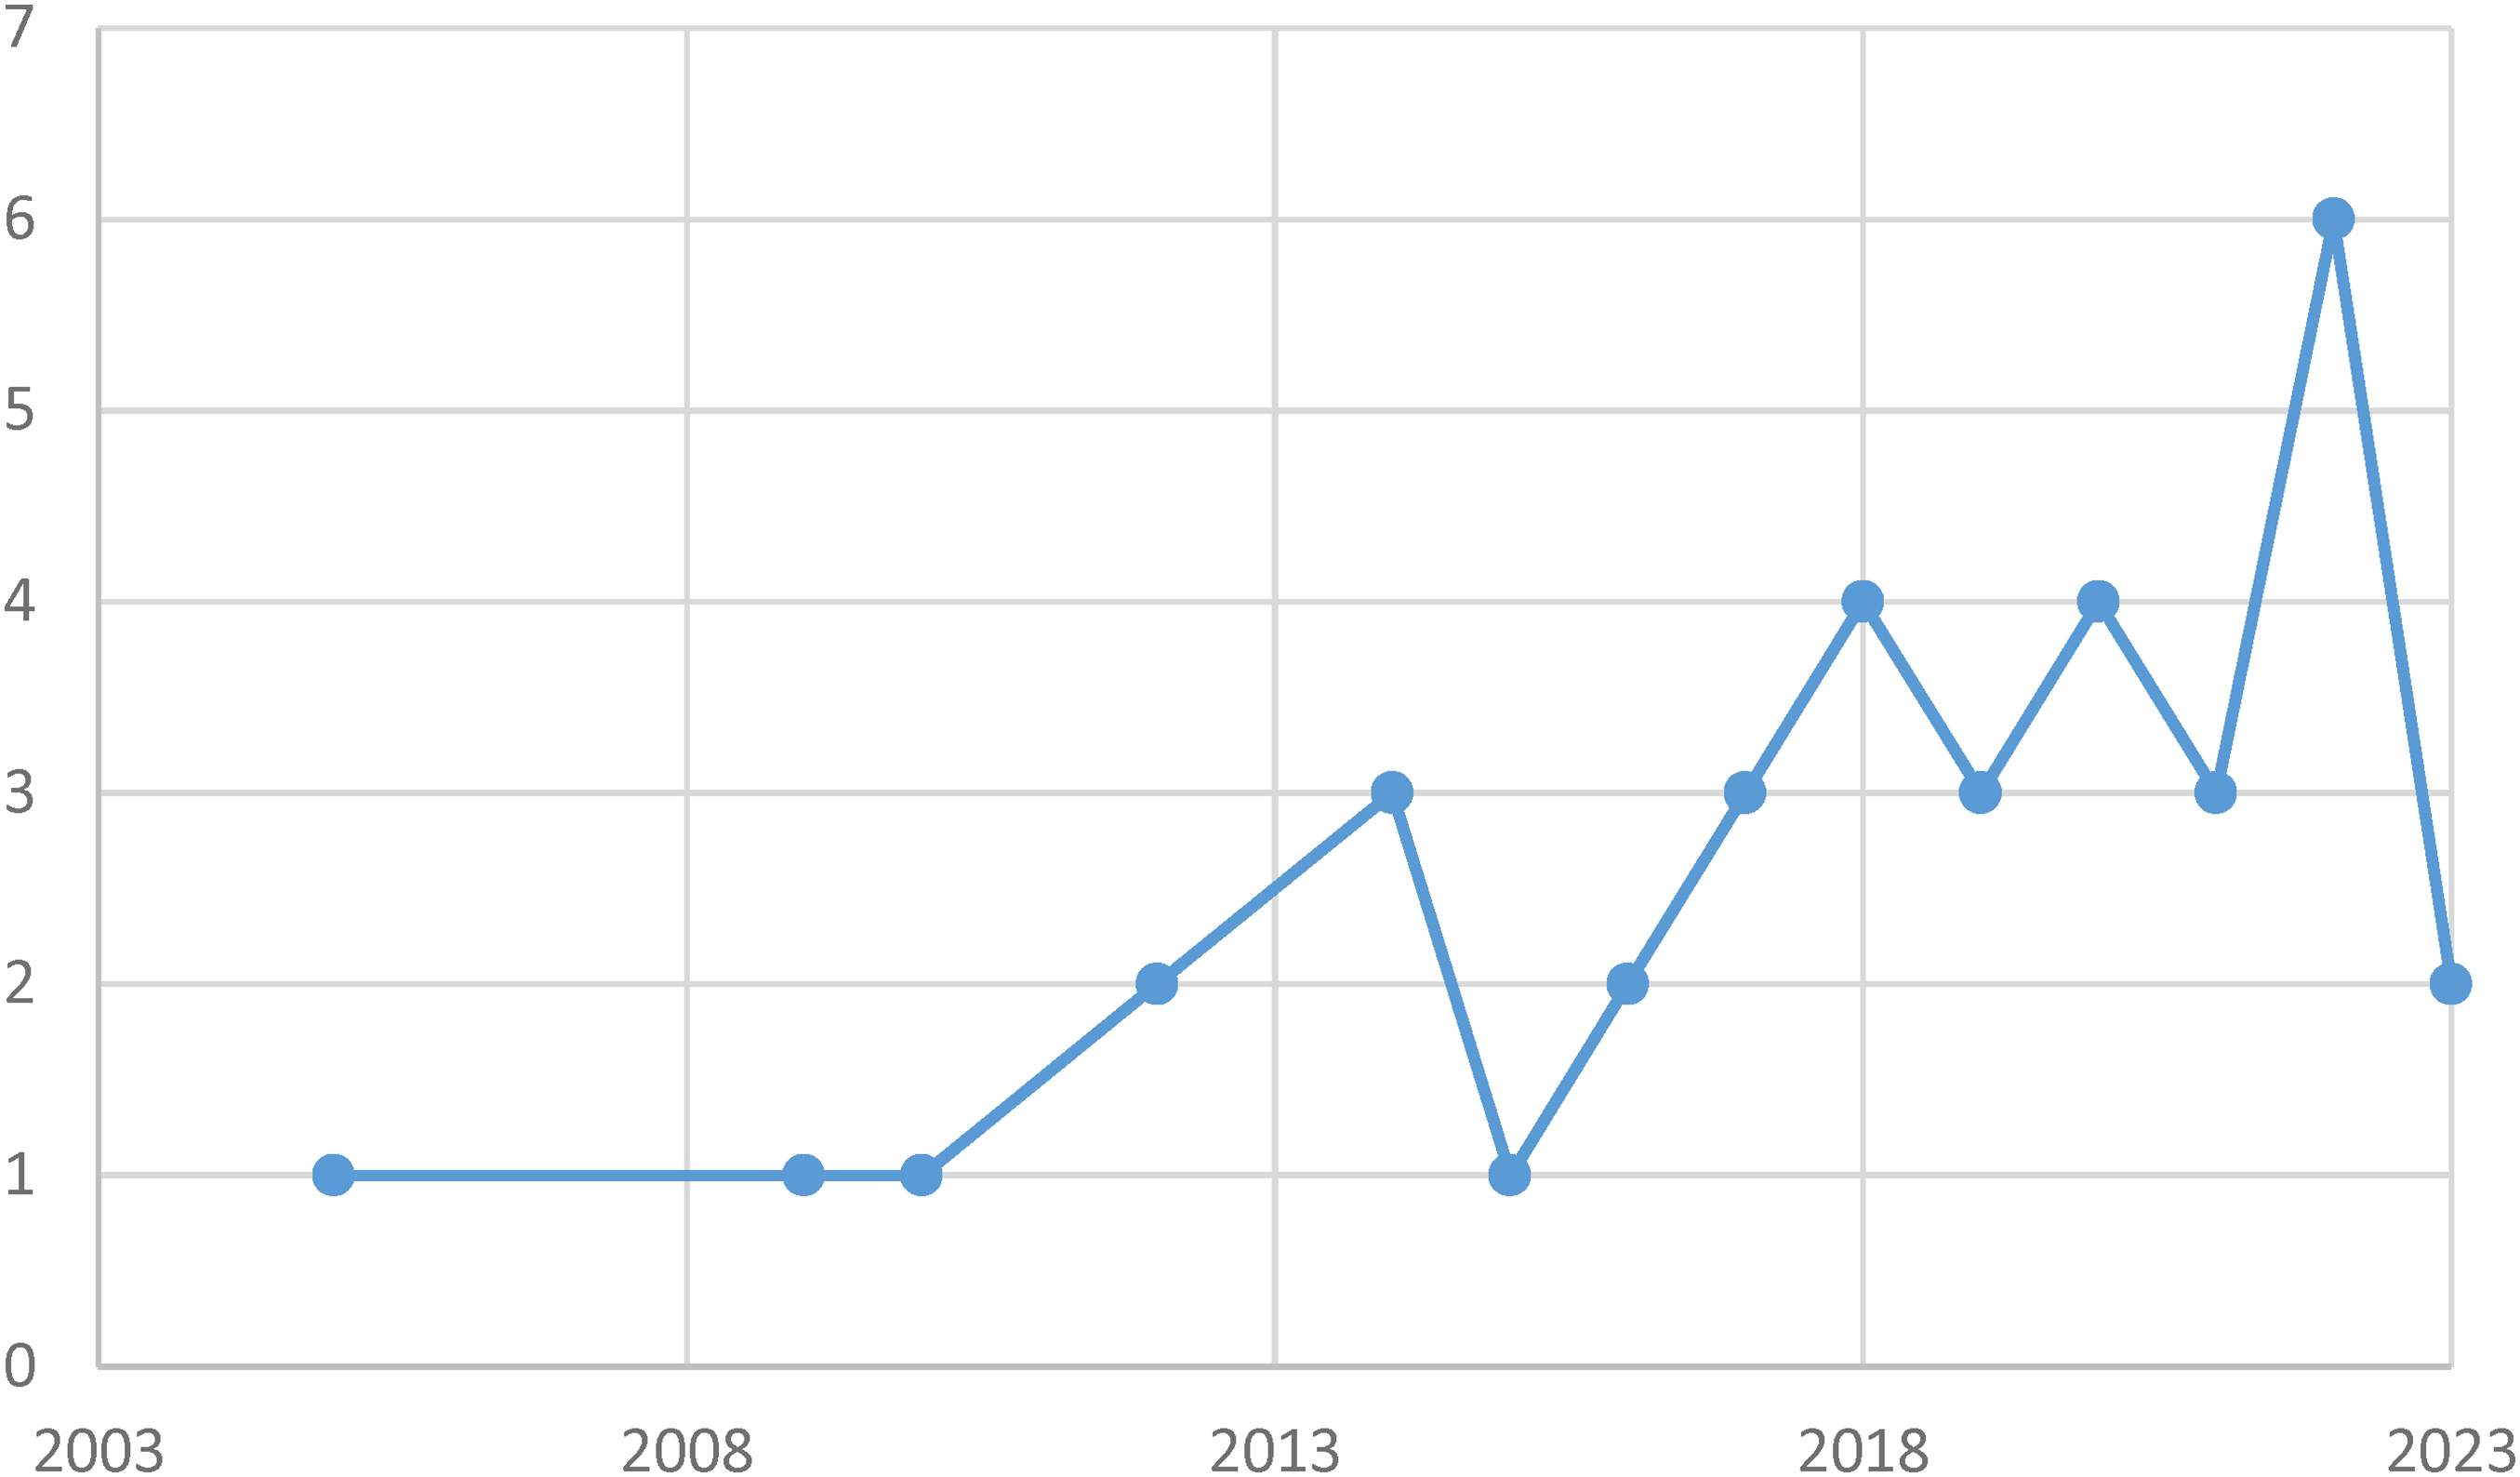
The bibliometric analysis is based on 36 journal articles, chapters, and conference proceedings from 2003 to 2023. The first study that we could identify is from 2005 (Dongmei et al., 2005). Figure 2 shows that the number of studies has increased over these 20 years. 2022 was the year with the most publications, six in total. Identifying the main reason for this increase from 2014 is certainly difficult, but it might have to do with the launch of satellites such as Landsat 8 in August 2013, SPOT 7 and WorldView-3 in 2014, and the launch of Sentinel-2a and Sentinel-2b satellites in 2015 and 2017. The launch of those missions has made a big impact on Earth observation, leading to more studies in the field. Cloud storage, especially Google Cloud and Amazon Web Services (AWS S3), have also played a big role in changing how researchers get access to satellite data such as Landsat and Sentinel imagery. With those cloud storage solutions, it is easier for researchers to store, share, and analyse large datasets, making it more convenient and collaborative.
Publications for criminal offences in the urban environment over time (N = 36), 2003–2023-August. Source: Authors.
In more than two-thirds of the studies, the first author is a man (28 out of 36), which indicates possibly a gender bias in the field. More than two-thirds of the publications were in journals and less than one-third were conference papers. The International Journal of Remote Sensing, Remote Sensing and Applied Geography are the journals that have published most research in this field through the years. As many as 45% of publications were in affiliated institutes in the USA with Japan coming second with almost 8% of total publications as seen in Figure 3. Canada, Mexico, China, and Malaysia come next with two publications for each country (by continent 22 research papers for America, 7 for Asia, 1 for Africa, 4 for Europe, and 2 for Oceania). Conference articles are from “Proceedings of SPIE—The International Society for Optical Engineering,” “International Archives of the Photogrammetry, Remote Sensing and Spatial Information Sciences—ISPRS Archives,” which represent almost 30% of publications in conferences.
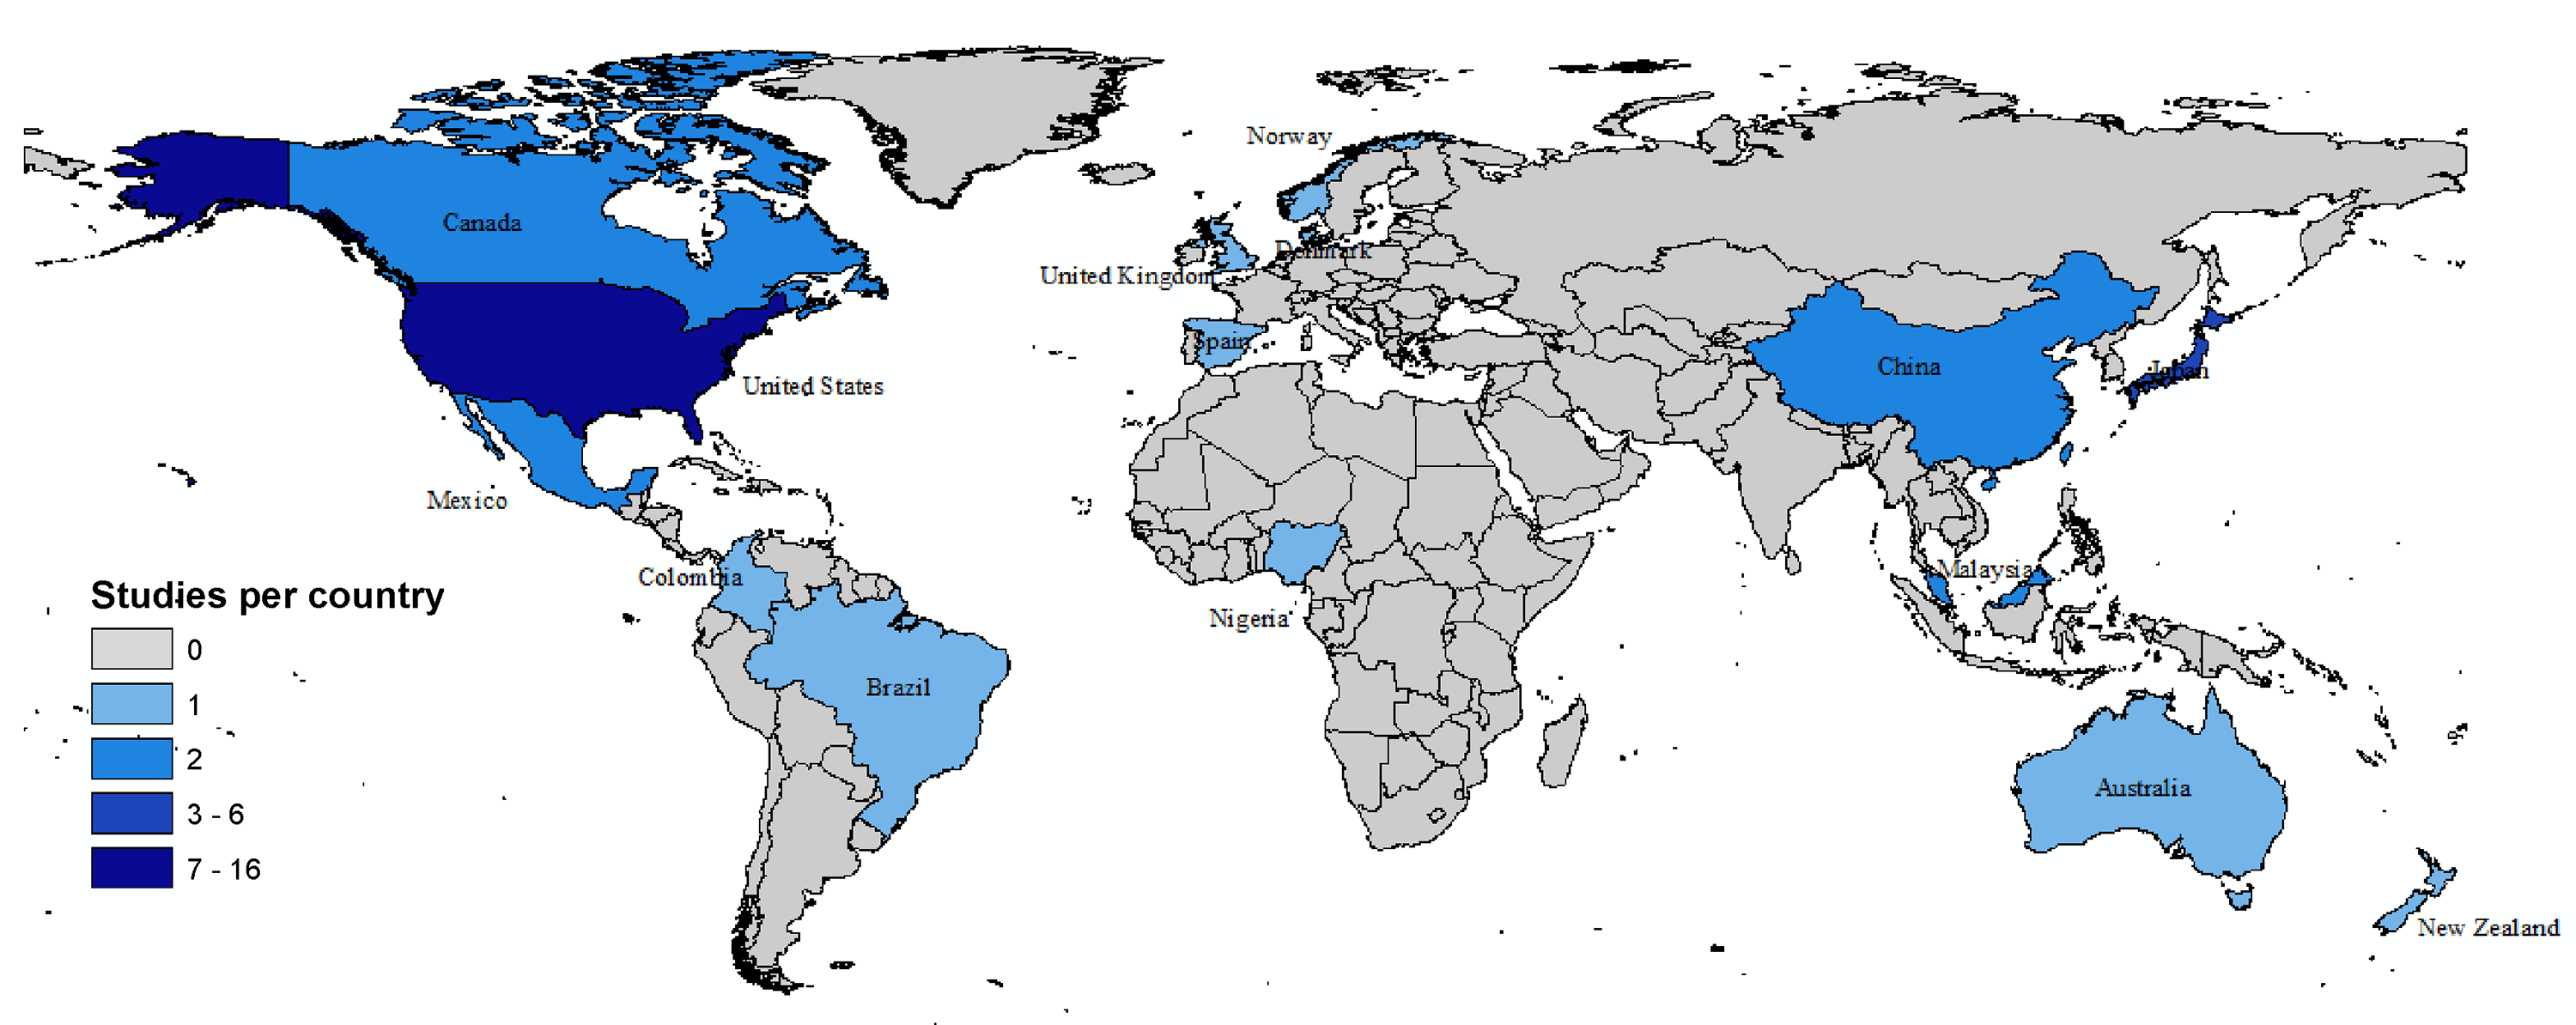
World map for countries of affiliated institutes, 2003–2023. Source: Authors.
Almost half of the publications (N = 15) were devoted to the location and patterns of total crimes (Blanca & Josep, 2022; McBee et al., 2017). The most common crime category studied is property crimes (theft, burglary), N = 17 publications (Chen et al., 2016; Dongmei et al., 2005; Liu et al., 2020; Reis et al., 2019; Woodworth et al., 2014). Violent crimes represent almost a fourth of total studied crimes (N = 10) (López-Caloca et al., 2009; Najjar et al., 2018; Patino et al., 2014; Zhou et al., 2019). In some of the above studies, multiple crime types were investigated such as violence and theft (Lin et al., 2021; Venter et al., 2022).
More than two-thirds (N = 27) of the studies used passive sensors (Curran et al., 2013; López-Caloca et al., 2009; Patino et al., 2014), while active sensors were used in only six studies (Chen et al., 2016; Posada et al., 2011; Wolfe & Mennis, 2012), and in three cases, it is a combination of both (Deng, 2015; He et al., 2018; Okawa et al., 2022). According to Zhu et al. (2018), “passive sensors utilize solar radiation to illuminate the Earth's surface and detect the reflection from the surface, while active sensors provide their own source of energy to illuminate the objects and measure the observations,” which means that if the area is covered by clouds in images of passive sensors, the city cannot be observed and the captured image is useless for analysis. Out of the 36 studies, 92% (N = 33) used aerial means such as satellites, UAVs, and manned aerial vehicles, such as helicopters and airplanes to collect remote data and the three remaining studies used both aerial and terrestrial means to collect data. More specifically, in orbital data collection the most widely used satellite sensor is Landsat in four studies, Luojia 1-01 in four studies, and Quickbird, NigeriaSat-2, SPOT, and IKONOS in two studies each. The spatial resolution varies from 10 km to 0.008 m, and the most common range is between 10 and 100 m which we have studied in 8 (22%) studies. The second most common range of resolution is from 0.008 m to 1 m, representing 17% (N = 6) of the total number of publications, and from 1 to 10 m resolution range, 7 studies (20%). Publications show that there are 15 studies, where the resolution of the images is not mentioned. We can only assume a range on the resolution from the type of sensors used. For example, the study by Najjar et al. (2018) focuses on the aspects of deep learning methodology in crime mapping to suggest a methodology that works optimally for any type of image regardless of sensors or resolution. They use Google Static Maps API, which can vary from 15 cm resolution up to 30 m. The same applies for the rest of the above-mentioned articles, where the resolution of remote sensed data is not stated.
The temporal resolution of satellite images can vary widely depending on the satellite system and its mission objectives. The temporal resolution of the satellite missions was analyzed and provided insight on the potentiality of satellite images for urban analysis. Not all publications review the temporal resolution of the used image. In 39% of the imagery used (N = 14), the temporal resolution could not be retrieved (Breetzke & Cohn, 2013; Smith et al., 2010; Woodworth et al., 2014). This is the outcome of using platforms such as Google Earth or Google Maps, which is a combination of satellite imagery from different time periods and different missions. In 22% of the studies (N = 8), the satellite missions revisited the same area approximately at monthly intervals. This interval is found mostly in the Landsat and SPOT satellite missions (Heilmann et al., 2021; Mansor et al., 2019; Yusoff et al., 2022). A 2-week interval in 14% of studies (N = 5) (McBee et al., 2017; Yang et al., 2020) and a 1-week interval in 17% of studies (N = 6) (Adepoju et al., 2014; Adewuyi et al., 2017; Arellano & Roca, 2022; Burkhardt et al., 2020; Venter et al., 2022) is found in studies after 2016. The remaining 8% of those studies (N = 3) have a daily, or per request temporal resolution (He et al., 2018; Hener, 2022; Irvine et al., 2018).
In-Depth Analysis by Research Themes
Using environmental criminological theories as background, this section discusses how remote sensing data have become a resource in research that focuses on the geography of crime in relation to the urban structure, urban change, green areas, and illumination.
Theme 1—Urban Structure, Image Texture, and Crime
The urban structure plays a significant role in influencing crime patterns within a city. Environmental criminology has shown examples of how aspects of the urban environment, such as land use, urban design, transportation systems, and their social dynamics, can impact the occurrence and distribution of criminal activities (e.g., Brantingham, 1984; Cohen & Felson, 1979; Taylor & Harrell, 1996). The texture of satellite images has long been derived through techniques of texture analysis that provide insights into crime opportunities, as they are indicative of the city's main land use and people's activities.
Figure 4 illustrates how patterns of image texture can be associated with the city structure and indirectly, with crime. Tightly spaced buildings might have more hiding spots and obstructed views that can facilitate criminal activities (Merry, 1981; Minnery & Lim, 2005) than widely spaced houses in suburban areas. Similarly, areas with well-connected streets and good visibility might have better natural surveillance, making criminal activities riskier for offenders. “Edges” and “boundaries” as defined by Brantingham and Brantingham (1995) might be identifiable in images and be associated with barriers that can block sightlines and create secluded spaces that criminals might exploit for unlawful activities, or in gated communities can disrupt criminal activities (Branic, 2012), but such relationships depend on the local contexts of places in neighborhoods and the neighborhoods in the city, respectively (Figure 4). In places where conventional statistics are lacking, such as in cities in countries of the Global South, the use of remote sensing data can become a useful resource as it can replace and/or complement traditional land use and socio-economic data (Ceccato, 1994) and therefore function as background information for crime analysis.
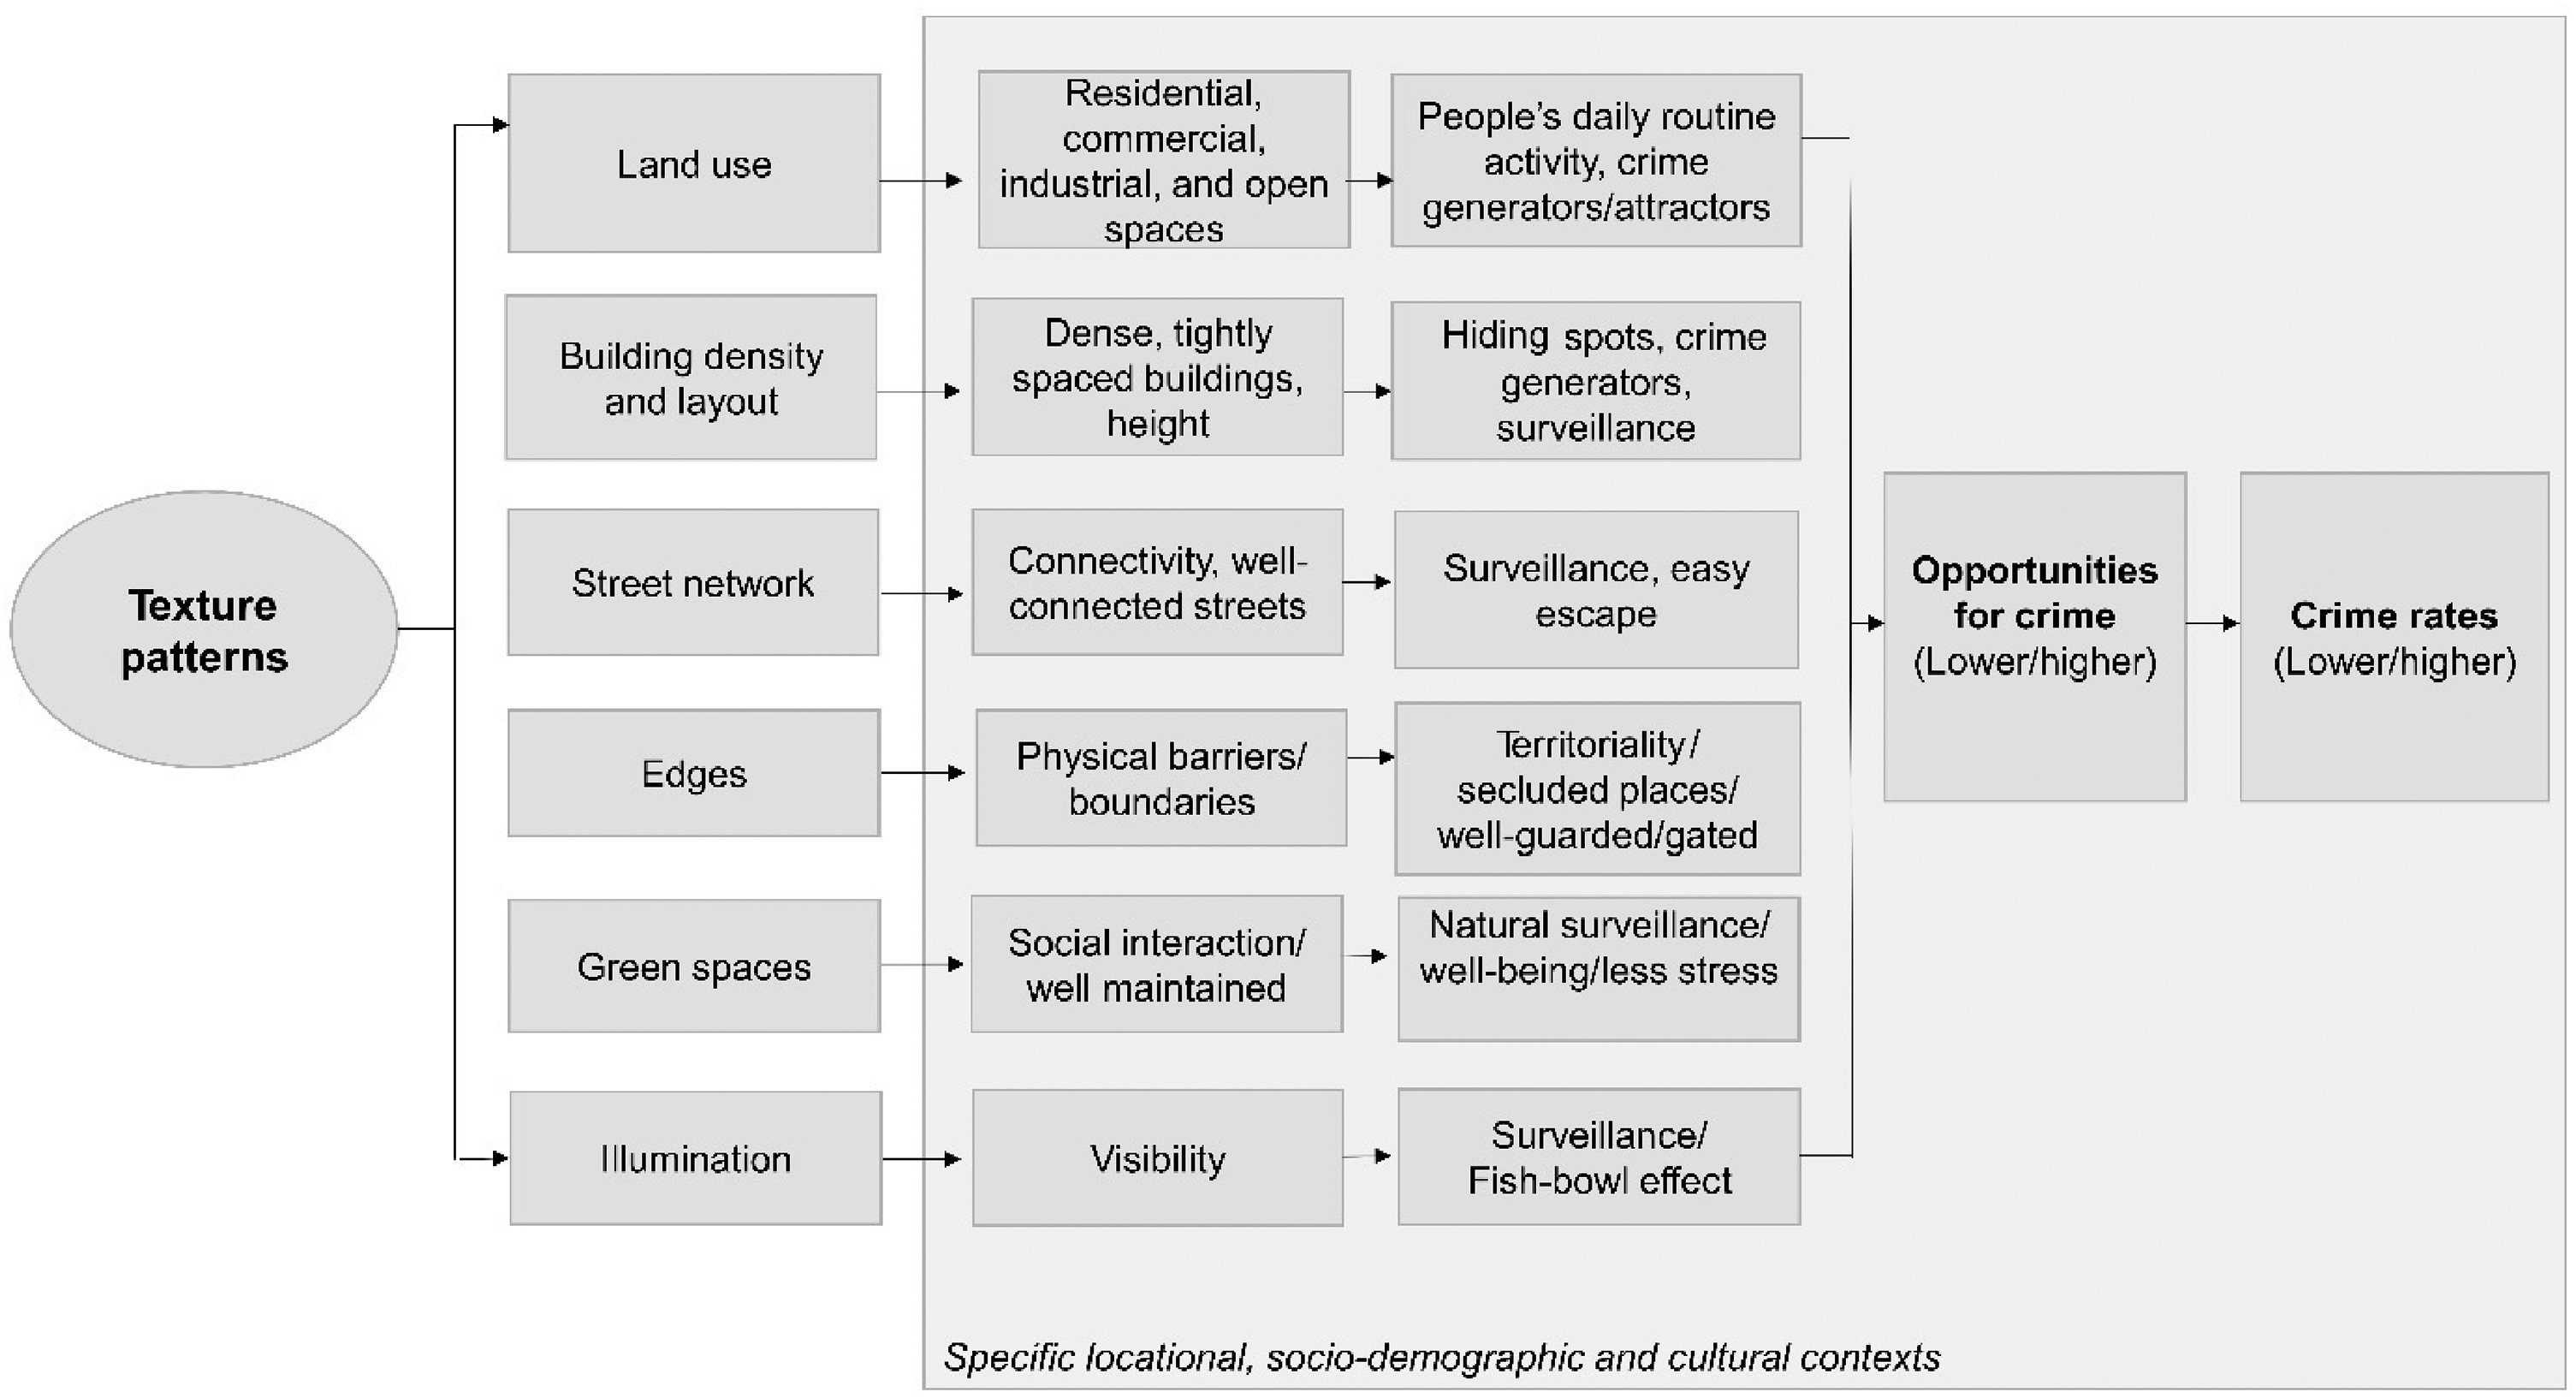
Patterns of image texture linked to urban structure, people's routine activity and crime. Source: Authors.
One of the most important studies in this area was carried out by Patino et al. (2014) in Colombia. The authors assessed the relationship between crime and the urban layout using remote sensing data to show that areas with higher homicide rates were areas that were crowded, with small dwellings with different roofing materials located in close proximity to one another. Urban layouts that were highly heterogeneous tended to have higher homicide rates. They also showed that these areas often lacked other homogeneous surfaces such as open green spaces, wide roads, or large facilities, features that were extracted from the remote sensing data. Authors confirmed that a neighborhood's design has “a quantifiable imprint” that was possible to be observed with very high spatial-resolution imagery. Although these findings are in line with principles of CPTED in the sense that more heterogeneous and disordered urban layouts were associated with higher homicide rates, the mechanisms linking urban layout and violence were not discussed in the study.
Similarly, López-Caloca et al. (2009) analyzed SPOT images to produce statistical data on such things as population, poverty levels, urbanization, and available services, and compared this with criminogenic areas for robberies in Mexico. The purpose of the analysis was to identify risk factors linked to the spatial and geographic characteristics of the places associated with crimes using fuzzy algorithms to detect green areas (trees, brushes, and grasses) and the density of construction. Crime seemed to be more often linked to vegetation patterns than the density of construction. The authors suggest that future analysis should consider the crime data segmentation by days of the week, time of the day and months of the year because they believed that would better capture the nature of urban space. Another article that explores the use of remote sensed data (satellite images) in comparison to specialized geographical data (housing data) in this category is by Woodworth et al. (2014). The article is methodological and more focused on a density estimation algorithm and evaluates the processes and results. One of the main findings was that the use of satellite imagery can replace traditional geographical data.
Theme 2—Urban Change and Crime
As pointed out in section three, social disorganization theory postulates that rapid changes can impact community cohesion, informal social control, leading to an increase in crime rates. With urban change, the breakdown of social bonds can result in reduced informal social control, making it easier for crime to flourish. Although remote sensing data cannot detect crime itself, it can be used to identify areas of new construction, monitor changes in land use that in the long run might affect these criminogenic conditions. By comparing images taken over time, researchers can quantify the rate and direction of urban growth, identifying potential factors contributing to increased or decreased crime rates in expanding or decreasing residential areas (Algahtany & Kumar, 2016; Mansor et al., 2019). The importance of remote sensing in this thematic category is associated with the availability of data to capture changes in different time periods as mentioned in the article by Algahtany and Kumar (2016), where a 10-year time period was investigated. They employed a subset of images to establish urbanization boundaries for 2003 and 2013 using Maximum Likelihood Classification, comparing pixel-by-pixel values on the spectral bands of the image. Not surprisingly, an increase in the size of an urban area is associated with an increase in the crime rate.
Another significant aspect of the use of remote sensed data in urban change is that the same methodology for the extraction of data can be used for different time periods, making it possible even for people with minimum knowledge of remote sensing data extraction techniques to use these models and acquire geographical data (Newton & Felson, 2015). Algahtany and Kumar (2016) found the more an urban area expands and the more population is moving to that area, the more criminogenic it becomes. Large cities with significant urban expansion have a higher correlation to crime rates in comparison to smaller cities with more moderate urban expansion levels. Mansor et al. (2019) investigated for a time period of 13 years the changes in the urban environment with the use of satellite imagery data and found a strong relationship between urban expansion and crimes in areas with significant urban growth. Understanding the dynamics of these areas using remote sensing data can shed light on the evolution of crime patterns and help planners and safety experts monitor safety conditions over time.
Theme 3—Vegetation and Crime
Research shows that vegetation in different shapes (parks, forests, trees) influences various aspects of the urban environment that impact both directly and indirectly crime opportunities (Ceccato et al., 2020). As mentioned earlier in the text, the first study that we identified on this topic (Dongmei et al., 2005) points out that creating a nonvegetation index from a satellite image supported the prediction of the location of burglaries. Some aspects of the urban environment can be extracted and analyzed using remote sensing data, in this case using measures of vegetation such as density of green areas, tree cover, etc. One commonly used measurement is the NDVI, which stands for Normalized Difference Vegetation Index (see ‘basic definitions’), and is calculated from satellite or aerial imagery capturing both visible and near-infrared light reflected from the Earth's surface (Robinson et al., 2017). The international literature shows that the NDVI can be associated with urban patterns of crime indirectly through its relationship with environmental aesthetics, urban design, socio-economic factors, stress reduction, and natural surveillance (Figure 5). The specific mechanisms between greenery and safety may vary based on the context of the urban area being studied. For instance, higher NDVI values can be associated with better urban planning and design that prioritize public places, parks, and recreational areas, which can promote social interaction, physical activity, community engagement, and consequently, reduce opportunities for crime. Aesthetically pleasing environments are thought to have a positive psychological impact, potentially reducing stress and aggression (Iqbal & Ceccato, 2016). The literature is also unanimous about the need of exploring the multitemporal dimension of remote sensing data to assess the impact of vegetation on crime, not only seasonal changes but also over the years/decades, in the urban fringe in particular, where more changes in land use are more likely to occur (e.g., Mesev, 2003), see Theme 2.
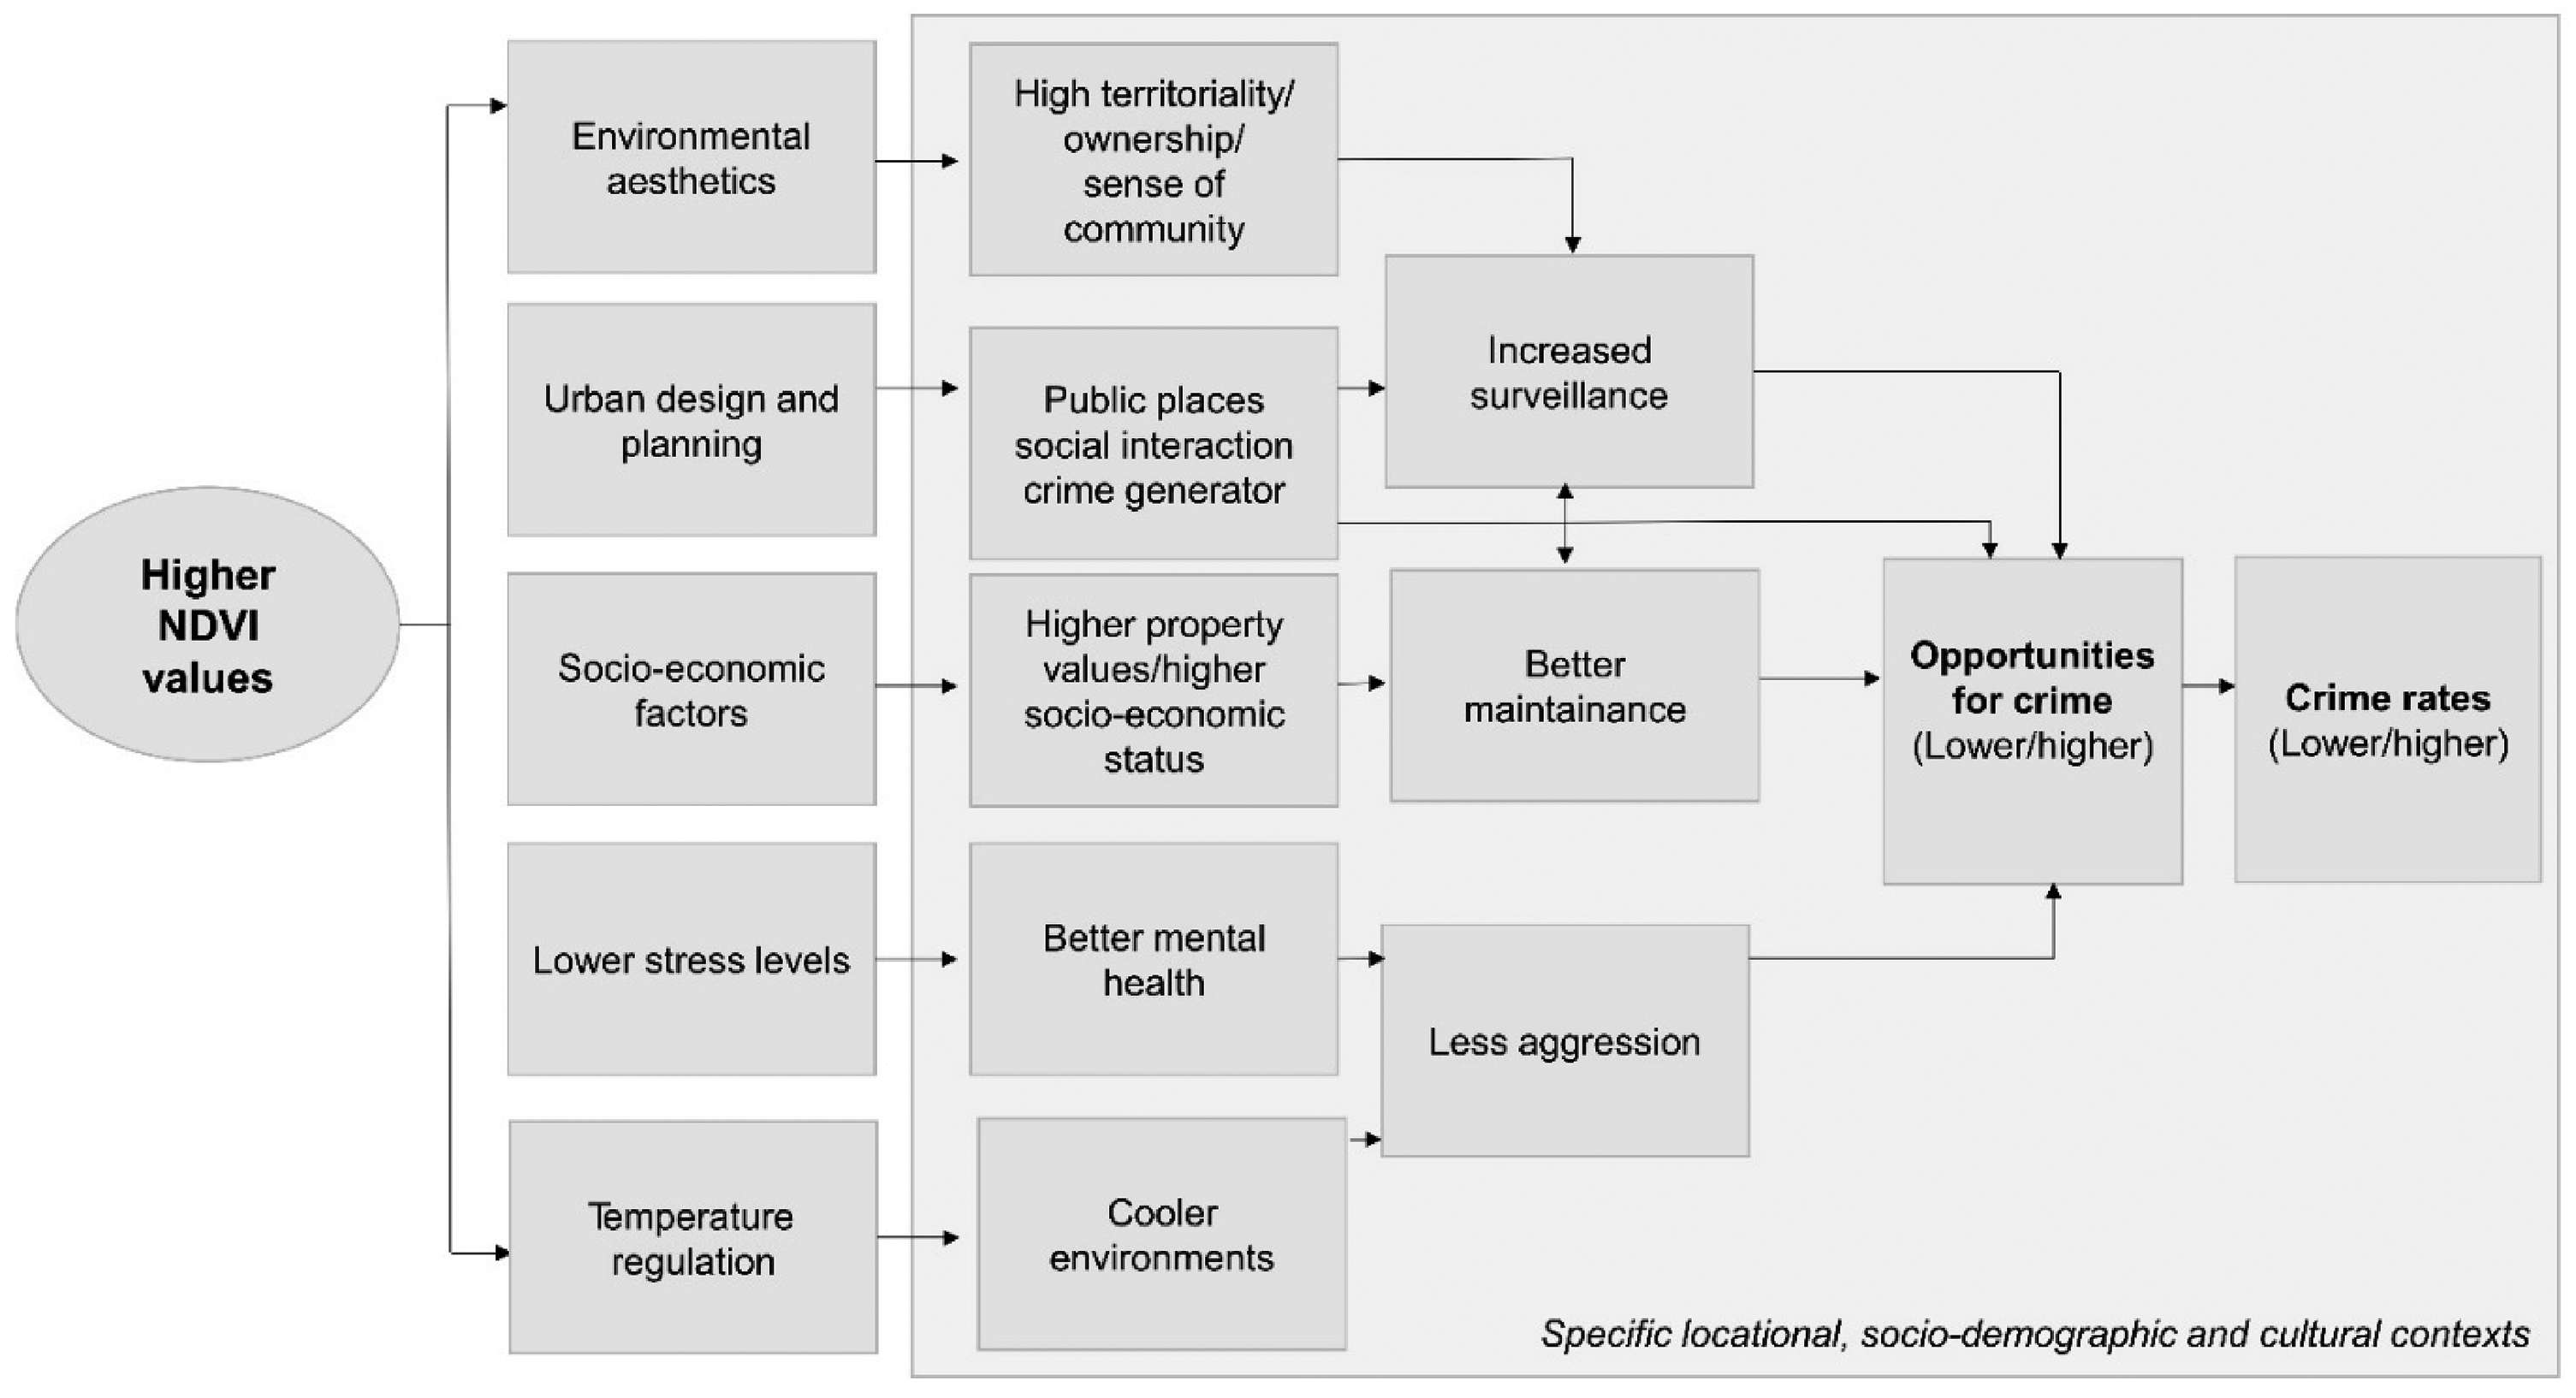
Normalized Difference Vegetation Index (NDVI) values extracted from remote sensing data to indicate potential mechanisms between vegetation, social interactions, and crime. Source: Authors.
Kuo and Sullivan (2001) suggested that the presence of vegetation, particularly in public places, can deter crime by encouraging greater use of public space, improving the quality of the public environment, and consequently, increasing natural surveillance. Similar results were found by Chen et al. (2016) for property crimes, while Wolfe and Mennis (2012) evidence was for assaults, robbery, and burglary, but not for theft. Overall, the use of NDVI to extract information about vegetation has been criticized because it fails to identify the number of specific types of vegetation or whether green areas are well maintained, which can affect the potential link between vegetation and crime and perceived safety (see e.g., Wolfe and Mennis (2012)). While these criticisms are substantial, current research still justifies the effect of green spaces measured by NDVI in crime reduction interventions (Bhatia & Jason, 2023; Ogletree et al., 2022). An alternative proposed by Chen et al. (2016) is to use LiDAR data for the extraction of the percentage of tree coverage. By using LiDAR data, the height of the trees can be obtained, which can also be investigated in detail and be a more precise measurement of the impact of trees on people's use of the streets, of green areas and the consequences on their potential effect on crime opportunities. In another study using LiDAR data (Lin et al., 2021), tree canopy cover, streetscape greenery, and species diversity were calculated and associated with various crime rates. More specifically, small-sized trees were associated with increased crime rates, while tree canopy cover and streetscape greenery showed a reduction in more severe crimes such as violent crimes after controlling for other criminogenic factors. In the most recent study about vegetation and street crimes (Lee et al., 2023), authors used three different validation methods for the identification of tree characteristics: aerial images from the National Agriculture Imagery Program, GSV and a street tree inventory dataset created through field measurements. According to their results, areas with more tree cover tend to have lower street crime. Their conclusion is that the combination of these three methods of measurement and validation provided more accurate results on the relationship between vegetation and crime opportunities.
Theme 4—Nightlights, edges and crime
Well-lit areas, illuminated by streetlights and buildings, can deter criminal activities due to increased natural surveillance, but the evidence is far from conclusive (Welsh & Farrington, 2008). Nightlight data are difficult to obtain from traditional methods, and if they are available, they may not allow a temporal analysis, given the data limitations. Remote sensed data make it easier to acquire such illumination data and for different periods of time (see for instance, Luojia 1-01 Nighttime Light Dataset, USGS EarthExplorer, Copernicus Open Access Hub and Sentinel Hub). Liu et al. (2020) suggest that nightlight satellite data is suitable for measuring “edges” in the urban environment (as defined by Brantingham & Brantingham, 2017), as they can be associated with social and physical environments and consequently, with crime opportunities. Liu et al. (2020) investigated whether and how the composite edge effect measured with nightlight imagery has an impact on street robbery and burglary at the block group level. The selection of these two different types of crime was meant to show potential differences in the role that nightlight data might play in crimes that occur indoors and outdoors. In outdoor crimes, we have more sources of illumination such as street lights, traffic flow, etc that can be measured from satellite sensors while indoor illumination has a smaller contribution in nightlight satellite data. Liu et al. (2020) found that nightlight gradients (which is the maximum change of nightlight from a pixel to its neighbors), make a statistically significant and positive impact on the street robbery rate, but not on the burglary rate, which is a crime more associated with indoor illumination conditions.
The article by Zhou et al. (2019) also supports the use of composite edges from nightlight satellite data, reminding us that different crimes are affected by different in situ characteristics, including nightlight. The author also make reference to other studies using nightlight data to indicate population density indicate population density, house vacancy, electricity consumption, and light pollution.
Discussion
The findings discussed in the previous section help us respond to this study's research questions. One thing is sure, and that is that remote sensing data offers a relatively inexpensive way to capture frequently updated information about the urban environment. Of the 36 articles, most of them were carried out in universities in the United States. Crimes of theft dominate the studies investigated, in 17 out of 36 articles. Optical sensors are used mostly to capture information about the city. A few articles have focused on the use of data from radar sensors, which provided a higher level of detail in specific object classifications, such as tree canopies and illumination. The first research articles were published in 2000s (e.g. Dongmei et al., 2005), with a steady increase in the number of publications up to 2023 with an average of 1.8 articles per year.
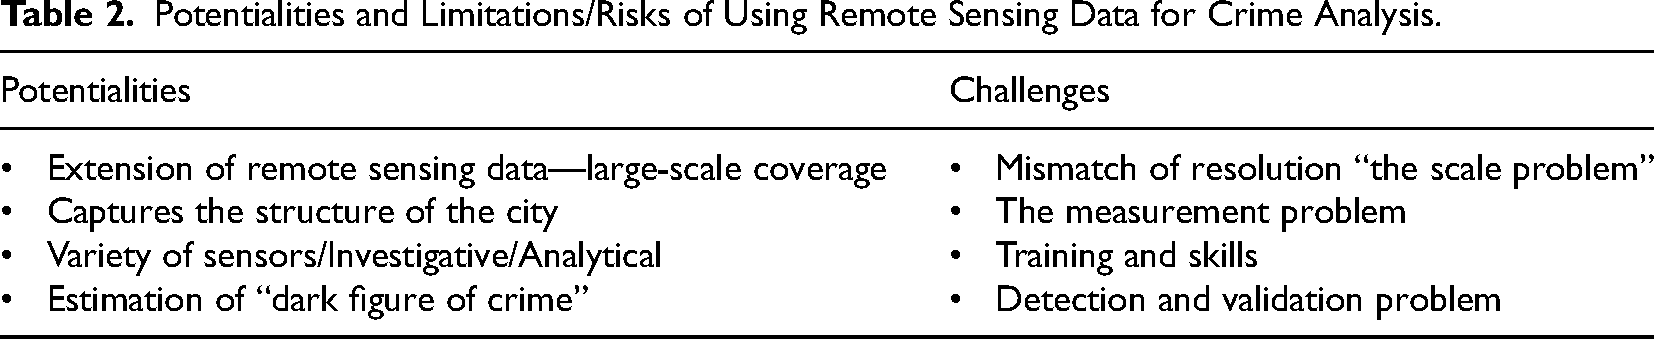
In this review, the use of remote sensing data in crime analysis was split into four themes. The first theme shows that texture of satellite images yields insights into opportunities for criminal activity as they reflect the primary land use of the city. The second theme illustrates how urban change has traditionally been detected using remote sensing data and how now it can also be linked to crime. In the third theme, studies show the association between remotely sensed vegetation data and crime, sometimes increasing crime and sometimes reducing it. Finally, in the fourth theme, we report that new data sources such as nightlight satellite data provide an extra source of information that can be associated with crimes and other variables in the urban environment that are not possible to be acquired from other sources. Although any comparison of these studies should be made with caution since they employed different methodologies and sensors, there are common potentialities and challenges these studies all share. Table 2 attempts to summarize the potentialities and limitations/risks of using remote sensing data for crime analysis.
Potentialities and Limitations/Risks of Using Remote Sensing Data for Crime Analysis.
Potentialities
Extension of Remote Sensing Data—One of the advantages of remote sensing data is having multiple sources of data available globally, enabling the monitoring of extensive geographical areas, which provides a broader perspective. The current availability of remote sensing data from various sources and sensors freely has made researchers able to access not only data with high spatial resolution but also temporal resolution. For resource-poor urban environments, where conventional data may not be available, free-of-charge remote sensing data can facilitate the study of the underlying crime conditions.
The Nature of Structure of the City—Variables extracted by remote sensing methods provided a good way of quantifying different aspects of the physical environment. Patino et al. (2014) motivate the usefulness of remote sensing as a complementary information source for socioeconomic studies in urban settings. They suggest that such variables can be complementary to current models, “by quantifying information on the urban composition and the spatial pattern of the urban layout.” Instead of using time-consuming, labor-intensive, costly fieldwork inspections, remote sensing can be a feasible alternative for extracting information about urban environments. This can be done by capturing urban change, texture analysis, and the vegetation index, to name just a few.
Variety of Sensors—Different sensors can capture data at various wavelengths and resolutions, allowing for a more comprehensive view of urban areas. This enhances data quality and provides a more accurate representation of the environment. For instance, nightlight satellite data provide us with an extra source of information that can be associated with crimes and other factors that cannot be acquired from other sources. This also means that remote sensing data can be used not only to understand underlying factors of crime in neighborhoods (analytical base) but also to detect and investigate crimes as they happen (pollution, destruction of protected areas at urban fringes as an investigative base). Furthermore, the combination of different sensors can provide an exchange of supplementary information between the sensors. This might be a way of solving the limitations we have identified in each type of sensor.
Estimation of Dark Figure of Crime—Crime mapping using remote sensing technologies is becoming common with increasing ease of image access and analysis (Kelly & Kelly, 2014). However, if remote sensing continues to be used in the active detection of crime, methods of validation of remotely sensed crime data against various types of “ground truths” must be rigorously developed. This constitutes also a challenge.
Challenges
There are a number of challenges to the use of remote sensing data in urban crime analysis. They include data availability, a mismatch between sensor limitations and research goals, the need for specialized skills in image processing and analysis to carry the analysis as well as also considering the potential hazards of using remote sensing data to identify potential crimes and criminals with regard to infringement of people's privacy, and surveillance. The literature also refers to the lack of validation methods when the goal is to detect the location of a crime. Below we discuss these risks in using remote sensing data in criminology and the potential challenges ahead:
The Scale Problem—Despite the improvement of the temporal and spatial resolution of the current sensors, the spatial resolution may still not be adequate for particular urban features that are relevant for the study of urban crime (Ceccato et al., 2023; Kinney et al., 2008; Wilhelmsson et al., 2021). The studies discussed here show that the spatial resolution varies from 10 km to 0.008 m. Another issue is that because of the low spatial resolution of certain sensors (see Zhou et al. (2019), the information extracted from remote sensing does not match data at the level of census block groups, making an integrated analysis difficult.
The Measurement Problem—We rely on the current algorithms and expert knowledge to extract information from remote sensing data. Some have a quite simple scalar measurement that can affect the relationship of a measure with crime. For example in the research by Wolfe and Mennis (2012), they explain about the usability of the vegetation index (NDVI) and the limitations it has.
Training and Skills—Criminologists need training in geographical tools to be able to use remote sensing data, such as Geographical Information Systems and similar tools. An alternative is working with interdisciplinary research teams in which geoinformatics specialists can collaborate with criminologists and data privacy experts. Some of the challenges lie far beyond the technical sphere. As previously suggested, remotely sensed images are collected remotely by definition, so it is common that there is a lack of detailed or nuanced definitions of crime drawn from the context of the landscapes they seek to analyze. Thus, knowledge about the local context is crucial for validating the information coming from remote sensing data and for precision.
The Validation Problem—For remote sensing scholars, validation is a critical part of any remote sensing analysis, but as suggested by Kelly and Kelly (2014), the lack of validation in studies about the use of remote sensing to detect crime is problematic, because the police can act where crimes are detected, which can lead to major impacts if the detection is not precise. By the time their article was published, the authors were surprised to find a lack of rigorous validation of the remote sensing methods. Still, the literature is poor in this area. In their review, they indicate that validation was not mentioned in many studies, while in others, validation was severely hampered by security issues, rough terrain, and weather conditions.
Conclusions
This article reviewed and synthesized a growing body of literature to investigate the utility of remote sensing in detecting and analyzing criminogenic conditions in urban environments. The systematic review of the English-language literature focusing on the use of satellite imagery products, from 2003 to the first half of 2023, uses two major databases, Scopus and Science Direct. It should be recognized that the literature is quite definitive about the complexity of urban areas and how their nature affects crime. By comparing images taken over time, researchers can make multitemporal, sometimes multispectral analysis that supports the understanding of features in the urban environment that become places of crime.
Understanding the interplay between image texture, environmental factors, and crime is important for urban planning and crime prevention and can be implemented in current practices. Utilizing image texture and environmental data can enhance predictive policing models. Law enforcement agencies can deploy resources more effectively by focusing on areas identified as high-risk based on the analysis of remote sensing data, which in turn can contribute to the real-time monitoring of the safety of urban spaces. Analysing crime hotspots in particular, guided by data-driven interventions can lead to more effective strategies for crime prevention and community development and also improve preparedness for other types of problems such as natural disasters or other emergencies, as the international literature shows.
While the indicators based on information from satellite images provide valuable insights about the city environment, these indicators are far from being the only ones contributing to crime opportunities. Crime is a complex phenomenon influenced by various social, environmental, and other factors. Integrating data coming from remote sensing data with other data sources is essential when it comes to obtaining a comprehensive understanding of the relationship between image texture and crime opportunities in a specific urban context. This paper provides evidence about the usefulness of remote sensing for crime analysis. Where conventional data may not be available, free-of-charge remote sensing data can facilitate the study of the underlying crime conditions. Future research should focus on the development and assessment of new tools and techniques of image feature extraction in urban analysis. It is yet to be observed how new forms of remote data collection are considering ethical and privacy issues of the individuals/population involved.
There are also concerns about the lack of validation methods when remote sensing data is used to detect potential illegal activities, for instance, environmental crimes. Addressing the lack of validation methods for remote sensing data in detecting illegal activities involves adopting robust approaches and strategies. For example, conduct on-the-ground verification to validate remote sensing findings, which involves physically inspecting locations identified as potential hotspots or areas with illegal activities to confirm the accuracy of the remote sensing data. Kelly and Kelly (2014, p. 11,115) also suggests employing “second-order” validation techniques that can provide crucial context and comprehension to remotely sensed images within a law enforcement context. In practice, this means to integrate remote sensing data with information from various sources, such as law enforcement reports, crime databases, or community observations, thus, cross-referencing data from multiple sources enhances the credibility and accuracy of the findings. In order to do that, the implementation of machine learning algorithms for validation can also be considered. Finally, it is also necessary to involve local communities in the validation process and encourage community members to report and validate the presence or absence of illegal activities in areas identified by remote sensing data. Since most criminologists are not naturally trained to work with remote sensing data, interdisciplinary research teams are therefore essential when it comes to supporting criminology in advancing knowledge, considering ethical and privacy issues. The integration of remote sensing data with other sources, coupled with advancements in machine learning, has opened up new possibilities for crime analysis. Machine learning algorithms can be used to historical crime data along with remote sensing information to predict areas with higher probabilities of criminal activities. Object detection algorithms can be applied to satellites to detect anomalies in urban areas, contributing to situational awareness. The expectation is for rapid development in this field. In this context, it is crucial to share past and current experiences in utilizing remote sensing data in environmental criminology as demonstrated in this paper.
Footnotes
Declaration of Conflicting Interests
The authors declared no potential conflicts of interest with respect to the research, authorship, and/or publication of this article.
Funding
The authors disclosed receipt of the following financial support for the research, authorship, and/or publication of this article: This work was supported by the Svenska Forskningsrådet Formas (grant number 2020-01999).