
Abstract
This study contributes to crime drop research on the security hypothesis. Using data from the Crime Survey for England and Wales, it finds that the decline in attempted vehicle-related theft and domestic burglary was delayed by 2–4 years. Between 1993 and 1997, completed domestic burglary fell 21% but attempts by only 2.1%, while between 1993 and 1995 theft of cars fell 8% but attempts increased 3%. The delay is interpreted as consistent with rational choice theory and with some offenders continuing to try, but failing, to complete these crimes when faced with improved security. The subsequent decline in attempts is consistent with offenders, particularly new cohorts of adolescents, having been discouraged.
Keywords
Introduction
“If at first you don’t succeed, give up” was Homer Simpson’s insightful take on humanity’s frequent failure to persevere. When it comes to teenage novices committing crime—particularly car crimes and burglary—it may denote a largely unrecognized fact. The primary conjecture of the present study is that when such offenders are faced with significant security improvements, some may try, try, try again, but then they give up. This study looks at the patterns of attempted property crime when the volume of completed crime fell dramatically in the 1990s in England and Wales. It finds that the fall in attempts was delayed by 2–4 years relative to completed crimes and suggests that this is consistent with rational choice theory and what would be expected as the result of improved security.
The theoretical context for the study is the security hypothesis which posits that crime fell in the 1990s due to the spread of more and better security. It is framed within the crime opportunity theories of rational choice and routine activities. Simply put, offenders choose to commit less crime when it becomes more difficult to do so. Thus, the security hypothesis is consistent with prior crime increases because both are products of changing crime opportunities (Farrell, 2013).
Security hypothesis research to date has focused mainly on the high-volume property crimes. The decline in theft of vehicles has been linked to vehicle security improvements in Australia, England and Wales, the Netherlands, and the United States (Brown, 2004; Brown & Thomas, 2003; Farrell, Tseloni, Mailley, & Tilley, 2011; Farrell, Tseloni, & Tilley, 2011; Fujita & Maxfield, 2012; Kriven & Zeirsch, 2007; van Ours & Vollaard, 2013), with electronic immobilizers also found effective in Germany (Bassman, 2011; Brown, 2013).
Improvements in household security have been linked to the decline in household burglary generally in many countries (van Dijk, 2008; van Dijk, Manchin, van Kesteren, Nevala, & Hideg, 2007) and by a series of more detailed studies of England and Wales (Tilley, Farrell, & Clarke, 2015; Tilley, Farrell, Tseloni, & Evans, 2015; Tilley, Tseloni, & Farrell, 2011; Tseloni & Thompson, 2015; Tseloni, Thompson, Grove, Tilley, & Farrell, 2014). In Australia, where property crime fell from 2001 (Mayhew, 2012), a recent study based on interviews with offenders asked their views on why crime had declined. The most popular response from offenders was to attribute the crime drop to improvements in security (Brown, 2015).
Young offenders are known to commit property crimes as their primary early-career debut crimes from which they learn and from which a small cohort graduate to commit more diverse crimes (Owen & Cooper, 2013; Svensson, 2002). It has been suggested that the disproportionate decline in adolescent crime that underpinned the crime drop in the United States is consistent with inexperienced young offenders being more easily deterred by improved security (Farrell, Laycock, & Tilley, 2015). This is consistent with Clarke and Cornish’s (1985) formulation of rational choice theory, wherein offender initial decisions to become involved in crime are distinct from those relating to continuance.
Security hypothesis research to date has largely utilized an analytic approach comprising triangulation of data signatures (Farrell, Tilley, & Tseloni, In press). Data signatures are empirical indicators that may prove consistent or inconsistent with theory. The use of signatures per se is not new but their application in the context of situational crime prevention has been spurred by Eck and Madensen (2009), who concluded that “The analysis of crime signature change, as part of crime prevention evaluations, can improve the internal validity of evaluation findings” (p. 59). While a scientific hypotheses can never be said to be formally proven, evidence that fails to falsify a hypothesis and is consistent with what theory would suggest lends support to its credibility (see Tilley, In press). This is the case for replication studies and for work that adds additional signatures to the evidence base, of which the present study is the latter type and the first to distinguish patterns of attempted from completed crimes in the context of the security hypothesis.
Tables 1 and 2 summarize security hypothesis data signatures identified to date in the works of Farrell, Tseloni, Mailley, and Tilley (2011); Farrell, Tseloni, and Tilley (2011); Farrell, Tilley, and Tseloni (2014); Farrell, Laycock, and Tilley (2015); Tilley, Tseloni, and Farrell (2011); Tilley, Farrell, and Clarke (2015); Tilley, Farrell, Tseloni, and Evans (2015); Tseloni, Thompson, Grove, Tilley, and Farrell (2014); and Tseloni and Thompson (2015).
Data Signatures Consistent With Security Having Reduced Vehicle-Related Theft.
Data Signatures Consistent With Security Having Reduced Domestic Burglary.
Security hypothesis research to date has concentrated mainly on car crime and household burglary. However, it has outlined how security and other situational crime prevention measures are likely to have been critical to reductions in other crime types. Shoplifting, for example, is a high-volume property crime that also features prominently in the debut crimes of young offenders (Owen & Cooper, 2013). Tilley (2010) identifies 31 situational crime prevention tactics from meet-and-greet policies to radio-frequency identification tagging and locked cabinets, improved sightlines and management policies, which present a prima facie case for such measures having played a key role in reducing shoplifting (see also Ross, 2013; Farrell, Tilley, & Tseloni, 2014). The security hypothesis identifies two routes by which violence has declined. The first is the direct effect of security measures of different types. Robbery of businesses such as banks is the clearest example where improved security is likely to have had a strong direct impact. The second is that violence fell as an indirect diffusion of the benefits of reduced property crime. This includes the argument, dubbed, the debut crime hypothesis, that if teenage potential offenders are prevented from committing the “easy” property crimes, then they do not progress to violence (Farrell et al., 2014, 2015; Farrell, Tseloni, Mailley, et al., 2011).
Data and Method
The study uses all available sweeps of the Crime Survey for England and Wales (CSEW, formerly the British Crime Survey). For the 1980s, the CSEW measured crimes occurring in the years 1981, 1983, and 1987. For the 1990s, it measured crime for every other year: 1991, 1993, 1995, 1997, and 1999. It became a continual survey from 2001 and from 2001 switched from calendar to fiscal years. For simplicity and consistency, only calendar years are referred to here, with the majority part of the fiscal year used (e.g., 2004 refers to 2004/2005).
The CSEW only asks respondents about attempted crimes for two types of property crime: domestic burglary and vehicle-related thefts. Serendipitously this focus fits with security hypothesis research to date outlined above. Domestic burglary in the CSEW is subdivided into domestic burglary at a dwelling and domestic burglary at a nonconnected building to a dwelling. The latter refers mainly to burglaries of sheds and garages that are not connected to the household by an adjoining door (which means burglary in a dwelling includes garages, sheds and similar with an adjoining door). Vehicle-related theft is discussed further below.
Some further conventions are adopted here for brevity and clarity. The “domestic” in domestic burglary tends to be dropped as redundant. Burglary in a nonconnected building to a dwelling is sometimes referred to as burglary in nonconnected buildings. Burglary with entry, either dwelling or a nonconnected building, is sometimes referred to as completed burglary to distinguish it more clearly from attempts.
Findings
Burglary
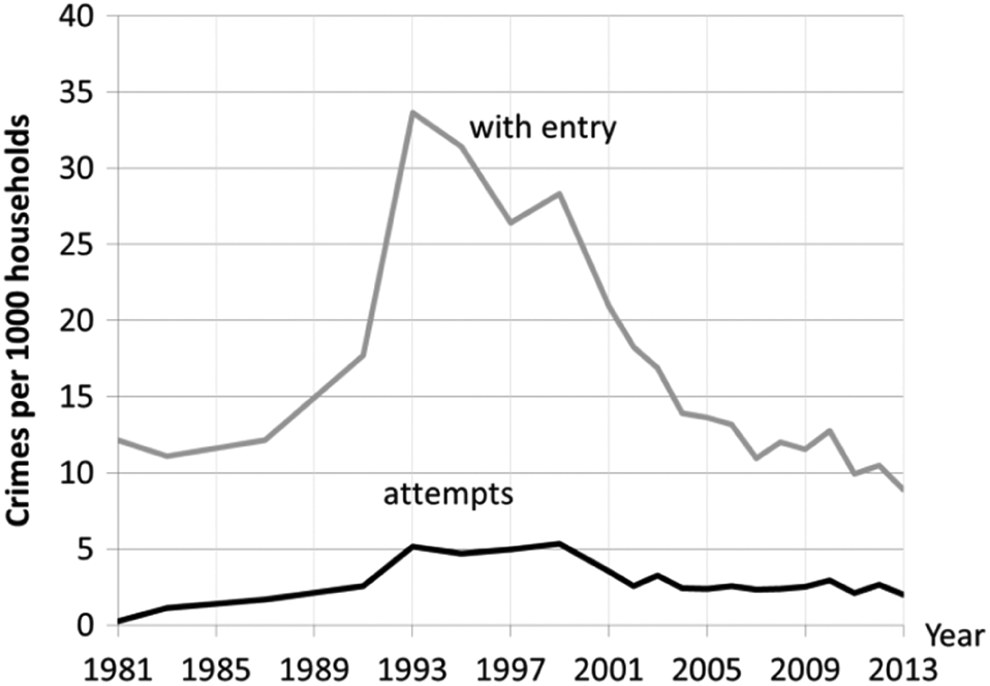
Figure 1 shows incidence rate trends per 1,000 households for all burglary, that is, both types combined. Figure 2 shows burglary in a dwelling and Figure 3 shows burglary in nonconnected buildings. There are proportionally far more attempted burglaries in dwellings than nonconnected buildings. This is probably indicative of better security and higher occupancy (guardianship) of dwellings than nonconnected buildings and perhaps greater underreporting of attempts that may go unnoticed more often for nonconnected buildings. However, in both instances, the basic finding with respect to the trend is similar: attempts peak and plateau between 1993 and the late 1990s (1997 for dwellings and 1999 for nonconnected buildings), whereas completed burglaries decline from a 1993 peak.
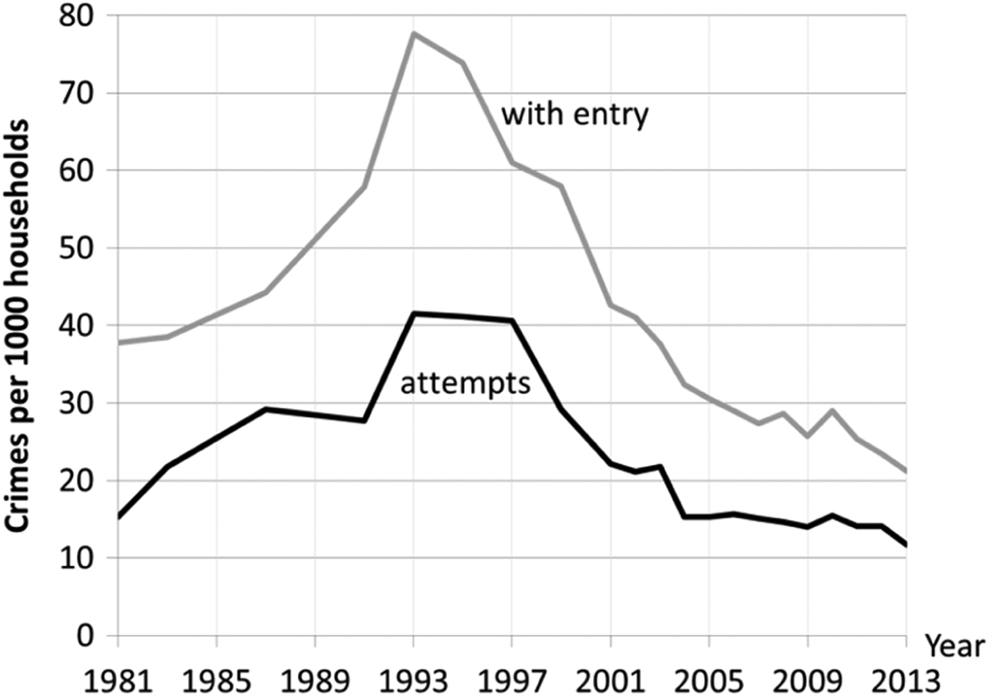
All burglary incidence per 1,000 households.
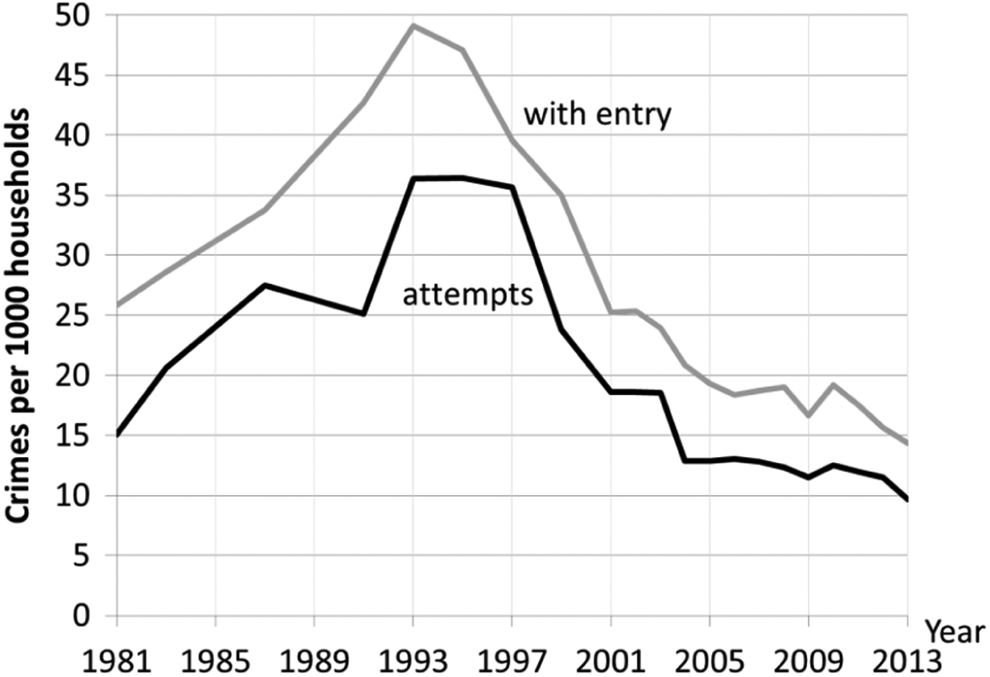
Burglary in a dwelling incidence per 1,000 households.
Burglary in a nonconnected building.
The delayed effect on attempted burglary is most pronounced by 1997. Within the first 4 years of burglary’s decline, the fall in completed burglaries was 10 times greater at 21% than that of attempts which fell by 2.1%. This effect is consistent between the two subtypes of domestic burglary: By 1997, burglary of dwellings with entry fell 19% and attempts by 2%, and burglary of nonconnected buildings fell 22% while attempts increased by 4%.
Vehicle-Related Theft
The CSEW gathers information on two categories of motor vehicle-related theft: theft of vehicles and theft from vehicles. For attempts though, it is not possible to distinguish one from the other: Both leave a visible sign that someone sought to enter the vehicle but the specific motivation (theft of or theft from) cannot be determined. Hence there is only one combined attempts category. Most vehicle-related theft is theft from vehicles, but the trend in both is remarkably similar (Figure 4) and so it is not considered misleading to group them for present purposes and is the appropriate means of comparing them to attempts.
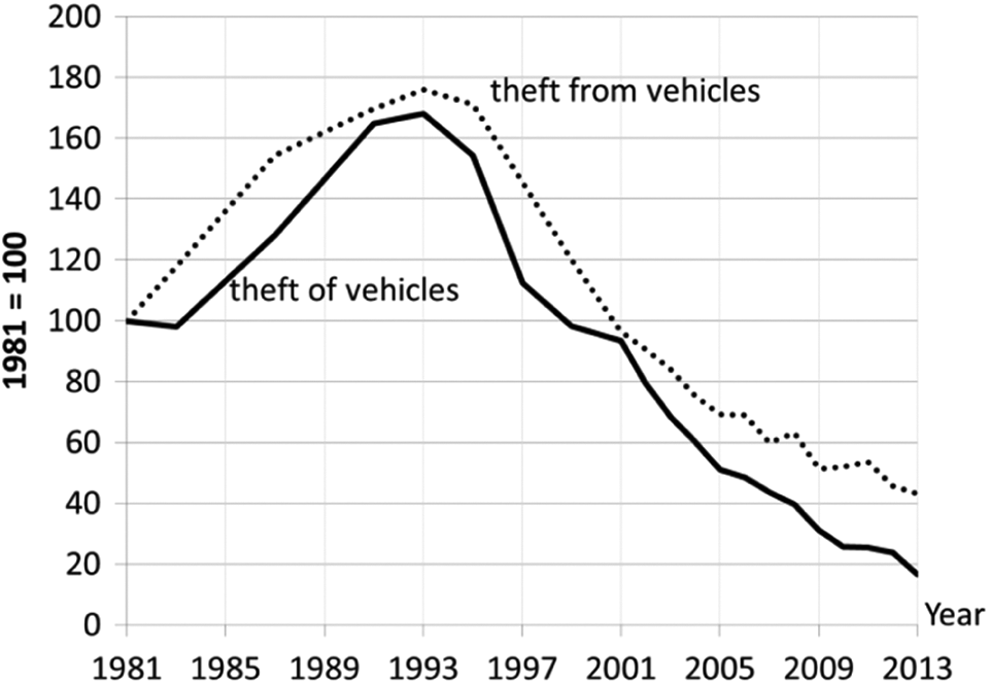
Indexed trends in theft of motor vehicle and theft from motor vehicle.
At first blush, the vehicle-related theft rate trend (Figure 5) appears broadly similar to that of burglary: It peaks in 1993 and then declines. Attempted theft of and from vehicles continues to increase until 2 years later and then declines. Between 1993 and 1995, theft of and from vehicles fell 4% (theft of by 8% and theft from by 3%) while attempts increased 3%. The delay between the fall in completed and attempted crime is most evident in the comparison of the first differences (Figure 6). 1 The first differences clarify that the rate of increase of completed vehicle-related theft was already decelerating by 1987, but attempts did not do so until 1993.
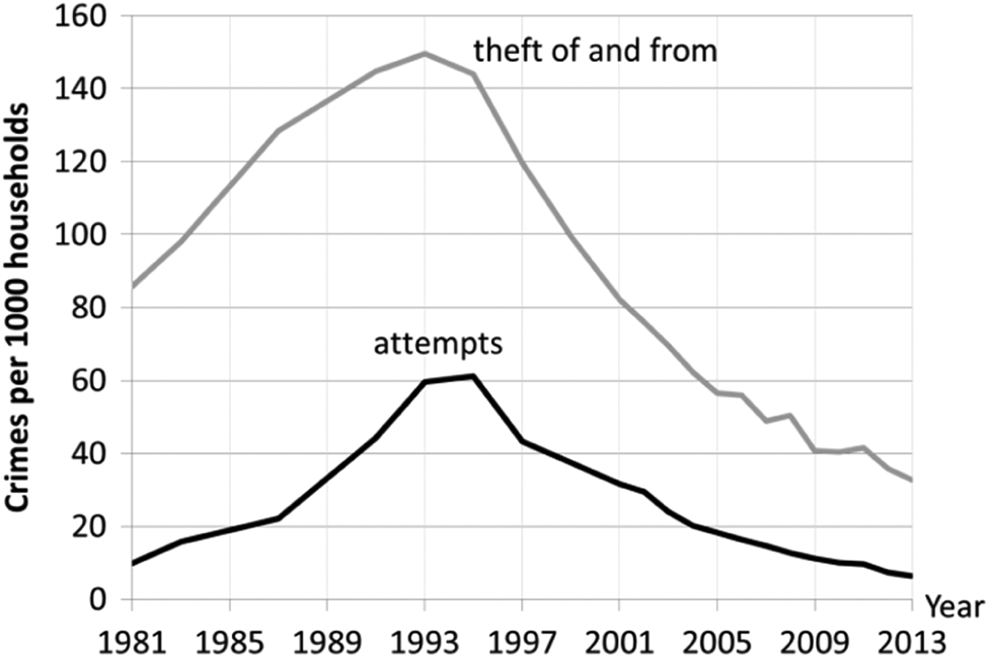
Motor vehicle-related thefts incidence per 1,000 households.
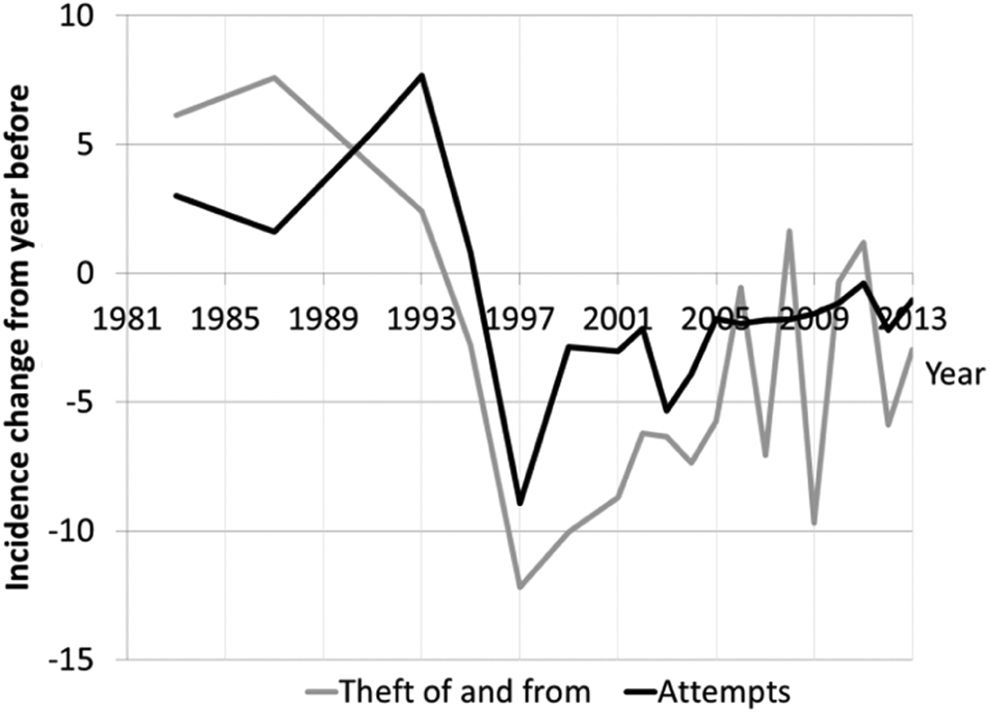
Motor vehicle-related thefts—annual first difference in incidence.
Attempts per 100 Completed Crimes
Another way of cutting the analytic cloth is to look at trends in the number of attempts per 100 completed crimes. Figure 7 shows this for the two burglary subcategories and vehicle-related theft. As might be expected, the proportion of attempted burglary dwellings and vehicle-related thefts peaks in the 1990s, but, reflecting the delay, these peaks come after completed crimes have begun to fall: in 1997 for burglary dwelling and 1995 for vehicle-related thefts. The proportion of attempts then declines over time in each case, somewhat more steadily for motor-vehicle theft. From the peak of 30 attempts per 100 completed motor vehicle-related thefts in 1995, the proportion of attempts had almost halved to 16 by 2013, although this was still well above the 1981 value of 10 attempts per 100 completions.
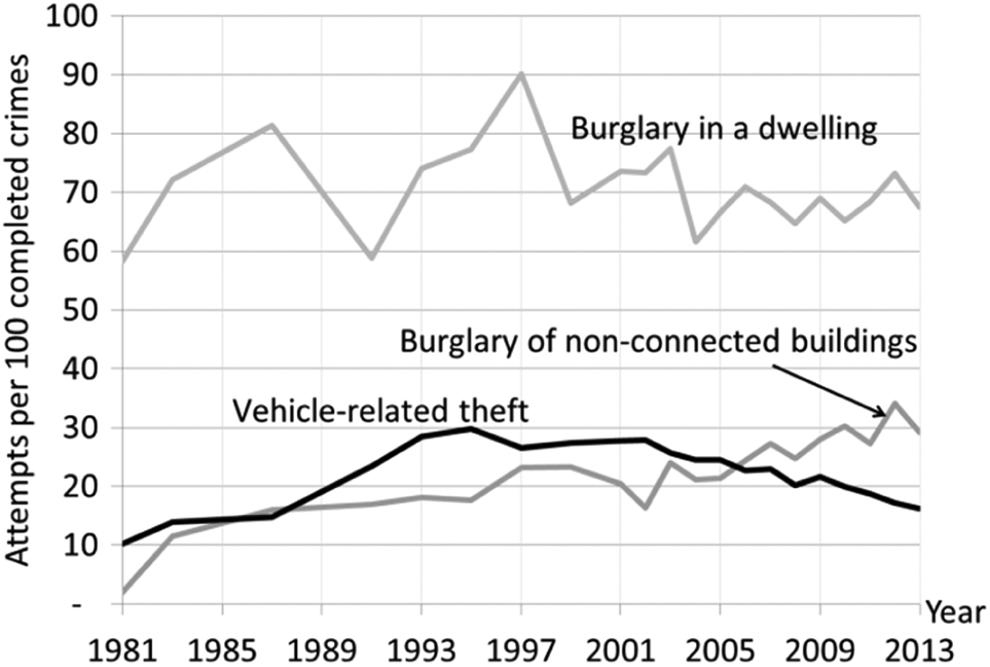
Attempts per 100 completed crimes.
Discussion
The delay between the fall in completions and attempts of between 2 and 4 years suggests distinct patterns of offending behavior and decision making. The delays are consistent with some offenders continuing to attempt crime but being thwarted by improved security. The subsequent fall in attempts is consistent with those offenders giving up, not at their first lack of success but at repeated failure. Thus, the delayed fall in attempted crimes is here interpreted as consistent with both the rational choice theory and the security hypothesis.
Trends in the proportion of attempted crimes (Figure 7) square well with the security hypothesis. The proportion of attempts was lowest when crime was easiest in the 1980s, increasing as crime became more difficult due to increased security in the 1990s. Since then, the declining proportion of attempts reflects offenders learning that crime is more difficult. Less crime is being undertaken by slightly more expert offenders: They are better at choosing suitable targets or gaining entry (being more skilled or better equipped) and fail less often. This interpretation is consistent with the finding of far greater declines in the offending rates of adolescents compared to older more experienced offenders identified for the United States (Farrell et al., 2015).
This paragraph further outlines why the delay is interpreted as consistent with rational choice theory. Individuals make bounded or quasi-rational decisions to offend that appear—to them at the time—to offer greater potential reward than cost. Rewards include psychological and monetary components, while costs include risk, time, and effort as well as any psychological cost such as pangs of conscience (see, e.g., Farrell, 2010). Improved security increases the cost, causing some offenders, particularly novices, to quit. The remainder continue, particularly those who have already determined to continue beyond their initial involvement decision (see Clarke & Cornish, 1985). Thus framed, the aggregate delay in attempts is a form of partial and impermanent displacement and a signature of effective prevention (Barr & Pease, 1990). After subsequent failure, other offenders perceive costs to outweigh likely reward, causing them to also quit whereupon attempts decline. The result is that the fall in the rate of attempts lags behind that of completed crimes.
Conclusion
When the going gets tough, the tough gets going. Fortunately most adolescent offenders are not that tough, even though they disproportionately commit crime compared to other age-groups. The well-established offender age–crime curve suggests many committed only one or a few crimes in adolescence even when crime was at its peak. The delayed fall in attempted property crimes identified here is consistent with many giving up when faced with improved security, while others continued then gave up after further failed attempts. This in turn would leave a much smaller cohort of potential life-course persistent offenders than previously, consistent with recent findings for the United States (Farrell et al., 2015). The offenders who continued to attempt crime may be those who already had a little experience and were less easily deterred, but another possible explanation is that it simply took some time until burglary and car crime began to “fall out of fashion” among teenagers. If so, then “falling out of fashion” is essentially a technique of neutralization that saves face rather than acknowledging that burglary and car crime were more difficult. Thus, contemporary youth may claim to prefer to stay indoors or undertake other activities, but this could also be because the easy crimes opportunities encountered by previous cohorts were never available.
In addition to the security hypothesis, a range of alternate crime drop hypotheses have been proposed. One of the strengths of the triangulation of data signatures is that each signature offers a fresh challenge to each. Rival hypotheses are now required to offer an explanation consistent with a delayed decline in attempted crimes. It is difficult to see how demographic change, changes in policing, imprisonment or illicit drug markets, or other rival hypotheses can account for this delay. Neither can any of them account for the broader range of data signatures identified in Tables 1 and 2, while most are also contradicted by a range of other evidence (Farrell, 2013).
To the extent that there is increasingly strong support for the security hypothesis, there are significant implications for criminological theory and crime policy. It suggests that situational crime prevention is far more important than many commentators realized. If the most major declines in crime experienced in modern history were due to situational factors, then there is a clear case for policy to pursue situational crime prevention far more widely and persistently than it has to date to address the crime types that continue or have increased in recent years.
Footnotes
Declaration of Conflicting Interests
The author declared no potential conflicts of interest with respect to the research, authorship, and/or publication of this article.
Funding
The author(s) disclosed receipt of the following financial support for the research, authorship, and/or publication of this article: The author acknowledges the contribution of grants RES-000-22-2386, ES/K003771/1, ES/K003771/2 and ES/L014971/1 from the Economic and Social Research Council.